Embed Size (px)
Citation preview
195
Journal of Forensic & Investigative Accounting Vol. 2, Issue 2
Changes in Litigation Risk: An Analysis of Post-Sarbanes Oxley Audit Portfolios
Jerry L. Turner*
The possibility of litigation is one of the many serious risks facing independent audit
firms, both in the U.S. and internationally. The objective of this study is to examine the relative
litigation risk of audit client portfolios of U.S. audit clients and to determine if the largest audit
firms, known as the Big 4,1 have reduced that risk since the passage of The Sarbanes-Oxley Act
of 2002 (SarbOx 2002). The audit client portfolios of the two largest non-Big 4 audit firms2 also
are examined to determine if their audit client portfolios display a change in litigation risk,
reflecting either movement of riskier clients from the large firms to the smaller firms or a change
in the level of risk acceptable to those smaller firms.
This question is important since, as was the case over a decade ago, independent auditors
again are seeking regulatory relief to limit court damages that investors and others can seek for
flawed audits of public companies. Their argument is being championed by an influential group
recently formed to study the competitiveness of U.S. financial markets with the encouragement
of Treasury Secretary Henry Paulson. The group is expected to recommend that the government
enact new protections for auditors. A panel set up within the U.S. Chamber of Commerce is
sounding a similar theme (U.S. Chamber of Commerce 2006). In Europe, the European
* The author is Professor of Accountancy at the University of Memphis. 1 The Big 4 firms are Deloitte Touche Tohmatsu (referred to hereafter as DT), Ernst & Young
(EY), KPMG, and PricewaterhouseCoopers (PWC). 2 Second-tier audit firms are BDO Seidman (BDO) and Grant Thornton (GT).
196
Commission is studying the issue and is likely to recommend limitations on the damages
auditing firms can face (Reilly 2006a).
The CEOs of the six largest audit firms (the Big 4 plus BDO International and Grant
Thornton International) also are requesting changes in the litigation environment. At the Global
Public Policy Symposium in Paris in November 2006, the CEOs presented a policy paper,
“Global Capital Markets and the Global Economy: a Vision from the CEOs of the International
Audit Networks” (CEOs 2006). The heads of the accounting firms also used the policy paper to
argue that, while emphasizing measures to protect investors, any changes to improve the
functioning of global capital markets need to limit the liability audit firms face, both from
criminal prosecution and civil litigation.
The desire for regulatory relief certainly can be understood. Despite the passage of the
Private Securities Litigation Reform Act (PSLRA) of 1995, over the past decade the number and
size of lawsuits against auditors has increased significantly. In the past three years, KPMG has
agreed to pay out over $700 million in fines and settlements related to criminal and civil actions.
In 2000, EY settled a shareholder suit related to its work for Cendant Corp. for $335 million. A
study for the European Commission, released in September 2006, said the total costs of
judgments, settlements, legal fees and related expenses for the U.S. audit practices of the Big 4
audit firms had risen to $1.3 billion in 2004, or 14.2% of revenue, up from 7.7% in 1999. In
addition, a separate study released by an insurance company identified 20 claims outstanding
against U.S. auditors as of September 2005 where damages sought or estimated losses topped $1
billion (Reilly 2006a). In 2005, each of the Big 4 firms had significant claims in excess of its
capital (The American Assembly 2005, 16) and the level of claims is expected to increase as a
result of the rapid collapse of seemingly sound financial institutions in 2008. As noted by Jeff
197
Mahoney, general counsel for the Council of Institutional Investors, “It is a given that they will
be named in lawsuits” (Whitehouse 2008). A precursor to the anticipated lawsuits is seen in a
$97.5 million settlement by PWC related to the audit of American International Group (AIG) in
October 2008 (Grant 2008). Also in 2008, KPMG and GT were named as defendants in a lawsuit
related to audits of Countrywide Financial Corporation, a major mortgage lender (Mildenberg
and Freifeld 2008).
The turmoil within the audit profession in the last five years has created both increased
risks and increased opportunities to manage those risks. The failure of Arthur Andersen
(Andersen), one of the largest auditing firms in the world, resulted in over 2,000 public audit
clients selecting new auditors. According to the Government Accountability Office’s July 2003
Mandated Study on Consolidation and Competition (GAO 2003), 87 percent of the companies
formerly audited by Andersen switched to a Big 4 auditor with the remaining 13 percent
primarily selecting one of two next-tier audit firms. A July 2006 research report said 4,000
companies, about a third of all U.S. public companies, switched auditors in the period from 2003
to 2005. "The biggest beneficiaries of this trend have been non-Big Four accounting firms, which
have picked up the bulk of the companies changing auditors," the research company said (Reilly
2006b).
Concurrent with this major increase in Big 4 audit portfolios, passage of the Sarbanes-
Oxley Act of 2002 (SarbOx) created a substantial increase in the workload for all auditors of
public companies by requiring an extensive new report on internal controls, i.e., the Section 404
report. The sudden influx of new audit clients and addition of the new required report
overburdened the ability of the large firms to staff existing engagements. As a result, each of the
Big 4 has been evaluating its portfolio of audit clients with a more critical eye and declining to
198
stand for re-election as independent auditor for those clients deemed to be either unacceptably
risky or less profitable. The clients effectively fired by the Big 4 have been forced by necessity to
engage a smaller audit firm (The American Assembly 2005).
Auditors also may be requiring retained clients to reduce the risk of litigation. The
confluence of both internal and external pressures on audit firms may have resulted in auditors
being less willing to accept overly aggressive reporting and more willing to identify financially
distressed companies. Geiger et al. (2005), for example, find that after 2001, an increase in
going-concern report modifications for bankrupt companies was due to auditors deciding to issue
more such opinions rather than from changes in client characteristics. All of these factors have
presented a potential opportunity to rebalance audit firm client portfolios to reduce overall
litigation risk.
This paper contributes to the literature on auditor litigation risk in two important ways.
First, it examines a time period not previously examined and during which there were numerous
frauds revealed and numerous large lawsuits filed. Following the Enron, Worldcom and
HealthSouth frauds, there was a heightened level of scrutiny of public companies, Andersen
failed, and there was a substantial realignment of audit clients among the remaining firms.
Examination of how auditors and their clients responded to the heightened scrutiny and increased
risk is important to our understanding of the audit profession. Second, because no one surrogate
for litigation risk has emerged as being the best indicator, this paper uses three different
measures to compare audit client portfolios—measures of earnings management by clients, risk
of restatement of previously issued financial statements, and degree of client financial distress.
Results show that as hypothesized, litigation risk in 2002 was higher for the two non-Big
4 firms examined, BDO and GT, than for the Big 4 audit firms. In examining changes in
199
litigation risk over time, all three surrogate measures indicate litigation risk was lower in 2005
than in 2002. However, the reduction in risk was not significant for all audit firms across all
three measures. When results for all three measures are considered in combination, it appears
that there is sufficient support to conclude that the audit portfolios of all firms examined except
BDO were significantly lower in 2005 than in 2002. Finally, combined results of the three
measures indicate that the litigation risk for BDO remained higher in 2005 than any of the Big 4
audit firms. Results for GT were less certain, so no conclusion is drawn for that firm. These
results appear to be consistent with the results of Landsman et al. (2009), who find that Big N
auditors rebalanced their audit client portfolios in response to post-Enron capacity constraints
arising from the supply of former Arthur Andersen clients and the audit demands imposed by
Sarbanes-Oxley rather than increasing their sensitivity to client risk.
In the next section, results of prior research are highlighted and hypotheses are
developed. This is followed by a discussion of the three models used as surrogates for litigation
risk. Empirical results for each model then are presented, followed by a comparison of results
and conclusions in regard to hypotheses. The final section summarizes the results.
PRIOR RESEARCH AND DEVELOPMENT OF HYPOTHESES
Although there has been considerable research on the changes in litigation liability
pressure on auditors over the years (e.g., Kothari et al. 1988; Lys 1993; Lys and Watts 1994),
only a few prior studies directly investigate the link between the riskiness of audit firm clienteles
and changes in litigation risk and none have examined the post-2002 period. Jones and
Raghunandan (1998) find that the likelihood of large auditors serving small manufacturing firms
was lower in 1994 than in 1987, a result they interpret as being consistent with increasing
litigation pressure making larger auditors more cautious in accepting risky clients. Francis and

200
Reynolds (2000) examine large audit firm clienteles during 1976-96 and find no consistent
evidence that Big 6 firms implemented stricter screening criteria (that is, were associated with
less risky clients) during the post-1990 period. Choi et al. (2004) extend Jones and Raghunandan
(1998) by examining a larger sample of audit clients over a longer window and using multiple
risk measures in addition to industry membership. They find some evidence of risk decreases
during 1985-1989, strong evidence of risk decreases during 1990-1994, and strong evidence of
risk increases during 1995-1999.
Hypotheses
As suggested by Simunic and Stein (1980), audit firms must compete for clients through
a bidding process and must consider accepting clients with differing levels of risk. Of the
population of available audit clients, each audit firm is able to obtain only some of the lower risk
clients. This results in each firm having a portfolio of audit clients with degrees of assessed
engagement risk ranging from lower to higher, but with all below an established threshold of
acceptable risk-to-return ratio for the individual audit firm.
The demise of Andersen created an intense competition for its clients, as Andersen’s
overall client portfolio likely was similar in risk to that of the remaining Big 4 (e.g., see Turner
and Sennetti 2001). However, as noted previously, the Big 4 acquired only 87 percent of
Andersen’s clients. The remaining 13 percent may not have been acquired either because smaller
audit firms were acceptable and made lower bids or because the Big 4 elected to not pursue those
companies because of perceived risk, lack of sufficient audit staff, or other reasons. The
possibility of the Big 4 “cherry-picking” from Andersen’s client portfolio could be exhibited in
an immediate lowering of overall engagement risk for each of the Big 4. The impact on the
second-tier audit firms that acquired the remaining 13 percent is less predictable in terms of
201
average. By several measures, second-tier firms are seen to have overall audit portfolios with
higher overall risk (e.g., see Francis and Reynolds 2000; Turner and Sennetti 2001).
Even after realignment of audit portfolios following Andersen’s demise, political
pressure and fear of litigation may have affected the risk tolerance both of auditors and of
management of their clients as passage of SarbOx placed new or increased existing legal
exposures on each (Commission 2003). In addition to increased requirements related to
independence, both auditors and management began to be required to issue separate reports on
internal controls over financial reporting. When faced with substantially increased workloads and
increased external risks, the Big 4 had incentive to rebalance their audit client portfolios further
to achieve a lower overall risk. If indeed they did so by electing to not continue with higher risk
clients, those rejected clients may have been forced to hire non-Big 4 audit firms, thus either
maintaining or increasing the overall risk of the smaller audit firm portfolios. Auditors also may
have attempted to reduce external risk by becoming less tolerant of aggressive accounting
policies used by the retained clients. Similarly, audit client management may have reduced their
own risk by opting to use less aggressive accounting policies.
The realignment of audit clients may have allowed Big 4 audit firms to be more selective
about the clients they chose to accept or retain and litigation risk likely was an important factor
in that decision (e.g., see Bell et al. 2002). Those clients not retained by a Big 4 firm selected
second-tier audit firms (GAO 2003). If those clients not retained by a Big 4 firm were riskier on
average, then it is likely that the audit portfolios for the non-Big 4 audit firms had an initial
litigation risk greater than that of the Big 4 firms. This likelihood results in the first hypothesis:
H1: Litigation risk of second-tier (non-Big 4) audit firms was greater in 2002 than litigation risk for the Big 4 audit firms.
202
While the internal processes involved in reducing engagement risk can’t be observed, the
end result of less aggressive financial reporting policies and/or increased auditor pressure can be
seen in the audited financial statements. Given that both Big 4 auditors and their audit client
management should make rational decisions to control increased risks, the second hypothesis
tested will be:
H2: Litigation risk of the Big 4 audit firms was lower for fiscal year 2005 than litigation risk for those firms for fiscal year 2002
While the litigation risk of the non-Big 4 firms initially may have been greater than that
of the Big 4 firms as hypothesized in H2, the non-Big 4 were impacted by the same external
pressures as the Big 4. Therefore, in a period of heightened scrutiny and increased litigation, it
would be rational for the non-Big 4 and their audit clients to reduce the risk of litigation if
possible. This leads to the third hypothesis:
H3: Litigation risk of audit clients of second-tier audit firms was lower for fiscal year 2005 than for fiscal year 2002
Finally, while both the Big 4 and non-Big 4 audit portfolios likely exhibit lower litigation
risk in 2005 than in 2002, it is possible that the clients of the non-Big 4 remained as being
riskier. For example, Turner and Sennetti (2001) find the non-Big 4 exhibiting a consistently and
significantly higher risk of restatement over the period from 1988 to 1995. Thus, the fourth
hypothesis:
H4: Litigation risk of clients of the Big 4 audit firms was lower for fiscal year 2005 than litigation risk of clients of the second-tier audit firms for the same year.
METHODOLOGY
Despite the financial and reputational exposure to an audit firm due to potential litigation,
to date no single reliable measure of litigation risk has been developed. Prior literature, however,
has identified certain surrogates that appear strongly correlated to litigation. Among those
203
surrogates are the degree of earnings management, the risk of restatement of published financial
statements, and the degree of financial distress exhibited by the audit client. To test the proposed
hypotheses, litigation risk as measured by each of these surrogates will be evaluated.
Earnings management
Within a portfolio of accepted clients, some clients may be more inclined than others to
engage in earnings management. As noted by the Panel on Audit Effectiveness, the term earnings
management represents a wide continuum of activities ranging from legitimate managerial
activities at one end to fraudulent financial reporting at the other (POB 2000, ¶ 3.13). Included
between the two endpoints are various accruals necessary to comply with generally accepted
accounting principles. While some accruals result from timing or other non-discretionary
reasons, other accruals often involve a substantial degree of management discretion. Depending
on perceived pressures and/or incentives, management may apply that discretion conservatively
or aggressively. Lobo and Zhou (2006), for example, conclude that immediately following the
passage of SarbOx, management of public companies exhibited greater conservatism and
reported lower discretionary accruals. Similarly, Krishnan (2007) examines whether earnings
conservatism increased for Andersen audit clients that had to switch to Big 4 auditors. He finds
that their earnings conservatism increased from the last year with Andersen and was more
conservative than companies that did not switch auditors. Neither Lobo and Zhou nor Krishnan,
however, examine the persistence of that increased conservatism, nor do they investigate the
auditor side of the financial reporting process.
Aggressive accounting policies can be related to the auditor’s litigation risk. Heninger
(2001) provides evidence that auditors are more likely to be sued when their clients have
discretionary accruals that are income-increasing. DuCharme et al. (2004) find the incidence of
204
lawsuits involving stock offers and settlement amounts are significantly and positively related to
abnormal (discretionary) accruals around the time of the offer. Further, DeFond and
Subramanyam (1998) suggest that litigation risk can motivate auditors to prefer income-reducing
accounting choices. They refer to this preference as auditor conservatism and show that
discretionary accruals are lower when litigation risk is perceived to be high. Consistent with
these findings, in an archival study of three large audit firms, Manry et al. (2007) find that higher
discretionary accruals are associated with clients considered to have a higher auditor-assigned
pre-audit level of engagement risk, which includes litigation risk. Based on this research and
consistent with Lee and Mande (2002), estimated discretionary accruals are used as one proxy
for litigation risk.
Total accruals and the subcomponent discretionary accruals are not separately observable
from other balances included in the audited financial statements. As a result, many recent studies
estimate post-audit discretionary accruals using a cross-sectional model based on Jones (1991),
DeFond and Jiambalvo (1994), and Dechow et al. (1995), with definitions of earnings and cash
flows used by Subramanyam (1996) and Xie (2001).
In the Jones (1991) model, discretionary accruals (DAs) for each company in industry j
are defined as the residual from the regression of total accruals (the difference between cash
from operations and net income) on two factors that explain nondiscretionary accruals, the
change in revenue and the level of fixed assets subject to depreciation. All variables are deflated
by total opening assets to reduce heteroscedasticity.
ijt 0 ijt-1 1 ijt ijt-1 2 ijt ijt-1ACC = α 1/TA + α ΔREV /TA + α PPE /TA + ε (1)
where: ACCijt = Total accruals in year t, deflated by TAijt-1;
TAijt-1 = Total assets at the end of year t-1
ΔREV = Change in revenue between years t-1 and t
205
PPEijt = Gross property, plant and equipment in year t
ε = Estimated discretionary accruals (DAs)
A separate portfolio of public clients is formed from the complete set of public
companies on Compustat with fiscal year-ends between 2002 and 2005 and audited either by one
of the Big 4 audit firms or one of the two largest second-tier audit firms. Eliminations from the
complete set are described below. Discretionary accruals then are estimated for each audit client
in each portfolio using (1), above. Within each portfolio, the mean estimated discretionary
accruals are determined for each audit firm portfolio. Higher values of estimated discretional
accruals proxy for greater litigation risk.
Risk of Restatement Due To Error
Another source of litigation risk results from restatement of published financial
statements due to error. As noted by Whalen (2004), a restatement is “a public admission and
correction of non-GAAP earnings reports” and may lead to economic losses to stakeholders. The
extent of such losses was estimated by a former SEC Chairman testifying before a Senate
Subcommittee in 2000. In his testimony, he said, “in recent years, countless investors have
suffered significant losses as market capitalizations have dropped by billions of dollars due to
restatements of audited financial statements” (Levitt 2000).
In studying restatements, Palmrose and Scholz (2004) examine the association of certain
restatements and company characteristics with the likelihood of litigation against companies,
management, boards of directors, outside auditors and others for a sample of 492 companies that
announced restatements from 1995 to 1999. They find that companies with core restatements,
driven primarily by revenue misstatements, have more negative security price reactions to
restatement announcements, and more negative security price changes over the six months
206
preceding and following restatement announcements. They conclude there is a significant
association between the restatement of financial statements and litigation.
While no predictive model of future restatements exists, Turner and Sennetti (2001) use
ex ante, uncorrected audited financial reports to identify specific financial characteristics of
companies that subsequently restated due to an error. From that data set, they generate a
parsimonious model to estimate comparative restatement risk. The resulting model is applied for
an eight year period (1988-1995) to individual audit client portfolios for Big 6 (B6) audit firms
and to a composite portfolio of Non-Big 6 (NB6) audit firms to identify the mean relative
restatement risk for each. They find for the years examined not only did a smaller percentage of
B6 audit clients restate, but B6 audit clients were less likely to restate, i.e., had lower mean
relative restatement risk than did NB6 clients. Further, no difference in this risk is found among
portfolios of the B6.
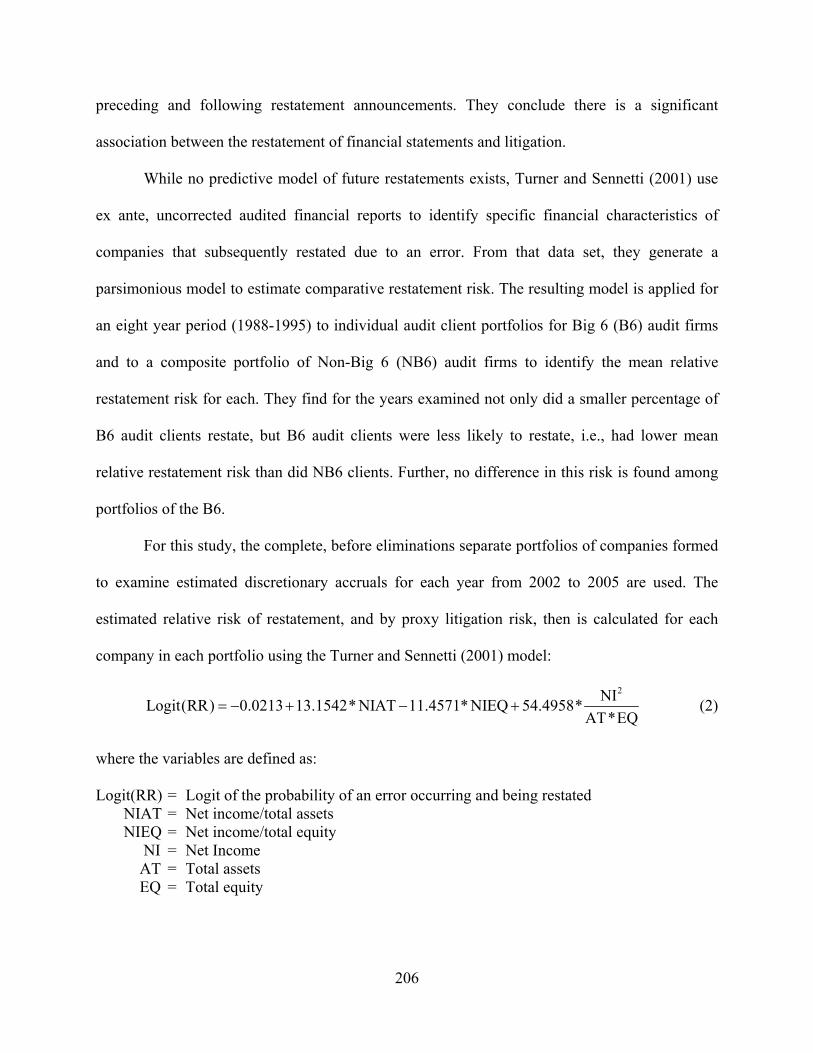
For this study, the complete, before eliminations separate portfolios of companies formed
to examine estimated discretionary accruals for each year from 2002 to 2005 are used. The
estimated relative risk of restatement, and by proxy litigation risk, then is calculated for each
company in each portfolio using the Turner and Sennetti (2001) model:
2NI
Logit(RR) 0.0213 13.1542* NIAT 11.4571* NIEQ 54.4958*AT*EQ
(2)
where the variables are defined as: Logit(RR) = Logit of the probability of an error occurring and being restated NIAT = Net income/total assets NIEQ = Net income/total equity NI = Net Income AT = Total assets EQ = Total equity
207
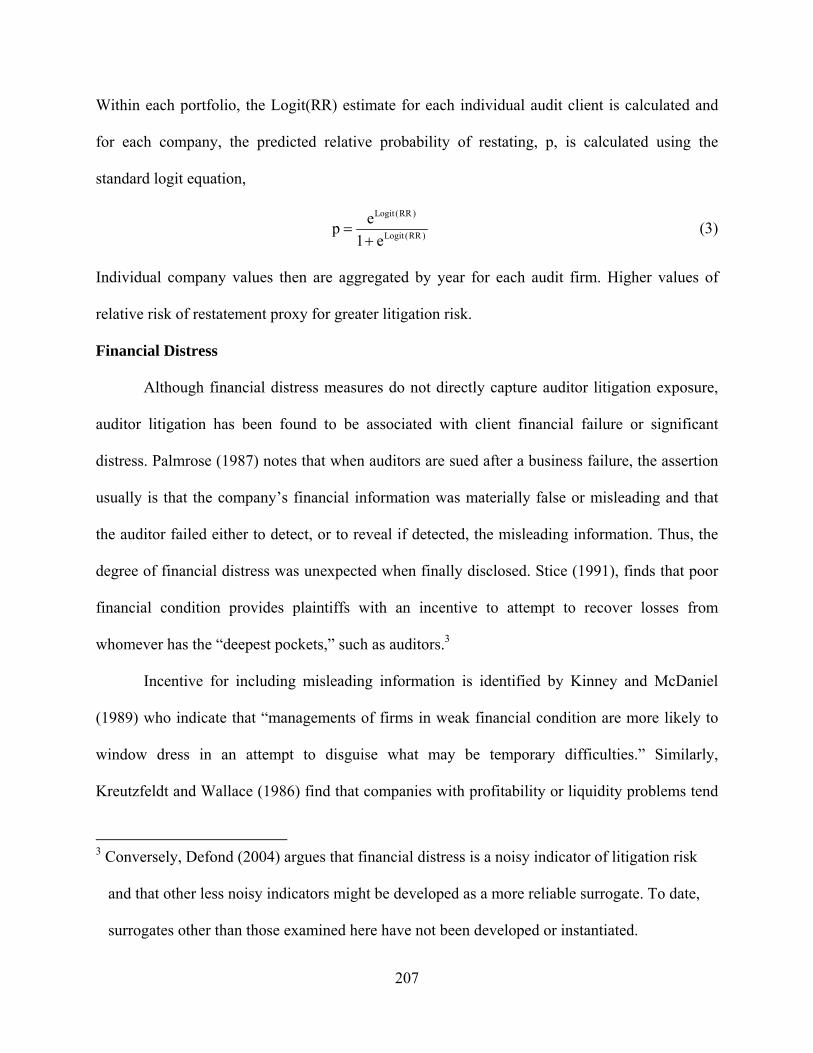
Within each portfolio, the Logit(RR) estimate for each individual audit client is calculated and
for each company, the predicted relative probability of restating, p, is calculated using the
standard logit equation,
Logit (RR )
Logit (RR )
ep
1 e
(3)
Individual company values then are aggregated by year for each audit firm. Higher values of
relative risk of restatement proxy for greater litigation risk.
Financial Distress
Although financial distress measures do not directly capture auditor litigation exposure,
auditor litigation has been found to be associated with client financial failure or significant
distress. Palmrose (1987) notes that when auditors are sued after a business failure, the assertion
usually is that the company’s financial information was materially false or misleading and that
the auditor failed either to detect, or to reveal if detected, the misleading information. Thus, the
degree of financial distress was unexpected when finally disclosed. Stice (1991), finds that poor
financial condition provides plaintiffs with an incentive to attempt to recover losses from
whomever has the “deepest pockets,” such as auditors.3
Incentive for including misleading information is identified by Kinney and McDaniel
(1989) who indicate that “managements of firms in weak financial condition are more likely to
window dress in an attempt to disguise what may be temporary difficulties.” Similarly,
Kreutzfeldt and Wallace (1986) find that companies with profitability or liquidity problems tend
3 Conversely, Defond (2004) argues that financial distress is a noisy indicator of litigation risk
and that other less noisy indicators might be developed as a more reliable surrogate. To date,
surrogates other than those examined here have not been developed or instantiated.
208
to have significantly more financial statement errors than do companies not exhibiting signs of
financial distress.
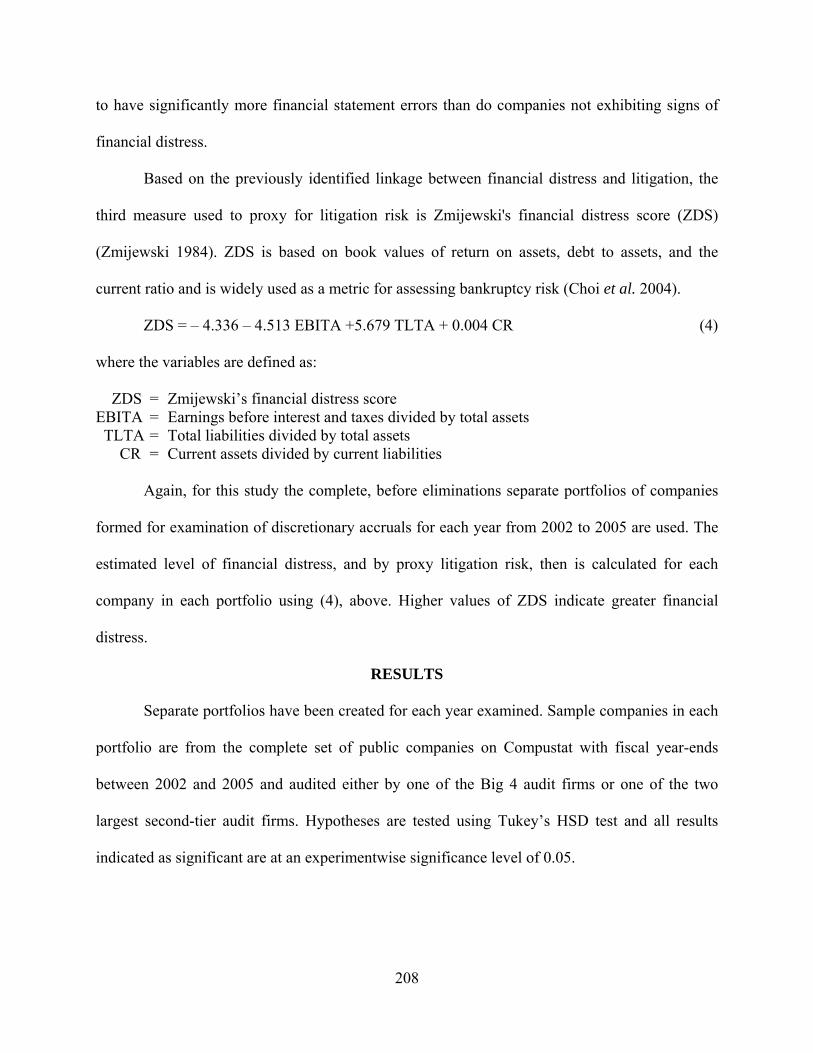
Based on the previously identified linkage between financial distress and litigation, the
third measure used to proxy for litigation risk is Zmijewski's financial distress score (ZDS)
(Zmijewski 1984). ZDS is based on book values of return on assets, debt to assets, and the
current ratio and is widely used as a metric for assessing bankruptcy risk (Choi et al. 2004).
ZDS = – 4.336 – 4.513 EBITA +5.679 TLTA + 0.004 CR (4) where the variables are defined as: ZDS = Zmijewski’s financial distress score EBITA = Earnings before interest and taxes divided by total assets TLTA = Total liabilities divided by total assets CR = Current assets divided by current liabilities
Again, for this study the complete, before eliminations separate portfolios of companies
formed for examination of discretionary accruals for each year from 2002 to 2005 are used. The
estimated level of financial distress, and by proxy litigation risk, then is calculated for each
company in each portfolio using (4), above. Higher values of ZDS indicate greater financial
distress.
RESULTS
Separate portfolios have been created for each year examined. Sample companies in each
portfolio are from the complete set of public companies on Compustat with fiscal year-ends
between 2002 and 2005 and audited either by one of the Big 4 audit firms or one of the two
largest second-tier audit firms. Hypotheses are tested using Tukey’s HSD test and all results
indicated as significant are at an experimentwise significance level of 0.05.
209
Earnings Management as a Surrogate for Litigation Risk
To estimate discretionary accruals (referred to hereafter as DAs), the Jones (1991) model
requires estimation of a cross-sectional regression for each industry (two-digit SIC codes), so
industries including fewer than ten firms are eliminated. Companies from the financial (SIC 6000
to 6900) sector, and the government (SIC 9900) sector also have been eliminated because their
special accounting practices make generalizations problematic. Consistent with Subramanyam
(1996), companies have been deleted where operating cash flows, DAs, or non-DAs are more
than three standard deviations from their respective means.
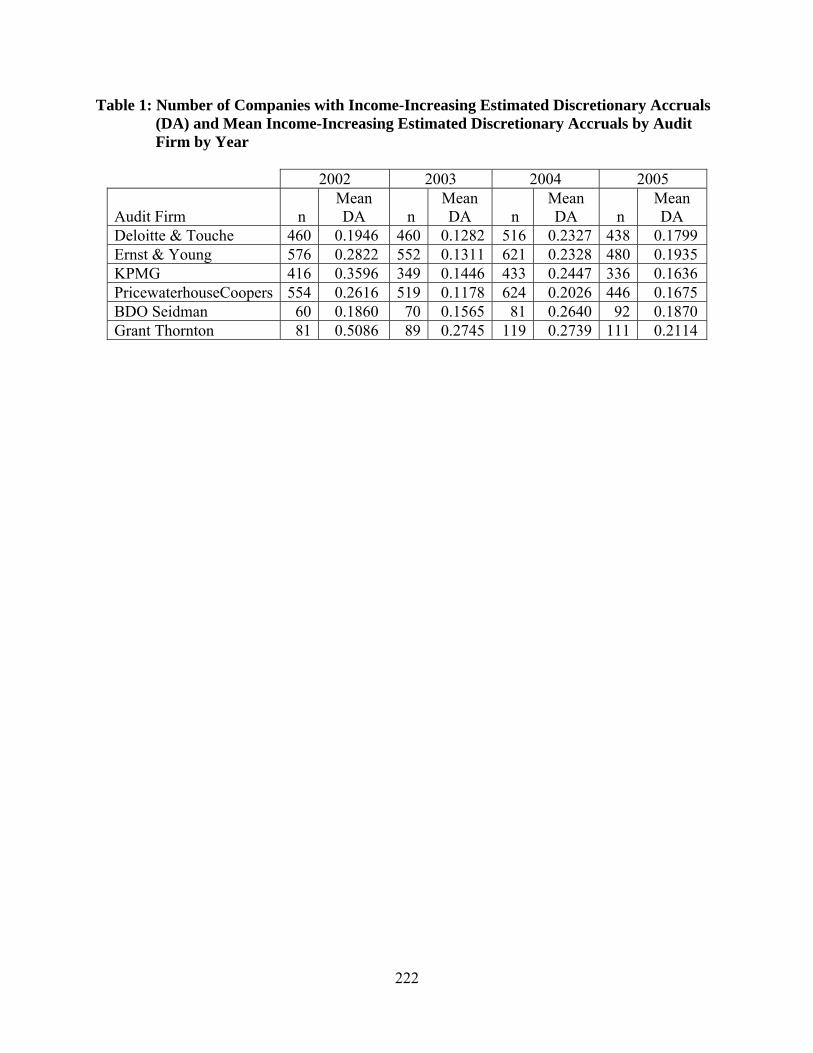
As both DeFond and Subramanyam (1998) and Heninger (2001) find a relationship
between income-increasing accruals and litigation risk, only income-increasing DAs are
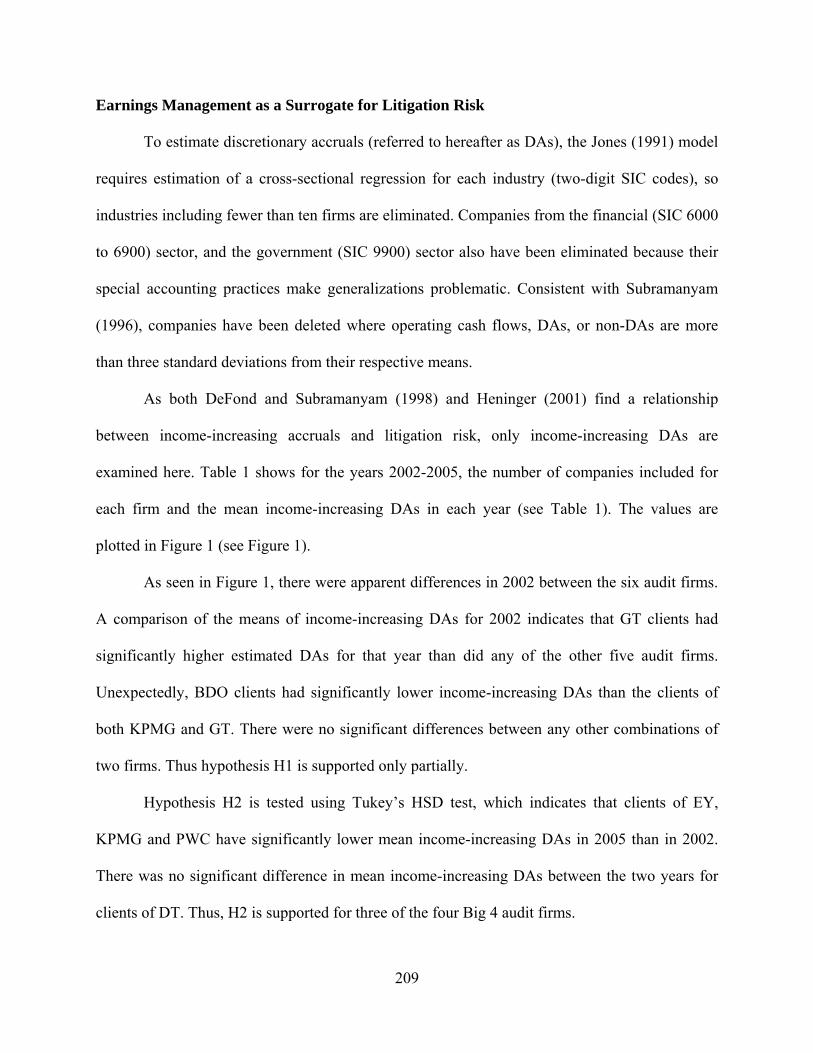
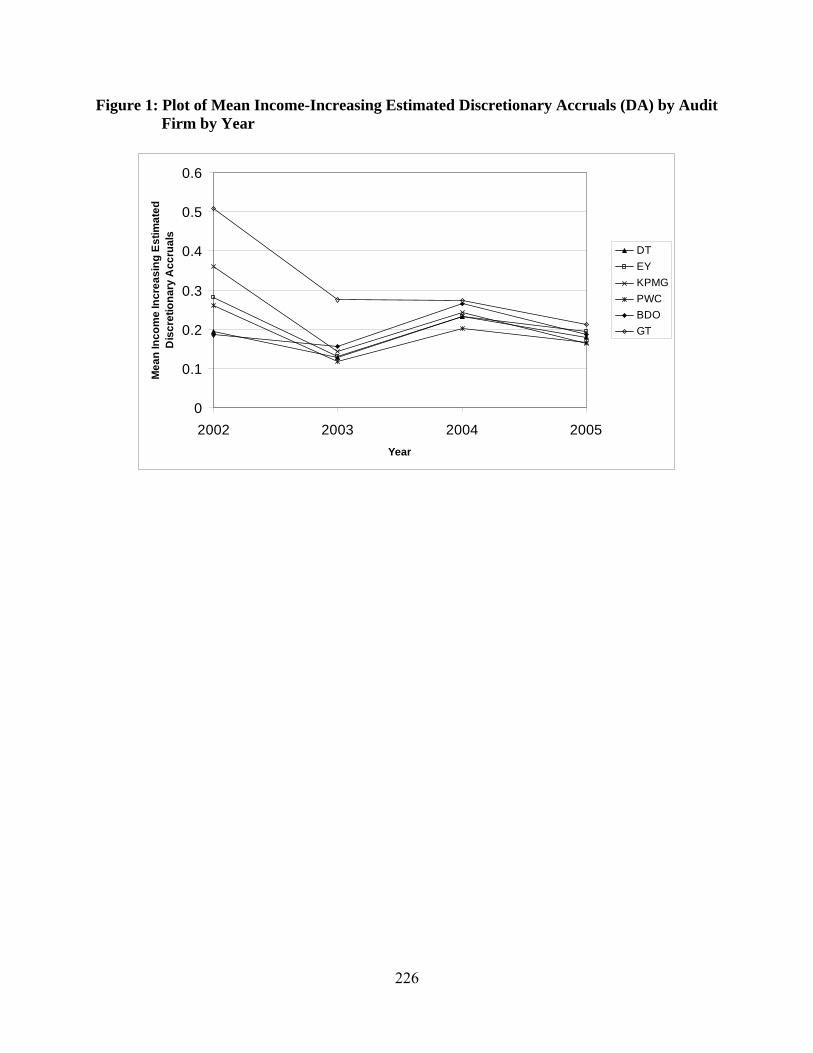
examined here. Table 1 shows for the years 2002-2005, the number of companies included for
each firm and the mean income-increasing DAs in each year (see Table 1). The values are
plotted in Figure 1 (see Figure 1).
As seen in Figure 1, there were apparent differences in 2002 between the six audit firms.
A comparison of the means of income-increasing DAs for 2002 indicates that GT clients had
significantly higher estimated DAs for that year than did any of the other five audit firms.
Unexpectedly, BDO clients had significantly lower income-increasing DAs than the clients of
both KPMG and GT. There were no significant differences between any other combinations of
two firms. Thus hypothesis H1 is supported only partially.
Hypothesis H2 is tested using Tukey’s HSD test, which indicates that clients of EY,
KPMG and PWC have significantly lower mean income-increasing DAs in 2005 than in 2002.
There was no significant difference in mean income-increasing DAs between the two years for
clients of DT. Thus, H2 is supported for three of the four Big 4 audit firms.
210
For hypothesis H3, Tukey’s HSD results indicate that GT clients exhibit a significantly
lower level of mean income-increasing DAs for 2005 than in 2002, while the difference for BDO
is not significant. Thus, H3 is supported for only one of the two non-Big 4 firms.
Hypothesis H4, which compares the Big 4 to the two non-Big 4 find no significant
differences between any of the six firms examined. Thus, using estimated discretionary accruals
as a surrogate for litigation risk, the non-Big 4 is not found to have an overall greater risk of
litigation than the corresponding risk for Big 4 firms and H4 is not supported.
Additional tests of the four hypotheses, not reported in detail here, use absolute values of
the estimated discretionary accruals instead of only those that were income increasing. This
results in a larger sample for each audit firm and accounts for transitory values of accruals that
may reverse from year to year. Comparison of mean absolute values of estimated DAs find
exactly the same results for all four hypotheses as those comparisons using income increasing
DAs alone reported above.
Restatement Risk as a Surrogate for Litigation Risk
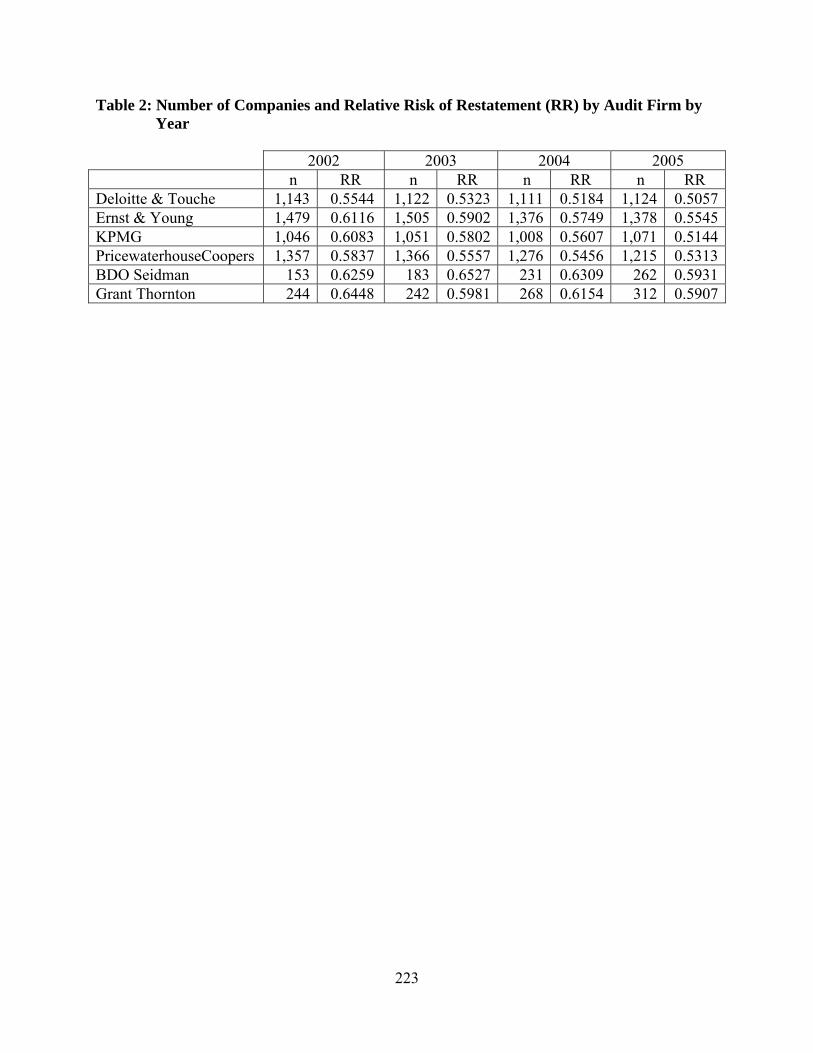
The Turner and Sennetti (2001) model offers three advantages over estimated
discretionary accruals using the Jones (1991) model. First, the Turner and Sennetti model is not
sensitive to industry so the financial (SIC 6000 to 6900) sector can be included. Second, the
model can estimate the relative rate of restatement regardless of whether a company reported net
income or net loss. These two advantages result in a substantially greater population of
companies that can be examined. Third, the model is intended to estimate the relative risk of
restatement for a given period, thereby allowing comparisons both between audit firms in a
particular period, and also over time (see Table 2).
211
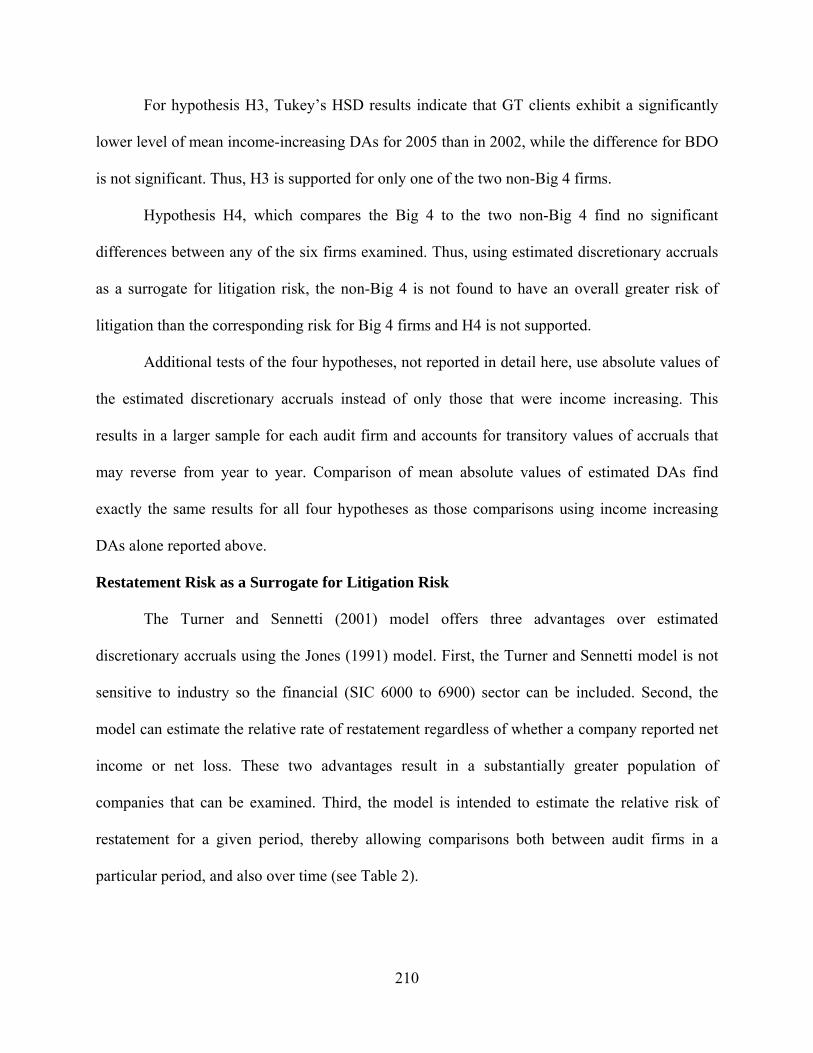
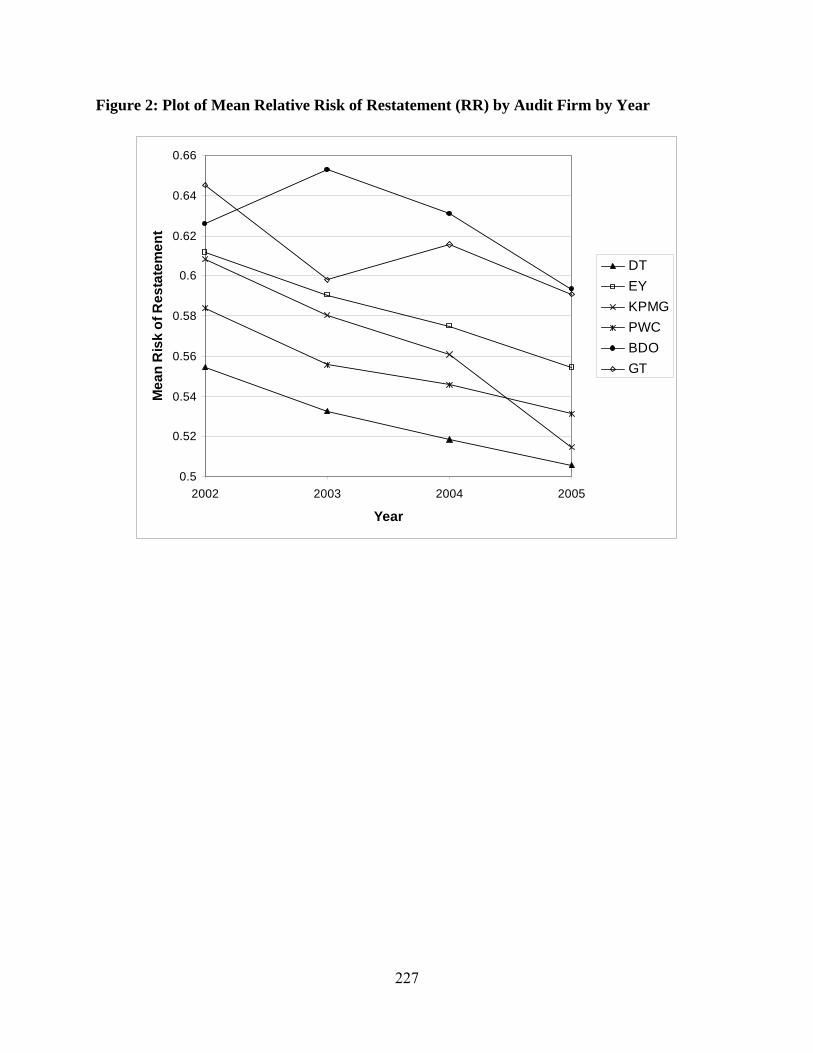
As shown in Figure 2, there were clear differences in relative mean risk of restatement in
2002 (see Figure 2). The mean risk of restatement for GT was significantly higher than that of
any of the Big 4 audit firms while the mean risk of restatement for BDO was significantly higher
than that of DT and PWC. These results provide strong, but not absolute support for H1.
Between 2002 and 2005 the mean risk of restatement declined for all of the Big 4 firms.
Tukey’s HSD indicates that these declines were significant in all cases so H2 is supported fully.
For the two non-Big 4 firms, while the mean risk of restatement declined for both firms,
the decline was not significant for either. Thus, H3 is not supported for either of the two non-Big
4 audit firms.
For hypothesis H4, DT, KPMG and PWC each has a significantly lower mean risk of
restatement than do BDO and GT. EY is not significantly different than the two non-Big 4,
indicating that H4 is supported for three of the four Big 4 firms.
Financial Distress as a Surrogate for Litigation Risk
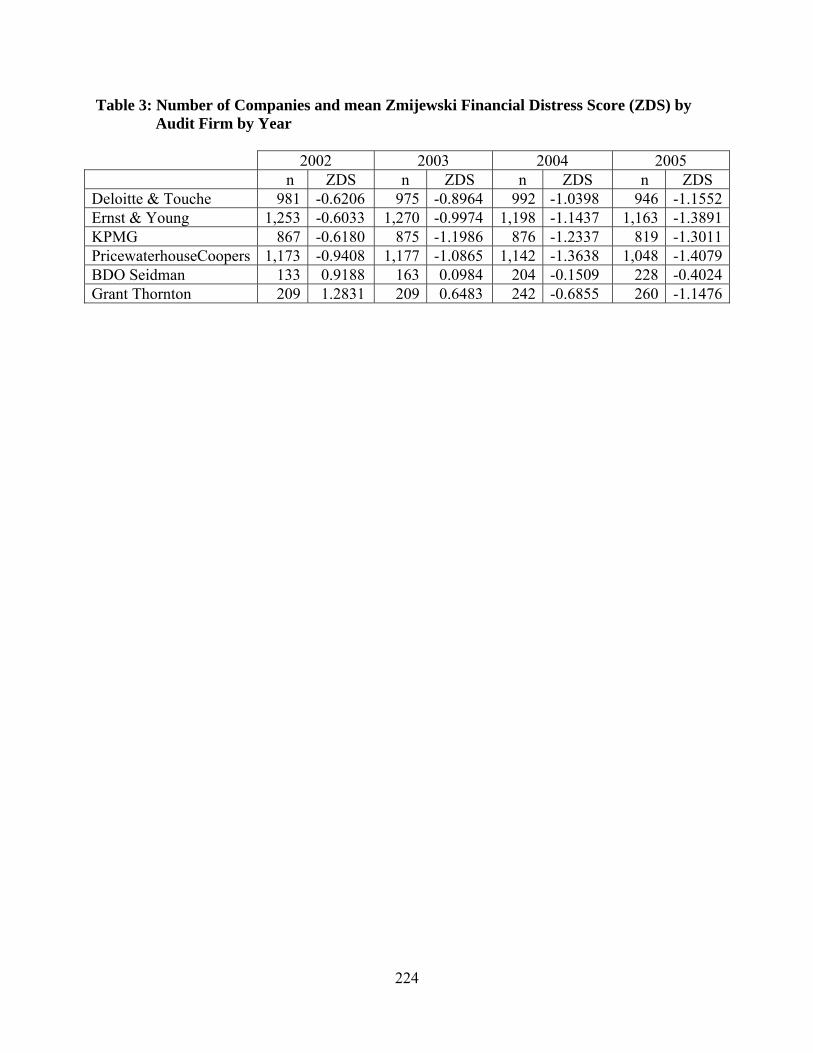
As a surrogate for litigation risk, the Zmijewski financial distress score (ZDS) offers all
three advantages over estimated discretionary accruals described above for the Turner and
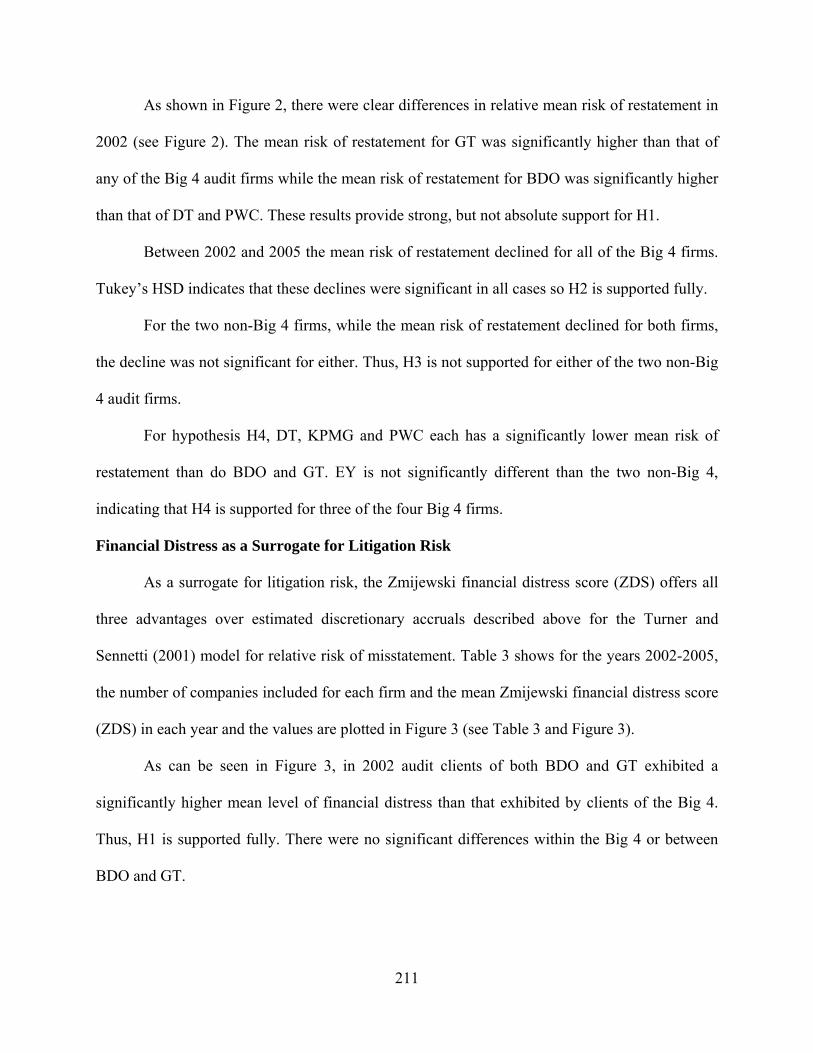
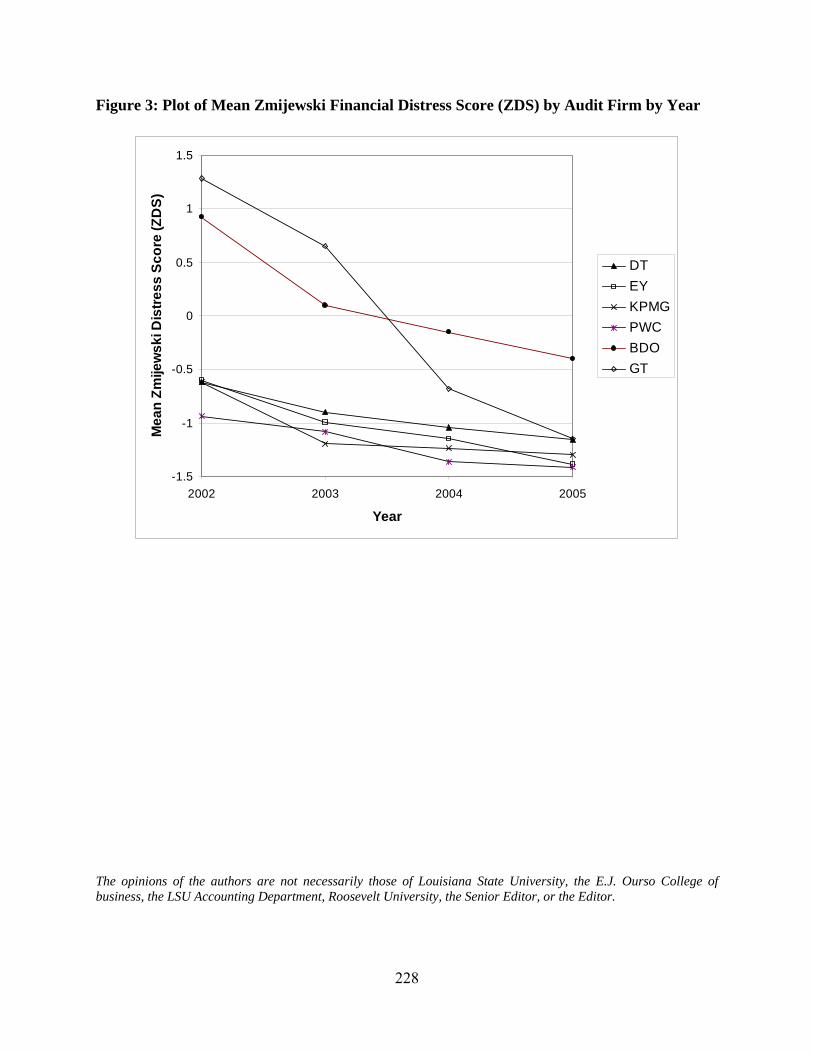
Sennetti (2001) model for relative risk of misstatement. Table 3 shows for the years 2002-2005,
the number of companies included for each firm and the mean Zmijewski financial distress score
(ZDS) in each year and the values are plotted in Figure 3 (see Table 3 and Figure 3).
As can be seen in Figure 3, in 2002 audit clients of both BDO and GT exhibited a
significantly higher mean level of financial distress than that exhibited by clients of the Big 4.
Thus, H1 is supported fully. There were no significant differences within the Big 4 or between
BDO and GT.
212
For the Big 4, only EY clients show a significant decline in financial stress between 2002
and 2005. The other three Big 4 firms—DT, KPMG and PWC—also show declines in financial
stress, but not significantly so for experiment wise comparisons. Each of the Big 4 shows a
significant decline when controlling for the comparison wise error rates. Thus, hypothesis H2 is
supported only partially.
Figure 3 shows that clients of the two non-Big 4 firms experienced much steeper declines
in financial distress over the three year period from 2002 to 2005. However, while the decline for
GT clients was significant while controlling for both experiment wise and comparison wise error
rates, BDO was significant only for comparison wise tests. As with H2, therefore, H3 is partially
supported.
In comparing the Big 4 to the two non-Big 4 audit firms, financial distress for GT clients
dropped by 2005 to a level almost identical with that of DT and not significantly different that
any of the Big 4. Clients of BDO, however, although lowering from 2002, continued to exhibit
financial distress at a significantly higher level than any of the other five audit firms, resulting in
H4 being partially supported.
COMPARISON OF RESULTS
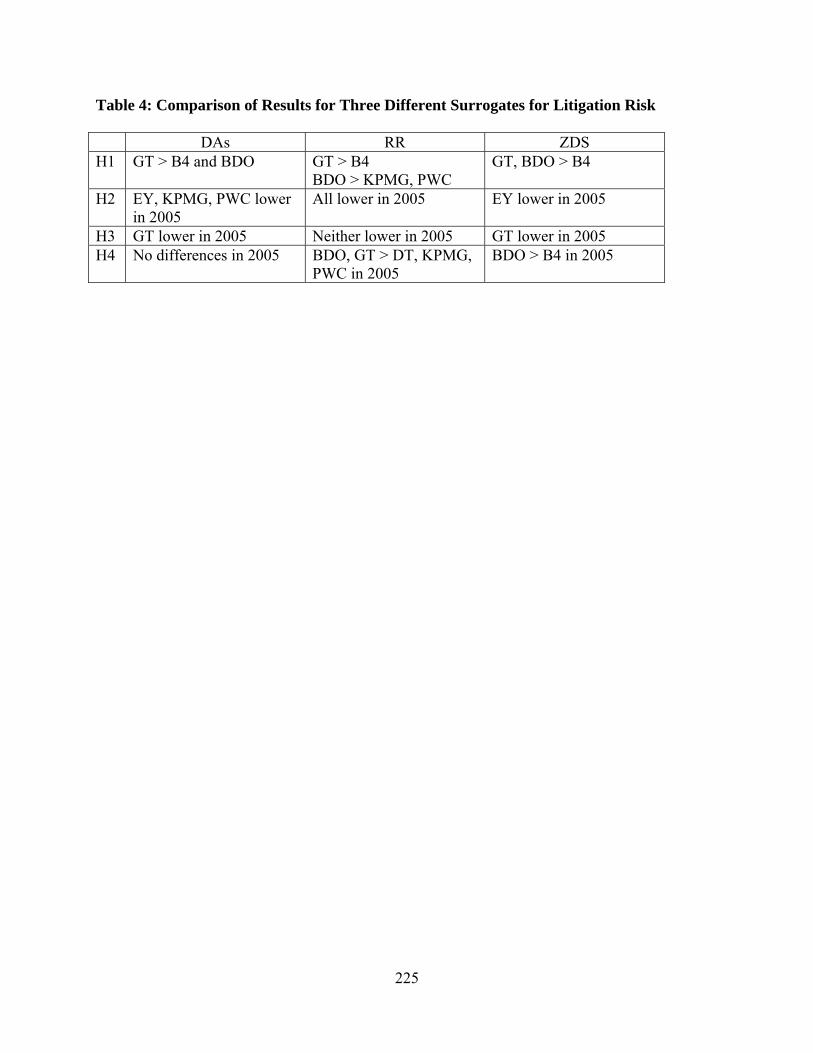
A comparison of results for the three different surrogates for litigation risk indicates
differences between the three approaches. However, there is an overall downward trend for all
three surrogates and comparison does show enough similarities that some conclusions can be
drawn. Results for tests using the three surrogates are summarized in Table 4 (see Table 4).
In 2002, the base year for the comparison, all three surrogate models find GT clients
displaying a significantly greater risk of litigation than that for any of the Big 4 audit firms and,
for DAs, significantly greater than BDO, the other non-Big 4. Differences for BDO are not as
213
clear as there is no difference between litigation risk between BDO and the Big 4 when measured
by DAs. When measured by RR, however, BDO is significantly higher in litigation risk than
either KPMG or PWC, and for the ZDS measure, BDO has higher values than any of the Big 4
firms. These results provide strong, but not absolute support for hypothesis H1.
In testing hypothesis H2, all three measures find EY having an audit portfolio of public
companies with a significantly reduced risk of litigation by 2005. Both the DAs and RR
surrogates find KPMG and PWC with a significantly lower litigation risk associated with their
public audit clients, and RR indicates a lower such risk for DT. Based on these results, it is
reasonable to accept H2 as being sufficiently supported and conclude that the Big 4 firms had
audit portfolios of public companies that presented lower litigation risk in 2005 than did their
portfolios in 2002.
For hypothesis H3, GT, which had the portfolio with the highest risk of litigation in 2002,
had lowered its risk significantly by 2005 when measured by DAs and ZDS. No significant
reduction in litigation risk was indicated by the RR measure. While the risk of litigation was
lower for BDO for all three surrogate measures, there was no significant reduction between 2002
and 2005. Accordingly, H3 appears to be supported only for GT.
Tests for H4 also have mixed results. When measured by DAs, both BDO and GT exhibit
a risk of litigation in 2005 virtually identical to that of the Big 4 audit firms. However, the RR
measure indicates that both BDO and GT exhibited a higher litigation risk in 2005 than that
exhibited by three of the Big 4 firms. The ZDS measure finds no difference between GT and the
Big 4 firms, but a significantly higher risk for BDO than that of the larger firms. Given that two
of the three measures find BDO with a higher litigation risk than that of the Big 4, H4 is
214
supported partially and it is likely that the non-Big 4 audit portfolios had a significantly higher
litigation risk than corresponding portfolios of the Big 4.
SUMMARY AND CONCLUSIONS
Although the Private Securities Litigation Reform Act of 1995 was intended to shield
auditors from excessive litigation, auditors once more are seeking additional protections, both in
the U.S. and internationally. The perceived need for additional protection results from an
increased number of extremely large lawsuits that threaten the continuing existence of many
audit firms, including all of the Big 4. In addition, passage of the Sarbanes-Oxley Act of 2002
has added increased legal exposure both to auditors and their clients.
Another major event in 2001 was the demise of Andersen. The migration of Andersen’s
extensive portfolio of clients to surviving audit firms may have allowed the Big 4 audit firms not
only to “cherry pick” from that portfolio, but to divest themselves of existing clients by electing
to not continue as auditors for those considered to have an unacceptable risk-to-return ratio. A
substantial number of the clients not obtained by the Big 4, along with clients rejected by the Big
4, selected the next two largest audit firms, GT and BDO, as their new auditor. This realignment
of auditor/client relationships may have resulted in a measurable change in overall portfolio
litigation risk for all six firms, with the Big 4 litigation risk being reduced while the two non-Big
4 firms risk possibly increasing. This paper investigates whether there is any evidence that such
changes in litigation risk did occur.
Assuming controlling litigation risk is important both to the client and the auditor, in the
absence of or in combination with additional legal protections, a rational response by auditors
and their clients would be to reduce the likelihood of litigation if possible. As the likelihood of
litigation is a joint condition depending on the quality of the independent audit, the reliability of
215
the resulting financial statements, and the financial success of the client, several different
measures may be used as indicators of reduced litigation risk.
The quality of the independent audit often is associated with the extent of earnings
management employed by management (e.g., see Becker et al. 1998; Johnson et al. 2002;
Krishnan 2003; Nagy 2005), where earnings management is measured by estimating
discretionary accruals (Schipper and Vincent 2003). Accordingly, as with Heninger (2001) and
DeFond and Subramanyam (1998), this paper uses discretionary accruals estimated using the
Jones (1991) model as one surrogate for litigation risk.
The quality of the issued financial statements can be measured by the likelihood that the
statements contain a material error and must be restated subsequent to initial issuance. Such
restatements have been found to be associated with litigation (Palmrose and Scholz 2004;
Whalen 2004). Turner and Sennetti (2001) offer a model of relative risk of restatement and that
model is used as a second surrogate for litigation risk.
Finally, prior research (e.g., Palmrose 1987; Stice 1991) shows a positive association
between financial distress and litigation so the client simply may become stronger financially.
The third surrogate for litigation risk used in this paper is Zmijewski’s financial distress score
(Zmijewski 1984), which has been used in a similar context, but for an earlier period, by Choi et
al. (2004).
Results show that all three surrogates for litigation risk declined between 2002 and 2005
for all six audit firms examined. However, the decline was not significant for every audit firm
across all three surrogates. In terms of earnings management, GT exhibited significantly higher
estimated discretionary accrual in 2002, but by 2005, there were no significant differences in
litigation risk between any of the six audit firms. In terms of relative risk of restatement, all Big 4
216
firms were significantly lower in 2005 than in 2002, while the two non-Big 4 firms show no
significant reduction over that period. In 2002, both BDO and GT audit clients exhibited
financial distress significantly higher than clients of any of the Big 4 firms. Between 2002 and
2005, only clients of GT and EY reduced the level of financial stress significantly, while BDO
clients remained significantly higher in stress than any of the Big 4.
As with prior studies examining auditor litigation risk, this paper has certain limitations.
Because of a lack of an adequate model, financial statement fraud risk has not been considered
although fraud risk may be a more reliable surrogate for litigation risk than the surrogates used
here (DeFond 2004). Also, because the data are limited to public sources, it is not feasible to
determine if changes in audit portfolio litigation risk result from actions by the audit client, by
the auditor, or by some combination of both. Changes in earnings management, for example,
may result from client management voluntarily electing to use more conservative interpretations
of GAAP or from auditors applying pressure for them to do so. Also, as audit portfolios are
affected by changes in the specific clients included, it is not possible to determine if clients
removed from a portfolio chose to leave by their own volition or were screened out by the
auditor because of an unacceptable risk-to-return ratio (e.g., see Bell et al. 2002). Finally,
portfolio litigation risk may be affected by exogenous factors, such as the overall economy. Such
factors were not considered in this study.
Despite these limitations, the questions researched here and the results are important
because assessing whether auditors manage risk at the client portfolio level provides additional
insights into auditor and audit client behavior and is a useful way of testing whether our beliefs
are empirically valid. The analysis is timely because it examines changes in client risk around a
period in which large lawsuits resulted from numerous audit failures, new legislation such as

217
SarbOx created possible new exposures, and Andersen, one of the largest audit firms in the
world, failed.
Future research into auditor litigation risk has many interesting avenues to explore.
Certainly one valuable contribution would be to identify and instantiate a model for assessing the
risk of financial statement fraud. Another would be to relate actual litigation to the individual
surrogates for litigation risk included in this study and to combinations of those surrogates.
These suggestions and other studies would make a valuable contribution to our understanding of
the auditor/client relationship and the ability of the auditor to control litigation risk.
218
REFERENCES
Becker, C., M. DeFond, J. Jiambalvo, and K. R. Subramanyam. 1998. The effect of audit quality
on earnings management. Contemporary Accounting Research 15 (1): 1-24. Bell, T., J. Bedard, K. Johnstone, and E. Smith. 2002. Krisk: A Computerized Decision Aid for
Client Acceptance and Continuance Risk Assessments. Auditing: A Journal of Practice and Theory 21 (2): 97-113.
CEOs. 2006. Serving Global Capital Markets and the Global Economy: a View from the CEOs
of the International Audit Networks (available at www.globalpublicpolicysymposium.com).
Choi, J., R. Doogar, and A. Ganguly. 2004. The Riskiness of Large Audit Firm Client Portfolios
and Changes in Audit Liability Regimes: Evidence from the U.S. Audit Market. Contemporary Accounting Research 21 (4): 747-785.
Commission, U. S. S. 2003. Report to the Congress: Increased Penalties Under the Sarbanes-
Oxley Act of 2002. January. (Available at http://www.ussc.gov/r_congress/S-Oreport.pdf).
Dechow, P., R. Sloan, and A. Sweeney. 1995. Detecting Earnings Management. The Accounting
Review 70 (2): 193-225. DeFond, M. 2004. DISCUSSION OF The Riskiness of Large Audit Firm Client Portfolios and
Changes in Audit Liability Regimes: Evidence from the U.S. Audit Market. Contemporary Accounting Research 21(4): 787-794.
DeFond, M., and J. Jiambalvo. 1994. Debt Covenant Violation and Manipulation of Accruals.
Journal of Accounting and Economics 17: 145-176. DeFond, M., and K. Subramanyam. 1998. Auditor changes and discretionary accruals. Journal of
Accounting and Economics 25 (1): 35-67. DuCharme, L., P. Malatesta, and S. Sefcik. 2004. Earnings management, stock issues, and
shareholder lawsuits. Journal of Financial Economics 71 (1): 27-49. Francis, J., and J. Reynolds. 2000. Do large accounting firms screen out risky clients? Working
paper, University of Missouri-Columbia. Geiger, M., K. Raghunandan, and D. Rama. 2005. Recent Changes in the Association between
Bankruptcies and Prior Audit Opinions. Auditing: A Journal of Practice & Theory 24(1): 21-35.
219
Grant, P. 2008. PwC settles AIG lawsuit. AccountancyAge. October 7 (Available at http://www.accountancyage.com/accountancyage/news/2227618/pwc-settles-aig-lawsuit).
Heninger, W. 2001. The Association between Auditor Litigation and Abnormal Accruals. The
Accounting Review 76 (1): 111-126. Johnson, V., I. Khurana, and J. Reynolds. 2002. Audit-Firm Tenure and the Quality of Financial
Reports. Contemporary Accounting Research 19 (4): 637-660. Jones, E., and K. Raghunandan. 1998. Client risk and recent changes in the market for audit
services. Journal of Accounting and Public Policy 17 (2): 169-181. Jones, J. 1991. Earnings Management During Import Relief Investigations. Journal of
Accounting Research 29: 193-228. Kinney, W., and L. McDaniel. 1989. Characteristics of firms correcting previously reported
quarterly earnings. Journal of Accounting and Economics 11 (1): 71-93. Kothari, S., T. Lys, C. Smith, and R. Watts. 1988. Auditor liability and information disclosure.
Journal of Accounting, Auditing and Finance 3 (3): 307-340. Kreutzfeldt, R., and W. Wallace. 1986. Error Characteristics in Audit Populations: Their Profile
and Relationship to Environmental Factors. Auditing: A Journal of Practice & Theory 6 (1): 20-43.
Krishnan, G. 2003. Audit Quality and the Pricing of Discretionary Accruals. Auditing: A Journal
of Practice and Theory 22 (1): 109-126. ———. 2007. Did Earnings Conservatism Increase for Former Andersen Clients? Journal of
Accounting, Auditing and Finance 22 (2): 141-163. Landsman, W., K. Nelson, and B. Rountree. 2009. Auditor Switches in the Pre- and Post-Enron
Eras: Risk or Realignment? The Accounting Review (Forthcoming March). Lee, H. Y., and V. Mande. 2002. The Effect of the Private Securities Litigation Reform Act of
1995 on Accounting Discretion of Client Managers of Big 6 and Non-Big 6 Auditors. Auditing: A Journal of Practice & Theory 22 (1): 93-108.
Levitt, A. 2000. Testimony concerning commission’s auditor independence proposal before the
senate subcommittee on securities committee on banking, housing, and urban affairs on September 28, 2000. Available at http://www.sec.gov/news/testimony/ts152000.htm.
Lobo, G. J., and J. Zhou. 2006. Did Conservatism in Financial Reporting Increase after the
Sarbanes-Oxley Act? Initial Evidence. Accounting Horizons 20 (1): 57-73.
220
Lys, T. 1993. Discussion: The evolution of lawsuits against auditors—Determinants, consequences, and solutions. Journal of Economics and Management Strategy 2 (3): 427-433.
Lys, T., and R. Watts. 1994. Lawsuits Against Auditors. Journal of Accounting Research 32
(Supplement): 65-93. Manry, D., T. Mock, and J. Turner. 2007. The Association of Pre-Audit Engagement Risk with
Discretionary Accruals. Journal of Accounting, Auditing and Finance 22(4): 623-644. Mildenberg, D., and K. Freifeld. 2008. Countrywide's Underwriters Sued for Fraud by New York
Agencies. Bloomberg.com. January 26 (Available at http://www.bloomberg.com/apps/news?pid=20601087&sid=axRMZutUG2BQ&refer=home).
Nagy, A. 2005. Mandatory Audit Firm Turnover, Financial Reporting Quality, and Client
Bargaining Power: The Case of Arthur Andersen. Accounting Horizons 19 (2): 51-68. Palmrose, Z.-V. 1987. Litigation and independent auditors: The role of business failures and
management fraud. Auditing: A Journal of Practice & Theory 6 (2): 90-103. Palmrose, Z.-V., and S. Scholz. 2004. The Circumstances and Legal Consequences of Non-
GAAP Reporting: Evidence from Restatements. Contemporary Accounting Research 21(1):138-180.
Reilly, D. 2006a. Booming Audit Firms Seek Shield From Suits. The Wall Street Journal,
November 1, 2006, C1. ———. 2006b. Midtier Auditors Gain Traction in Quest for Large-Cap Clients. The Wall Street
Journal, November 14, 2006, C3. Sarbanes-Oxley Act of 2002 (SarbOx). 2002. Pub. L. No. 107-204, 116. Stat. 745 (Available at
http://www.pcaobus.com/About_the_PCAOB/Sarbanes_Oxley_Act_of_2002.pdf). Schipper, K., and L. Vincent. 2003. Earnings Quality. Accounting Horizons (Supplement): 97-
110. Simunic, D., and M. Stein. 1980. Audit Risk in an Audit Portfolio Context. Contemporary
Accounting Research 6 (2): 329-343. Stice, J. 1991. Using financial and market information to identify pre-engagement factors
associated with lawsuits against auditors. The Accounting Review 66 (3): 516-533. Subramanyam, K. 1996. The Pricing of Discretionary Accruals. Journal of Accounting and
Economics 22: 249-282.
221
The American Assembly. 2005. The Future of the Accounting Profession: Auditor Concentration. New York: Columbia University.
Turner, J., and J. Sennetti. 2001. Post-Audit Restatement Risk and Audit Firm Size. Journal of
Forensic Accounting Vol. II: 67-96. U.S. Chamber of Commerce. 2006. Auditing: A Profession at Risk. Washington, D.C. U.S. General Accountancy Office (GAO). 2003. Public Accounting Firms: Required Study on
the Potential Effects of Mandatory Audit Firm Rotation. Washington, D.C: Government Printing Office.
Whalen, J. 2004. Discussion of "The Circumstances and Legal Consequences of Non-GAAP
Reporting: Evidence from Restatements. Contemporary Accounting Research 21 (1): 181-190.
Whitehouse, T. 2008. Auditors Brace for Legal Backlash in Credit Crisis. Compliance Week.
October 28 (Available at http://www.complianceweek.com/article/5118). Xie, H. 2001. The Mispricing of Abnormal Accruals. The Accounting Review 76 (3): 357-373. Zmijewski, M. 1984. Methodological Issues Related to the Estimation of Financial Distress
Prediction Models. Journal of Accounting Research 22(Supplement): 59-82.
222
Table 1: Number of Companies with Income-Increasing Estimated Discretionary Accruals (DA) and Mean Income-Increasing Estimated Discretionary Accruals by Audit Firm by Year
2002 2003 2004 2005 Audit Firm n
Mean DA n
Mean DA n
Mean DA n
Mean DA
Deloitte & Touche 460 0.1946 460 0.1282 516 0.2327 438 0.1799 Ernst & Young 576 0.2822 552 0.1311 621 0.2328 480 0.1935 KPMG 416 0.3596 349 0.1446 433 0.2447 336 0.1636 PricewaterhouseCoopers 554 0.2616 519 0.1178 624 0.2026 446 0.1675 BDO Seidman 60 0.1860 70 0.1565 81 0.2640 92 0.1870 Grant Thornton 81 0.5086 89 0.2745 119 0.2739 111 0.2114
223
Table 2: Number of Companies and Relative Risk of Restatement (RR) by Audit Firm by Year
2002 2003 2004 2005 n RR n RR n RR n RR Deloitte & Touche 1,143 0.5544 1,122 0.5323 1,111 0.5184 1,124 0.5057Ernst & Young 1,479 0.6116 1,505 0.5902 1,376 0.5749 1,378 0.5545KPMG 1,046 0.6083 1,051 0.5802 1,008 0.5607 1,071 0.5144PricewaterhouseCoopers 1,357 0.5837 1,366 0.5557 1,276 0.5456 1,215 0.5313BDO Seidman 153 0.6259 183 0.6527 231 0.6309 262 0.5931Grant Thornton 244 0.6448 242 0.5981 268 0.6154 312 0.5907
224
Table 3: Number of Companies and mean Zmijewski Financial Distress Score (ZDS) by Audit Firm by Year
2002 2003 2004 2005 n ZDS n ZDS n ZDS n ZDS Deloitte & Touche 981 -0.6206 975 -0.8964 992 -1.0398 946 -1.1552Ernst & Young 1,253 -0.6033 1,270 -0.9974 1,198 -1.1437 1,163 -1.3891KPMG 867 -0.6180 875 -1.1986 876 -1.2337 819 -1.3011PricewaterhouseCoopers 1,173 -0.9408 1,177 -1.0865 1,142 -1.3638 1,048 -1.4079BDO Seidman 133 0.9188 163 0.0984 204 -0.1509 228 -0.4024Grant Thornton 209 1.2831 209 0.6483 242 -0.6855 260 -1.1476
225
Table 4: Comparison of Results for Three Different Surrogates for Litigation Risk DAs RR ZDS H1 GT > B4 and BDO GT > B4
BDO > KPMG, PWC GT, BDO > B4
H2 EY, KPMG, PWC lower in 2005
All lower in 2005 EY lower in 2005
H3 GT lower in 2005 Neither lower in 2005 GT lower in 2005 H4 No differences in 2005 BDO, GT > DT, KPMG,
PWC in 2005 BDO > B4 in 2005
226
Figure 1: Plot of Mean Income-Increasing Estimated Discretionary Accruals (DA) by Audit Firm by Year
0
0.1
0.2
0.3
0.4
0.5
0.6
2002 2003 2004 2005
Year
Me
an
Inc
om
e In
cre
as
ing
Es
tim
ate
d
Dis
cre
tio
na
ry A
cc
rua
ls
DT
EY
KPMG
PWC
BDO
GT
227
Figure 2: Plot of Mean Relative Risk of Restatement (RR) by Audit Firm by Year
0.5
0.52
0.54
0.56
0.58
0.6
0.62
0.64
0.66
2002 2003 2004 2005
Year
Me
an
Ris
k o
f R
es
tate
me
nt
DT
EY
KPMG
PWC
BDO
GT
228
Figure 3: Plot of Mean Zmijewski Financial Distress Score (ZDS) by Audit Firm by Year
-1.5
-1
-0.5
0
0.5
1
1.5
2002 2003 2004 2005
Year
Me
an
Zm
ijew
sk
i Dis
tre
ss
Sc
ore
(Z
DS
)
DT
EY
KPMG
PWC
BDO
GT
The opinions of the authors are not necessarily those of Louisiana State University, the E.J. Ourso College of business, the LSU Accounting Department, Roosevelt University, the Senior Editor, or the Editor.