Embed Size (px)
Citation preview

Changes in Gulf Shoreline Position, Mustang, and North Padre Islands, Texas
James C. Gibeaut, Tiffany Hepner, Rachael Waldinger, John Andrews, Roberto Gutierrez, Thomas
A. Tremblay, Rebecca Smyth; With assistance from Liying Xu
A Report of the Texas Coastal Coordination Council pursuant to National Oceanic and Atmospheric Administration Award No. NA97OZ0179
GLO Contract Number 00-002R
Bureau of Economic Geology Scott W. Tinker, Director
The University of Texas at Austin Austin, Texas 78713-8924
1
May 2001
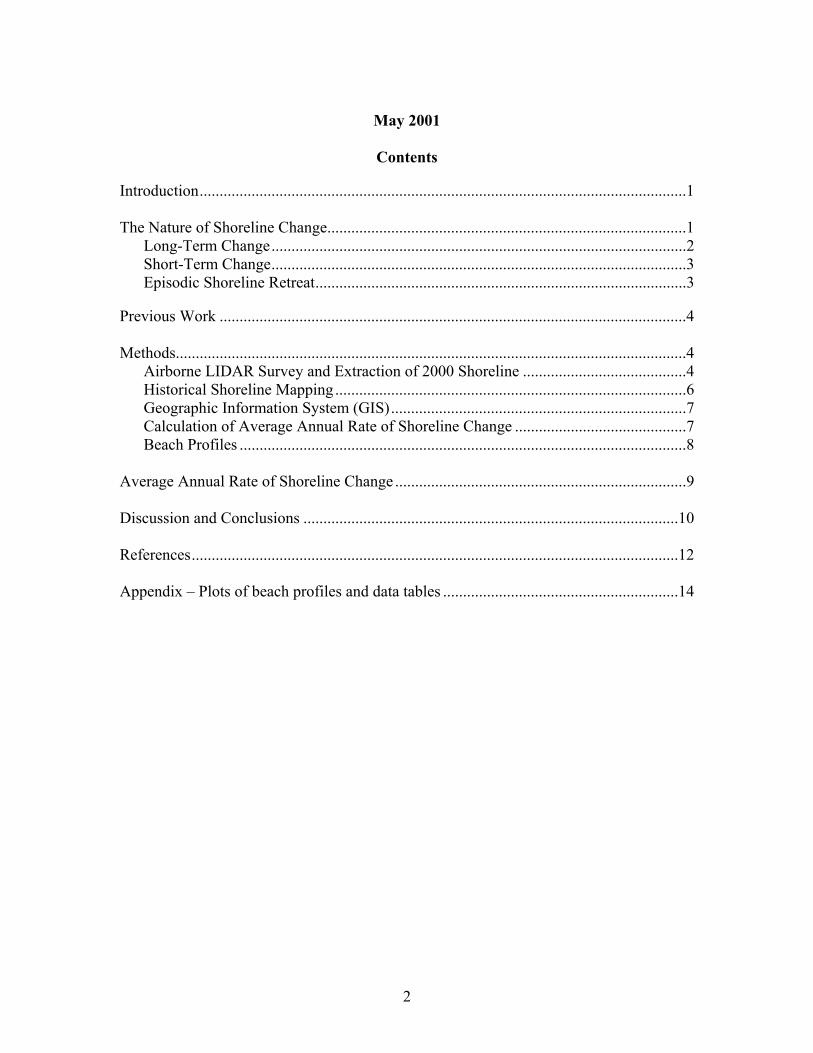
Contents
Introduction..........................................................................................................................1 The Nature of Shoreline Change..........................................................................................1
Long-Term Change........................................................................................................2 Short-Term Change........................................................................................................3 Episodic Shoreline Retreat.............................................................................................3
Previous Work .....................................................................................................................4 Methods................................................................................................................................4
Airborne LIDAR Survey and Extraction of 2000 Shoreline .........................................4 Historical Shoreline Mapping ........................................................................................6 Geographic Information System (GIS)..........................................................................7 Calculation of Average Annual Rate of Shoreline Change ...........................................7 Beach Profiles ................................................................................................................8
Average Annual Rate of Shoreline Change .........................................................................9
Discussion and Conclusions ..............................................................................................10
References..........................................................................................................................12
Appendix – Plots of beach profiles and data tables ...........................................................14
2

Introduction
This report presents long-term rates of shoreline change along the Texas Gulf of
Mexico Shoreline from Aransas Pass to the north boundary of the Padre Island National
Seashore. This shoreline reach includes the barrier islands of Mustang and North Padre.
The successive positions of historical shorelines are combined in a linear regression
model that provides the average annual rate of shoreline change. Based on previous
years, therefore, these rates indicate how the shoreline is expected to advance seaward or
retreat landward during the next several decades, making this information useful for
coastal planning. The Bureau of Economic Geology is currently updating shoreline
change rates for most of the Texas coast under the Texas Shoreline Change Project. All
data, including what is presented in this report, are being placed in a web-based
Geographic Information System (ArcIMS) on the Bureau’s Coastal Studies web site
(http://www.beg.utexas.edu/coastal/coastal01.htm). The public can use this web site to
create custom maps and download data.
The Nature of Shoreline Change
The natural character of sandy beaches is to change shape constantly and to move
landward (retreat) or seaward (advance). The changes are caused by changes in the forces
that move the sand, namely wind, waves, and currents, and by the supply of sand. Short-
and long-term relative sea-level changes also control shoreline movement. The setting of
the shoreline and the supply of sand determine how the shoreline changes at a particular
location. Setting refers to whether a beach is sheltered from waves, adjacent to a tidal or
storm channel, or next to a jetty or seawall, to state a few examples. To understand and
predict the rate of change, we need to distinguish between long-term, short-term, and
episodic changes and to understand their causes. Long-term change occurs over tens to
thousands of years, short-term change refers to movement occurring over several seasons
to 5 or 10 years, and episodic change is that which occurs in response to a single storm.
3
#
#
#
#
#
#
#
#
#
Corpus Christi Bay
5 0 5 10 Kilometers
N
Gulf of MexicoLa
guna
Mad
re
Mustang Island
Padre IslandNational Seashore
Boundary
Bob Hall Pier
seawallPackery Channel
Newport Pass
Corpus Christi Pass
fish pass
pier
Aransas Passsouth jetty
MUI-01MUI-03
MUI-06
MUI-05
MUI-02
MUI-04
NPI-08
NPI-07
NPI-06# MUI-01, beach profile location
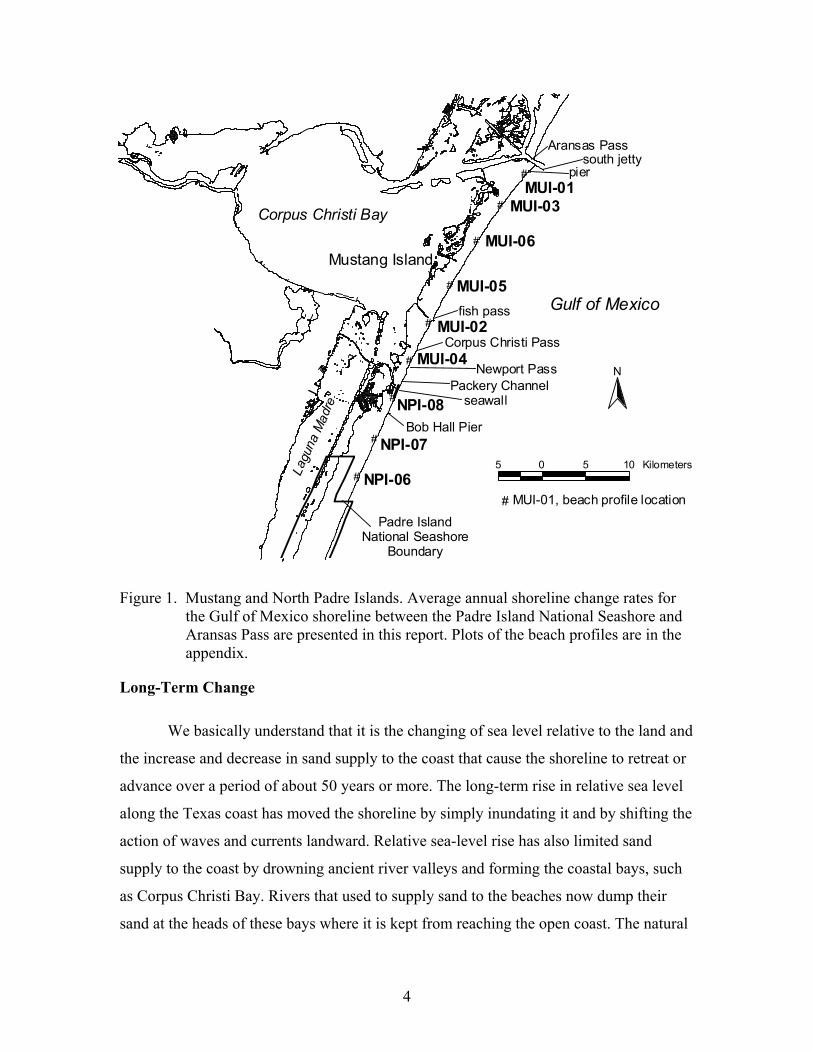
Figure 1. Mustang and North Padre Islands. Average annual shoreline change rates for the Gulf of Mexico shoreline between the Padre Island National Seashore and Aransas Pass are presented in this report. Plots of the beach profiles are in the appendix.
Long-Term Change
We basically understand that it is the changing of sea level relative to the land and
the increase and decrease in sand supply to the coast that cause the shoreline to retreat or
advance over a period of about 50 years or more. The long-term rise in relative sea level
along the Texas coast has moved the shoreline by simply inundating it and by shifting the
action of waves and currents landward. Relative sea-level rise has also limited sand
supply to the coast by drowning ancient river valleys and forming the coastal bays, such
as Corpus Christi Bay. Rivers that used to supply sand to the beaches now dump their
sand at the heads of these bays where it is kept from reaching the open coast. The natural
4

geologic setting has not much sand left offshore to resupply eroding beaches either.
Generally the sand turns to mud 6 to 9 km offshore (White et al., 1983). Thus the natural
geological setting of the Mustang/North Padre Island coast has created a shoreline that is
low in sand supply and that is undergoing long-term relative sea-level rise. For these
reasons, the shoreline will continue to undergo long-term retreat unless human
intervention prevails.
Short-Term Change
Shoreline change that occurs over about ten years or less and that may be in the
opposite direction of the long-term trend is difficult to understand and predict. These
short-term shoreline changes can also be quite variable alongshore. One portion of the
coast may be experiencing retreat while just a few kilometers away stable or advancing
conditions may prevail. A shoreline that has retreated over the last 100 years may have
experienced periods of shoreline advance, and this is the case for various periods and
locations along Mustang and North Padre Islands since the 1930’s (Morton and Pieper,
1977). It is important, however, for coastal residents to understand that even though a
particular beach may have been advancing or stable over the last several years, if it has
been retreating for the previous decades, then retreat will eventually resume. An
exception to this rule would be if something fundamental, such as a “permanent” increase
or decrease in the sand supply, has changed in the system.
Episodic Shoreline Retreat
Shoreline retreat is not always a continuous and steady process with a little more
of the beach eroded each year. Tropical storms and hurricanes along the Texas coast can
move the shoreline more than 30 m landward in a day. During Hurricane Carla in 1961,
foredunes on Mustang Island were eroded back 50 to 100 m (Hayes, 1961). There is often
dramatic recovery for months and years following a storm, but it is usually incomplete,
and the shoreline remains significantly landward of its prestorm position. Even though
shoreline change rates are given as annual rates, they must be considered “average”
annual rates. A particular shoreline with a long-term retreat rate of 2 m/yr would be
5
expected to be 120 m landward in 60 years. A single storm, however, could cause much
of this movement.
Previous Work
Scientists at the Bureau of Economic Geology have been mapping historical
shorelines and determining shoreline change rates since the early 1970’s. Morton and
Pieper (1977) determined historical rates of shoreline change by comparing shorelines
from topographic surveys conducted by the U. S. Coast Survey in the mid to late 1800’s
and several shorelines mapped using aerial photography from the 1930’s to the 1970’s.
This publication also discusses the shoreline mapping procedure and limitations using
aerial photography. These shorelines originally mapped by Morton and Piper (1977) were
digitized and used in this report. Paine and Morton (1989) compared 1974 and 1982
shorelines and vegetation lines mapped from aerial photography. Morton (1993)
calculated long-term shoreline change rates using data from the 1800’s up to 1982.
Methods
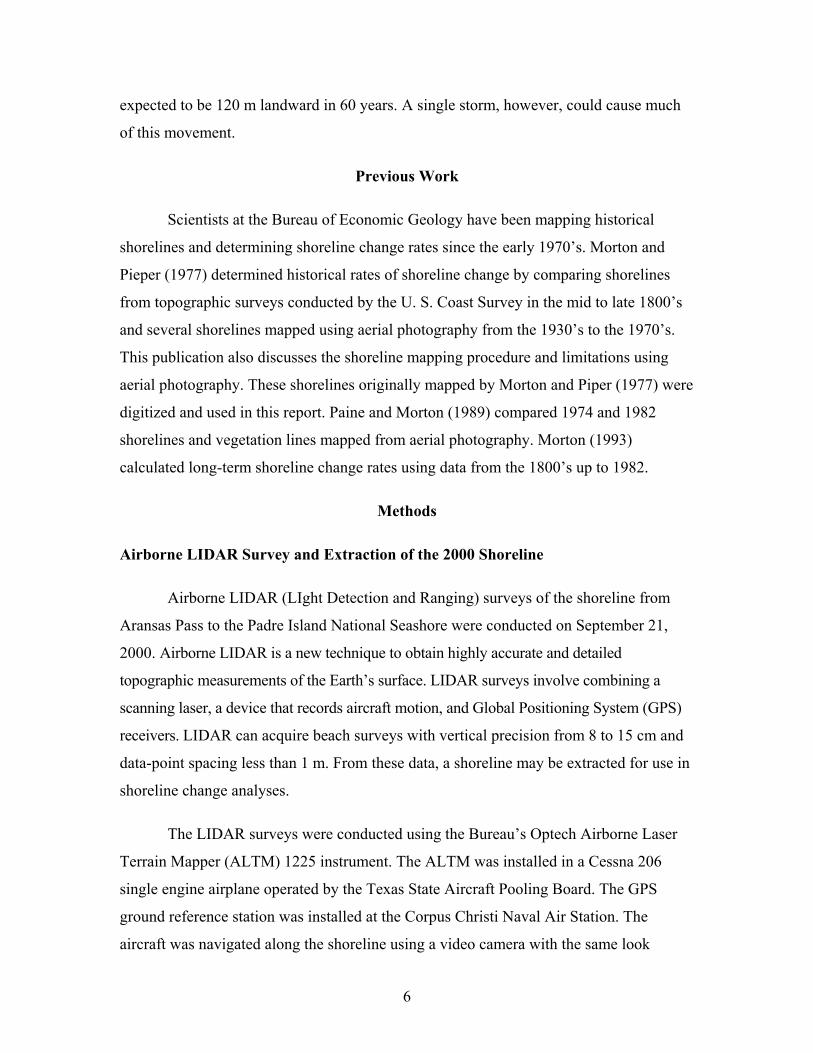
Airborne LIDAR Survey and Extraction of the 2000 Shoreline
Airborne LIDAR (LIght Detection and Ranging) surveys of the shoreline from
Aransas Pass to the Padre Island National Seashore were conducted on September 21,
2000. Airborne LIDAR is a new technique to obtain highly accurate and detailed
topographic measurements of the Earth’s surface. LIDAR surveys involve combining a
scanning laser, a device that records aircraft motion, and Global Positioning System (GPS)
receivers. LIDAR can acquire beach surveys with vertical precision from 8 to 15 cm and
data-point spacing less than 1 m. From these data, a shoreline may be extracted for use in
shoreline change analyses.
The LIDAR surveys were conducted using the Bureau’s Optech Airborne Laser
Terrain Mapper (ALTM) 1225 instrument. The ALTM was installed in a Cessna 206
single engine airplane operated by the Texas State Aircraft Pooling Board. The GPS
ground reference station was installed at the Corpus Christi Naval Air Station. The
aircraft was navigated along the shoreline using a video camera with the same look
6

direction as the LIDAR instrument. Four passes were made at an altitude of 750 m. A
swath of data extending about 500-m inland was acquired. This swath covered the
shoreline, foredunes, secondary dunes, and oceanfront structures.
A digital elevation model (DEM) with a 1.5 m × 1.5 m grid was constructed from
the LIDAR data points. LIDAR data are collected using a GPS reference frame, which
means heights are measured relative to an ellipsoid. Heights above the ellipsoid (HAE)
must be converted to heights above a sea-level datum before a shoreline can be extracted
from the DEM. Therefore, a grid of the GEOID99 geoid model was subtracted from the
DEM to transform the HAE grid to a grid that conforms to sea level. Although the
transformed grid should be parallel to sea level, it will not necessarily coincide with local
sea level. The height of the water level along the beach, as displayed in the transformed
grid, was compared with water levels recorded by the open-coast tide gauge at Bob Hall
Pier on north Padre Island during the time of the survey. This comparison allowed the
correlation of grid heights to heights relative to a local tidal datum, specifically mean sea
level as measured at the Bob Hall Pier tide gauge. Comparison of ground-surveyed beach
profiles and the wet/dry line as shown by LIDAR intensity data (Fig. 2), which were
acquired at the same time as the LIDAR topography data, were used to pick 1 m above
mean sea level as the level to represent the shoreline. The transformed DEM was
contoured and the +1-m contour line extracted as the shoreline.
The +1 m contour line has much small-scale (5 m) alongshore and cross-shore
variability, which is accurate, but not significant when considering long-term changes in
shoreline position. Therefore, the contour line was smoothed. There were also places
where the +1 m line enclosed berms separated by a landward berm runnel and shore-
normal oriented rip channels to each side. In these cases the seaward edge of the berms
were used as the shoreline, and the shoreline was extrapolated across the small rip
channels (Fig. 2). The resulting shoreline corresponds to earlier shorelines mapped using
aerial photography but is much more rigorous in its definition and an order of magnitude
more accurate in its position.
7

Figure 2. Grid of laser intensity from LIDAR survey with the +1 m mean sea level contour line superimposed (black line). The dry beach, upland, and surf zone are light in color while the asphalt roads, parking lots, and wet beach are dark. The +1 m contour line borders the wet/dry line on the beach and encloses berms separated from the dunes by landward runnels.
Historical Shoreline Mapping
Shorelines from 1937, 1956/58/59, 1965/69, 1974, and 1990/95 were mapped
using black-and-white vertical aerial photographs at a scale of 1:24,000 or larger.
Mapping shorelines from aerial photographs is a two-step process. First, the shoreline
feature is identified and traced on the photograph; second, the shoreline is transferred to a
common base map. The shoreline feature used in the photographs was the boundary
between wet and dry sand (wet/dry line) evident by a tonal contrast. This boundary
represents the upper reach of the wave swash during the preceding high tide and is less
susceptible to daily changes in ocean water levels, which are not related to shoreline
changes, than the water line.
8

Stereo viewing and optical magnification of photographs aided the identification
and tracing of the wet/dry boundary on the photographs. After the shorelines were drawn
directly on the photographs or on overlays, they were transferred to a common base map.
The common base maps are the U.S. Geological Survey, 7.5-minute quadrangle maps
that have a scale of 1:24,000. A zoom-transfer scope was used to optically register the
photographs and base maps. The shorelines were drawn directly onto the base maps, with
only the relatively undistorted central portions of the photographs being used. For this
study, the 1990/95 shorelines were mapped. Other shorelines were mapped previously by
Morton and Pieper (1977), and were checked during this study for consistency in
interpreting the shoreline feature on the photographs and for accuracy in the transfer to
the base map. Crowell et al. (1991) determined that error involved in locating relative
positions of shorelines taken from aerial photographs is about 8 m.
Geographic Information System (GIS)
All shoreline data were compiled into ArcView GIS software. Shorelines that
were transferred onto hardcopy base maps from the historical photographs were digitized.
The shoreline from the LIDAR survey was also transferred to ArcView. Once in the GIS,
the shorelines were compared against each other for consistency. They were also overlain
on digital orthophotos produced by the Texas Orthoimagery Program to help determine
proper registration. At many base map boundaries, shorelines did not match. This
problem is caused by lack of control on one-half of the base map during transfer of the
shorelines from the photographs. In some cases, base maps were spliced together to
prevent these offsets during the photograph-to-base-map transfer. In other cases, lines
were merged across base map boundaries in the GIS. The historical and projected 2060
shorelines will soon be on the Texas Shoreline Change Project Web site for viewing and
downloading (http://www.beg.utexas.edu/coastal/intro.htm).
Calculation of Average Annual Rate of Shoreline Change
Shoreline data were exported from ArcView and analyzed by the Shoreline Shape
and Projection Program (SSAPP) developed by the Bureau of Economic Geology.
SSAPP automatically draws a segmented baseline that follows the trend of the historical
9

shorelines. Transects that intersect the shorelines are constructed perpendicular to this
baseline. Distances between the shoreline positions along each transect are determined,
and in this study a linear regression model was used to calculate the average annual rate
of shoreline change. A baseline segment length of 400 m was used so that shoreline
curvature could be adequately defined. Transect spacing was 50 m.
Beach Profiles
From January 30, 2001, to February 1, 2001, topographic ground-survey transects
were conducted at 9 locations along the shoreline between the Aransas Pass and Padre
Island National Seashore (Fig. 1, Appendix). The transects are oriented perpendicular to
the shoreline and extend from landward of the foredunes to about mean sea level. These
transects, or “beach profiles,” provide data for checking the accuracy and calibration of
LIDAR data. They also provide data on the geomorphology and sediment and vegetation
characteristics needed to interpret LIDAR data. The ground surveys can be repeated
frequently to detect short-term shoreline changes.
Before the field survey was conducted, transect locations were selected. Nine
locations were spaced roughly equally along this stretch of Gulf shoreline. The
approximate coordinates of the selected transects were used with real-time differential
GPS to navigate to the proposed transect sites. Once in the vicinity, the actual profile site
was selected to best represent the area and to avoid eminent destruction by development.
One site (MUI-01) had already been established and measured in October 1999 in
conjunction with Port Aransas High School science students.
At each location, a temporary marker consisting of a steel pipe with a piece of flat
stock welded on the end was buried with about 30 cm of the pipe above ground. The X,
Y, Z positions of the tops of the datum pipes were determined by using precise
differential GPS surveying techniques. Geodetic Trimble 4000ssi GPS receivers were
used with the base station operating at the Corpus Christi Naval Air Station. Each profile
location was occupied for at least 30 minutes depending on the satellite constellation.
Heights above the ellipsoid calculated using phase differencing techniques on the GPS
data were converted to orthometric heights using the GEOID99 model. Beach profiles
10

were measured using a Sokkia Set 5W Electronic Total Station and a reflecting prism.
Vegetation, sediment type, and geomorphic features were noted along each transect line.
Navigation back to the marker locations will be possible using real-time differential GPS.
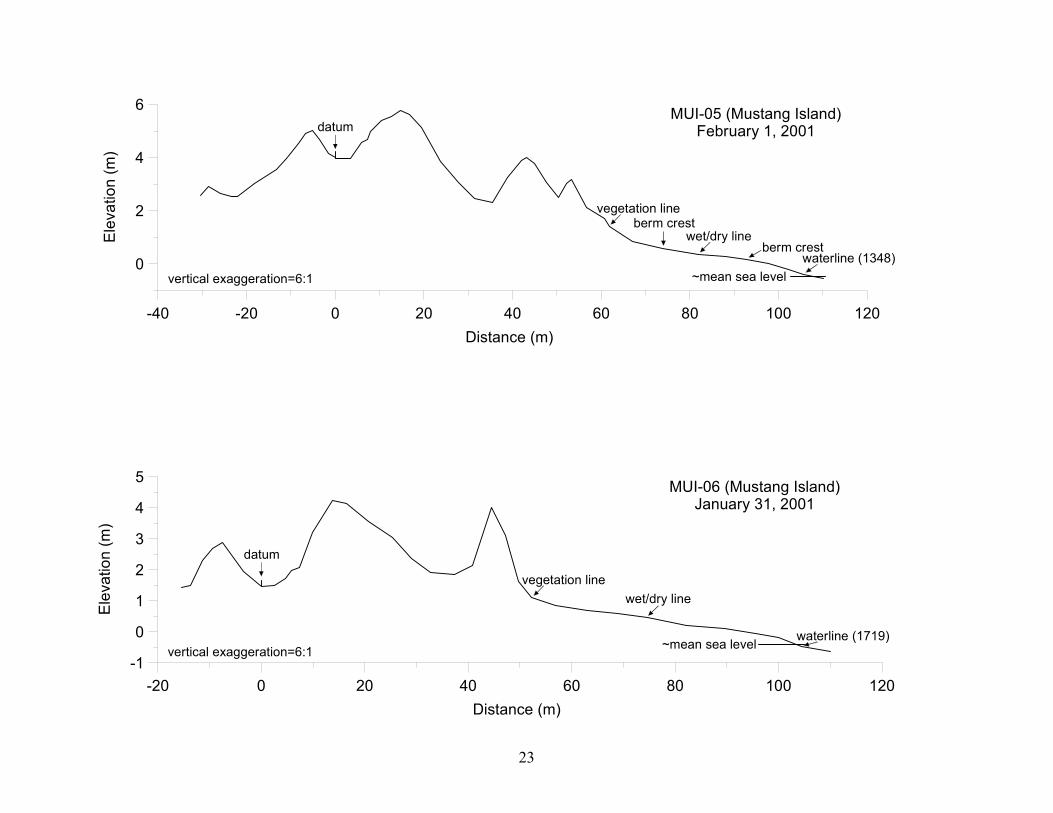
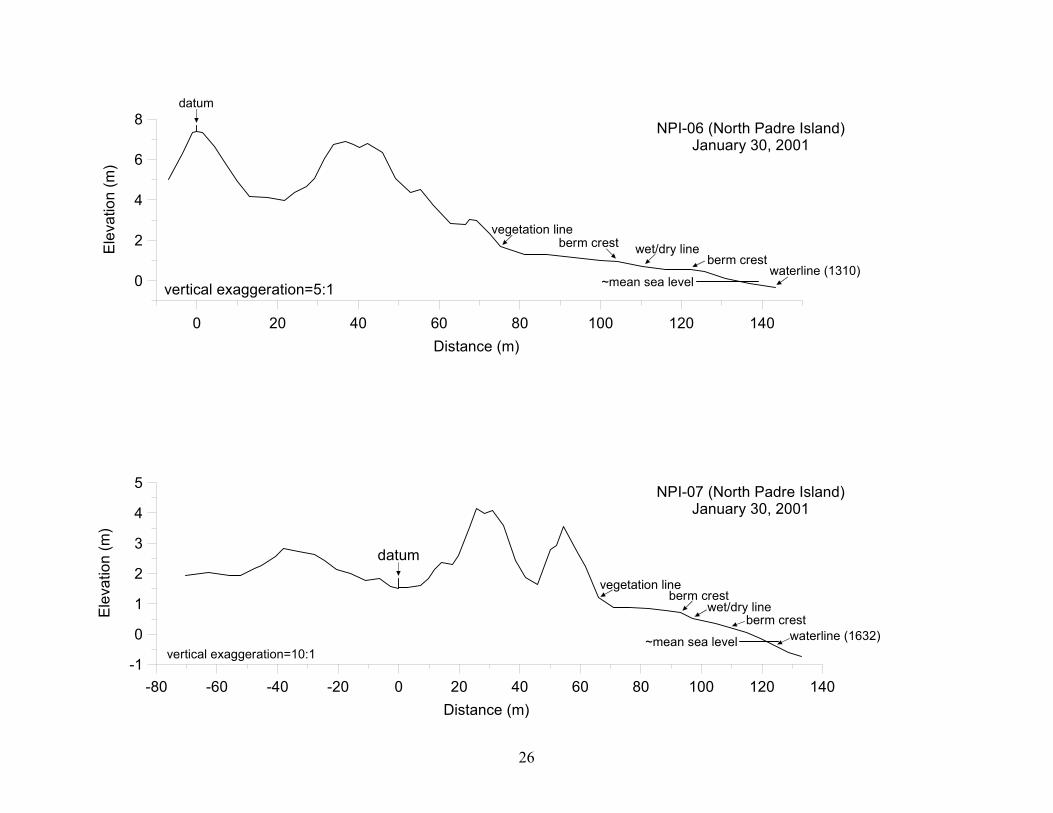
Beach profiles are plotted relative to the orthometric heights derived using
GEOID99 (Appendix). Also included on the data plots is the location of approximate
local mean sea level. Local mean sea level was determined by examining tide gauge data
from Bob Hall Pier on north Padre Island. Approximate location of mean sea level on the
transects was determined by the offset of the water level from mean sea level at the time
the position of the water line was obtained for each transect. Also included on the profile
plots is the designation of the datum marker, vegetation line, wet/dry line, and water line
at the time of the survey.
Average Annual Rate of Shoreline Change
The purpose of calculating the average annual rate of shoreline change is to
provide an indication of likely future changes. Therefore, shorelines from a time before
permanent and significant engineering changes were made are not used in the calculation.
From Aransas Pass to the Padre Island National Seashore, shorelines prior to the jetty and
channel construction at Aransas Pass are not used. The dredged channel and jetties at
Aransas Pass, which were largely in place by 1911 (U.S. Army Corps of Engineers,
1992), interrupt southerly littoral drift affecting the long-term sediment budget along
Mustang Island. The enhanced tidal exchange through the pass may also affect the length
of time the storm surge channels of Packery, Newport, and Corpus Christi Passes remain
open after storms. Dredging and jetty maintenance at Aransas Pass has proceeded since
1911 and will continue for the foreseeable future. Therefore, shorelines used to determine
the average annual rate of shoreline change are from 1937, 1956/58/59, 1965/69, 1974,
1990/95, and 2000.
Figure 3 is a plot of the long-term average annual rate of shoreline change. The
shoreline is overall retreating with an area of stability or slight seaward advancement for
7 km of shoreline south of the Aransas Pass jetty, and in 2 local areas around the fish pass
and Corpus Christi Pass. The fish pass was dredged and jettied in August 1972. Even
11

though it closed naturally in 1979, the 2 rock jetties remain and extend seaward 160 m
from the 2000 shoreline. The jetties have interrupted the littoral drift causing stabilization
or slight advancement of the shoreline 1 km to the south and 0.5 km to the north. The
local stabilization of the shoreline around Corpus Christi Pass is anomalous and reflects
the closing of the pass in 1943 after having been dredged in 1938 (U. S. Army Corps of
Engineers, 1992).
There are 3 areas where moderate shoreline retreat is punctuated by relatively
high retreat rates. These areas are 7 to 11 km south of the Aransas Pass jetty, a 3 km area
around Newport Pass and a 3-km stretch of shoreline south of Bob Hall Pier. Inspection
of the beach profiles (appendix) reveals that the foredunes and secondary dunes are
generally lower in elevation in the high retreat areas compared to those in the relatively
stable areas. For example, NPI-07 is in an area with a retreat rate of almost 2 m/yr and the
foredune and secondary dunes have an elevation of about 4 m. Five kilometers to the
south at profile NPI-06 the retreat rate decreases to 0.5 m/yr and the dune complex
reaches about 7 m elevation. A similar comparison can be made between the relatively
high retreat rate, low-elevation profile at MUI-06 and the low retreat rate, high elevation
profile at MUI-05 (Fig. 1, appendix).
Discussion and Conclusions
Overall, the Gulf of Mexico Shoreline between Aransas Pass and the north
boundary of the Padre Island National Seashore is retreating. However, there are several
scales of alongshore variability in the average annual rate of shoreline change. Some of
this variability is caused by human alterations. Engineering modifications at Aransas Pass
have changed the sediment budget by trapping sand in the littoral drift system on both
sides of the pass. As a result, the shoreline position is more stable for a distance 6 km to
the south of the pass than it otherwise would be. Farther to the south of the pass, the
overall retreat of the shoreline is probably enhanced because of the sand trapping. The
modifications at Aransas Pass have also created a more efficient channel for tidal
exchange with Corpus Christi Bay. This effects shoreline dynamics along Mustang and
North Padre Islands by limiting the flow through the storm channels to the south causing
12

-50 -40 -30 -20 -10 South North Kilomete
0
rs Alongshore from Aransas Pass South Jetty
-3
-2
-1
0
1
2
Av
erag
e An
nual
Sho
relin
e C
hang
e R
ate
(m/y
r)R
etre
at
A
dvan
ce
Aransas Passsouth jetty
pier
fish pass
Corpus ChristiPass
Newport Pass
Packery Channel
seawall
Bob HallPier
Padre Island NationalSeashore north boundary
Figure 3. Long-term average annual rate of shoreline change. Six shorelines from 1937, 1956/58/59, 1965/69, 1974, 1990/95, and 2000 were used to determine rate of change based on a linear regression model.
13

them to close relatively quickly after storms. Modifications at Corpus Christi Pass and the
Corpus Christi Water Exchange Pass (fish pass) have had large but only local effects. The piers
and seawall have only caused minor alterations in the shoreline change rates (Fig. 3).
The most interesting variations in the average annual shoreline change rates are the areas
of relatively high retreat south of Bob Hall Pier, around Newport Pass, and 7 to 11 km south of
Aransas Pass. The cause of the higher retreat rates is not know specifically, but probably reflect
variations in littoral drift rates or the amount of wave energy reaching the shoreline. The better-
developed dunes in the low-retreat areas compared to the high-retreat areas suggest that the
dunes are storing greater amounts of sand in the low retreat areas, which may enhance even
further the high retreat rates along adjacent shorelines. The relationship between dune
development and long-term retreat rates will be further investigated using the detailed
topographic data from the LIDAR survey.
References
Crowell, M., Letherman, S. P., and Buckley, M. K., 1991. Historical shoreline change: error analysis and mapping accuracy. Journal of Coastal Research, 7, 839−852.
Hayes, M. O., 1967, Hurricanes as geological agents: case studies of Hurricanes Carla, 1961, and Cindy, 1963. Report of Investigations-No. 61, The University of Texas at Austin, Bureau of Economic Geology, 54 p.
Morton, R. A., and Pieper, M. J. 1977. Shoreline changes on Mustang Island and North Padre Island (Aransas Pass to Yarborough Pass) an analysis of historical changes of the Texas Gulf shoreline. Geological Circular 77-1, The University of Texas at Austin, Bureau of Economic Geology, 45 p.
Morton, R. A., 1993. Shoreline movement along developed beaches of the Texas Gulf coast: a user’s guide to analyzing and predicting shoreline changes: Open File Report 93-1, The University of Texas at Austin, Bureau of Economic Geology, 79 p., 1 map.
Paine, J. G., and Morton, R. A., 1989. Shoreline and vegetation-line movement, Texas Gulf Coast, 1974 to 1982. Geological Circular 89-1, The University of Texas at Austin, Bureau of Economic Geology.
14

U.S. Army Corps of Engineers, 1992. Inlets along the Texas Gulf coast. Planning Assistance to States Program Section 22 Report, U.S. Army Engineer District, Galveston Southwestern Division.
White, W. A., Calnan, T. R., Morton, R. A., Kimble, R. S., Littleton, T. G., McGowen, J. H., Nance, H. S., and Schmedes, K. E., 1983. Submerged lands of Texas, Corpus Christi area: sediments, geochemistry, benthic macroinvertebrates, and associated wetlands: Special Publication, The University of Texas at Austin, Bureau of Economic Geology.
15

Appendix
Plots of beach profiles and data tables. Plots are relative to the geoid as determined by converting
heights above the ellipsoid (HAE) to orthometric heights using the GEOID99 model.
16

-40 -20 0 20 40 60 80 100 120Distance (m)
0
2
4
6El
evat
ion
(m)
vertical exaggeration=6:1
MUI-01 (Mustang Island)February 1, 2001
-60 -40 -20 0 20 40 60 80 100 120Distance (m)
0
2
4
6
Elev
atio
n (m
)
vertical exaggeration=6:1
MUI-02 (Mustang Island)February 1, 2001
datum
vegetation lineberm crest wet/dry line berm crest
waterline (0843)
datumvegetation line berm crest
wet/dry linewaterline (1204)
~mean sea level
~mean sea level
17
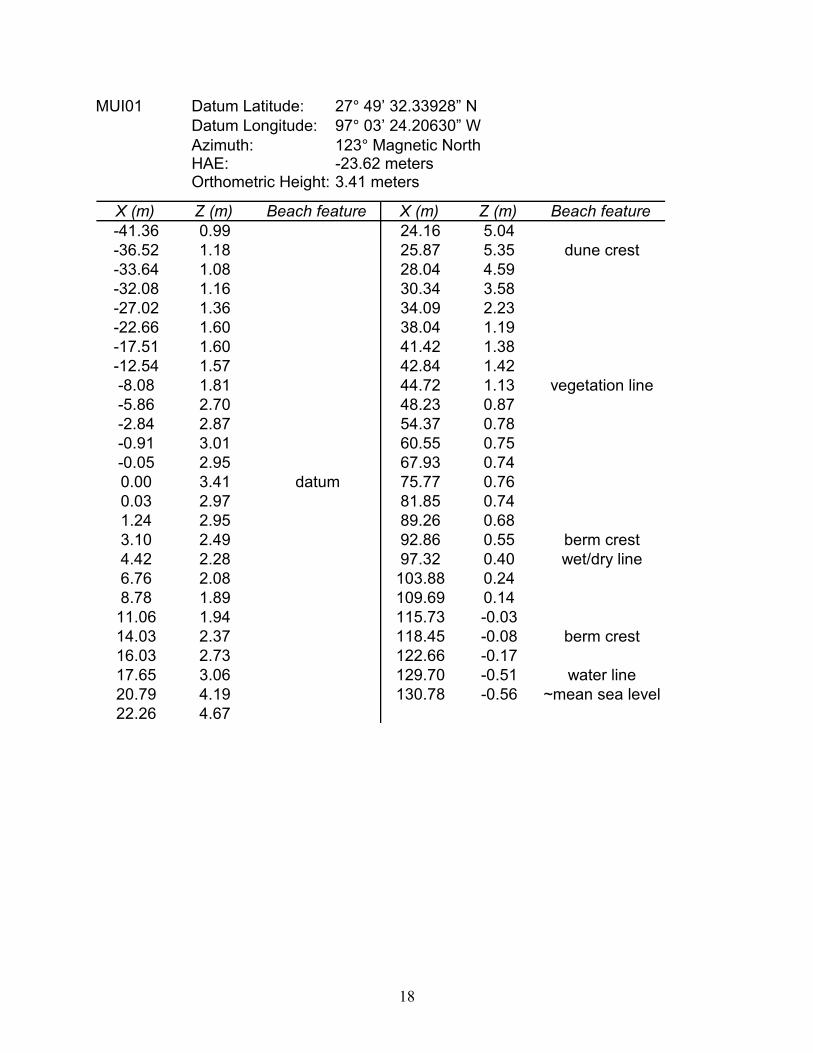
MUI01 Datum Latitude: 27° 49’ 32.33928” N Datum Longitude: 97° 03’ 24.20630” W Azimuth: 123° Magnetic North HAE: -23.62 meters Orthometric Height: 3.41 meters
X (m) Z (m) Beach feature X (m) Z (m) Beach feature-41.36 0.99 24.16 5.04-36.52 1.18 25.87 5.35 dune crest-33.64 1.08 28.04 4.59-32.08 1.16 30.34 3.58-27.02 1.36 34.09 2.23-22.66 1.60 38.04 1.19-17.51 1.60 41.42 1.38-12.54 1.57 42.84 1.42-8.08 1.81 44.72 1.13 vegetation line-5.86 2.70 48.23 0.87-2.84 2.87 54.37 0.78-0.91 3.01 60.55 0.75-0.05 2.95 67.93 0.740.00 3.41 datum 75.77 0.760.03 2.97 81.85 0.741.24 2.95 89.26 0.683.10 2.49 92.86 0.55 berm crest4.42 2.28 97.32 0.40 wet/dry line6.76 2.08 103.88 0.248.78 1.89 109.69 0.14
11.06 1.94 115.73 -0.0314.03 2.37 118.45 -0.08 berm crest16.03 2.73 122.66 -0.1717.65 3.06 129.70 -0.51 water line20.79 4.19 130.78 -0.56 ~mean sea level22.26 4.67
18
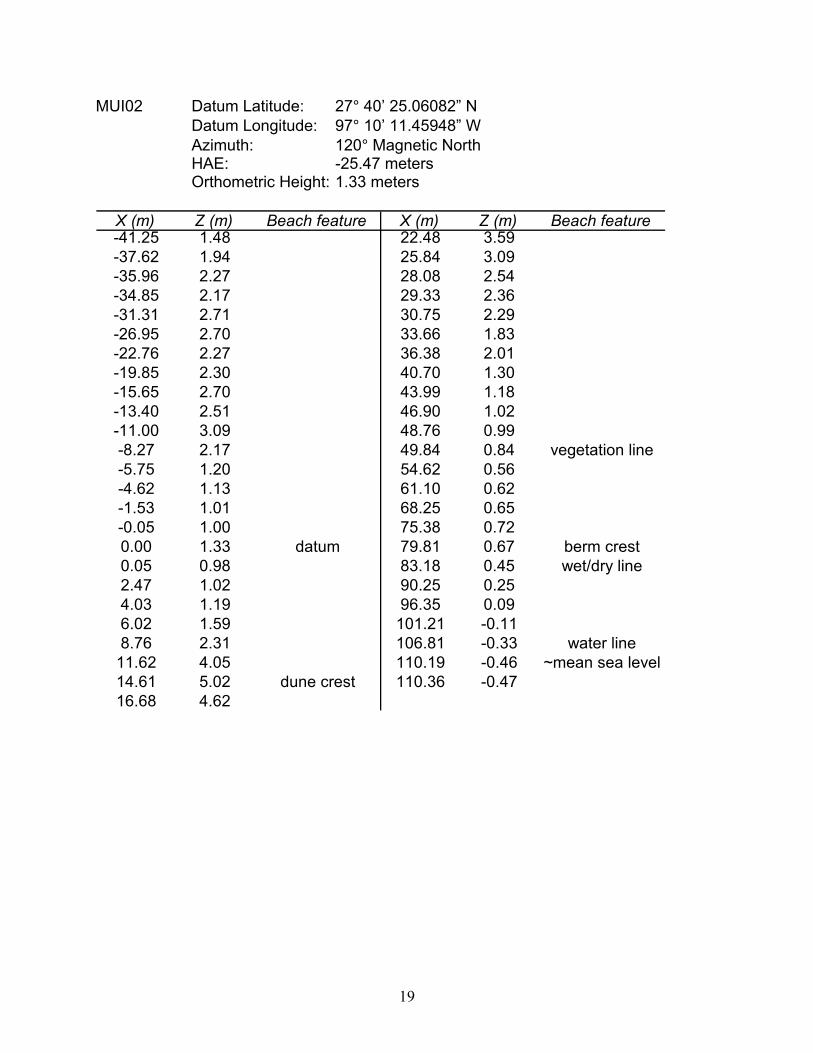
MUI02 Datum Latitude: 27° 40’ 25.06082” N Datum Longitude: 97° 10’ 11.45948” W Azimuth: 120° Magnetic North HAE: -25.47 meters Orthometric Height: 1.33 meters
X (m) Z (m) Beach feature X (m) Z (m) Beach feature-41.25 1.48 22.48 3.59-37.62 1.94 25.84 3.09-35.96 2.27 28.08 2.54-34.85 2.17 29.33 2.36-31.31 2.71 30.75 2.29-26.95 2.70 33.66 1.83-22.76 2.27 36.38 2.01-19.85 2.30 40.70 1.30-15.65 2.70 43.99 1.18-13.40 2.51 46.90 1.02-11.00 3.09 48.76 0.99-8.27 2.17 49.84 0.84 vegetation line-5.75 1.20 54.62 0.56-4.62 1.13 61.10 0.62-1.53 1.01 68.25 0.65-0.05 1.00 75.38 0.720.00 1.33 datum 79.81 0.67 berm crest0.05 0.98 83.18 0.45 wet/dry line2.47 1.02 90.25 0.254.03 1.19 96.35 0.096.02 1.59 101.21 -0.118.76 2.31 106.81 -0.33 water line
11.62 4.05 110.19 -0.46 ~mean sea level14.61 5.02 dune crest 110.36 -0.4716.68 4.62
19
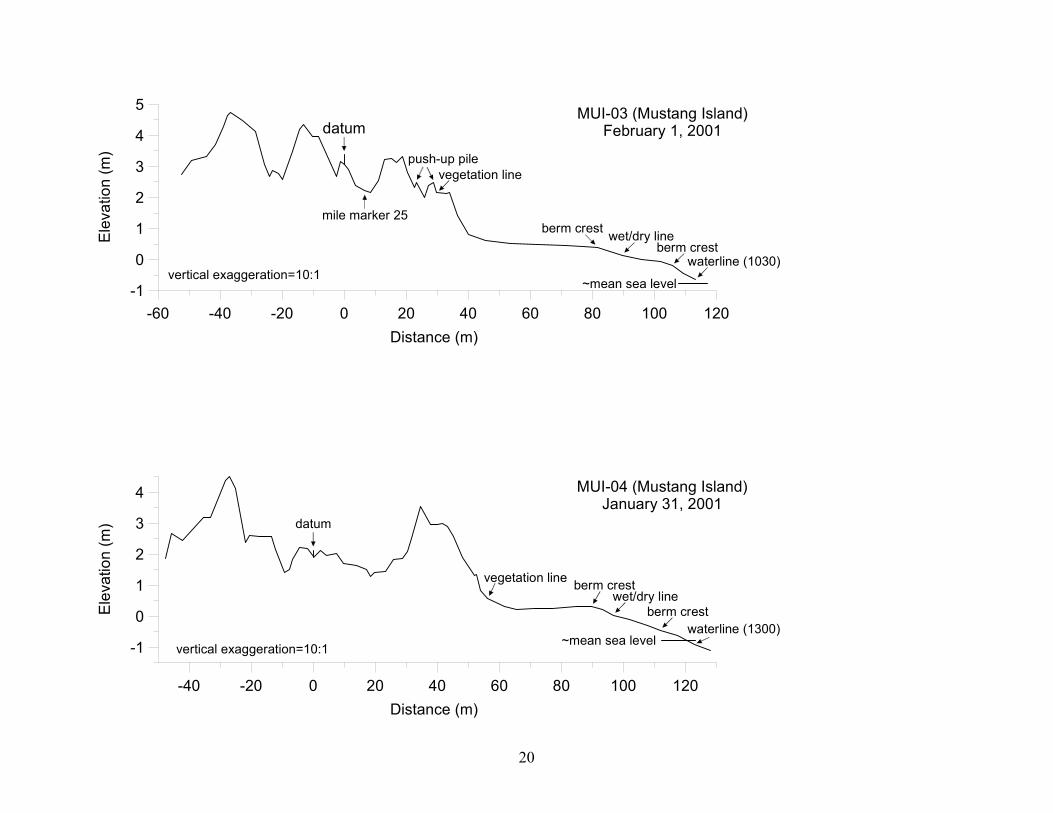
-60 -40 -20 0 20 40 60 80 100 120Distance (m)
-1
0
1
2
3
4
5El
evat
ion
(m)
vertical exaggeration=10:1
MUI-03 (Mustang Island)February 1, 2001
-40 -20 0 20 40 60 80 100 120Distance (m)
-1
0
1
2
3
4
Elev
atio
n (m
)
vertical exaggeration=10:1
MUI-04 (Mustang Island)January 31, 2001
datum
vegetation line berm crestwet/dry line
berm crestwaterline (1300)
datum
mile marker 25
push-up pilevegetation line
berm crest wet/dry lineberm crest
waterline (1030)
~mean sea level
~mean sea level
20
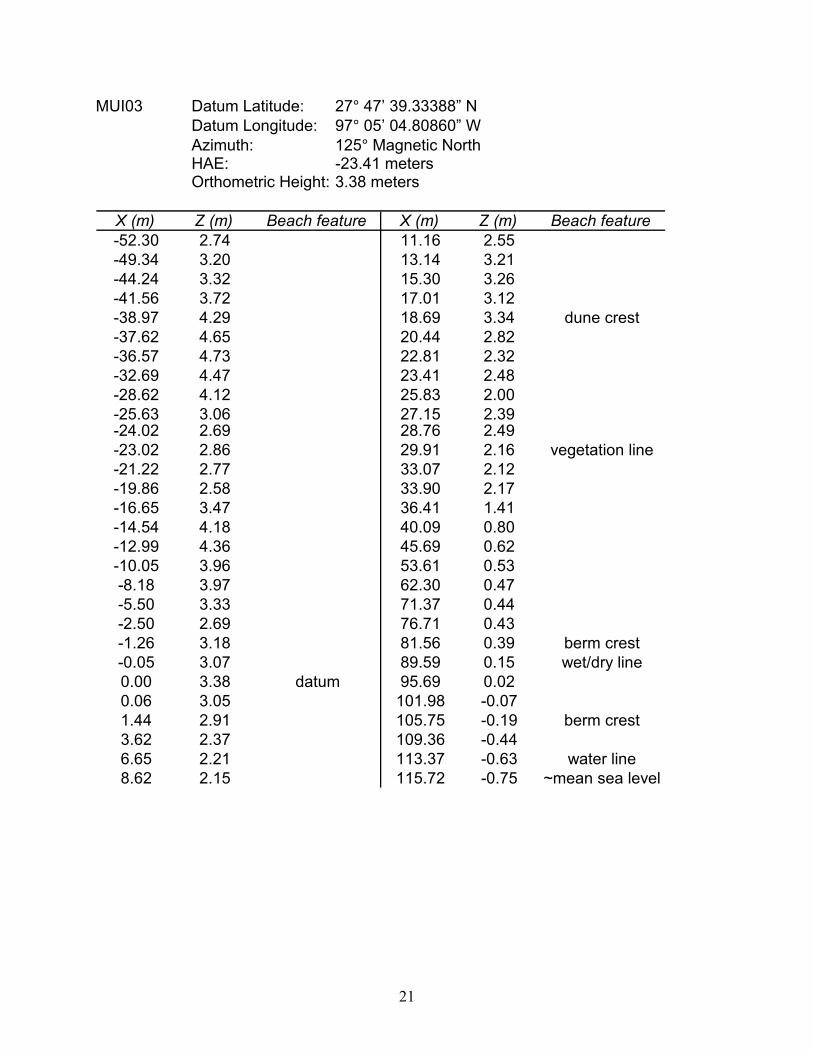
MUI03 Datum Latitude: 27° 47’ 39.33388” N Datum Longitude: 97° 05’ 04.80860” W Azimuth: 125° Magnetic North HAE: -23.41 meters Orthometric Height: 3.38 meters
X (m) Z (m) Beach feature X (m) Z (m) Beach feature-52.30 2.74 11.16 2.55-49.34 3.20 13.14 3.21-44.24 3.32 15.30 3.26-41.56 3.72 17.01 3.12-38.97 4.29 18.69 3.34 dune crest-37.62 4.65 20.44 2.82-36.57 4.73 22.81 2.32-32.69 4.47 23.41 2.48-28.62 4.12 25.83 2.00-25.63 3.06 27.15 2.39-24.02 2.69 28.76 2.49-23.02 2.86 29.91 2.16 vegetation line-21.22 2.77 33.07 2.12-19.86 2.58 33.90 2.17-16.65 3.47 36.41 1.41-14.54 4.18 40.09 0.80-12.99 4.36 45.69 0.62-10.05 3.96 53.61 0.53-8.18 3.97 62.30 0.47-5.50 3.33 71.37 0.44-2.50 2.69 76.71 0.43-1.26 3.18 81.56 0.39 berm crest-0.05 3.07 89.59 0.15 wet/dry line0.00 3.38 datum 95.69 0.020.06 3.05 101.98 -0.071.44 2.91 105.75 -0.19 berm crest3.62 2.37 109.36 -0.446.65 2.21 113.37 -0.63 water line8.62 2.15 115.72 -0.75 ~mean sea level
21
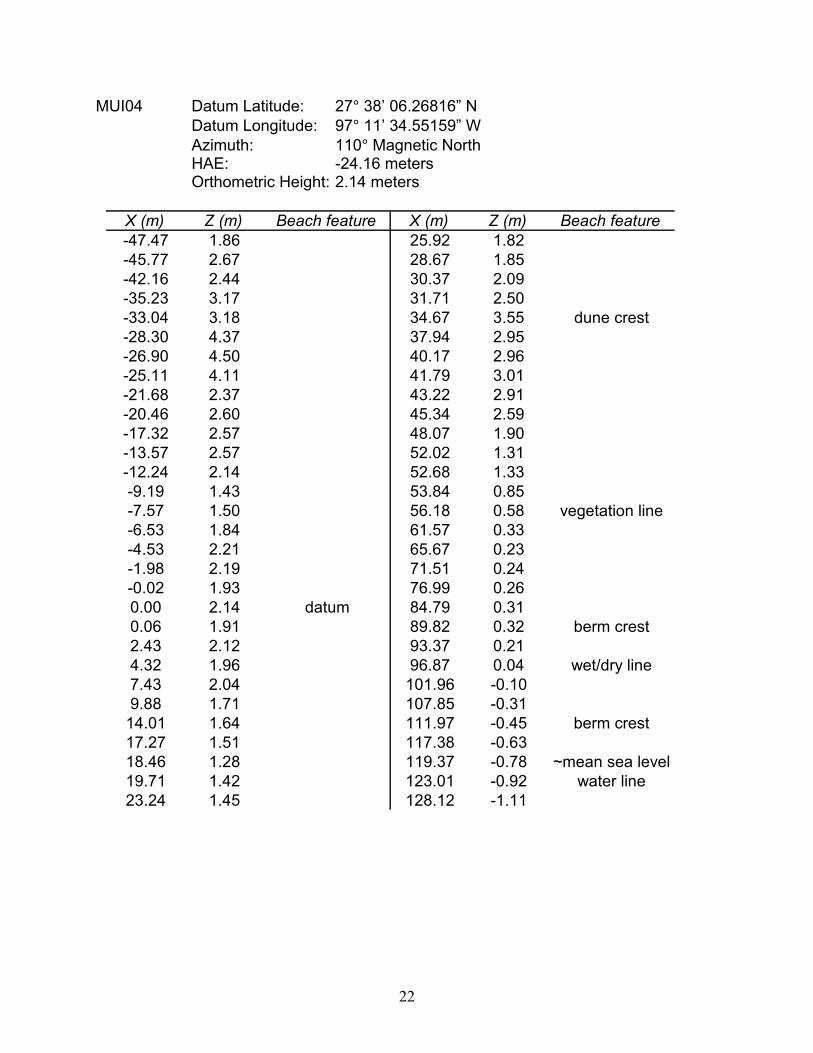
MUI04 Datum Latitude: 27° 38’ 06.26816” N Datum Longitude: 97° 11’ 34.55159” W Azimuth: 110° Magnetic North HAE: -24.16 meters
Orthometric Height: 2.14 meters
X (m) Z (m) Beach feature X (m) Z (m) Beach feature-47.47 1.86 25.92 1.82-45.77 2.67 28.67 1.85-42.16 2.44 30.37 2.09-35.23 3.17 31.71 2.50-33.04 3.18 34.67 3.55 dune crest-28.30 4.37 37.94 2.95-26.90 4.50 40.17 2.96-25.11 4.11 41.79 3.01-21.68 2.37 43.22 2.91-20.46 2.60 45.34 2.59-17.32 2.57 48.07 1.90-13.57 2.57 52.02 1.31-12.24 2.14 52.68 1.33-9.19 1.43 53.84 0.85-7.57 1.50 56.18 0.58 vegetation line-6.53 1.84 61.57 0.33-4.53 2.21 65.67 0.23-1.98 2.19 71.51 0.24-0.02 1.93 76.99 0.260.00 2.14 datum 84.79 0.310.06 1.91 89.82 0.32 berm crest2.43 2.12 93.37 0.214.32 1.96 96.87 0.04 wet/dry line7.43 2.04 101.96 -0.109.88 1.71 107.85 -0.31
14.01 1.64 111.97 -0.45 berm crest17.27 1.51 117.38 -0.6318.46 1.28 119.37 -0.78 ~mean sea level19.71 1.42 123.01 -0.92 water line23.24 1.45 128.12 -1.11
22
-40 -20 0 20 40 60 80 100 120Distance (m)
0
2
4
6El
evat
ion
(m)
vertical exaggeration=6:1
MUI-05 (Mustang Island)February 1, 2001
-20 0 20 40 60 80 100 120Distance (m)
-1
0
1
2
3
4
5
Elev
atio
n (m
)
vertical exaggeration=6:1
MUI-06 (Mustang Island)January 31, 2001
datum
vegetation lineberm crest
wet/dry lineberm crest
waterline (1348)
datum
vegetation linewet/dry line
waterline (1719)
~mean sea level
~mean sea level
23

MUI05 Datum Latitude: 27° 42’ 44.43636” N Datum Longitude: 97° 08’ 42.79258” W Azimuth: 115° Magnetic North HAE: -22.65 meters Orthometric Height: 4.21 meters
X (m) Z (m) Beach feature X (m) Z (m) Beach feature-30.35 2.59 23.81 3.84-28.64 2.92 27.73 3.05-25.91 2.64 31.51 2.47-23.43 2.55 35.38 2.31-22.00 2.54 38.76 3.27-18.23 3.01 41.97 3.89-13.16 3.56 43.12 3.99 dune crest-10.98 3.96 44.96 3.77-8.39 4.55 47.71 3.07-6.80 4.91 50.29 2.50-5.17 5.03 52.11 3.04-3.43 4.68 53.20 3.18-1.51 4.14 56.63 2.14-0.06 4.00 60.83 1.710.00 4.21 datum 61.77 1.41 vegetation line0.04 3.98 66.98 0.833.37 3.96 73.89 0.58 berm crest5.87 4.55 81.99 0.37 wet/dry line7.17 4.69 87.94 0.267.95 4.96 92.86 0.17 berm crest
10.46 5.39 97.80 0.0012.60 5.55 102.16 -0.2214.76 5.77 dune crest 105.60 -0.38 water line16.69 5.63 107.07 -0.43 ~mean sea level19.51 5.14 110.11 -0.54
24

MUI06 Datum Latitude: 27° 45’ 26.48189” N Datum Longitude: 97° 06’ 49.34206” W Azimuth: 115° Magnetic North HAE: -25.26 meters Orthometric Height: 1.67 meters
X (m) Z (m) Beach feature X (m) Z (m) Beach feature-15.45 1.44 32.69 1.91-13.79 1.50 37.37 1.84-11.30 2.29 40.80 2.15-9.35 2.70 44.42 4.00-7.43 2.87 47.15 3.11-3.49 1.96 49.72 1.63-0.07 1.46 52.26 1.09 vegetation line0.00 1.67 datum 56.89 0.860.04 1.46 63.09 0.672.58 1.50 68.86 0.604.67 1.72 74.66 0.45 wet/dry line5.81 1.99 82.11 0.227.33 2.06 89.60 0.109.95 3.22 95.60 -0.05
13.85 4.24 dune crest 99.97 -0.1916.54 4.13 103.38 -0.42 ~mean sea level20.75 3.56 104.40 -0.46 water line25.36 3.05 110.03 -0.6529.04 2.37
25
0 20 40 60 80 100 120 140Distance (m)
0
2
4
6
8El
evat
ion
(m)
vertical exaggeration=5:1
NPI-06 (North Padre Island)January 30, 2001
-80 -60 -40 -20 0 20 40 60 80 100 120 140Distance (m)
-1
0
1
2
3
4
5
Elev
atio
n (m
)
vertical exaggeration=10:1
NPI-07 (North Padre Island)January 30, 2001
datum
vegetation line
datum
vegetation lineberm crest
wet/dry lineberm crest
waterline (1632)
waterline (1310)
wet/dry lineberm crestberm crest
~mean sea level
~mean sea level
26

NPI06 Datum Latitude: 27 31 01.13077” N Datum Longitude: 97 15 18.86224” W Azimuth: 110° Magnetic North HAE: -19.10 meters Orthometric Height: 7.39 meters
X (m) Z (m) Beach feature X (m) Z (m) Beach feature-7.11 5.00 52.79 4.38-3.63 6.28 55.34 4.50-1.11 7.32 58.70 3.74-0.10 7.39 62.79 2.82-0.05 7.66 66.45 2.780.00 7.39 datum 67.54 3.051.46 7.36 dune crest 69.21 2.97 dune crest4.33 6.62 72.37 2.357.19 5.82 75.11 1.679.97 4.89 81.19 1.28 vegetation line
13.04 4.18 86.56 1.2817.41 4.13 93.20 1.1321.82 3.96 99.91 0.9824.06 4.36 104.29 0.95 berm crest27.11 4.67 110.35 0.72 wet/dry line29.10 5.07 115.95 0.5831.66 6.07 121.05 0.5833.86 6.72 122.16 0.56 berm crest36.70 6.88 125.64 0.4338.68 6.75 130.62 0.15 ~mean sea level40.23 6.58 131.01 0.1342.20 6.77 dune crest 136.89 -0.12 water line45.94 6.36 143.34 -0.3249.28 5.07
27

NPI07 Datum Latitude: 27° 33’ 18.91023” N Datum Longitude: 97° 14’ 06.69026” W Azimuth: 110° Magnetic North HAE: -24.73 meters Orthometric Height: 1.84 meters
X (m) Z (m) Beach feature X (m) Z (m) Beach feature-70.27 1.95 25.57 4.16-62.82 2.02 28.48 3.98-55.99 1.94 30.88 4.07 dune crest-52.16 1.92 34.62 3.58-47.79 2.18 38.47 2.42-45.27 2.28 41.77 1.88-40.56 2.58 45.72 1.64-37.99 2.83 50.22 2.80-33.00 2.74 52.16 2.92-27.87 2.63 54.49 3.55 foredune crest-24.49 2.44 59.04 2.71-20.69 2.12 61.81 2.22-15.78 2.00 65.85 1.20 vegetation line-10.83 1.78 70.92 0.89-6.23 1.85 76.26 0.89-2.76 1.57 82.55 0.83-0.07 1.51 88.26 0.780.00 1.84 datum 93.13 0.71 berm crest0.04 1.55 97.06 0.53 wet/dry line2.96 1.54 104.52 0.34 berm crest7.23 1.59 109.36 0.239.89 1.82 114.81 0.06
11.86 2.13 119.60 -0.1314.28 2.36 121.80 -0.25 ~mean sea level17.70 2.29 124.19 -0.38 water line19.62 2.58 128.70 -0.6023.48 3.51 133.12 -0.73
28

-40 -20 0 20 40 60 80 100Distance (m)
-1
0
1
2
3
4
5El
evat
ion
(m)
vertical exaggeration=6:1
NPI-08 (North Padre Island)January 31, 2001
datum
vegetation lineberm crest wet/dry line
berm crestwaterline (1041)
~mean sea level
29

NPI08 Datum Latitude: 27° 35’ 51.37036” N Datum Longitude: 97° 12’ 47.09885” W Azimuth: 110° Magnetic North HAE: -24.65 meters Orthometric Height: 2.01 meters
X (m) Z (m) Beach feature X (m) Z (m) Beach feature-38.69 3.39 25.63 2.33-35.04 3.60 27.47 2.46-33.06 3.47 29.40 2.39-29.29 2.75 31.27 2.69-25.33 2.73 34.21 3.27-23.53 2.66 37.03 3.54-20.62 3.02 38.83 4.00-18.11 2.58 41.04 4.12-13.96 2.54 44.29 4.25 dune crest-10.21 2.36 46.62 3.14-7.59 2.37 50.18 1.07 vegetation line-4.16 1.97 53.95 0.73-1.64 1.86 59.90 0.660.01 1.78 64.64 0.620.00 2.01 datum 68.82 0.56 berm crest0.04 1.77 72.18 0.451.40 1.70 77.82 0.35 wet/dry line2.98 1.48 83.52 0.275.66 2.15 88.88 0.13 berm crest8.55 2.98 93.02 -0.04
12.80 2.81 97.02 -0.25 ~mean sea level17.24 2.51 98.43 -0.33 water line20.48 2.26 101.92 -0.4922.09 2.42
30