Embed Size (px)
Citation preview
CHANGES IN FLORISTIC AND FUNCTIONAL COMPOSITION ON A COMPLEX OF GOLD TAILINGS
DAMS NEAR CARLETONVILLE, NORTH WEST PROVINCE, FROM 1996 TO 2014
Mike Maguranyanga
A research report submitted to the Faculty of Science, University of the Witwatersrand,
in partial fulfilment of the requirements for the Degree of Master of Science by
Coursework and Research Report.
Johannesburg
March 2016

ii
Declaration
I, Mike Maguranyanga, declare that this research report, apart from the contributions mentioned in the acknowledgements, is my own, unaided work. It is submitted for the Degree of Master of Science (MSc) by coursework and research report to the University of the Witwatersrand. It has not been presented before for any degree or examination to any other University.
…………………………………………..
(Signature of candidate)
…… day of ………2016 16th Sept
iii
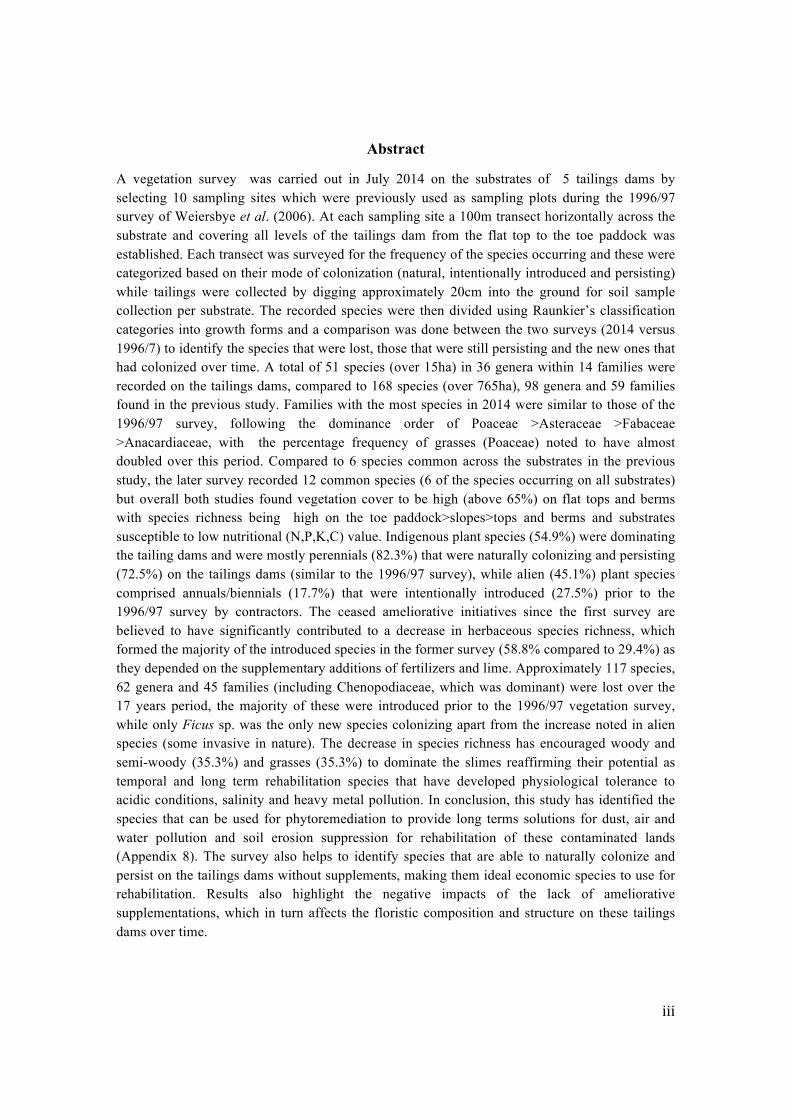
Abstract
A vegetation survey was carried out in July 2014 on the substrates of 5 tailings dams by selecting 10 sampling sites which were previously used as sampling plots during the 1996/97 survey of Weiersbye et al. (2006). At each sampling site a 100m transect horizontally across the substrate and covering all levels of the tailings dam from the flat top to the toe paddock was established. Each transect was surveyed for the frequency of the species occurring and these were categorized based on their mode of colonization (natural, intentionally introduced and persisting) while tailings were collected by digging approximately 20cm into the ground for soil sample collection per substrate. The recorded species were then divided using Raunkier’s classification categories into growth forms and a comparison was done between the two surveys (2014 versus 1996/7) to identify the species that were lost, those that were still persisting and the new ones that had colonized over time. A total of 51 species (over 15ha) in 36 genera within 14 families were recorded on the tailings dams, compared to 168 species (over 765ha), 98 genera and 59 families found in the previous study. Families with the most species in 2014 were similar to those of the 1996/97 survey, following the dominance order of Poaceae >Asteraceae >Fabaceae >Anacardiaceae, with the percentage frequency of grasses (Poaceae) noted to have almost doubled over this period. Compared to 6 species common across the substrates in the previous study, the later survey recorded 12 common species (6 of the species occurring on all substrates) but overall both studies found vegetation cover to be high (above 65%) on flat tops and berms with species richness being high on the toe paddock>slopes>tops and berms and substrates susceptible to low nutritional (N,P,K,C) value. Indigenous plant species (54.9%) were dominating the tailing dams and were mostly perennials (82.3%) that were naturally colonizing and persisting (72.5%) on the tailings dams (similar to the 1996/97 survey), while alien (45.1%) plant species comprised annuals/biennials (17.7%) that were intentionally introduced (27.5%) prior to the 1996/97 survey by contractors. The ceased ameliorative initiatives since the first survey are believed to have significantly contributed to a decrease in herbaceous species richness, which formed the majority of the introduced species in the former survey (58.8% compared to 29.4%) as they depended on the supplementary additions of fertilizers and lime. Approximately 117 species, 62 genera and 45 families (including Chenopodiaceae, which was dominant) were lost over the 17 years period, the majority of these were introduced prior to the 1996/97 vegetation survey, while only Ficus sp. was the only new species colonizing apart from the increase noted in alien species (some invasive in nature). The decrease in species richness has encouraged woody and semi-woody (35.3%) and grasses (35.3%) to dominate the slimes reaffirming their potential as temporal and long term rehabilitation species that have developed physiological tolerance to acidic conditions, salinity and heavy metal pollution. In conclusion, this study has identified the species that can be used for phytoremediation to provide long terms solutions for dust, air and water pollution and soil erosion suppression for rehabilitation of these contaminated lands (Appendix 8). The survey also helps to identify species that are able to naturally colonize and persist on the tailings dams without supplements, making them ideal economic species to use for rehabilitation. Results also highlight the negative impacts of the lack of ameliorative supplementations, which in turn affects the floristic composition and structure on these tailings dams over time.

iv
Keywords: Aerial cover, Macronutrients, Tailings dams, Species richness, Tailings Storage Facilities (TSFs) and Vegetation survey

v
Dedication
This research report is dedicated to Isabel Weiersbye and Prof Ed Witkowski for all the support they provided me with during my study period. I would also like to extend my appreciation to Maguranyanga. E (my dad) for his undying love and support since l started school. Lastly my special mention goes to ALL my friends for their support and love which kept me going.

vi
Acknowledgements
I would like to sincerely thank Prof E.T.F. Witkowski and I.M. Weiersbye for their helpful suggestions and expert advice which made this research a success. My appreciation also extends to the Ecological Engineering and Phytotechnologies Program (EEPP) group for the financial, social and professional support they made available for me to execute and complete my studies. Finally, I acknowledge the support of the South African National Research Foundation (NRF) through (1) their incentive funding to ETF Witkowski and the THRIP programme funding which enabled me to cover all the running expenses for the project.
vii
Table of Contents
Declaration ii Abstract iii Dedication v Acknowledgements vi Table of contents vii List of Figures ix List of Tables x Definition of terms xii Chapter 1 1.0 Introduction and Literature 1
1.1 Tailings dams 2 1.1.1 Tailings dams description 3
1.2 The influence of tailings on plant growth 4 1.3 Efforts made towards rehabilitation of tailings dams 5
1.3.1 Legislative instruments 7 1.4 Problem statement 8 1.5 Significance of the study 8 1.6 Broad objective 8
1.6.1 Specific objectives 8 1.7 Research questions 9
Chapter 2 2.0 Location
2.1 Description of the study site 10 2.2 Slime dam selection and classification 10 2.3 Sampling methods 12 2.4 Data classification 14 2.5 Data analysis methods 14
Chapter 3 3.0 Results 15
3.1 Average substrate pH 15 3.1.1 Average site pH 15
3.2 Percentage vegetation cover 16 3.3 Species richness 17 3.4 Temperature 18 3.5 Carbon 19 3.6 Organic carbon 20 3.7 Sulphur 21 3.8 Nitrogen 22 3.9 Electrical conductivity (EC) 23 3.10 Method of establishment (Natural vs Introduced) 24 3.11 Origin of plant species (Indigenous vs Alien) 25
viii
3.12 Species classification 27 3.13 Perennials vs Annuals/Biennials 28 3.14 Monocotyledons vs Dicotyledons 29 3.15 Comparison between the 1996/97 and 2014 vegetation surveys 29
Chapter 4 4.0 Discussion 32
4.2 Conclusion 36 4.3 Recommendations 37
References 38
Appendices 43
ix
LIST OF FIGURES
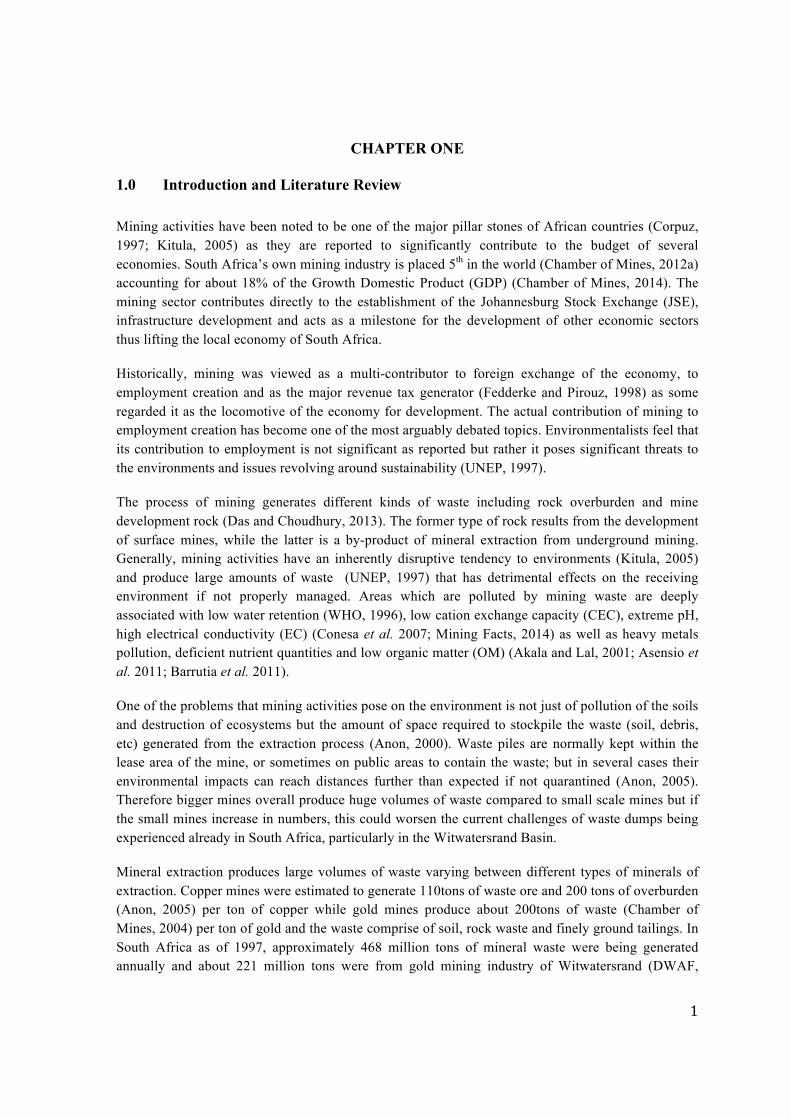
Figure 1: Aspect of a gold tailings dam subdivided into different substrates levels (Source: Weiersbye et al. 2006). 2
Figure 2: A photograph showing the sample area in Carletonville at the AngloGold Ashanti
West Wits tailings dams. The marked structures with dots are tailings dams that were used in selecting the 10 sampling sites for the 2014 survey. 10
Figure 3: Photographic collection showing the pipes that were used as referral points on each site in marking the 100m belt transects on the tailings dams. 13
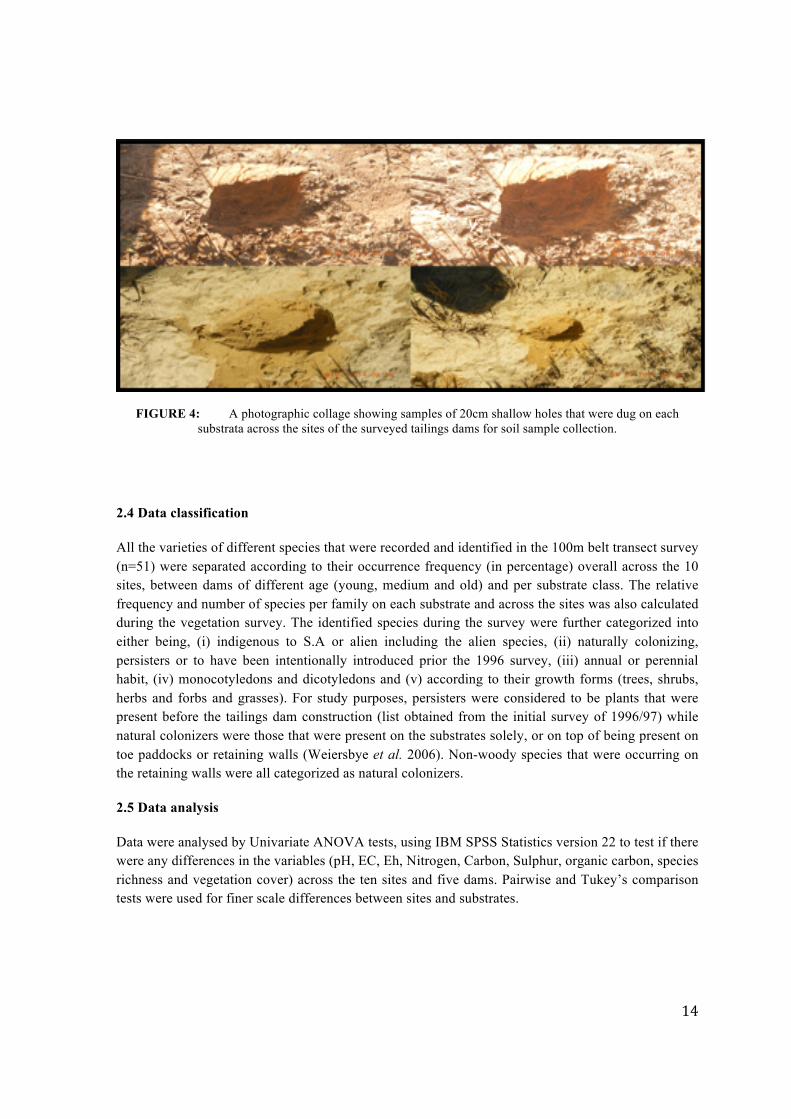
Figure 4: A photographic collage showing samples of 20cm shallow holes that were dug
on each substrata across the sites of the surveyed tailings dams for soil sample collection. 13
Figure 5: Graphs showing mean substrate pH left (substrates ordered from top to the bottom) and site pH right (dams numbered from young active to old dormant) from the collected soils samples. 15
Figure 6: Graphs showing mean substrate plant vegetation cover left (substrates ordered from top to the bottom) and site plant vegetation cover right (dams numbered from young active to old dormant ) from the collected soils samples. 16
Figure 7: Graphs showing mean substrate species richness, left (substrates ordered
from top to the bottom) and site mean species richness right (dams numbered from young active to old dormant ) from the collected soils samples. 17
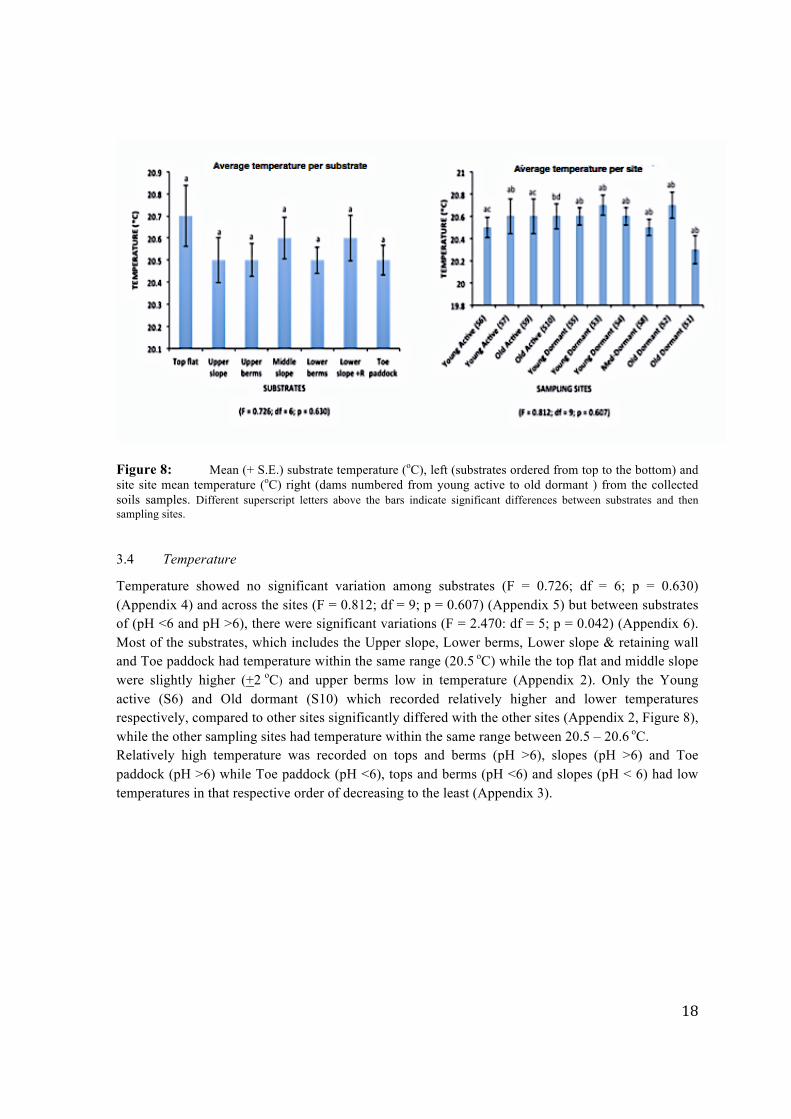
Figure 8: Graphs showing mean substrate temperature (oC), left (substrates ordered from top to the bottom) and site mean temperature (oC) right (dams numbered from young active to old dormant ) from the collected soils samples. 18
x
LIST OF TABLES
Table 1: Average percentage carbon recorded from soil samples that were collected on all substrates of each sampling site (sites listed from young active to old dormant) on the AGA Carletonville tailings dams 19
Table 1a: Average percentage carbon recorded from soil samples that were collected on all substrates of each sampling site (substrates listed from the top to the bottom) on the AGA Carletonville tailings dams 19
Table 2: Average percentage organic carbon recorded from soil samples that were collected on all substrates of each sampling site (sites listed from young active to old dormant) on the AGA Carletonville 20
Table 2a: Average percentage organic carbon recorded from soil samples that were collected on all substrates of each sampling site (substrates listed from the top to the bottom) on the AGA Carletonville 20
Table 3: Average percentage sulphur recorded from soil samples that were collected on all substrates of each sampling site (sites listed from young active to old
dormant) on the AGA Carletonville 21
Table 3a: Average percentage sulphur recorded from soil samples that were collected on all substrates of each sampling site (substrates listed from the top to the bottom) on the AGA Carletonville 21
Table 4: Average percentage nitrogen recorded from soil samples that were collected on all substrates of each sampling site (sites listed from young active to old
dormant on the AGA Carletonville 22 Table 4a: Average percentage nitrogen recorded from soil samples that were collected
on all substrates of each sampling site (substrates listed from the top to the
bottom) on the AGA Carletonville 22
Table 5: Average electrical conductivity (EC) recorded from soil samples that were
collected on all substrates of each sampling site (sites listed from young
active to old dormant) on the AGA Carletonville 23
Table 5a: Average electrical conductivity (EC) recorded from soil samples that were
collected on all substrates of each sampling site (substrates listed from
the top to the bottom) on the AGA Carletonville 23
Table 6: Percentages of naturally colonizing, persisting and introduced plants species
on each substrate class for the sampled tailings dams. Values in parentheses
are the actual number of taxa identified (species, subspecies and
varieties, n = 51). 24
Table 7: Percentage of taxa occurring on particular substrates within plant families
(n=14) during 2014 survey. Values in brackets are the actual number of
species found. 26

xi
Table 8: Categorization of plants species recorded on the West Wits tailings dams in percentages. Values in parentheses are actual number of species found. 27
Table 9: Percentage occurrence of the monocotyledon and dicotyledon plant species found on the tailings dams. Values in the parentheses are actual numbers of species and subspecies. 28
Table 10: A summary table showing a comparison of results obtained between the 1996/97 and the 2014 vegetation survey that was done in Carletonville at the AngloGold Ashanti gold tailings in the North West Province. 30

xii
ABBREVIATIONS
GDP - Growth Domestic Product JSE - Johannesburg Stock Exchange EC - Electrical Conductivity UNEP - United Nations Environment Program CEC - Cation Exchange Capacity WHO - World Health Organization DWAF - Department of Water Affairs OM - Organic Matter TSF - Tailings Storage Facility AGA - AngloGold Ashanti
S A - South Africa
xiii
DEFINITION OF TERMS
Dormant tailings dams - these were dams that showed no sign of fresh deposits (grey material) and were confirmed to have not been utilized at least 2 years’ prior conducting the 2014 study. Such dams showed a grey- red color particularly on top which is a sign of long time of oxidation and were very dry.
Active tailings dams - all dams that showed clear signs of fresh deposits that were grey in color with wet soils were treated as active. Some of these had not been utilized for depositing atleast for a year prior the study but were now being deposited with slimes again.
Mean of means - this referred to the value obtained after summing up the individual site means and divide them by ten (10) or adding all the means per substrate and divide them by seven (7).
Short – lived perennials - these plants persist for several years and then decline and fade away.
Biennials - plants that have a lifecycle with a span of two years. Then normally flower and produce seeds in their second year.
Annuals - plants that goes through their whole lifecycle in one growing season.
Perennials - these are plants that can survive in frost temperatures and live for more than two years.
Plant vegetation cover - percentage of ground surface covered by vegetation
Climate variability - The way climate fluctuates yearly above or below a long-term average value.
1
CHAPTER ONE
1.0 Introduction and Literature Review
Mining activities have been noted to be one of the major pillar stones of African countries (Corpuz, 1997; Kitula, 2005) as they are reported to significantly contribute to the budget of several economies. South Africa’s own mining industry is placed 5th in the world (Chamber of Mines, 2012a) accounting for about 18% of the Growth Domestic Product (GDP) (Chamber of Mines, 2014). The mining sector contributes directly to the establishment of the Johannesburg Stock Exchange (JSE), infrastructure development and acts as a milestone for the development of other economic sectors thus lifting the local economy of South Africa.
Historically, mining was viewed as a multi-contributor to foreign exchange of the economy, to employment creation and as the major revenue tax generator (Fedderke and Pirouz, 1998) as some regarded it as the locomotive of the economy for development. The actual contribution of mining to employment creation has become one of the most arguably debated topics. Environmentalists feel that its contribution to employment is not significant as reported but rather it poses significant threats to the environments and issues revolving around sustainability (UNEP, 1997).
The process of mining generates different kinds of waste including rock overburden and mine development rock (Das and Choudhury, 2013). The former type of rock results from the development of surface mines, while the latter is a by-product of mineral extraction from underground mining. Generally, mining activities have an inherently disruptive tendency to environments (Kitula, 2005) and produce large amounts of waste (UNEP, 1997) that has detrimental effects on the receiving environment if not properly managed. Areas which are polluted by mining waste are deeply associated with low water retention (WHO, 1996), low cation exchange capacity (CEC), extreme pH, high electrical conductivity (EC) (Conesa et al. 2007; Mining Facts, 2014) as well as heavy metals pollution, deficient nutrient quantities and low organic matter (OM) (Akala and Lal, 2001; Asensio et al. 2011; Barrutia et al. 2011).
One of the problems that mining activities pose on the environment is not just of pollution of the soils and destruction of ecosystems but the amount of space required to stockpile the waste (soil, debris, etc) generated from the extraction process (Anon, 2000). Waste piles are normally kept within the lease area of the mine, or sometimes on public areas to contain the waste; but in several cases their environmental impacts can reach distances further than expected if not quarantined (Anon, 2005). Therefore bigger mines overall produce huge volumes of waste compared to small scale mines but if the small mines increase in numbers, this could worsen the current challenges of waste dumps being experienced already in South Africa, particularly in the Witwatersrand Basin.
Mineral extraction produces large volumes of waste varying between different types of minerals of extraction. Copper mines were estimated to generate 110tons of waste ore and 200 tons of overburden (Anon, 2005) per ton of copper while gold mines produce about 200tons of waste (Chamber of Mines, 2004) per ton of gold and the waste comprise of soil, rock waste and finely ground tailings. In South Africa as of 1997, approximately 468 million tons of mineral waste were being generated annually and about 221 million tons were from gold mining industry of Witwatersrand (DWAF,
2
2001; Chamber of Mines, 2004) making it the largest single source of waste (Oelofse et al. 2007b). Open cast mining has been reported to be pollution intensive compared to underground mining method with studies carried out estimating it to generate waste that is eight – ten times more than that from underground mining (Anon, 2000; 2005). As the high-grade minerals deposits depletes approaching finite, the extraction process produces more waste as the lower grade reserves are utilized (Anon, 2003).
Waste produced from the processing of ore after grinding and milling is in the form of slurry (Ritcey, 1989; Anon, 2000; 2003) commonly referred to as tailings/slimes and is stored in the Tailings Storage Facilities (TSF) sometimes referred to as Tailings Dam or Tailings Management Facility (TMF) to prevent land contamination and pollution although in most cases they always find their way into the environment. As a result of the boom increase that was once experienced during the gold era of Egoli, these tailings drastically increased particularly in the Witwatersrand Basin. An estimate of 120 dumps covering an area of about 400km2 in the goldfields of the Witwatersrand (AngloGold Ashanti, 2004; Weiersbye et al. 2006; Oelofse et al. 2007b) have been identified comprising approximately 6 billion tons of uranium and gold tailings (Chevrel et al. 2003). Due to poor planning and lack of suitable disposal site availability, this has resulted in some of the tailings dams being placed on natural pans, wetlands and catchment areas as well as water courses leading to extreme cases of pollution (Meerts and Grommesch, 2001) when waste and mine process water is disposed into pans and unprotected evaporation dams.
Several investments and energy has been channelled towards establishing the chemical and physical composition of the tailings and remarkable success has been achieved through short and long term studies that have been done in several countries across the globe including South Africa. Some of the local studies (Witkowski and Weiersbye 1998a; Weiersbye et al. 1999; Winde et al. 2004a,b; Weiersbye and Cukrowska 2005) that have been done have enabled researchers and environmental managers to develop and implement different trial treatments in a bid to rehabilitate the polluted areas and tailings dams.
1.1 Tailings dams layout
FIGURE 1: Aspect of a gold tailings dam subdivided into different substrate levels. Source: Weiersbye et al. (2006)
3
1.1.1 Tailings dam description
Tailings are a result of mineral processing and beneficiation which produces slurry (Anon, 2005: Weiersbye et al. 2006). The type of ore as well as the physical and chemical methods used to extract the target product has been noted to determine the characteristics of the tailings (Anon, 2000; 2003). Although ores differ from mineral to mineral, tailings constitute of the common problematic elements such as pyrite, arsenic, calcite, barite, cyanide, mercury, fluorite and quartz (Bradshaw et al. 1978; Walder and Chavez, 1995; Boulet and Larocque, 1998; Witkowski and Weiersbye, 1998; Weiersbye et al. 2006).
Tailings have become a growing concern in the mining sector, all issues emanating from their chemical composition that includes toxic compounds that have detrimental effects on the human health and safety and as well as disastrous impacts on the environment. A number of factors are considered in designing the TSF. These include, (i) selecting the most suitable site, (ii) method of storage to be used as well as (iii) the method of discharging the waste that is applied (Ritcey, 1989). The physical conditions of the ground and the nature of the surrounding environment have an influential role in the TSF’s methods of construction thus the linked processes from designing to decommissioning of the TSFs (Ripley, 1996). Baseline studies are used in determining the impacts of the TSF construction on all aspects of the environment (EC, 2004) which includes the social, economic and the associated risk of operation (Vick, 1990; EC, 2004).
Despite having all the above mentioned factors being considered before construction of the TSF (Figure 1), to mitigate and minimise chances of TSFs failures, events of dam failure continue to be recorded with the most recent being in Brazil in 2015. These tailings then stream flow into the environment as either runoff or seepage (Garcia et al. 2005) resulting in soil contamination and land pollution (Vick, 1990; EC, 2004). The process by which the environment becomes polluted from the contamination of the tailings is called Acid Mine Drainage (AMD) (Garcia, et al. 2005) and this can have detrimental impacts on the environment (Vick, 1990; Witkowski and Weiersbye, 1998; Anon, 2005) as well as the vegetation communities (Donahue, et al. 1990). Some of the environmental implications other than AMD include contamination of the streams as a result of surface run-off from impounded areas, contamination of water and air due to erosion of solidified tailings, aesthetic modification to the environment and dust pollution from the dried-out tailings from the slopes as the presence of pyrite is not conducive for vegetation growth on TSFs thus increased dust levels in the nearby areas (Oelofse et al. 2007b).
Cases of AMD have been on the rise particularly in the Witwatersrand Basin since the time tailings dams have been noted to be on the increase (McKenna et al. 2003). The continuous modernization of mining technologies as well as rehabilitation techniques over the years seeks to address this and initiatives of reprocessing and reclaiming the mine dumps (tailings dams) using modernized technologies such as Reuse and Reprocess (R2), etc.
4
1.2 The influence of tailings on plant growth
Gold tailings constitute of major problematic sulphide of the conglomerate together with galena, pyrrhotite, chalcopyrite, arsenopyrite and cobaltite (Anhaesser, 1987; Weiersbye, et al. 2006). These sulphides when oxidised form sulphates and strong acids that have detrimental impacts and effects on the environment. Such compounds alter soil chemical composition making it toxic while lowering the pH to inhospitable conditions for plant establishment (Witkowski and Weiersbye, 1998; Weiersbye et al. 2006; Smirnova et al. 2009).
The deposition of sulphides and heavy metals into the environment alters the physio-chemical properties of the soils (Witkowski and Weiersbye, 1998a). Tailings waste result in acidic conditions in the soil which in-turn influences the availability of the present nutrients to the plants creating nutritional imbalances in the soils (Witkowski and Weiersbye, 1998a). Apart from the chemical alteration, tailings particles are small in size (clay size), fine in texture (Clausen, 1973) and siliceous in nature. This results in poor aeration of the tailings dams due to high levels of compaction in the soil (Clausen, 1973) leading to lower microbial activity (Wong, 1985 and Harris et al. 1996;) thus the absence of organic matter which is an essential component in the soil that improves soil fertility and plant growth. Slimes contain primary compounds (pyrophyllite and quartz) that are unreactive, which when coupled with lack of organic matter in the slimes, affects the cation exchange capacity (CEC) as well as the pH (Bosch, 1987). In turn this determines the nutrients that can be released to the plants for utilization.
When exposed to water and air due to the large surface area of the dams, the tailings are oxidised, producing sulphuric acid and ferric hydroxide (James and Mrost, 1965). The yellow colour of the old tailings dams is a result of this iron in the ferric hydroxide. A steep gradient in pH and acidity is noted across the slope with the gradient dropping from the upper slope (top) to the toe paddock (Witkowski and Weiersbye, 1998a and Weiersbye et al. 2006). Changes in pH across the slope can also be identified by marking the changes in vegetation occurrence in the form of horizontal belts across the slopes which respond to the shifts in soil chemical properties (Witkowski and Weiersbye, 1998a).
Poor aeration in the soil, lack of organic matter or macronutrients, alkaline pH (of fresh slimes) and salinity and high toxicity from heavy metals, will collectively have a negative effect, contributing to poor soil structure and infertility of the TSFs (Johnson and Bradshaw, 1977; Witkowski and Weiersbye, 1998a). The poor soil structure in TSFs then inhibits microbial activity in the soils (Wong, 1985; Harris et al. 1996; Straker et al. 2008) making tailings dams poor environments for growth of most plants (Mendez et al. 2007). Lower microbial activity leads to slower decomposition and nitrogen mineralization rates, thus influencing nutrient availability to plants (Wong, 1985; Straker et al. 2008). Slopes have been reported to have lower number of species because of the gradient which makes them more vulnerable to soil erosion and nutrient leaching (Witkowski and Weiersbye, 1998a) thus limiting the species occurrence.
Alkaline tailings, in some instances may have little vegetation available on them but these are mostly grasses of Eragrostis and Hyparrhaenia spp. (Gaff, 1971; Krzaklewski and Pietrzykowski, 2002; Weiersbye et al. 2006). On acidic tailings, the microbial activity is extremely low as well as the
5
number of species and carbon utilization compared with soils that have not been contaminated (Moynahan et al. 2002). Mine tailings microbial community is predominated by sulphur oxidizing and autotrophic iron bacteria is often associated with plant death in acidic tailings (Schippers et al. 2000). Studies that were carried out (Weiersbye et al. 1998; Straker et al. 2006a, b, c; Straker et al. 2008) showed that majority of the plants that were occurring on the tailings were infected by arbuscular mycorrhizal (AM) fungi and it is slime-tolerant AM fungi that significantly contribute to host plant survival and growth in acidic slimes (Weiersbye et al. 1998; Straker et al. 2006c). The majority of the indigenous hard-seeded legumes and compatible tolerant rhizobia have also been found to positively influence the growth and survival of plant species on the tailings dams. Only species that have developed physiological and adaptive traits to tolerate the toxicity of heavy metals, acidic conditions, salinity as well as high tolerance to low moisture and low nutrient levels will persist and grow vigorously on the tailings dams (Witkowski and Weiersbye, 1998b). Intensified research has been done on the subject of using phytoremediation to stabilize polluted lands and containing tailings (Das and Choudhury, 2013). Findings of the studies show that woody and semi-woody and grass species of genera Tamarix, Acacia, Rhus, Asparagus and Eragrostis exhibited no signs of physiological stress despite growing on the slimes (Gaff, 1971; Weiersbye et al. 1998; Witkowski and Weiersbye, 1998; Dharamraj et al. 1999; Angus, 2005; Weiersbye et al. 2006)
Polluted or soils contaminated by heavy metals from the tailings tend to have an inhibition effect on the soil formation processes and plant growth (Johnson and Bradshaw, 1977; Harris et al. 1996; Witkowski and Weiersbye, 1998a; b). Limited growth is experienced in plants on degraded lands such as on the slimes as there is no continuous supply of nutrients due to lack of organic matter (Harris, et al. 1996). On the other hand, in polluted soils plant growth is actually restricted by the toxicity of the heavy metals (Zinc, Nickel, Lead and Copper) (Wong, 1987). In addition, mining processes heavily disturb natural ecosystems by periodically burying the surface soil layers, which makes it difficult for vegetation to colonize these areas again after mining activities (Bradshaw, 2000).
As a result of the tailings dams being inhospitable to most intolerant plants (plant species that cannot resist toxicity on the tailings), only tolerant species are found on the tailings dams based on the (i) season of the year, (ii) nature of the slope and (iii) the chemical properties of the soil from the parent material (Wong, 1985). According to Southam and Beveridge (1992) and Mendez et al. (2007), tailings dams are familiar in supporting the growth of highly stressed heterotrophic microbial community with studies of Weiersbye et al. (2006), showing that more vegetation is found on the top, flat berms and on the base (lower slope and toe paddock) than on the slopes across the 7 substrata of the tailings slopes (see Figure 1).
1.3 Efforts made towards rehabilitation of Tailings Dams
The need to maintain a healthy environment for sustainable development has across the world pushed most institutions and organizations to seek the most effective ways of rehabilitating these disturbed areas, particularly with mining activities. This has seen the crafting of new and stringent legal instruments, revision of management plans, enforcement of the policies and laws for compliance to ideal set standards as well as the adoption of modern technologies.
6
From the studies that were carried out across the globe, it has been noted that apart from the factors mentioned earlier that influence plant growth on tailings dams, tailings vegetation establishment in arid and semi-arid regions are affected by physicochemical attributes (Munshower, 1994). These attributes include the high temperatures on the tailings dam surface, high winds and low precipitation, which all adds to the building of excessive salt concentrations (22 dS/m) (Munshower, 1994). High evaporation rates and low water infiltration tendencies (hence high run-off – which increases with slope steepness) also contributes to increased salinity levels which negatively impact the growth of any vegetation.
Due to poor fertility of the tailings dams, trials have been done to improve the fertility of the soils by fertilization and irrigation of the tailings dams (Weiersbye et al. 2006). The main goal in doing this was to be able to have vegetation on the slopes to reduce the air and dust pollution in windy conditions as well as limiting soil erosion (Warburst, 2000; Morris et al. 2003; US EPA, 2004; Gonzalez and Gonzalez-Chavez 2006). An estimated value of 500 tons ha-1yr-1 of soil is lost on steep slopes of tailings dams compared to the 15 tons ha-1yr-1on agricultural lands (Blight, 1991). This is because the tailings dams are erected well above the natural contours of the ground thus making them more susceptible to wind erosion (Mizelle et al. 1996), but in addition the slopes are much steeper than the surrounding natural terrain. The impacts of erosion and AMD from the gold tailings dams have been reported to have detrimental impacts on the soil nutrient cycles (Witkowski and Weiersbye, 1998a), biogeochemical cycle of potential waste elements (Weiersbye, et al. 1999 and Weiersbye and Cukrowska, 2005) and the growth of vegetation (Witkowski and Weiersbye, 1998b and Weiersbye and Witkowski, 2003).
The implementation of new remedial programmes and execution of research studies have been helpful in addressing the issues of pollution from the mines as well as the contamination of the soils by heavy metals. But the topic at the centre of study over the years is on phytoremediation (US EPA, 1997) which encourages the use of exotic and indigenous plants to stabilize and rehabilitate disturbed areas.
From the studies that have been executed on phytoremediation till now it has been experimentally demonstrated that grassing of slopes less than 18ᶿ is cheaper than the current slopes of greater than 30ᶿ (Weiersbye and Witkowski, 1996; 1998a). Slopes with a gradient of less than 18ᶿ have been reported to have lower rates of erosion, extending the life span of grasses and thus reducing irrigation needs (Weiersbye and Witkowski, 1996). From 1994 – 2002 it was estimated that grassing trials on steeper slopes (>15º) cost between R 70 000 – R160 000 ha-1 compared to the R 10 000 – R70 000ha-1 on flat tops, thus making it uneconomic (Weiersbye et al. 2006).
This method of revegetating the tailings dams using readily available pasture grasses (i.e. with commercially available seeds) was deemed unsustainable and uneconomic (Witkowski and Weiersbye, 1998a, b; Weiersbye, et al. 2006). This is because grasses provide cover which is temporal (Halliday, 1978) thus its control measures on erosion becomes temporal (Blight, 1991). Grasses on tailings also require continuous maintenance, irrigation and fertilization (Weiersbye et al. 2006) making it costly. Despite this, grasses have been recommended due to their rapid ability to spread in space over a short time rather than their functional effectiveness (Thatcher, 1979), and this
7
has seen the continuous use of grasses for short term erosion and water pollution control methods (Rosner et al. 2001).
Apart from the grasses, quite a number tolerant plant species have been used to rehabilitate the degraded areas due to their evolutionary traits other than their inherent physiological tolerance (Bradshaw, 1993). The list includes grasses of Cynodon dactylon (Wong, 1982), Festuca rubra, Phragmites australis and Typha latifolia (Wong and Lau, 1985; Ye et al. 1998b) which have been reported to be effective in phytostabilization programmes of Australia and UK. In China, areas contaminated with lead (Pb)/zinc (Zn) have been identified to have Vetiveria zizanioides grass (Shu et al. 2000), Sesbania rostrata a legumenous herb (Yang et al. 1997), and Leucaena leucocephala a woody legume (Zhang et al. 2001).
The use of V. zizanioides has been successful for the rehabilitation of soils contaminated by heavy metals and for the treatment of leachate from the landfills using greenhouse and field trials in Queensland area of Australia (Truong and Baker, 1988). Some species and clones of trees such as willows and poplars have been reported to be effective in removing quite a significant amount of heavy metals, and thus can be found present on the tailings dams (Truong and Baker, 1988).
Apart from these recommended species approved through laboratory trials, some indigenous species have also been noted to have developed adaptive traits allowing them to persist on the slopes of the tailings dams. Such species have been identified through periodic vegetation surveys on the TSFs and contaminated areas (Weiersbye, et al. 2006) and have been used for trials in other areas of similar contamination for phytoremediation. These include some species of Tamarix, Rhus and Eucalypts which have either been introduced and have developed ecological traits for survival or that have naturally colonized the area.
1.3.1 Legislative instruments
Most of the mine tailings dump sites of arid and semi-arid areas in the world are either from inactive or abandoned mine sites (Munshower, 1994) in Northern Mexico, Western United States, Western India, Australia and South Africa (Tordoff et al. 2000).
The need to conserve and protect the environment for sustainability has seen formulation, revision and implementation of statutory and legislative instruments. This has helped to fulfil the principles of the National Environmental Act 36 (1998) of “Precautionary, Preventative and Polluter pays Principles” by stipulating standards of operation in the environment and requirements on specified mode of operations on the environment. Such Acts also apprehend the polluters and make sure they are held responsible for cleaning of the pollutants from the environment. Other legal frameworks put forward include the Environmental Conservation Act 73 (1989), Biodiversity Act No. 10 of 2004; Air Quality (AQ) Act No. 39 of 2004 and the National Environmental Management Act (NEMA): Protected Areas (PA) Act No. 57 of 2003 with Amendment Act No. 46 of 2003. The Conservation of Agricultural Resources Act (CARA), No. 43 of 1983 also forms part of the important pieces of legislation that provides the standards and procedures on controlling weeds and invasive plants.
The broad aim of this research was to identify the species that were occurring on the 7 substrata (upper slope, upper berms, middle slope, middle berms, lower slope, toe paddocks and the retaining
8
walls) of the West Wits (Mponeng and Savuka 7A,7B and 5A) tailings dams. The identified species would then be classified into their functional groups as well as estimating vegetation cover on the ground at each slope level. Colonizing behaviour (persisters or natural colonizers) of the present species was also used to categorize the species into different groups. The results obtained would be compared to those of Weiersbye, et al. (2006) to see if there are any changes in the vegetation structure and composition on the tailings dams. The AngloGold Ashanti Mines (West Wits) in the Witwatersrand Basin of South Africa were used as the study sites.
1.4 Problem Statement
Tailings storage facilities (TSFs) are storage sites for waste from the gold and uranium mining industry which is generated after processing. These TSFs contain of problematic mineral elements that make the soils unsuitable for plant establishment and due to poor permanent vegetation cover to stabilise the soils on TSFs. This results in contamination and pollution of surrounding environments. Vegetation growth on the tailings dams helps to reduce erosion and dust and air pollution from the tailings particles which would be blown off the TSFs in sites with poor vegetation cover. Poor nutritional value in tailings soils makes them far from ideal for plant establishment and growth. Hence the industry needs to have raised environmental awareness to prevent pollution and improve rehabilitation success. TSFs are elevated well above the natural ground contours with steeper slopes making them more susceptible to erosion and pollution. Tailings dams cover a huge area of the South Africa’s deep-level mines thus causing a major concern from a biodiversity conservation perspective. As a result of few species being tolerant to the hostile conditions on the tailings dams, there is a need to continuously carry out vegetation surveys to identify suitable and resistant species for each locality. This would also help to determine which species have been persistent since 1996/7, to identify any new colonizing species since then, and the ones that have been lost.
1.5 Significance of the study
The weak soil structure, heavy metals contamination, poor aeration as well as lack of organic matter in the tailings dams makes them hostile and far from ideal for plant establishment and growth. A lack of organic matter and poor soil aeration results in very low microbial activity. The consequence is the establishment of only a temporary, short-lived, colonization/vegetation cover by plants. Only plants that develop tolerance traits to the harsh conditions have been reported to persist on the tailings dams. Over a period of time, some species are lost while others colonize the open space; this then requires a study of this nature to identify the changes in vegetation and species composition by doing vegetation surveys periodically. Hence, this study becomes highly relevant for ongoing rehabilitation efforts as it will provide information on the species present, those lost as well as any new species that have colonized the tailings dams since the first survey that was done in 1996/7 (Weiersbye, et al. 2006)
1.6 Objectives
The main aim of this study was to investigate the changes that have occurred in the floristic and functional composition of the gold tailings dams of AngloGold Ashanti (AGA) near Carletonville in the North West Province since the first survey that was done in 1996. A comparison of the results obtained from the two individual studies (1996/97 and 2014) would be done to identify the species
9
that have been lost, those that have developed physiological tolerance to the prevailing environmental stresses as well as the new species that colonized the tailings during this period.
1.6..1 Specific objectives
1. To identify the species occurring on the substrates (upper slope, upper berms, middle slope, middle berms, lower slope, toe paddocks and the retaining walls) of the tailings dams.
2. Classify the identified species into functional groups (trees, shrubs, forbs, grasses and herbs), colonizing behaviour (natural colonisers or persisters) and estimate vegetation basal cover of the slope.
3. Compare the results from this study to those of Weiersbye et al. (2006) to ascertain whether there are any new species that have colonized the slopes and record the species that have been lost since the 1996-7 survey.
4. To determine if there are any differences in pH, organic matter and selected nutrient elements between substrates and across the sites.
1.7 Research questions
1. Which families and genera are the most frequently occurring on the tailings dams? 2. Which functional groups in terms of growth forms (trees, shrubs, forbs, grasses and herbs), and
type of colonizers are dominant on the different substrates of the tailings dams? 3. Are there any differences between the results obtained from this survey and that of Weiersbye et
al. (2006)? 4. Are there any differences in the pH, organic matter and concentration of selected nutrient
elements between substrates and across the sampling sites?
10
CHAPTER 2
2.1 Description of the study site
The study was carried out during early (June –July) winter of 2014 on deep –level gold mines of AngloGold Ashanti in the Witwatersrand Basin, North West province of South Africa. A single dam at Mponeng mine and 3 dams at Savuka were used as sampling sites (see Figure 2). The sites are located at the geographical coordinates of latitude 26θ25ˈ24.5ʺ S extending to 26θ 26ˈ 10ʺ S and longitude 25θ 25ˈ 14ʺ E extending to 27θ 25ˈ 50ʺ E. The tailings dams occur on rocky quartzite, shale and dolomitic soils that are acidic (Acocks, 1988; Mucina and Rutherford, 2006; Weiersbye et al. 2006). Located 75km southwest of Johannesburg, Carletonville occurs in the grassland biome with an altitude of 1600 – 1650m above sea level (a.s.l) (Weiersbye and Witkowski, 2002a). The soils are in the C6 and C7 subdivisions with the vegetation composition of xeric grasslands (Gh 15) and the savanna of Acacia karoo (Acocks, 1988; Weiersbye and Witkowski, 2002a; Mucina and Rutherford, 2006).
The surveyed area has a climate that is seasonal receiving mean annual precipitation (m.a.p) of 662mm (Schulze, 1997; Rutherford et al. 2006a; Weiersbye et al. 2006). Mean annual precipitation fluctuates between years with variation of ±165.5 – ±198.6mm from the mean (Weiersbye et al. 2006). Extreme temperatures are a characteristic of this area with minimum and maximum temperatures reached in July (0-2 oC) and January (25-27.5 oC) respectively (Schulze, 1997; Rutherford et al. 2006a). Veld fires and frosts are frequent during winters with mean frost days between 150 -175 being recorded annually (Rutherford et al. 2006). The study area experiences high evaporation, which doubles and almost triples the amount of rainfall, received (Schulze, 1997), thus making the area dry resulting in frequent fires experienced in this area. The common features in the area include degraded areas with little vegetation cover (wastelands) and swampy lands flooded with waste from tailings dams (Weiersbye et al. 2006). Livestock production that includes cattle and game farming forms the major land uses supported by crop farming of maize and sunflower (Rutherford et al. 2006a; Weiersbye et al. 2006).
2.2 Slime dam selection and classification.
The tailings dams were differentiated in terms of physical appearance (age) and to a lesser extent by
the chemistry of the substrate (Straker et al. 2007; Weiersbye et al. 2006; Witkowski and Weiersbye,
1998). Tailings dams that were used for the study are those that were previously used during the 1996
survey so as to enable a superimposed vegetation comparison of the same 100m transects over time.
Not all the tailings dams that were sampled during the first survey could be sampled as most of them
had been modified and some demolished thus only 5 dams (1 in Mponeng and 4 in Savuka) were
selected for the survey (Figure 2; Appendix 7).
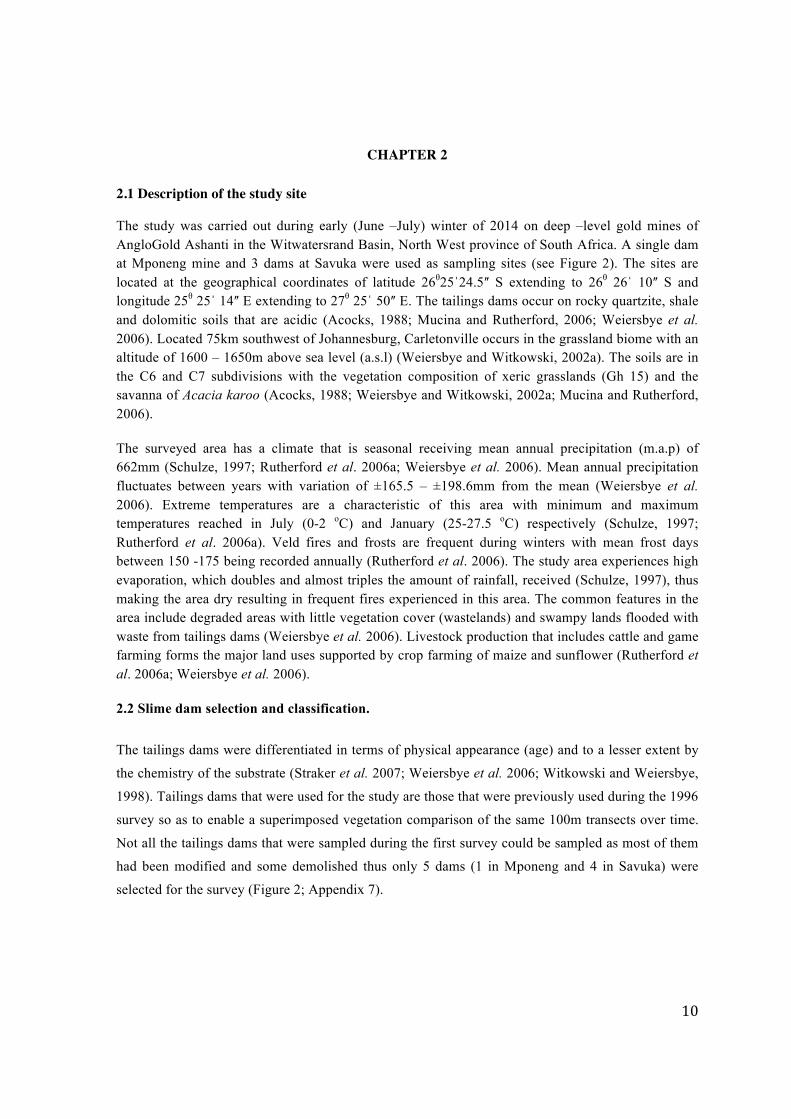
11
FIGURE 2: A photograph showing the sample area in Carletonville at the AngloGold Ashanti West Wits tailings dams. The numbered structures (with yellow dots) are tailings dams that were used in selecting the 10 sampling sites for the 2014 survey. (Source – Google Earth)
The age of the tailings dams could not be verified but differences in vegetation composition and soil (tailings colour) was used to differentiate the age of dams. It was assumed that the young dams were those that had greyish soils across all the slopes while the medium aged showed greyish upper slopes with red bottom made of sand. Dams that were regarded as old dams, which looked red-orange in colour across all substrates, are in an oxidation state. The current activity at each dam (active or dormant) was used to classify the tailings dams into different classes.
According to the historical information that was obtained from the contractors, all the dams had not
been vegetated and ameliorated at least 8 years before the 2014 survey. The list of species that were
previously introduced (intentionally) and naturally colonizing prior the 1996 survey were obtained
from the list of species that were recorded during the first vegetation survey of Weiersbye et al. 2006.
Poor record keeping made it difficult to establish the actual age of the current existing dams. As a
result, the physical characteristics like soil colour and the vegetation composition structure were used
to categorize the tailings dams. Other features that were used to classify the dams were the remains of
old plantings and irrigation pipes (Witkowski and Weiersbye, 1998a). A total of 10 transects were
chosen as sampling sites with nine of them having grassing attempts ceased prior the 1996/97 survey.
Only transect/site seven showed recent evidence of repeated grassing attempts. These could be
evidenced by the grasses that were occurring in complexes of mixed species, suggesting that some
attempts had been repeated and failed (Weiersbye et al. 2006).

12
The physical and chemical properties in substrates were used to subdivide the slope into different
classes (Figure 1; Weiersbye et al. 2006). In descending order of the substrates, the slope comprised
of the flat tops, upper slope and berm, middle slope, lower berms and slope, retaining wall and the toe
paddocks. Retaining walls are made of soil and rock which is mixed with slimes while a toe paddock
is a small patch of grassland that is usually between 20 – 60 m wide surrounding the bottom of the
dam. In most cases (particularly in young and active dams), toe paddocks are usually covered in
slimes making them lower in pH (strongly acidic) and frequently damp (Witkowski and Weiersbye,
1998a). During the survey, it was difficult to separate the retaining walls and the lower slope as a
result of the grey slimes covering the substrates making them appear as one thing. Thus during the
survey, the results were amalgamated as lower slope & retaining wall. When slimes are deposited,
their initial pH is alkaline (10 – 12). This is due to the chemicals that are used in the processing but
after exposure to oxygen for some time, they are oxidised becoming acidic. Tailings dams that have
been dormant and in-active for longer periods generally have pH which is strongly acidic (Weiersbye
et al. 2006). Substrates that are far from the source of slimes (lower slope, retaining wall and toe
paddock) have a pH that is acidic while those close to the top (upper slope and upper berms) are
alkaline. On active dams, the top flat area is usually alkaline but may become acidic as a result of
oxidation especially on in-active dams.
2.3 Sampling methods
A list of species that were intentionally introduced, naturally colonizing and persisting on the tailings
dams prior the 1996/97 survey was obtained from the compiled list in Weiersbye et al. 2006
publication (Comparison study). Information regarding the last vegetating trials was gathered from
the contractor (Brian Dawson) who was onsite and vegetation reports (Weiersbye and Witkowski,
1998 – unpublished) to AngloGold Ashanti. A replicate survey of 100m line transects across the 10
different sites occurring on five tailings dams were done during winter (July 2014) for two weeks.
The line transects were identified and marked using the transportation pipes on the slopes (mostly on
the corner of the dam) as reference starting points (the method used in during the 1996 survey)
(Figure 3). Ten transects that were selected occurred on at least five separate tailings dams with each
aspect represented (Appendix 1) in selecting sites. Approximately 70 different slopes with equal
number of toe paddocks were thoroughly assessed during the survey across the 10 sites, particularly
on the toe paddocks and lower slope & retaining walls.
The survey comprised of small-scale vegetation cover assessments, identification and classification of
the vegetation structure into different functional groups (grasses, forbs and herbs, trees and shrubs)
and species composition (frequency of each family and species) on the 70 slopes. All the data that
were recorded from the 100m belt transects were categorically separated into 7 substrates on the
13
tailings dam (Figure 1). The frequency of each species present on the tailings dams was recorded and
for species that could not be identified in the field, representative specimens were collected and
pressed for identification. Specimens that were collected were identified using plant guides of Coates-
Palgrave (1996), Retief and Herman (1997) and making a comparison with the specimens at the
University of Witwatersrand APES C.E. Moss Herbarium.
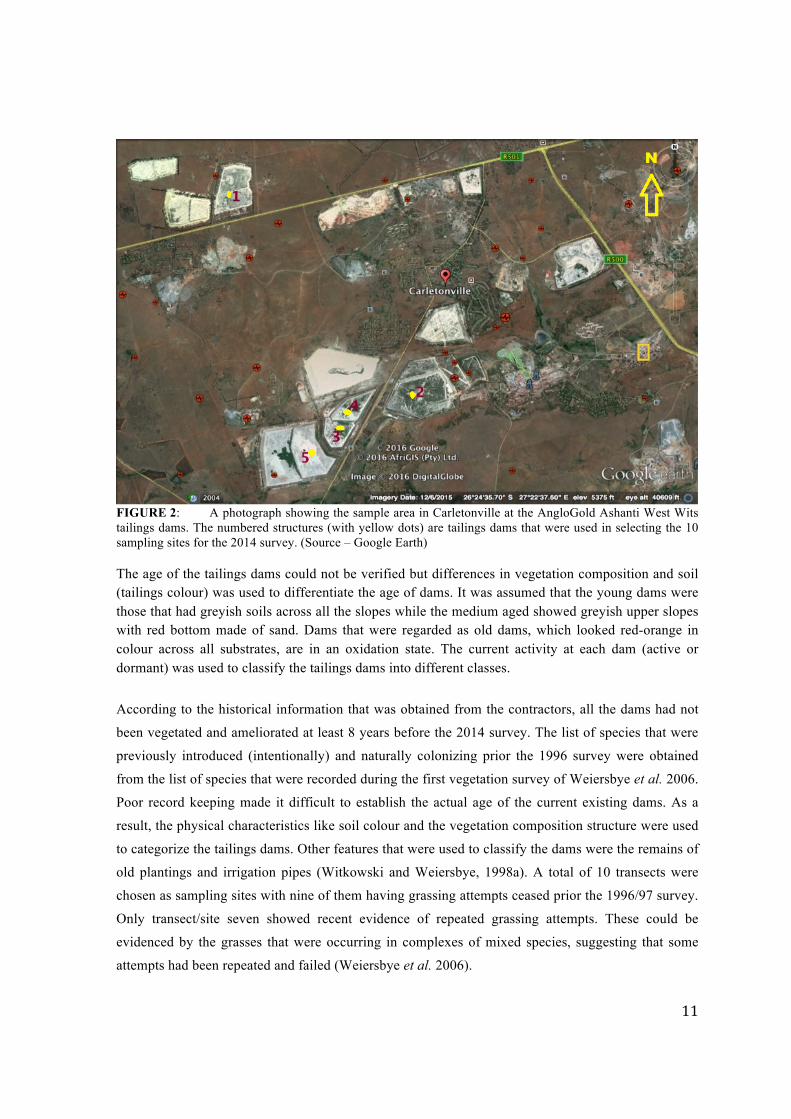
Plant vegetation cover was estimated using the visual estimation method within 100m line transects.
This involved walking along each substrate horizontally marking 5 m rectangular plots and using
visual estimation to score the overall percentage vegetation cover within each plot. Overall vegetation
cover referred to the total cover of all species without singling out each species.
FIGURE 3: Photographs showing examples of the study sites, as well as the pipes that were used as referral points on each site in marking the 100m belt transects on the tailings dams. (Top Left – Site 2; Top Right – Site 8; Bottom Left – Site 6 7 Bottom Right – Site 9). These were superimposition of the 1996/97
transects.
Soil samples that were collected from cut boxes between 10-20cm deep (Figure 4) from the 70 slopes
across the sites were packed into small polyethylene plastics for transportation. Soil samples were
kept in the cold storage room to avoid development of fungi. The samples were later analyzed for
conductivity, salinity, pH and temperature using standard methods of Anderson and Ingram, (1993),
organic carbon (Walkley- Black) (Jackson, 1973) and macronutrients (Nitrogen, Carbon, Sulphur)
(Chapman and Pratt, 1961)
14
FIGURE 4: A photographic collage showing samples of 20cm shallow holes that were dug on each substrata across the sites of the surveyed tailings dams for soil sample collection.
2.4 Data classification
All the varieties of different species that were recorded and identified in the 100m belt transect survey (n=51) were separated according to their occurrence frequency (in percentage) overall across the 10 sites, between dams of different age (young, medium and old) and per substrate class. The relative frequency and number of species per family on each substrate and across the sites was also calculated during the vegetation survey. The identified species during the survey were further categorized into either being, (i) indigenous to S.A or alien including the alien species, (ii) naturally colonizing, persisters or to have been intentionally introduced prior the 1996 survey, (iii) annual or perennial habit, (iv) monocotyledons and dicotyledons and (v) according to their growth forms (trees, shrubs, herbs and forbs and grasses). For study purposes, persisters were considered to be plants that were present before the tailings dam construction (list obtained from the initial survey of 1996/97) while natural colonizers were those that were present on the substrates solely, or on top of being present on toe paddocks or retaining walls (Weiersbye et al. 2006). Non-woody species that were occurring on the retaining walls were all categorized as natural colonizers.
2.5 Data analysis
Data were analysed by Univariate ANOVA tests, using IBM SPSS Statistics version 22 to test if there were any differences in the variables (pH, EC, Eh, Nitrogen, Carbon, Sulphur, organic carbon, species richness and vegetation cover) across the ten sites and five dams. Pairwise and Tukey’s comparison tests were used for finer scale differences between sites and substrates.
15
CHAPTER 3
RESULTS
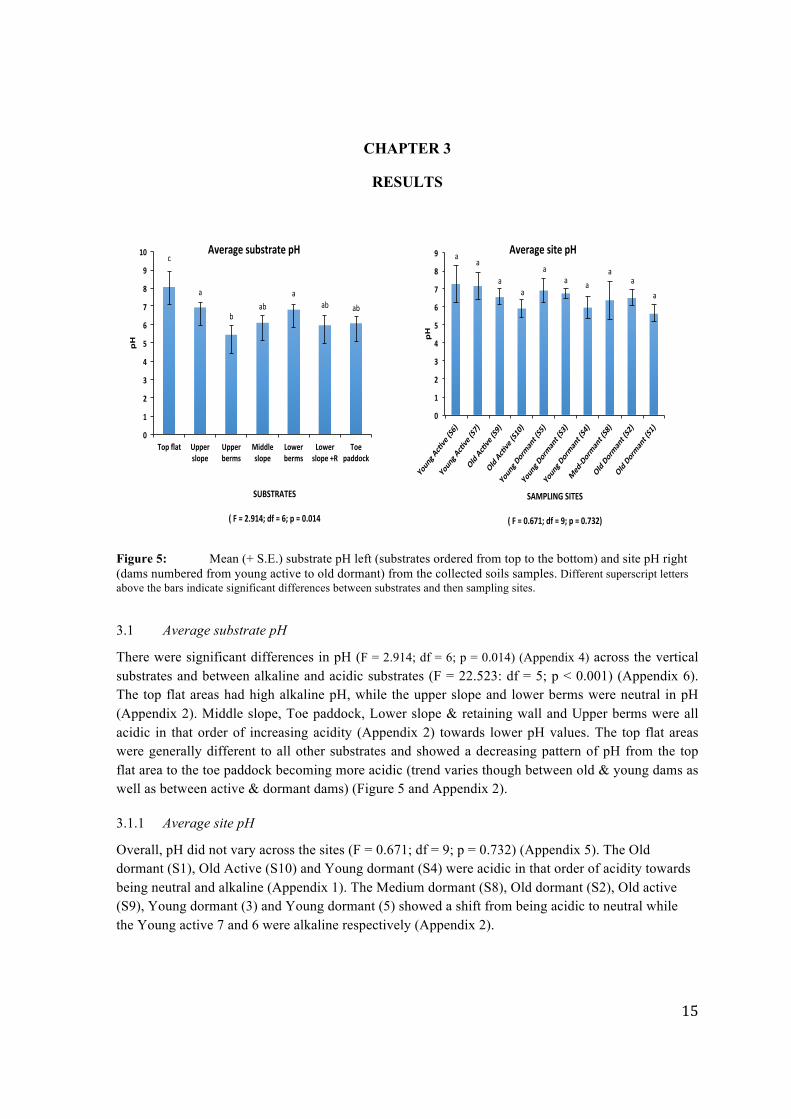
Figure 5: Mean (+ S.E.) substrate pH left (substrates ordered from top to the bottom) and site pH right (dams numbered from young active to old dormant) from the collected soils samples. Different superscript letters above the bars indicate significant differences between substrates and then sampling sites.
3.1 Average substrate pH
There were significant differences in pH (F = 2.914; df = 6; p = 0.014) (Appendix 4) across the vertical substrates and between alkaline and acidic substrates (F = 22.523: df = 5; p < 0.001) (Appendix 6). The top flat areas had high alkaline pH, while the upper slope and lower berms were neutral in pH (Appendix 2). Middle slope, Toe paddock, Lower slope & retaining wall and Upper berms were all acidic in that order of increasing acidity (Appendix 2) towards lower pH values. The top flat areas were generally different to all other substrates and showed a decreasing pattern of pH from the top flat area to the toe paddock becoming more acidic (trend varies though between old & young dams as well as between active & dormant dams) (Figure 5 and Appendix 2).
3.1.1 Average site pH
Overall, pH did not vary across the sites (F = 0.671; df = 9; p = 0.732) (Appendix 5). The Old dormant (S1), Old Active (S10) and Young dormant (S4) were acidic in that order of acidity towards being neutral and alkaline (Appendix 1). The Medium dormant (S8), Old dormant (S2), Old active (S9), Young dormant (3) and Young dormant (5) showed a shift from being acidic to neutral while the Young active 7 and 6 were alkaline respectively (Appendix 2).
aa
aa
aa a
aa
a
0
1
2
3
4
5
6
7
8
9
YoungAc3ve(S6)
YoungAc3ve(S7)
OldAc3ve(S9)
OldAc3ve(S10)
YoungDormant(S5)
YoungDormant(S3)
YoungDormant(S4)
Med-Dormant(S8)
OldDormant(S2)
OldDormant(S1)
pH
SAMPLINGSITES
(F=0.671;df=9;p=0.732)
AveragesitepHc
a
bab
aab ab
0
1
2
3
4
5
6
7
8
9
10
Topflat Upperslope
Upperberms
Middleslope
Lowerberms
Lowerslope+R
Toepaddock
pH
SUBSTRATES
(F=2.914;df=6;p=0.014
AveragesubstratepH
16
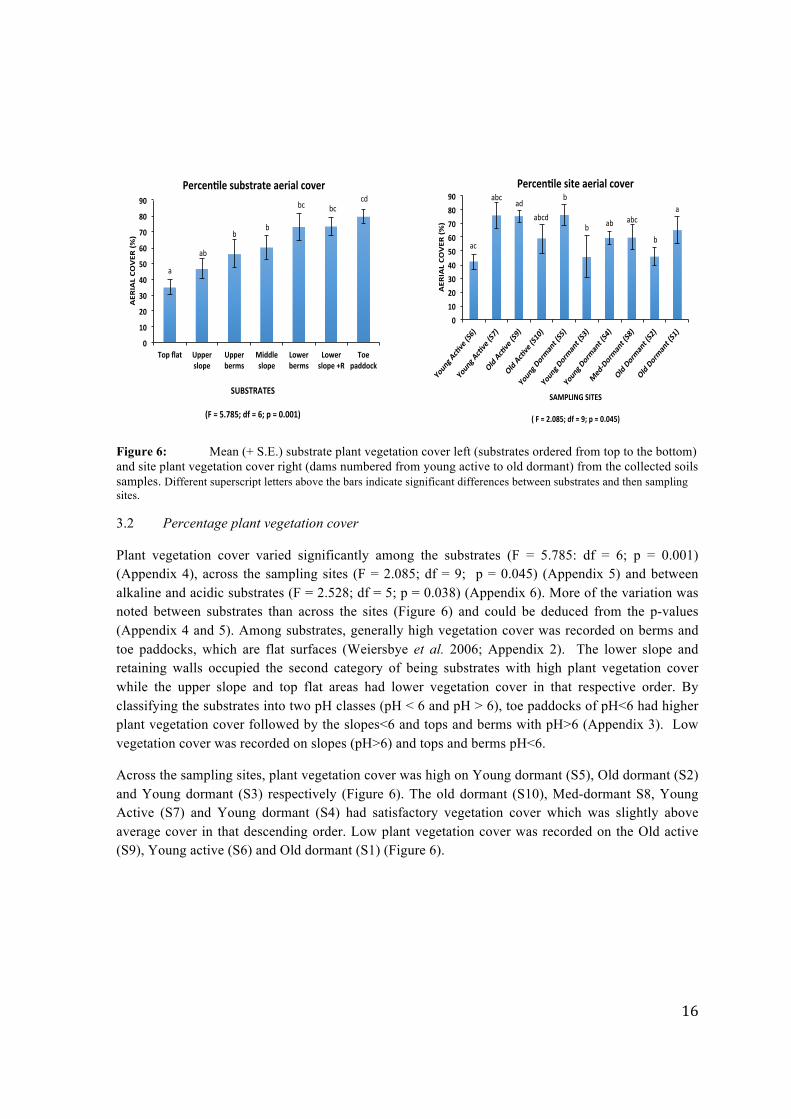
Figure 6: Mean (+ S.E.) substrate plant vegetation cover left (substrates ordered from top to the bottom) and site plant vegetation cover right (dams numbered from young active to old dormant) from the collected soils samples. Different superscript letters above the bars indicate significant differences between substrates and then sampling sites.
3.2 Percentage plant vegetation cover
Plant vegetation cover varied significantly among the substrates (F = 5.785: df = 6; p = 0.001) (Appendix 4), across the sampling sites (F = 2.085; df = 9; p = 0.045) (Appendix 5) and between alkaline and acidic substrates (F = 2.528; df = 5; p = 0.038) (Appendix 6). More of the variation was noted between substrates than across the sites (Figure 6) and could be deduced from the p-values (Appendix 4 and 5). Among substrates, generally high vegetation cover was recorded on berms and toe paddocks, which are flat surfaces (Weiersbye et al. 2006; Appendix 2). The lower slope and retaining walls occupied the second category of being substrates with high plant vegetation cover while the upper slope and top flat areas had lower vegetation cover in that respective order. By classifying the substrates into two pH classes (pH < 6 and pH > 6), toe paddocks of pH<6 had higher plant vegetation cover followed by the slopes<6 and tops and berms with pH>6 (Appendix 3). Low vegetation cover was recorded on slopes (pH>6) and tops and berms pH<6.
Across the sampling sites, plant vegetation cover was high on Young dormant (S5), Old dormant (S2) and Young dormant (S3) respectively (Figure 6). The old dormant (S10), Med-dormant S8, Young Active (S7) and Young dormant (S4) had satisfactory vegetation cover which was slightly above average cover in that descending order. Low plant vegetation cover was recorded on the Old active (S9), Young active (S6) and Old dormant (S1) (Figure 6).
ac
abcad
abcd
b
b ab abc
b
a
0
10
20
30
40
50
60
70
80
90
YoungAc3ve(S6)
YoungAc3ve(S7)
OldAc3ve(S9)
OldAc3ve(S10)
YoungDormant(S5)
YoungDormant(S3)
YoungDormant(S4)
Med-Dormant(S8)
OldDormant(S2)
OldDormant(S1)
AERIALCOVER(%)
SAMPLINGSITES
(F=2.085;df=9;p=0.045)
Percen3lesiteaerialcover
a
ab
bb
bc bccd
0
10
20
30
40
50
60
70
80
90
Topflat Upper
slope
Upper
berms
Middle
slope
Lower
berms
Lower
slope+R
Toe
paddock
AERIALCOVER(%)
SUBSTRATES
(F=5.785;df=6;p=0.001)
Percen3lesubstrateaerialcover
17
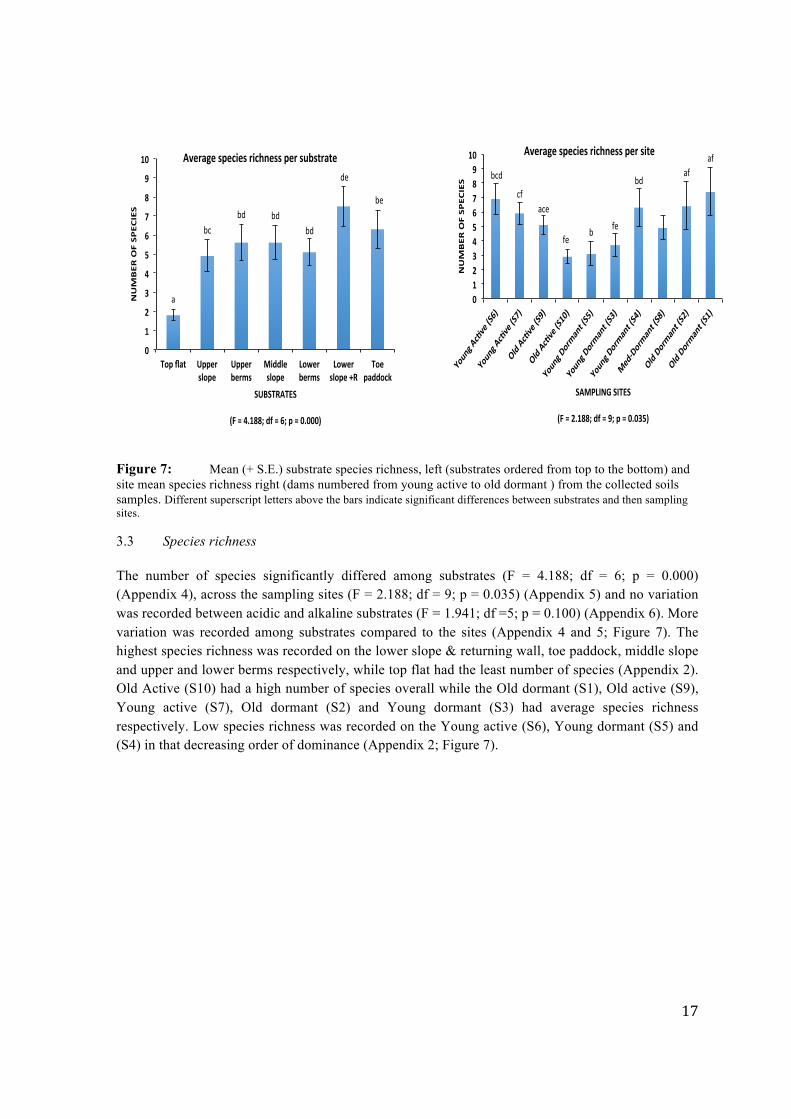
Figure 7: Mean (+ S.E.) substrate species richness, left (substrates ordered from top to the bottom) and site mean species richness right (dams numbered from young active to old dormant ) from the collected soils samples. Different superscript letters above the bars indicate significant differences between substrates and then sampling sites.
3.3 Species richness
The number of species significantly differed among substrates (F = 4.188; df = 6; p = 0.000) (Appendix 4), across the sampling sites (F = 2.188; df = 9; p = 0.035) (Appendix 5) and no variation was recorded between acidic and alkaline substrates (F = 1.941; df =5; p = 0.100) (Appendix 6). More variation was recorded among substrates compared to the sites (Appendix 4 and 5; Figure 7). The highest species richness was recorded on the lower slope & returning wall, toe paddock, middle slope and upper and lower berms respectively, while top flat had the least number of species (Appendix 2). Old Active (S10) had a high number of species overall while the Old dormant (S1), Old active (S9), Young active (S7), Old dormant (S2) and Young dormant (S3) had average species richness respectively. Low species richness was recorded on the Young active (S6), Young dormant (S5) and (S4) in that decreasing order of dominance (Appendix 2; Figure 7).
bcd
cface
feb fe
bdaf
af
0
1
2
3
4
5
6
7
8
9
10
YoungAc3ve(S6)
YoungAc3ve(S7)
OldAc3ve(S9)
OldAc3ve(S10)
YoungDormant(S5)
YoungDormant(S3)
YoungDormant(S4)
Med-Dormant(S8)
OldDormant(S2)
OldDormant(S1)
NUMBEROFSPECIES
SAMPLINGSITES
(F=2.188;df=9;p=0.035)
Averagespeciesrichnesspersite
a
bcbd bd
bd
de
be
0
1
2
3
4
5
6
7
8
9
10
Topflat Upper
slope
Upper
berms
Middle
slope
Lower
berms
Lower
slope+R
Toe
paddock
NUMBEROFSPECIES
SUBSTRATES
(F=4.188;df=6;p=0.000)
Averagespeciesrichnesspersubstrate
18
Figure 8: Mean (+ S.E.) substrate temperature (oC), left (substrates ordered from top to the bottom) and site site mean temperature (oC) right (dams numbered from young active to old dormant ) from the collected soils samples. Different superscript letters above the bars indicate significant differences between substrates and then sampling sites.
3.4 Temperature
Temperature showed no significant variation among substrates (F = 0.726; df = 6; p = 0.630) (Appendix 4) and across the sites (F = 0.812; df = 9; p = 0.607) (Appendix 5) but between substrates of (pH <6 and pH >6), there were significant variations (F = 2.470: df = 5; p = 0.042) (Appendix 6). Most of the substrates, which includes the Upper slope, Lower berms, Lower slope & retaining wall and Toe paddock had temperature within the same range (20.5 oC) while the top flat and middle slope were slightly higher (+2 oC) and upper berms low in temperature (Appendix 2). Only the Young active (S6) and Old dormant (S10) which recorded relatively higher and lower temperatures respectively, compared to other sites significantly differed with the other sites (Appendix 2, Figure 8), while the other sampling sites had temperature within the same range between 20.5 – 20.6 oC. Relatively high temperature was recorded on tops and berms (pH >6), slopes (pH >6) and Toe paddock (pH >6) while Toe paddock (pH <6), tops and berms (pH <6) and slopes (pH < 6) had low temperatures in that respective order of decreasing to the least (Appendix 3).
19
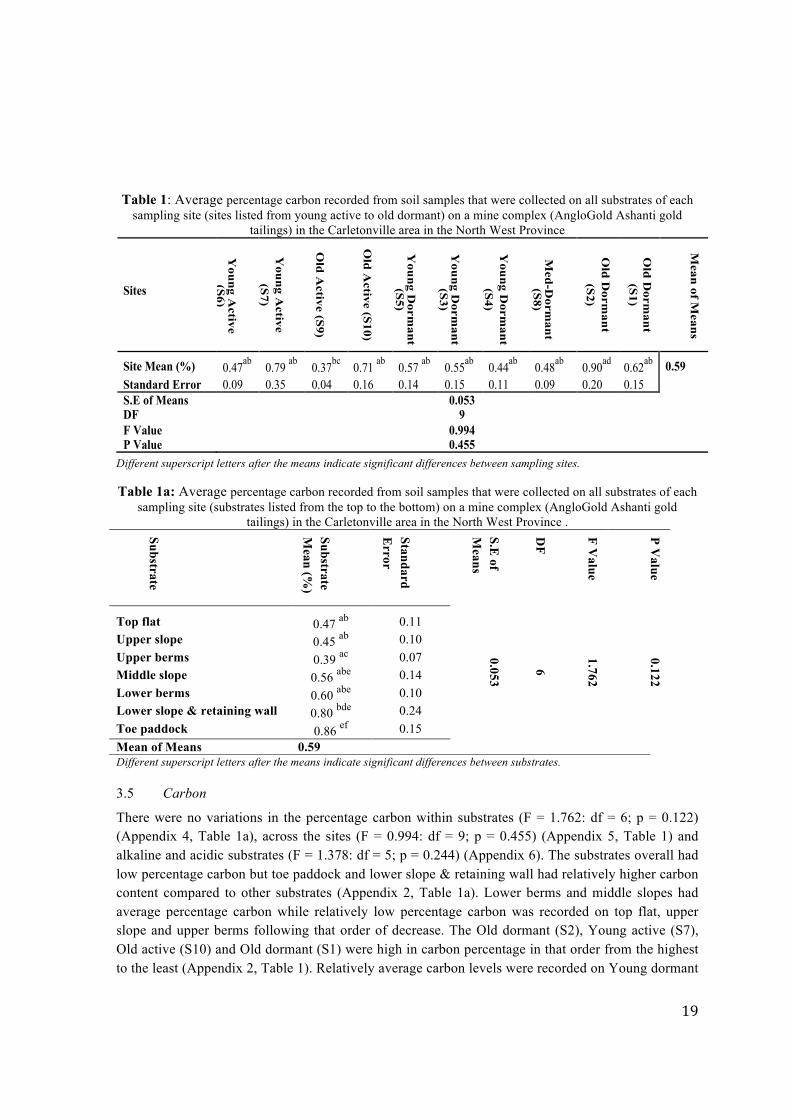
Table 1: Average percentage carbon recorded from soil samples that were collected on all substrates of each sampling site (sites listed from young active to old dormant) on a mine complex (AngloGold Ashanti gold
tailings) in the Carletonville area in the North West Province
Different superscript letters after the means indicate significant differences between sampling sites. Table 1a: Average percentage carbon recorded from soil samples that were collected on all substrates of each
sampling site (substrates listed from the top to the bottom) on a mine complex (AngloGold Ashanti gold tailings) in the Carletonville area in the North West Province .
Substrate
Substrate M
ean (%)
Standard E
rror
S.E of
Means
DF
F Value
P Value
Top flat 0.47 ab 0.11
0.053
6
1.762
0.122
Upper slope 0.45 ab 0.10 Upper berms 0.39 ac 0.07 Middle slope 0.56 abe 0.14 Lower berms 0.60 abe 0.10 Lower slope & retaining wall 0.80 bde 0.24 Toe paddock 0.86 ef 0.15 Mean of Means 0.59 Different superscript letters after the means indicate significant differences between substrates.
3.5 Carbon
There were no variations in the percentage carbon within substrates (F = 1.762: df = 6; p = 0.122) (Appendix 4, Table 1a), across the sites (F = 0.994: df = 9; p = 0.455) (Appendix 5, Table 1) and alkaline and acidic substrates (F = 1.378: df = 5; p = 0.244) (Appendix 6). The substrates overall had low percentage carbon but toe paddock and lower slope & retaining wall had relatively higher carbon content compared to other substrates (Appendix 2, Table 1a). Lower berms and middle slopes had average percentage carbon while relatively low percentage carbon was recorded on top flat, upper slope and upper berms following that order of decrease. The Old dormant (S2), Young active (S7), Old active (S10) and Old dormant (S1) were high in carbon percentage in that order from the highest to the least (Appendix 2, Table 1). Relatively average carbon levels were recorded on Young dormant
Sites
Young A
ctive (S6)
Y
oung Active
(S7)
O
ld Active (S9)
O
ld Active (S10)
Y
oung Dorm
ant (S5)
Y
oung Dorm
ant (S3)
Y
oung Dorm
ant (S4)
M
ed-Dorm
ant (S8)
Old D
ormant
(S2)
Old D
ormant
(S1)
Mean of M
eans
Site Mean (%) 0.47ab 0.79 ab 0.37bc 0.71 ab 0.57 ab 0.55ab 0.44ab 0.48ab 0.90ad 0.62ab 0.59 Standard Error 0.09 0.35 0.04 0.16 0.14 0.15 0.11 0.09 0.20 0.15 S.E of Means 0.053 DF 9 F Value 0.994 P Value 0.455
20
(S5) and (S3) while Med-dormant (S8), Young active (S6), Young dormant (S4) and Old active (S9) resembled low percentage carbon substrates (Appendix 2). Toe paddocks with (pH >6 and pH <6) had higher percentage carbon while slopes (pH >6) and tops and berms (pH<6) were average in carbon levels (Appendix 3). Slopes (pH <6) and Tops and berms (pH>6) recorded the lowest carbon percentage amongst the substrates of different pH categories.
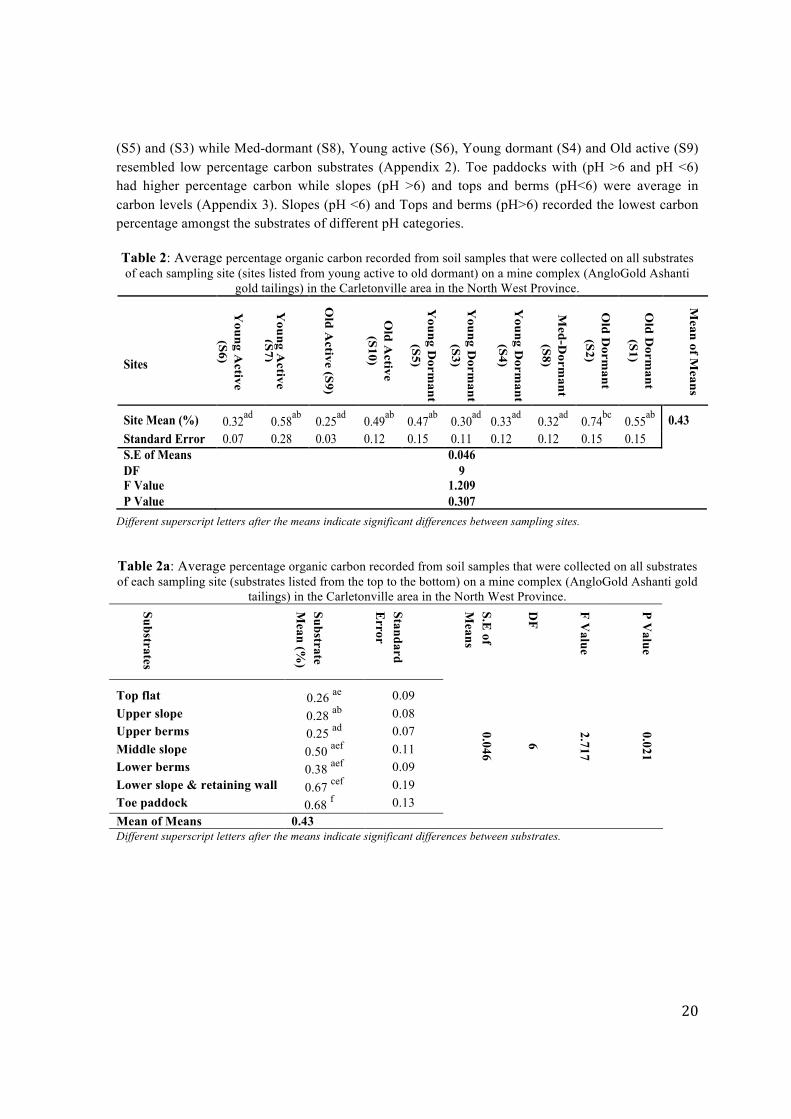
Table 2: Average percentage organic carbon recorded from soil samples that were collected on all substrates of each sampling site (sites listed from young active to old dormant) on a mine complex (AngloGold Ashanti
gold tailings) in the Carletonville area in the North West Province.
Different superscript letters after the means indicate significant differences between sampling sites.
Table 2a: Average percentage organic carbon recorded from soil samples that were collected on all substrates of each sampling site (substrates listed from the top to the bottom) on a mine complex (AngloGold Ashanti gold
tailings) in the Carletonville area in the North West Province.
Substrates
Substrate M
ean (%)
Standard E
rror
S.E of
Means
DF
F Value
P Value
Top flat 0.26 ae 0.09
0.046
6
2.717
0.021
Upper slope 0.28 ab 0.08 Upper berms 0.25 ad 0.07 Middle slope 0.50 aef 0.11 Lower berms 0.38 aef 0.09 Lower slope & retaining wall 0.67 cef 0.19 Toe paddock 0.68 f 0.13 Mean of Means 0.43 Different superscript letters after the means indicate significant differences between substrates.
Sites
Y
oung Active
(S6)
Young A
ctive (S7)
O
ld Active (S9)
Old A
ctive (S10)
Young D
ormant
(S5)
Young D
ormant
(S3)
Young D
ormant
(S4)
Med-D
ormant
(S8)
Old D
ormant
(S2)
Old D
ormant
(S1)
Mean of M
eans
Site Mean (%) 0.32ad 0.58ab 0.25ad 0.49ab 0.47ab 0.30ad 0.33ad 0.32ad 0.74bc 0.55ab 0.43 Standard Error 0.07 0.28 0.03 0.12 0.15 0.11 0.12 0.12 0.15 0.15 S.E of Means 0.046 DF 9 F Value 1.209 P Value 0.307
21
3.6 Organic carbon
Percentage organic carbon showed significant variation between substrates (F = 2.717: df = 6; p = 0.021) (Appendix 4, 2a) but it did not differ across the 10 sampling sites (F = 1.209: df = 9; p = 0.307) (Appendix 5, Table 2) and between alkaline and acidic substrates (F = 1.881: df = 5; p = 0.110) (Appendix 6). The toe paddock and lower slope & retaining wall had higher organic carbon content respectively. While the upper slope had average levels of organic carbon, all the other substrates had relatively low percentage organic carbon with the upper berms having the least carbon content (Table 2a; Appendix 2). Old dormant (S2), Young active (S7) and Old dormant (S1) had percentage organic carbon levels that were above average while the other sampling sites were below an average threshold (Appendix 2, Table 2). Although there were no variations between alkaline and acidic substrates (Appendix 2), Tops and berms with (pH>6 and pH<6) and slopes with (pH > 6) had higher percentage of organic carbon while the lowest amount of organic carbon was recorded on the Toe paddock (pH >6).
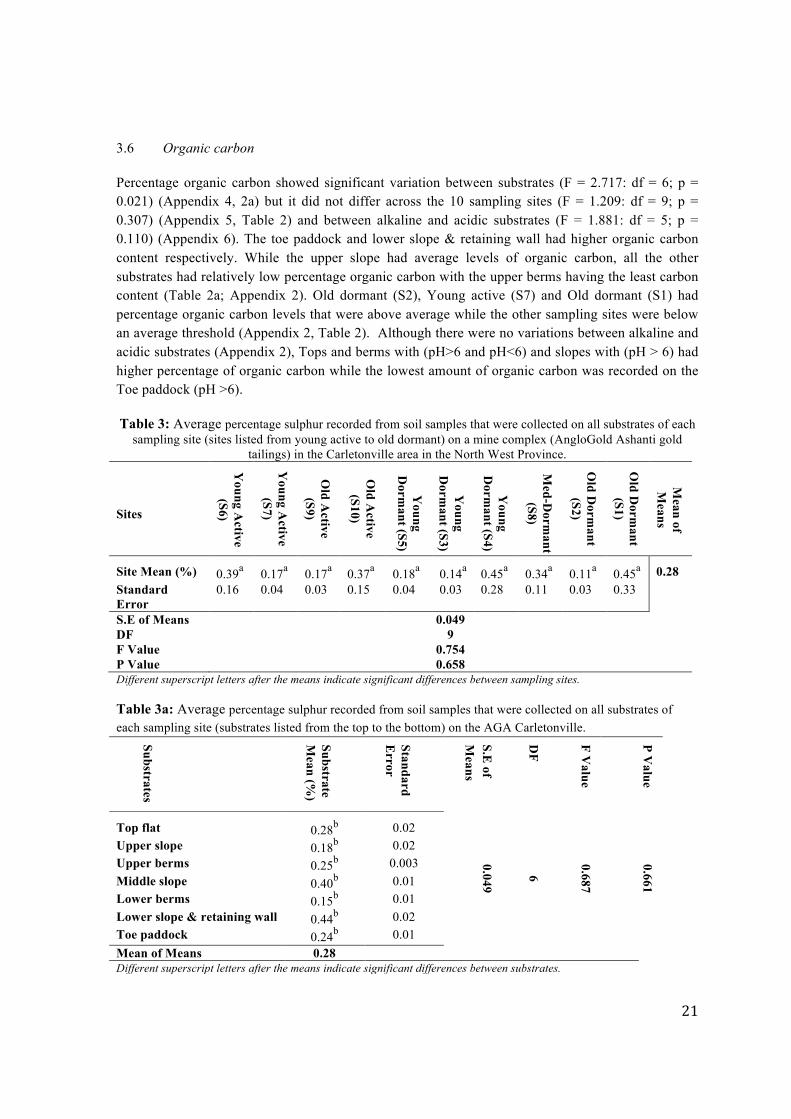
Table 3: Average percentage sulphur recorded from soil samples that were collected on all substrates of each sampling site (sites listed from young active to old dormant) on a mine complex (AngloGold Ashanti gold
tailings) in the Carletonville area in the North West Province. Sites
Young A
ctive (S6)
Young A
ctive (S7)
Old A
ctive (S9)
Old A
ctive (S10)
Young
Dorm
ant (S5)
Young
Dorm
ant (S3)
Young
Dorm
ant (S4)
Med-D
ormant
(S8)
Old D
ormant
(S2)
Old D
ormant
(S1)
Mean of
Means
Site Mean (%) 0.39a 0.17a 0.17a 0.37a 0.18a 0.14a 0.45a 0.34a 0.11a 0.45a 0.28 Standard Error
0.16 0.04 0.03 0.15 0.04 0.03 0.28 0.11 0.03 0.33
S.E of Means 0.049 DF 9 F Value 0.754 P Value 0.658 Different superscript letters after the means indicate significant differences between sampling sites. Table 3a: Average percentage sulphur recorded from soil samples that were collected on all substrates of each sampling site (substrates listed from the top to the bottom) on the AGA Carletonville.
Substrates
Substrate M
ean (%)
Standard E
rror
S.E of
Means
DF
F Value
P Value
Top flat 0.28b 0.02
0.049
6
0.687
0.661
Upper slope 0.18b 0.02 Upper berms 0.25b 0.003 Middle slope 0.40b 0.01 Lower berms 0.15b 0.01 Lower slope & retaining wall 0.44b 0.02 Toe paddock 0.24b 0.01 Mean of Means 0.28 Different superscript letters after the means indicate significant differences between substrates.
22
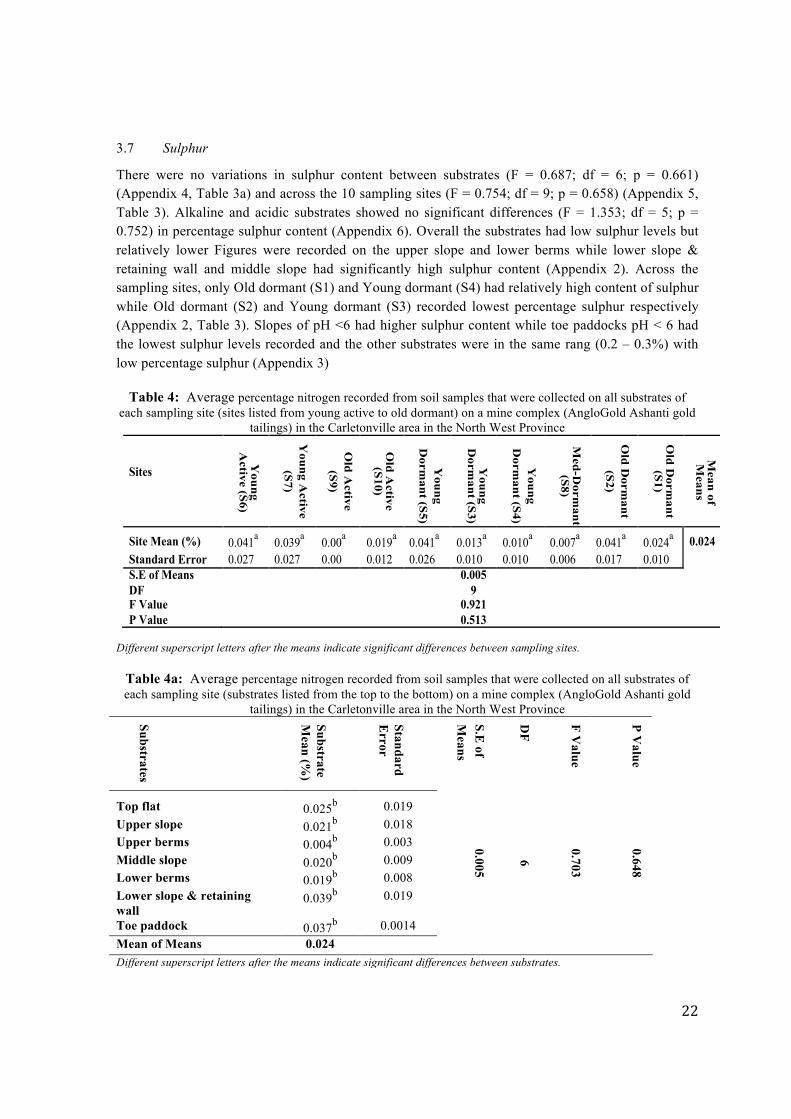
3.7 Sulphur
There were no variations in sulphur content between substrates (F = 0.687; df = 6; p = 0.661) (Appendix 4, Table 3a) and across the 10 sampling sites (F = 0.754; df = 9; p = 0.658) (Appendix 5, Table 3). Alkaline and acidic substrates showed no significant differences (F = 1.353; df = 5; p = 0.752) in percentage sulphur content (Appendix 6). Overall the substrates had low sulphur levels but relatively lower Figures were recorded on the upper slope and lower berms while lower slope & retaining wall and middle slope had significantly high sulphur content (Appendix 2). Across the sampling sites, only Old dormant (S1) and Young dormant (S4) had relatively high content of sulphur while Old dormant (S2) and Young dormant (S3) recorded lowest percentage sulphur respectively (Appendix 2, Table 3). Slopes of pH <6 had higher sulphur content while toe paddocks pH < 6 had the lowest sulphur levels recorded and the other substrates were in the same rang (0.2 – 0.3%) with low percentage sulphur (Appendix 3)
Table 4: Average percentage nitrogen recorded from soil samples that were collected on all substrates of each sampling site (sites listed from young active to old dormant) on a mine complex (AngloGold Ashanti gold
tailings) in the Carletonville area in the North West Province
Different superscript letters after the means indicate significant differences between sampling sites.
Table 4a: Average percentage nitrogen recorded from soil samples that were collected on all substrates of each sampling site (substrates listed from the top to the bottom) on a mine complex (AngloGold Ashanti gold
tailings) in the Carletonville area in the North West Province
Substrates
Substrate M
ean (%)
Standard E
rror
S.E of
Means
DF
F Value
P Value
Top flat 0.025b 0.019
0.005
6
0.703
0.648
Upper slope 0.021b 0.018 Upper berms 0.004b 0.003 Middle slope 0.020b 0.009 Lower berms 0.019b 0.008 Lower slope & retaining wall
0.039b 0.019
Toe paddock 0.037b 0.0014 Mean of Means 0.024 Different superscript letters after the means indicate significant differences between substrates.
Sites
Young
Active (S6)
Young A
ctive (S7)
Old A
ctive (S9)
Old A
ctive (S10)
Young
Dorm
ant (S5)
Young
Dorm
ant (S3)
Young
Dorm
ant (S4)
Med-D
ormant
(S8)
Old D
ormant
(S2)
Old D
ormant
(S1)
Mean of
Means
Site Mean (%) 0.041a 0.039a 0.00a 0.019a 0.041a 0.013a 0.010a 0.007a 0.041a 0.024a 0.024 Standard Error 0.027 0.027 0.00 0.012 0.026 0.010 0.010 0.006 0.017 0.010 S.E of Means 0.005 DF 9 F Value 0.921 P Value 0.513
23
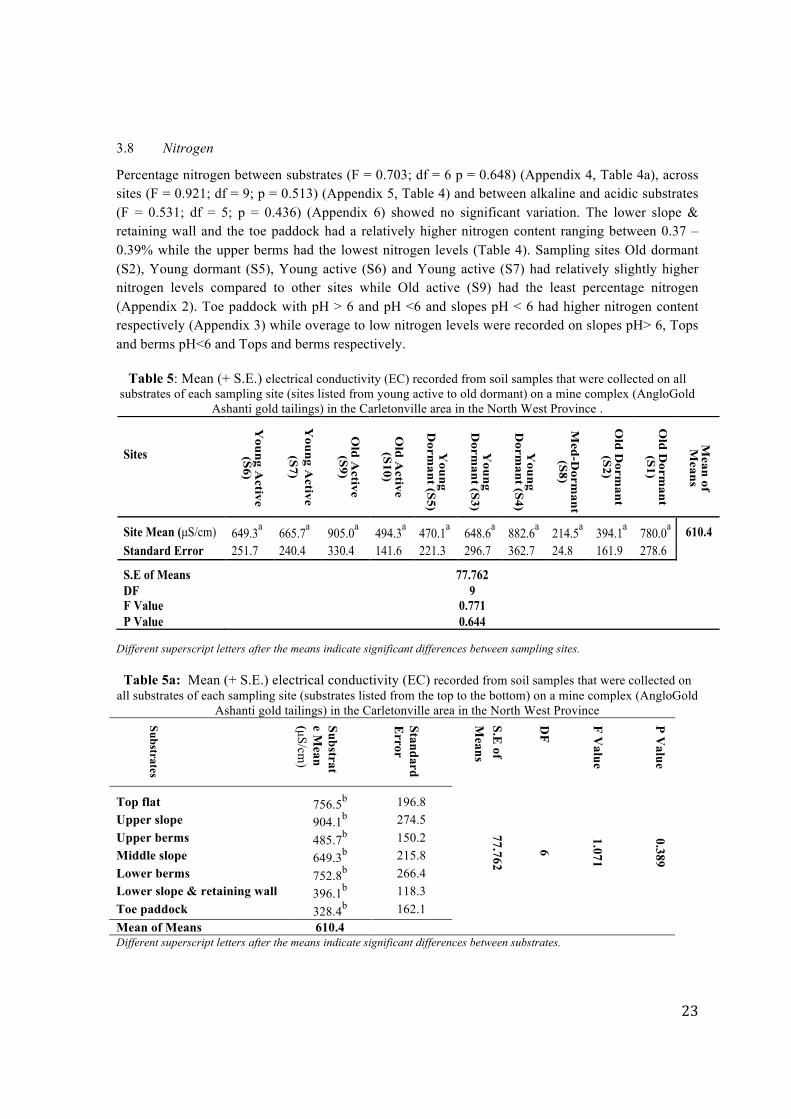
3.8 Nitrogen
Percentage nitrogen between substrates (F = 0.703; df = 6 p = 0.648) (Appendix 4, Table 4a), across sites (F = 0.921; df = 9; p = 0.513) (Appendix 5, Table 4) and between alkaline and acidic substrates (F = 0.531; df = 5; p = 0.436) (Appendix 6) showed no significant variation. The lower slope & retaining wall and the toe paddock had a relatively higher nitrogen content ranging between 0.37 – 0.39% while the upper berms had the lowest nitrogen levels (Table 4). Sampling sites Old dormant (S2), Young dormant (S5), Young active (S6) and Young active (S7) had relatively slightly higher nitrogen levels compared to other sites while Old active (S9) had the least percentage nitrogen (Appendix 2). Toe paddock with pH > 6 and pH <6 and slopes pH < 6 had higher nitrogen content respectively (Appendix 3) while overage to low nitrogen levels were recorded on slopes pH> 6, Tops and berms pH<6 and Tops and berms respectively.
Table 5: Mean (+ S.E.) electrical conductivity (EC) recorded from soil samples that were collected on all substrates of each sampling site (sites listed from young active to old dormant) on a mine complex (AngloGold
Ashanti gold tailings) in the Carletonville area in the North West Province .
Different superscript letters after the means indicate significant differences between sampling sites.
Table 5a: Mean (+ S.E.) electrical conductivity (EC) recorded from soil samples that were collected on all substrates of each sampling site (substrates listed from the top to the bottom) on a mine complex (AngloGold
Ashanti gold tailings) in the Carletonville area in the North West Province
Substrates
Substrate M
ean (µS/cm
)
Standard E
rror
S.E of
Means
DF
F Value
P Value
Top flat 756.5b 196.8
77.762
6
1.071
0.389
Upper slope 904.1b 274.5 Upper berms 485.7b 150.2 Middle slope 649.3b 215.8 Lower berms 752.8b 266.4 Lower slope & retaining wall 396.1b 118.3 Toe paddock 328.4b 162.1 Mean of Means 610.4 Different superscript letters after the means indicate significant differences between substrates.
Sites
Young A
ctive (S6)
Young A
ctive (S7)
Old A
ctive (S9)
Old A
ctive (S10)
Young
Dorm
ant (S5)
Young
Dorm
ant (S3)
Young
Dorm
ant (S4)
Med-D
ormant
(S8)
Old D
ormant
(S2)
Old D
ormant
(S1)
Mean of
Means
Site Mean (µS/cm) 649.3a 665.7a 905.0a 494.3a 470.1a 648.6a 882.6a 214.5a 394.1a 780.0a 610.4 Standard Error 251.7 240.4 330.4 141.6 221.3 296.7 362.7 24.8 161.9 278.6
S.E of Means 77.762 DF 9 F Value 0.771 P Value 0.644
24
3.9 Electrical conductivity (EC)
Electrical conductivity (EC) was high on the upper slope, top flat area, and lower slope and middle slope respectively (Table 5a). The upper berms, lower slope & retaining wall and toe paddock showed low electrical conductivity but no significant variation was recorded within the substrates (F = 1.071; df = 6; p = 0.389) (Appendix 4). There were no significant differences across the sampling sites (F = 0.771; df =9; p = 0.644) (Appendix 5, Table 5) and between substrates of pH > 6 and pH < 6 (F = 0.982; df = 5; p = 0.436). The old active (S9) and young dormant (S4) recorded the highest electrical conductivity while the med- dormant (S8) had the lowest Ec. Other sampling sites were within the same range between 395 – 660microns (Table 5). Overall slopes with pH>6 showed higher electrical conductivity together with tops and berms pH <6 and tops and berms pH >6 respectively. The toe paddocks pH > 6 had the lowest electrical conductivity.
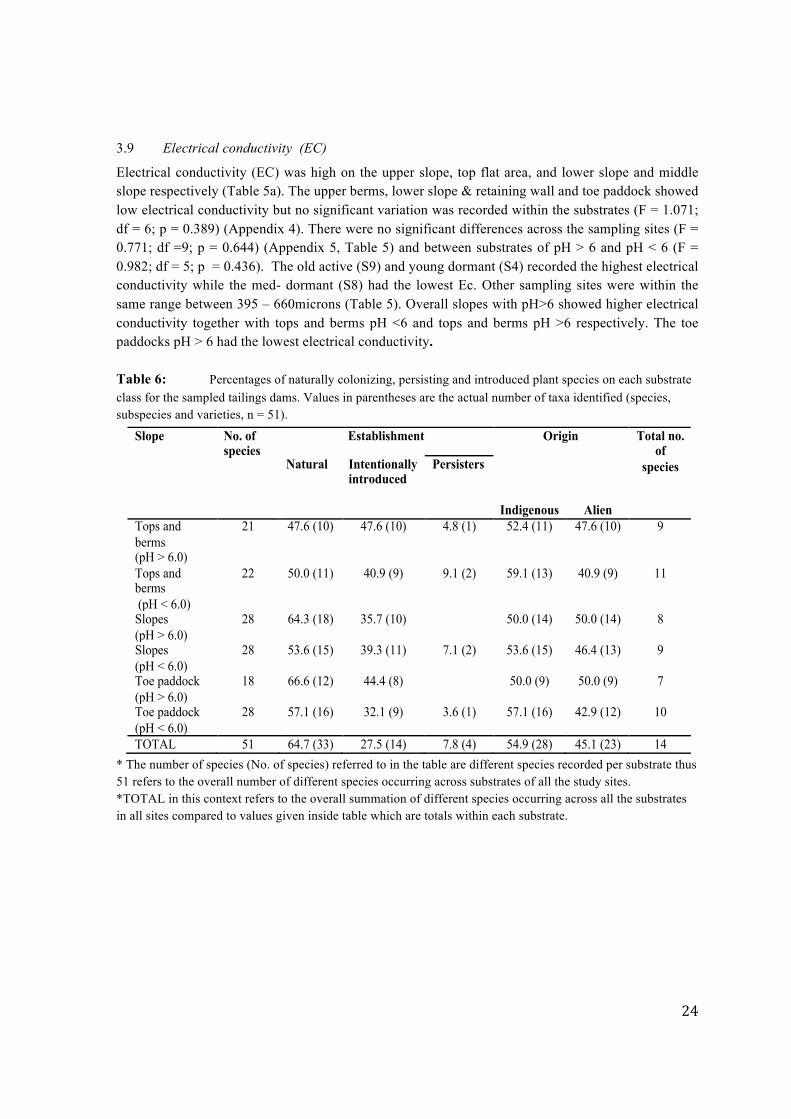
Table 6: Percentages of naturally colonizing, persisting and introduced plant species on each substrate class for the sampled tailings dams. Values in parentheses are the actual number of taxa identified (species, subspecies and varieties, n = 51).
* The number of species (No. of species) referred to in the table are different species recorded per substrate thus 51 refers to the overall number of different species occurring across substrates of all the study sites. *TOTAL in this context refers to the overall summation of different species occurring across all the substrates in all sites compared to values given inside table which are totals within each substrate.
Slope No. of species
Establishment Origin Total no. of
species Natural Intentionally introduced
Persisters
Indigenous Alien
Tops and berms (pH > 6.0)
21 47.6 (10) 47.6 (10) 4.8 (1) 52.4 (11) 47.6 (10) 9
Tops and berms (pH < 6.0)
22 50.0 (11) 40.9 (9) 9.1 (2) 59.1 (13) 40.9 (9) 11
Slopes (pH > 6.0)
28 64.3 (18) 35.7 (10) 50.0 (14) 50.0 (14) 8
Slopes (pH < 6.0)
28 53.6 (15) 39.3 (11) 7.1 (2) 53.6 (15) 46.4 (13) 9
Toe paddock (pH > 6.0)
18 66.6 (12) 44.4 (8) 50.0 (9) 50.0 (9) 7
Toe paddock (pH < 6.0)
28 57.1 (16) 32.1 (9) 3.6 (1) 57.1 (16) 42.9 (12) 10
TOTAL 51 64.7 (33) 27.5 (14) 7.8 (4) 54.9 (28) 45.1 (23) 14
25
3.10 Method of establishment (Natural versus Introduced)
The vegetation survey yielded a total of 51 species that belonged to at least 37 genera and 14 families (Appendix 1). Species that were identified were categorized according to their method of establishment (natural and introduced) as well as indigenous or alien. Approximately 64.7% of the plants recorded were natural colonizers (list in 1996/97 list of natural colonizers) while 27.5% of the plants comprised of those that were intentionally introduced prior the 1996/97 study with the remaining 7.8% consisting of persistent species dating from the former study (Table 6, Appendix 1). Asteraceae constituted about 30.3% of the natural colonizers dominated by the species of Tagetes minuta and Bidens pilosa while Eragrostis spp., Pennisetum spp. and Andropogon spp. dominated the natural colonizers of the Poaceae family, which contributed approximately 27.3%. The Poaceae (grass) family provided about 80% of the plant vegetation cover both on slopes and toe paddocks. Fabaceae, Anacardiaceae and Solanaceae families constituted the 18.3% of the natural colonizers with Melilotus alba and Acacia spp. (Fabaceae), Rhus spp (Anacardiaceae) and Solanum spp. (Solanaceae) dominating their respective families (Appendix 1). Intentionally introduced plants were dominated by Cynodon dactylon, Hyparrhenia spp and Cortaderia jubata, which belong to Poaceae family accounting for 57.1% of species in this category while Fabaceae and Tamaricaceae and Myrtaceae and Asphodelaceae constituted 14.3 % and 7.1% respectively in that order of frequency and abundance across the substrates (Appendix 1; Table 6). Persisting plants comprised of the Aristida spp. (Poaceae), Senecio spp. (Asteraceae) and Acacia spp. (Fabaceae).
3.11 Origin of plant species (Indigenous versus Alien)
The species that were recorded were also classified into indigenous and alien plants. Approximately 54.9% (28 species) of the plant species identified on the tailings dams were indigenous while 23 species (45.1%) of the plants identified (Table 6: Appendix 1) were alien species that were either intentionally introduced or naturally colonizing the tailings dams prior the 1996/7 surveys. The dominating families in alien plants included the Asteraceae (4 species), Fabaceae (4 species) and Poaceae and Anacardiaceae (3 species each) in that order of dominance in species abundance, frequency with Poaceae family providing high plant vegetation cover. The genera of Rhus spp, Tamarix spp, Eragrostis spp, Solanum spp and Acacia spp were the most represented in the alien plants respectively, while other representative families included the Mrytaceae (Eucalyptus spp), Tamaricaceae, Solanaceae (Solanum spp), Phytolaccaceae (Phytolacca octandra) and Verbenaceae (Verbena bonariensis) and Asclepiadaceae (Asclepias fruticosa) (Appendix 1; Table 6). Indigenous plants species identified were highly dominated by the grasses of the genera Hyparrhenia, Andropogon, Pennisetum and Aristida in that order of frequency and plant vegetation cover (Appendix 1) contributing to the 53.6% of Poaceae to the total indigenous species recorded. Asteraceae was also well represented constituting about 21.4% to the indigenous plants but only the Senecio spp were dominating the family. Other families recorded include the Asparagaceae (Asparagus spp), Asphodelaceae (Aloe greatheadii), Euphorbiaceae, Moraceae (Ficus ingens) and Fabaceae (Tephrosia longipes) (Appendix 1; Table 6).
Overall, naturally colonizing plants had a higher percentage ratio to intentionally introduced and persisting plants on the toe paddocks and slopes (pH > 6) while low percentage ratio was recorded on the tops and berms (pH > 6). The highest number of natural colonizing species was recorded on both
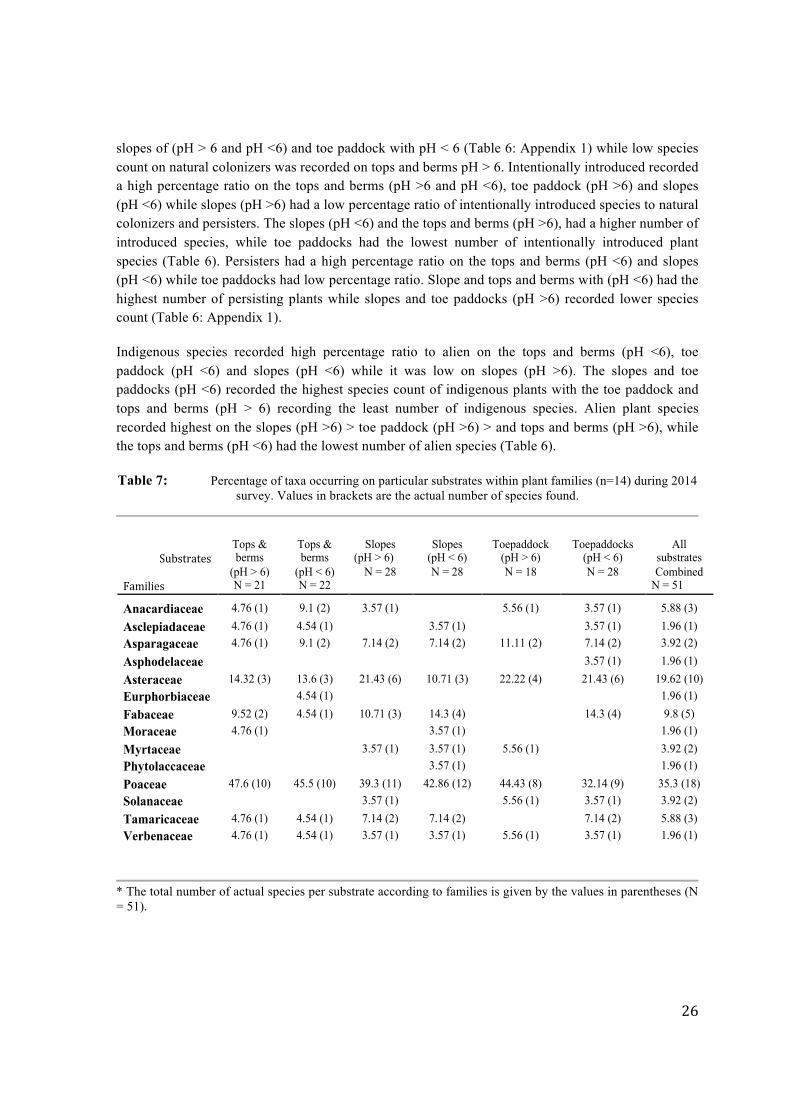
26
slopes of (pH > 6 and pH <6) and toe paddock with pH < 6 (Table 6: Appendix 1) while low species count on natural colonizers was recorded on tops and berms pH > 6. Intentionally introduced recorded a high percentage ratio on the tops and berms (pH >6 and pH <6), toe paddock (pH >6) and slopes (pH <6) while slopes (pH >6) had a low percentage ratio of intentionally introduced species to natural colonizers and persisters. The slopes (pH <6) and the tops and berms (pH >6), had a higher number of introduced species, while toe paddocks had the lowest number of intentionally introduced plant species (Table 6). Persisters had a high percentage ratio on the tops and berms (pH <6) and slopes (pH <6) while toe paddocks had low percentage ratio. Slope and tops and berms with (pH <6) had the highest number of persisting plants while slopes and toe paddocks (pH >6) recorded lower species count (Table 6: Appendix 1).
Indigenous species recorded high percentage ratio to alien on the tops and berms (pH <6), toe paddock (pH <6) and slopes (pH <6) while it was low on slopes (pH >6). The slopes and toe paddocks (pH <6) recorded the highest species count of indigenous plants with the toe paddock and tops and berms (pH > 6) recording the least number of indigenous species. Alien plant species recorded highest on the slopes (pH >6) > toe paddock (pH >6) > and tops and berms (pH >6), while the tops and berms (pH <6) had the lowest number of alien species (Table 6).
Table 7: Percentage of taxa occurring on particular substrates within plant families (n=14) during 2014 survey. Values in brackets are the actual number of species found.
* The total number of actual species per substrate according to families is given by the values in parentheses (N = 51).
Substrates
Families
Tops & berms
(pH > 6) N = 21
Tops & berms
(pH < 6) N = 22
Slopes (pH > 6)
N = 28
Slopes (pH < 6) N = 28
Toepaddock (pH > 6) N = 18
Toepaddocks (pH < 6) N = 28
All substrates Combined
N = 51
Anacardiaceae 4.76 (1) 9.1 (2) 3.57 (1) 5.56 (1) 3.57 (1) 5.88 (3) Asclepiadaceae 4.76 (1) 4.54 (1) 3.57 (1) 3.57 (1) 1.96 (1) Asparagaceae 4.76 (1) 9.1 (2) 7.14 (2) 7.14 (2) 11.11 (2) 7.14 (2) 3.92 (2) Asphodelaceae 3.57 (1) 1.96 (1) Asteraceae 14.32 (3) 13.6 (3) 21.43 (6) 10.71 (3) 22.22 (4) 21.43 (6) 19.62 (10) Eurphorbiaceae 4.54 (1) 1.96 (1) Fabaceae 9.52 (2) 4.54 (1) 10.71 (3) 14.3 (4) 14.3 (4) 9.8 (5) Moraceae 4.76 (1) 3.57 (1) 1.96 (1) Myrtaceae 3.57 (1) 3.57 (1) 5.56 (1) 3.92 (2) Phytolaccaceae 3.57 (1) 1.96 (1) Poaceae 47.6 (10) 45.5 (10) 39.3 (11) 42.86 (12) 44.43 (8) 32.14 (9) 35.3 (18) Solanaceae 3.57 (1) 5.56 (1) 3.57 (1) 3.92 (2) Tamaricaceae 4.76 (1) 4.54 (1) 7.14 (2) 7.14 (2) 7.14 (2) 5.88 (3) Verbenaceae 4.76 (1) 4.54 (1) 3.57 (1) 3.57 (1) 5.56 (1) 3.57 (1) 1.96 (1)
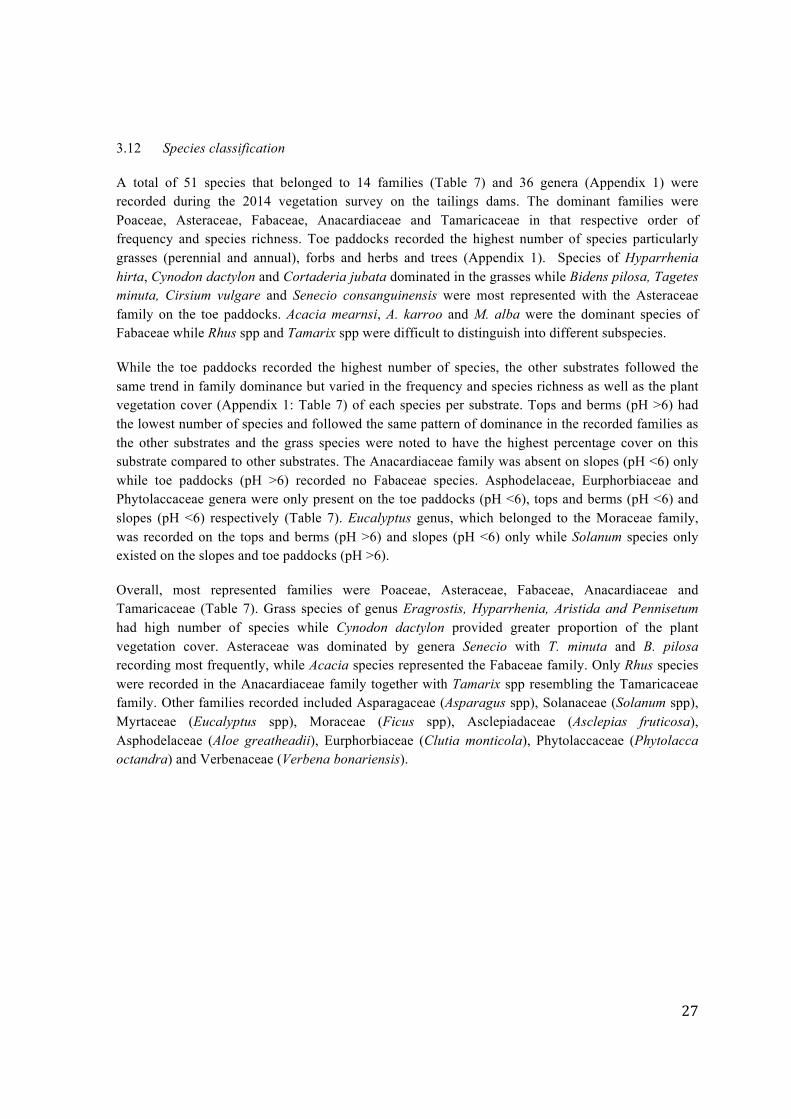
27
3.12 Species classification
A total of 51 species that belonged to 14 families (Table 7) and 36 genera (Appendix 1) were recorded during the 2014 vegetation survey on the tailings dams. The dominant families were Poaceae, Asteraceae, Fabaceae, Anacardiaceae and Tamaricaceae in that respective order of frequency and species richness. Toe paddocks recorded the highest number of species particularly grasses (perennial and annual), forbs and herbs and trees (Appendix 1). Species of Hyparrhenia hirta, Cynodon dactylon and Cortaderia jubata dominated in the grasses while Bidens pilosa, Tagetes minuta, Cirsium vulgare and Senecio consanguinensis were most represented with the Asteraceae family on the toe paddocks. Acacia mearnsi, A. karroo and M. alba were the dominant species of Fabaceae while Rhus spp and Tamarix spp were difficult to distinguish into different subspecies.
While the toe paddocks recorded the highest number of species, the other substrates followed the same trend in family dominance but varied in the frequency and species richness as well as the plant vegetation cover (Appendix 1: Table 7) of each species per substrate. Tops and berms (pH >6) had the lowest number of species and followed the same pattern of dominance in the recorded families as the other substrates and the grass species were noted to have the highest percentage cover on this substrate compared to other substrates. The Anacardiaceae family was absent on slopes (pH <6) only while toe paddocks (pH >6) recorded no Fabaceae species. Asphodelaceae, Eurphorbiaceae and Phytolaccaceae genera were only present on the toe paddocks (pH <6), tops and berms (pH <6) and slopes (pH <6) respectively (Table 7). Eucalyptus genus, which belonged to the Moraceae family, was recorded on the tops and berms (pH >6) and slopes (pH <6) only while Solanum species only existed on the slopes and toe paddocks (pH >6).
Overall, most represented families were Poaceae, Asteraceae, Fabaceae, Anacardiaceae and Tamaricaceae (Table 7). Grass species of genus Eragrostis, Hyparrhenia, Aristida and Pennisetum had high number of species while Cynodon dactylon provided greater proportion of the plant vegetation cover. Asteraceae was dominated by genera Senecio with T. minuta and B. pilosa recording most frequently, while Acacia species represented the Fabaceae family. Only Rhus species were recorded in the Anacardiaceae family together with Tamarix spp resembling the Tamaricaceae family. Other families recorded included Asparagaceae (Asparagus spp), Solanaceae (Solanum spp), Myrtaceae (Eucalyptus spp), Moraceae (Ficus spp), Asclepiadaceae (Asclepias fruticosa), Asphodelaceae (Aloe greatheadii), Eurphorbiaceae (Clutia monticola), Phytolaccaceae (Phytolacca octandra) and Verbenaceae (Verbena bonariensis).
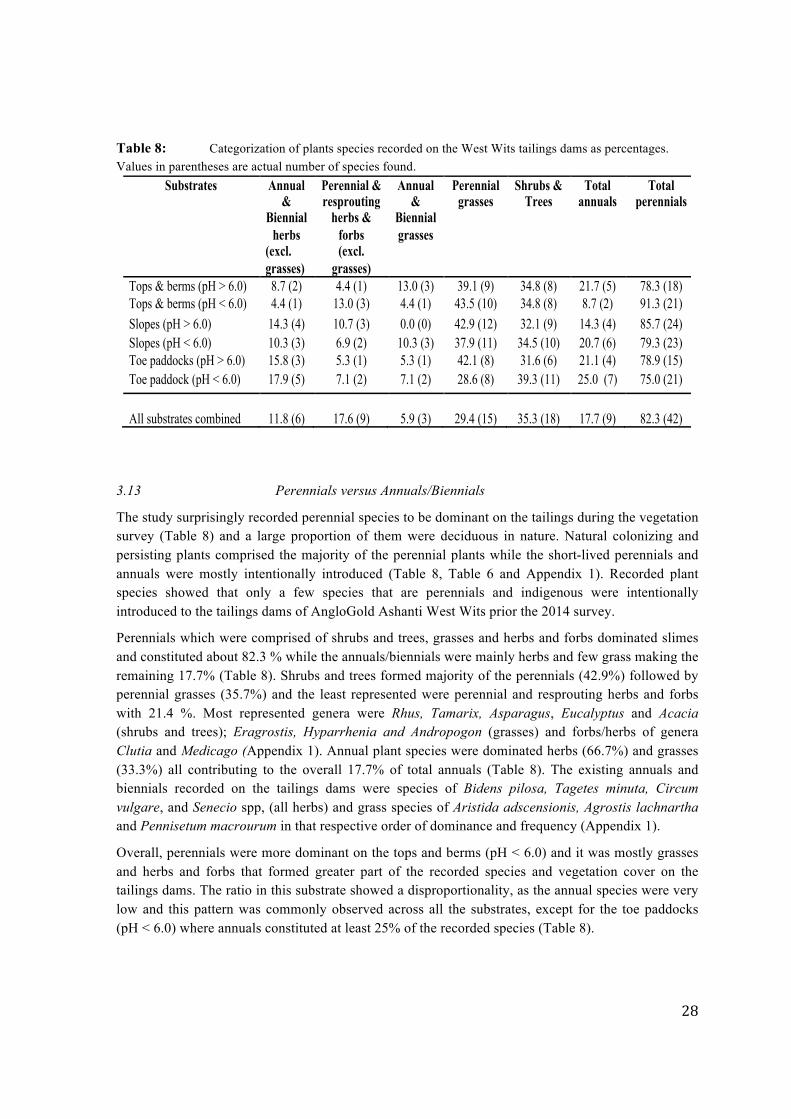
28
Table 8: Categorization of plants species recorded on the West Wits tailings dams as percentages. Values in parentheses are actual number of species found.
3.13 Perennials versus Annuals/Biennials
The study surprisingly recorded perennial species to be dominant on the tailings during the vegetation survey (Table 8) and a large proportion of them were deciduous in nature. Natural colonizing and persisting plants comprised the majority of the perennial plants while the short-lived perennials and annuals were mostly intentionally introduced (Table 8, Table 6 and Appendix 1). Recorded plant species showed that only a few species that are perennials and indigenous were intentionally introduced to the tailings dams of AngloGold Ashanti West Wits prior the 2014 survey.
Perennials which were comprised of shrubs and trees, grasses and herbs and forbs dominated slimes and constituted about 82.3 % while the annuals/biennials were mainly herbs and few grass making the remaining 17.7% (Table 8). Shrubs and trees formed majority of the perennials (42.9%) followed by perennial grasses (35.7%) and the least represented were perennial and resprouting herbs and forbs with 21.4 %. Most represented genera were Rhus, Tamarix, Asparagus, Eucalyptus and Acacia (shrubs and trees); Eragrostis, Hyparrhenia and Andropogon (grasses) and forbs/herbs of genera Clutia and Medicago (Appendix 1). Annual plant species were dominated herbs (66.7%) and grasses (33.3%) all contributing to the overall 17.7% of total annuals (Table 8). The existing annuals and biennials recorded on the tailings dams were species of Bidens pilosa, Tagetes minuta, Circum vulgare, and Senecio spp, (all herbs) and grass species of Aristida adscensionis, Agrostis lachnartha and Pennisetum macrourum in that respective order of dominance and frequency (Appendix 1).
Overall, perennials were more dominant on the tops and berms (pH < 6.0) and it was mostly grasses and herbs and forbs that formed greater part of the recorded species and vegetation cover on the tailings dams. The ratio in this substrate showed a disproportionality, as the annual species were very low and this pattern was commonly observed across all the substrates, except for the toe paddocks (pH < 6.0) where annuals constituted at least 25% of the recorded species (Table 8).
Substrates Annual &
Biennial herbs
(excl. grasses)
Perennial & resprouting
herbs & forbs (excl.
grasses)
Annual &
Biennial grasses
Perennial grasses
Shrubs & Trees
Total annuals
Total perennials
Tops & berms (pH > 6.0) 8.7 (2) 4.4 (1) 13.0 (3) 39.1 (9) 34.8 (8) 21.7 (5) 78.3 (18) Tops & berms (pH < 6.0) 4.4 (1) 13.0 (3) 4.4 (1) 43.5 (10) 34.8 (8) 8.7 (2) 91.3 (21) Slopes (pH > 6.0) 14.3 (4) 10.7 (3) 0.0 (0) 42.9 (12) 32.1 (9) 14.3 (4) 85.7 (24) Slopes (pH < 6.0) 10.3 (3) 6.9 (2) 10.3 (3) 37.9 (11) 34.5 (10) 20.7 (6) 79.3 (23) Toe paddocks (pH > 6.0) 15.8 (3) 5.3 (1) 5.3 (1) 42.1 (8) 31.6 (6) 21.1 (4) 78.9 (15) Toe paddock (pH < 6.0) 17.9 (5) 7.1 (2) 7.1 (2) 28.6 (8) 39.3 (11) 25.0 (7) 75.0 (21) All substrates combined
11.8 (6)
17.6 (9)
5.9 (3)
29.4 (15)
35.3 (18)
17.7 (9)
82.3 (42)
29
Table 9: Percentage occurrence of the monocotyledonous and dicotyledonous plant species found on the
tailings dams. Values in parentheses are actual numbers of species and subspecies found Substrates Dicotyledons Monocotyledons Tops and berms (pH >6.0) 45.5 (10) 54.5 (12) Tops and berms (pH <6.0) 45.5 (10) 54.5 (12) Slopes (pH > 6.0) 51.9 (14) 48.1 (13) Slopes (pH < 6.0) 48.1 (13) 51.9 (14) Toe paddocks (pH > 6.0) 42.1 (8) 57.9 (11) Toe paddock (pH < 6.0) 55.6 (15) 44.4 (12)
All substrates combined 58.8 (30) 41.2 (21)
3.14 Monocotyledons versus Dicotyledons
The tailings dams recorded a slightly higher number of dicotyledonous plants compared to monocotyledonous plant species (Table 9 and Appendix 1). Although Monocotyledons were overall low in numbers, they dominated majority (4 out of 6) of the substrates on the tailings dams particularly with grass species. Dicotyledons were noted to be to dominant on the slopes (pH > 6.0) and Toe paddock (pH < 6.0) and these mostly comprised of shrubs and trees as well as the forbs and herbs (Table 8). Asteraceae (33.3%), Fabaceae (16.7%) and Anacardiaceae (10%) were the dominant families in Dicotyledons plant species while Poaceae (85.7%) and Asparagaceae (9.5%) formed the majority of the Monocotyledons (Table 7 and Appendix 1). Interestingly, Anacardiaceae species were absent on the slopes (pH < 6.0) while other dicotyledons species including Aloe greatheadii (only present on the toe paddock with pH < 6.0), Stoebe vulgaris (recorded on tops and berms, pH > 6.0) and Phytolacca octandra (present on slopes with pH < 6.0) were noted to be occurring on particular substrates only (Appendix 1). Monocotyledons were fairly distributed across all the substrates of the slime and particularly grasses provided much of the plant vegetation cover on the slope.
3.15 Comparison between the 1996/97 and 2014 vegetation surveys
The vegetation survey of 2014 found fewer species compared to the 1996/97 survey, which recorded a high number of species (Weiersbye et al. 2006, Table 10 and Appendix 1) although there were differences in the total area covered with the former study sampling a smaller area. Both surveys found the families of Poaceae, Asteraceae, Fabaceae and Anacardiaceae to be dominant overall across the substrates in that order of dominance and abundance. Although the studies shared the same trends in families dominance, differences were noted in the percentage frequency of each family over time as grasses (Poaceae) almost doubled their population and cover while overall slight increase between 2.1 - 2.4% in percentage occurrence of Asteraceae and Anacardiaceae was recorded (Table 1). The Fabaceae family recorded a drop in the percentage by approximately 0.7% but still remained within the same range of frequency with the results obtained in the previous study. Approximately 27 families, 62 genera and about 100 species and subspecies were lost over the 17 years period from 1997 to 2014. Most of the major families lost include the intentionally introduced families of Chenopodiaceae (Atriplex, Bassia and Chenopodium spp), Amaranthaceae (Amaranthus, Alternathera, Gomphrena spp) and Aizoaceae. Naturally colonizing plant species of genera Ziziphus and Celtis belonging to Rhamnaceae and Ulmaceae families were also formed
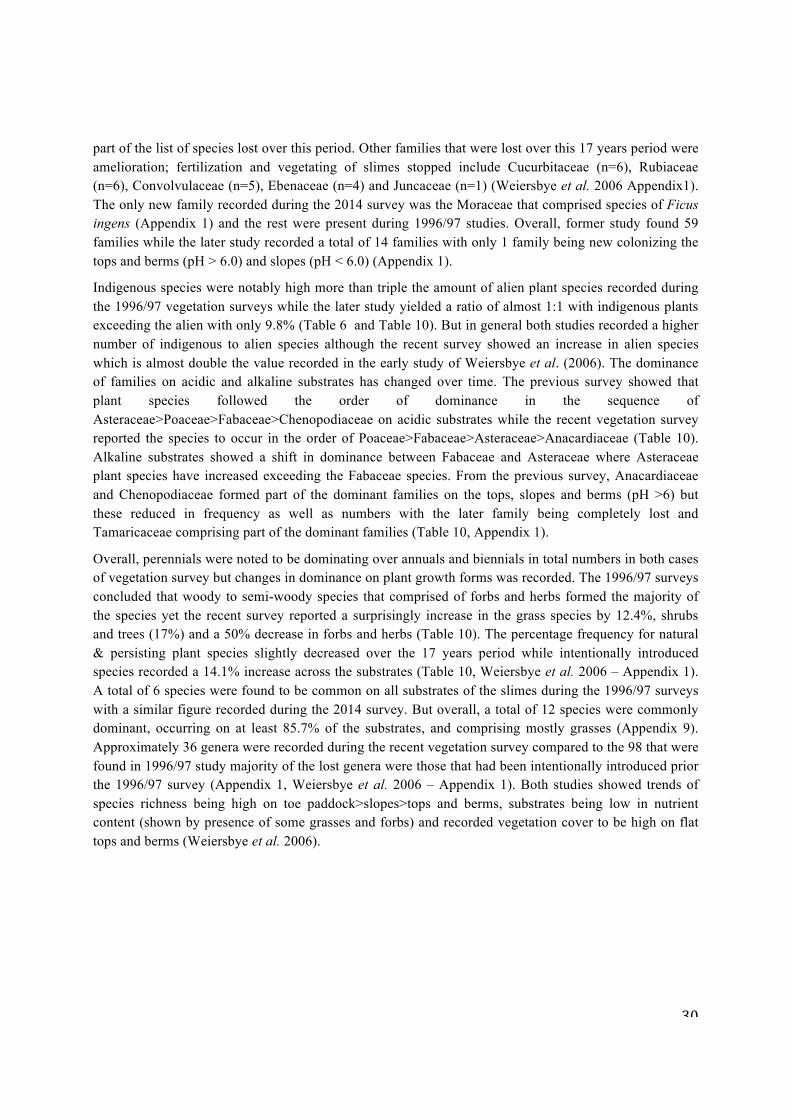
30
part of the list of species lost over this period. Other families that were lost over this 17 years period were amelioration; fertilization and vegetating of slimes stopped include Cucurbitaceae (n=6), Rubiaceae (n=6), Convolvulaceae (n=5), Ebenaceae (n=4) and Juncaceae (n=1) (Weiersbye et al. 2006 Appendix1). The only new family recorded during the 2014 survey was the Moraceae that comprised species of Ficus ingens (Appendix 1) and the rest were present during 1996/97 studies. Overall, former study found 59 families while the later study recorded a total of 14 families with only 1 family being new colonizing the tops and berms (pH > 6.0) and slopes (pH < 6.0) (Appendix 1).
Indigenous species were notably high more than triple the amount of alien plant species recorded during the 1996/97 vegetation surveys while the later study yielded a ratio of almost 1:1 with indigenous plants exceeding the alien with only 9.8% (Table 6 and Table 10). But in general both studies recorded a higher number of indigenous to alien species although the recent survey showed an increase in alien species which is almost double the value recorded in the early study of Weiersbye et al. (2006). The dominance of families on acidic and alkaline substrates has changed over time. The previous survey showed that plant species followed the order of dominance in the sequence of Asteraceae>Poaceae>Fabaceae>Chenopodiaceae on acidic substrates while the recent vegetation survey reported the species to occur in the order of Poaceae>Fabaceae>Asteraceae>Anacardiaceae (Table 10). Alkaline substrates showed a shift in dominance between Fabaceae and Asteraceae where Asteraceae plant species have increased exceeding the Fabaceae species. From the previous survey, Anacardiaceae and Chenopodiaceae formed part of the dominant families on the tops, slopes and berms (pH >6) but these reduced in frequency as well as numbers with the later family being completely lost and Tamaricaceae comprising part of the dominant families (Table 10, Appendix 1).
Overall, perennials were noted to be dominating over annuals and biennials in total numbers in both cases of vegetation survey but changes in dominance on plant growth forms was recorded. The 1996/97 surveys concluded that woody to semi-woody species that comprised of forbs and herbs formed the majority of the species yet the recent survey reported a surprisingly increase in the grass species by 12.4%, shrubs and trees (17%) and a 50% decrease in forbs and herbs (Table 10). The percentage frequency for natural & persisting plant species slightly decreased over the 17 years period while intentionally introduced species recorded a 14.1% increase across the substrates (Table 10, Weiersbye et al. 2006 – Appendix 1). A total of 6 species were found to be common on all substrates of the slimes during the 1996/97 surveys with a similar figure recorded during the 2014 survey. But overall, a total of 12 species were commonly dominant, occurring on at least 85.7% of the substrates, and comprising mostly grasses (Appendix 9). Approximately 36 genera were recorded during the recent vegetation survey compared to the 98 that were found in 1996/97 study majority of the lost genera were those that had been intentionally introduced prior the 1996/97 survey (Appendix 1, Weiersbye et al. 2006 – Appendix 1). Both studies showed trends of species richness being high on toe paddock>slopes>tops and berms, substrates being low in nutrient content (shown by presence of some grasses and forbs) and recorded vegetation cover to be high on flat tops and berms (Weiersbye et al. 2006).
31
Table 10: Sum
mary table show
ing a comparison of results obtained betw
een the 1996/97 and the 2014 vegetation surveys that were done on a
mine com
plex (Anglogold A
shanti gold tailings) in the Carletonville area in the N
orth West Province.
Parameter
1996/97 survey results 2014 survey results
Num
ber of species found 168 species in 765ha (0.22 spp./ha)
51 species in approx. 15ha (3.4 spp./ha) D
ominant species recorded
Poaceae A
steraceae Fabaceae
Anacardiaceae
23.4%
17.2%
10.5%
3.8%
35.5%
19.6%
9.8%
5.9%
N
umber of fam
ilies found 59 fam
ilies 14 fam
ilies O
rigin of species Indigenous A
lien
76.1%
23.9%
54.9%
45.1%
O
rder of species dominance
Tops, berms and slopes (pH
< 6.0) Tops, berm
s and slopes (pH > 6.0)
A
steraceae>Poaceae>Fabaceae>Chenopodiaceae
Poaceae>Fabaceae>Astereace>A
nacardiaceae>Chenopodiaceae
Poaceae>Fabaceae>A
steraceae>Anacardiaceae
Poaceae>Asteracece>Fabaceae>Tam
aricaceae Species grow
th patterns Perennials A
nnuals / Biennials
84.6%
15.4%
82.3%
17.7%
M
ethod of establishment
Natural + Persisting species
Intentionally introduced
86.6%
13.4%
72.5%
27.5%
G
rowth form
s Shrubs and trees Forbs and herbs (perennials &
annuals) G
rasses (perennials & annuals/biennials)
18.3%
58.8%
22.9%
35.3%
29.4%
35.3%
N
o. of
comm
on species
on acidic
and alkaline substrates.
6
12 (see appendix 9) V
egetation cover Flat tops and berm
s
High
H
igh Species richness order of dom
inance
High
Toe paddock > Slopes > Tops and berms
High
Toe paddock > Slopes > Tops and berms
Nutrient content
Low across all substrates
Low across all substrates
No. of genera found
98 36
32
CHAPTER 4
4.1 DISCUSSION
The study yielded a lower number of plant species compared to the 1996/97 surveys and this decrease in species richness could be attributed to a number of factors. Prior the surveys of Weiersbye et al. (2006), revegetation attempts and several trials were done as dust and erosion control measures (Thatcher 1979; Weiersbye and Witkowski, 1998; Weiersbye et al. 2006) with series of grassing attempts being done at regular intervals between 1932 and 2006 (Weiersbye et al. 2006). These revegetation attempts together with ameliorative initiatives such as leaching, liming, fertilization and irrigation that were constantly recurring accounts to the high number of plant species that were recorded prior the 2014 survey. Grass species were mostly selected for revegetation of slimes as they could easily spread and provide basal cover that mitigates for wind and soil erosion (Blight, 1991). This came to a halt after the 1996/97 surveys as it was proved to be ecologically and economically unsustainable (Witkowski and Weiersbye 1998a,b, Weiersbye et al. 2006). The grass species which were being used provided temporary plant vegetation basal cover (Halliday, 1978) a short term measure (Blight, 1991) that required consistency to achieve successful long term erosion and dust control measures. The ceasure of these ameliorative activities could be one of the major reasons that resulted in significant reduction of the total number of species (Weiersbye and Witkowski, 1998) as tailings dams naturally does not support various forms of plant growth (Grime, 1979) except those that develops ecological adaptive tolerance (Bradshaw 1970; Mehary 1994) to the toxicity and poor nutrient content (O’Connor and Bredenkamp, 1997) of the slimes thus surviving through time to naturally colonize the tailings dams.
Greater proportion of the species that were lost between the two studies over the 17 years period comprised mostly of species that were intentionally introduced prior the 1996/97 (Table 10, Appendix 1 and Weiersbye et al. 2006 – Appendix 1). A similar trend of rapid decline in introduced species on tailings dams is common on tailings dams once amelioration is ceased (Weiersbye and Witkowski, 1998; Weiersbye et al. 2006). Majority of the introduced species during the early survey were herbaceous and weedy species that depended hugely on liming, fertilization and supplementary watering or irrigation (Weiersbye et al. 2006). Since amelioration stopped post the 1996/97 survey, this explains the decrease in forbs and herbs (herbaceous) plants and increase in grasses (Table 10, Appendix 1) during the 2014 survey. Grass species colonization confirms the low/poor nutrient content (particularly nitrogen) (O’ Connor and Bredenkamp, 1997) recorded across the substrates during 2014. The existence of Stoebe vulgaris on site 2 could suggest the presence of high nitrogen availability (Roux, 1969) while the absence of Cenchrus ciliaris grass across several sites acts a reminiscent of poor nutrient content (O’ Connor and Bredenkamp, 1997; Weiersbye et al. 2006). Only 2 S. vulgaris stumps were recorded across all the sites while C. ciliaris were recorded on several sites indicating the low nitrogen levels across the substrates and sites (Appendix 1).
Apart from the cessation of amelioration activities and adaptation failure, the decline in species richness could also be attributed to climatic variability and season of sampling. Changes in management of tailings dams by different contractors over this period could also have resulted in some species loss as they might have different species of preference to use as phytoremedial species (Weiersbye pers. comm.). Climatic predictions showed that temperatures have increased at least 1.5 times more than the global predictions of 0.65 oC (IPCC, 2007; WIREs Clim Change 2014) over half a century. In South Africa, temperatures have
33
been reported to have increased by 0.13 oC from 1960 – 2003, with a further increase of 1.2 oC by 2020 (Kruger and Shongwe, 2004). Precipitation is anticipated to decline and become more erratic as well as unpredictable resulting in increased dry spell days (IPCC, 2007; WIREs Clim Change 2014). An estimated 5.4% decrease in precipitation is also predicted in South Africa by 2020 (Kruger and Shongwe, 2004) leading to high speculations that these high inter-annual & decadal variations might have had a significant role in the negative impacts felt particularly with ecosystems changes. Ecosystems and plant species are sensitive to slight changes in climatic variables (temperature, precipitation and rain days) (Bazzaz 1990, Jensen 2000 and IPCC 2007). So the fluctuations in the climatic variables over the period of study, could also have influenced the changes that have been recorded in the species composition as plants have different levels of tolerance and adaptation to disturbances. These climatic variations have been noted to be occurring at a faster rate than the rate at which species can adapt (IPCC, 2007; Hoffmann and Sgro, 2011; Merila and Hendry, 2013). This mismatch between the two rates has naturally resulted in species decline and some to extinction together with fragmentation of habitats and reduced productivity of ecosystems. Reduced ecosystems productivity leads to strong competition which also explains the loss of species particularly those that do well only in nutrient rich areas with lesser competition. The intermediate disturbance theory (IDT) allows for new species to colonize an area once a disturbance has occurred. The invasion of the area of study by invasive species could be a true reflection of disturbances that have been occurring in the area encouraging the colonization (Hoffmann and Sgro, 2011). This confirms the results of the 2014 vegetation survey, which shows a double increase in alien species while indigenous species are decreasing. Such invasive plants include the Acacia mearnsii; Phragmites australis, Cortaderia jubata, Tamarix and Rhus spp and these species exist on almost every site and on at least 50% of the substrates.
Changes in ecosystems structures as a result of disturbances can be illustrated in the shift in order of families between the 2 surveys (Table 10) where Asteraceae is displaced by Poaceae, loss of Chenopodiaceae and introduction of Tamaricaceae and Anacardiaceae as part of the dominant families yet symbolizing the decline in nutrient content of the sites as grasses colonize more of the substrates and sites (Grime, 1979; Weiersbye and Witkowski, 1998). Overall the two studies (1996/97 and 2014) shared the same trends of families dominating across the substrates, which is a distinctive ability of the species belonging to these families to be tolerant to the toxicity of heavy metals found on the tailings dams (Weiersbye et al. 2006). Several studies that have been done including that of Witkowski and Weiersbye, 1998b; Weiersbye et al. 1998 and Dye et al. 2005 found that hard-seeded legumes together with the Rhus species do not suffer heavily compromised growth under acidic conditions of the slimes or Acid Mine Drainage (AMD) (Weiersbye et al. 2006). This reaffirms the findings of the recent survey where woody species were noted to have increased double (Table 10) as they can adapt better to polluted soils of the slimes (Angus, 2005).
Majority of the species recorded were perennials that comprised of natural colonizers and persisting plant species occurring in great numbers on flat surfaces. These species occurred particularly on the south and west slopes with high moisture content and low temperatures. The most favoured substrates by plants included the tops & berms and toe paddocks, a trend previously identified in the 1996/97 study (Weiersbye et al. 2006). This could be as a result of high erosional activities occurring on the slopes (Weiersbye and Witkowski, 1998) while pH also influenced and contributed to the low number of species on the marginally acidic to alkaline (pH > 6) substrates (these substrates are also far from the seed sources on the ground) (Weiersbye et al. 2006). On sites that were located on active dams, the numbers of plant
34
species existing on the top substrates were also influenced by the slurry that was being frequently deposited. Deposition of fresh slimes frequently does not allow the oxidation of the tailings making them alkaline as well as accumulates the toxic components such as pyrite resulting in high Ec and low nutrient content. It is a combination of these conditions that create an inhospitable environment for plant growth on the young and active tailings dams. The naturally colonizing species formed much of the perennials and these were dominated by the woody and semi-woody species a familiar type of growth form within the locality (Bredenkamp and Brown, 1995a,b; Retief and Herman, 1997). This colonization of the tailings by woody and semi-woody species convincingly suggests that these are the potential plant growth forms for the rehabilitation of the tailings dams (Weiersbye et al. 2006).
Although natural colonizers and persisting plant species formed majority of the plant species found. Their actual contribution to vegetation basal cover was low in both studies (1996/97 and 2014) compared to intentionally introduced species that had lower number of species richness but contributed significantly to the total vegetation basal cover. Studies that have been done (Straker et al. 2006a, b) concludes that most of the persisting plant species on tailings dams are infected by arbuscular mycorrhizal (AM) fungi and it is the tolerance of these AM fungi to slimes that significantly contribute to the host plant’s growth and survival in acidic slimes (Weiersbye et al. 1998; Weiersbye et al. 2006; Straker et al. 2006c). Overall, the slight decline in the natural species and increase in the introduced species could be accounted by the invasion of the invasive species (Tamarix spp., Phragmites spp., etc) that were introduced.
Trends that illustrate species distribution across the tailings dams show that some species are only identified to be occurring on particular substrates preferably the western facing slopes. This is because these western slopes have cooler temperatures and are usually high in moisture content encouraging plant growth. Preference in aspects is an indication of an adaptive physiological tolerance to fluctuations in variables and essentials for plant growth which include the availability of nutrients and differences in moisture content (Gaff and Ellis, 1974; Weiersbye et al. 2006). Grass species that include Sporobolus and Eragrostis are normally associated with high tolerance to dry conditions and occur on arid substrates particularly the east-facing slopes (Gaff, 1971; Weiersbye et al. 2006). Some plant species have been noted to develop tolerance to the saline and high conductivity nature of the slimes (Witkowski and Weiersbye, 1998a, Weiersbye et al. 2006) thus enabling them to naturally inhabit either the marginal acidic to alkaline (pH > 6 or = 6) substrates of the tailings dams. Such plant species include the Tamarix spp., which exhibit high levels of physiological tolerance to natural selection pressure (Mehary, 1994) which encompasses low essential macronutrients (Nitrogen, Potassium, Phosphorus, Magnesium and Calcium), high concentration of heavy metals and salinity (Weiersbye et al. 2006). Studies (Witkowski and Weiersbye, 1998; Weiersbye and Witkowski, 2002b) have shown that plant species occurring on tailings dams are able to maintain their regeneration potential but show signs of depressed seed viability and production levels when compared to those occurring on unpolluted soils (Weiersbye et al. 2006). Rhus species (particularly R. lancea) and the grasses C. dactylon and H. hirta have become commonly utilized for rehabilitation purposes because of their capability to vigorously grow in AMD yet maintaining high evapotranspiration rates (Dye et al. 2005) and ability to tolerate salinity as well as acidic environments respectively (Weiersbye et al. 2006).
The plant functional growth forms showed that shrubs and trees increased to almost double over the period. This is because most of the trees that were present prior to both studies have been reported to survive for long periods (a clear sign of physiological tolerance) (Weiersbye et al. 2006). Apart from the

35
already existing tree species, introduced tree species such as the Tamarix spp., Rhus spp., Acacia spp. and Eucalyptus spp. seemed to have adapted well on the tailings dams, resulting to the recorded increases. Grasses also increased during the same time, almost 1.5 times, mainly because they are adapted to the low nutrient conditions and their temporal nature (Witkowski and Weiersbye, 1998; Dharamraj et al. 1999; Angus, 2005). A total of 12 species were identified to be common across all the substrates and sites compared to six that were recorded in the former study. Most of these common species were alien introduced species that have been invading open spaces (Appendix 9).
36
4.2 CONCLUSION
The 2014 vegetation survey yielded a lower number of plant species (51 species) compared to the 1996/7 survey. Amongst these species, only six (6) were common to all substrates with an additional seven (7) occurring on at least 85.7% of the substrates. Approximately 66.7% of the species common to all substrates were grasses while the other seven common species comprised of shrubs & trees and herbs as well as small proportion of grasses (Appendix 9). The most represented families were Poaceae, Asteraceae, Fabaceae and Anacardiaceae in that order of dominance (a similar trend recorded in the 1996/97 survey). This result reaffirms the suggestion that was made by several studies that species of these families have developed excellent adaptive mechanisms which allows them to survive and vigorously grow in polluted soils of the tailings dams. Species listed in Appendix 8 summarizes the potential phytoremedial species that can be used for rehabilitation of similar gold tailings dams. This list was developed from the species that were exhibiting satisfactory progress of colonizing the tailings dams since the ameliorative initiatives were stopped post the 1996/97 survey till the 2014 vegetation survey. Majority of the species that were excellent colonizers have been noted to be indigenous species naturally occurring, but a remarkable improvement has been recorded with some alien species that were introduced prior the 1996/97 survey and have naturally colonized the tailings dams over the 17 years’ period. Greater proportion of the species that were lost during the period between the two surveys were mainly herbaceous plants that were introduced prior the 1996/97 as most of them dependent on supplementary initiatives (liming, fertilization, leaching & irrigation) for their growth (Weiersbye and Witkowski, 1998). This explains why the 2014 survey recorded a 50% decrease in herbaceous plants while woody, semi-woody and grasses have almost doubled. All the 117 species that were lost, accounts for the decrease in 62 genera and 45 families that was recorded between the two surveys. A large proportion (82.3%) of the species colonizing were perennials, dominated by shrubs & trees, grasses and resprouting herbs & forbs. Annuals & biennials contributed to the remaining 17.7% with herbs dominating compared to annual grasses. Overall, the contribution of perennials to annuals between the two surveys did not change significantly although there was a 2.3% decrease in the former and a similar increase to the latter. An increase in the dominance by grasses is an indication of how these tailings maybe be suffering from poor nutritional value including macronutrients (particularly Nitrogen, Carbon & Organic carbon) as well as lack of organic matter. Basal vegetation cover recorded was noted to be high on flat surfaces which were not highly susceptible to erosion compared to slopes in both surveys. A comparison of the chemical composition between dams of the two surveys could not be done as there is no baseline data for first survey as well as data for each particular plot (all data pooled) thus limiting the level of analysis to area (Carletonville) level. In conclusion, the results of this study shows that the management and contractors in the rehabilitation industry should not only use of indigenous plant species, but also need to consider alien species that have a great potential of naturally colonizing on the tailings dams. Such species also have high capacity to providing sustainable basal cover, dust control and erosion control than the previously utilized indigenous species some of which were lost.
37
4.3 RECOMMENDATIONS
Based on the results that were obtained from this vegetation survey where only Carletonville was used as a study site, these can be used as baseline or referral points that gives a hint of what has happened over time. But for conclusive comparison purposes, l would recommend that:
§ This study is repeated in the 2 other districts (Klerksdorp and Welkom) that were surveyed in 1996/7, so that the findings can be concluded based on a larger sample, which is a true representative of the initial survey.
§ A survey of the similar nature is conducted during the wet season so as to be able to identify all the species including those only appear during the rainy season as the initial survey included both seasons.
§ A better method of estimating each species frequency be used particularly with grasses species colonies which would be a complex of different species difficult to estimate.
38
REFERENCES
Acocks, J.P.H. 1988. Veld types of South Africa, edn 3. Memoirs of the Botanical Survey of South Africa No. 57. Botanical Research Institute, Pretoria.
Akala, V.A., Lal, R. 2001. Soil organic carbon pools and sequestration rates in reclaimed mine soils in Ohio. J. Environ. Qual. 30, 2098-2104
Anderson, J.M., Ingram, J.S.I., 1993. Tropical Soil Biology and Fertility: A Handbook of Methods. CAB International, Wallingford, UK.
AngloGold Ashanti. 2014. AngloGold Ashanti Annual integrated Report. Angus, C. 2005. The use of AFLP analysis to determine genetic differences of populations of a plant
species on and off tailings dams. M.Sc. dissertation, University of the Witwatersrand, Johannesburg. Unpublished.
Anhaesser, C.R. 1987. Geology and mineralogy of the principal goldfields of South Africa. In G.G. Stanley, The extractive metallurgy of gold in South Africa, vol. 1. South African Institute of Mining and Metallurgy, Johannesburg.
Anon, 2003. Improve Coal Mine Safety Monitoring, with Emphasis on Methane Control. Heilongjiang SCMSA, SAWS Website, Feb 16.
Anon (2005) NIOSH Mining Safety and Health Research: Mining Fatalities. [http://www.cdc.gov/niosh/mining/statistics/fatalities.htm],
Asensio. N, Brockelman. W.Y, Malaivijitnond.S and Reichard.U. 2011. Gibbon travel paths are goal oriented. Animal Cognition. 14, 395 - 405
Atmospheric Pollution Prevention Act 45. 1965. Department of Minerals and Energy of South Africa. Barrutia, O., Garbisu, C., Epelde, L., Sampedro, M.C., Goicolea, M.A., Becerril, J.M., 2011. Plant
tolerance to diesel minimizes its impact on soil microbial characteristics during rhizoremediation of diesel-contaminated soils. Sci. Total Environ. 409, 4087–4093.
Bazzaz, F.A. (1990). The response of natural ecosystems to the rising global carbon dioxide levels. Annual review of Ecology and Systematics.
Blight, G.E. 1991. Erosion and anti-erosion measures for abandoned gold tailings dams. Proceedings of the National Meeting of the American Society for Surface Mining and Reclamation, Durongo, Colorado, May 1991: 323–330.
Bosch, D.W. 1987. Retreatment of residues and waste rock. In G.G. Stanley, The extractive metallurgy of gold in South Africa, vol. 2. South African Institute of Mining and Metallurgy, Johannesburg.
Boulet MP, Larocque ACL. A comparative mineralogical and geochemical study of sulfide mine tailings at two sites in New Mexico, USA. Environ Geol. 1998;33:130–142.
Bradshaw, A.D. 1970. Pollution and plant evolution. New Scientist 48: 497–500. Bradshaw, C. M., Szabadi, E., and Bevan, P. Relationship between response rate and reinforcement
frequency in variable-interval schedules: The effect of the concentration of sucrose reinforcement. Journal of the Experimental Analysis of Behavior, 1978, 29, 447-452.
Bradshaw AD. Understanding the fundamentals of succession. In: Miles J, Walton DH, editors. Primary succession on land. Oxford: Blackwell; 1993.
Bradshaw, A. D. 2000. The use of natural processes in reclamation–advantages and difficulties. Landscape and Urban Planning 51:89–100.
Bredenkamp, G.J. and Brown, L.R. 1995a. The vegetation of the Williams Game Park, Vaal Reefs. Ecotrust Contract No. 0325/ VX/W 312198.
Bredenkamp, G.J. and Brown, L.R. 1995b. The vegetation and wildlife management of the Mispah Game Farm, Vaal Reefs. Ecotrust Contract No. 0325VXW312915.
Chapman. H. D and Pratt. P.F. 1961. Methods of analysis for Soils, Plants and Waters. University of California: Division of Agricultural Sciences.
Chamber of Mines of South Africa, 2004. Facts and Figures. Produced by Communications Services of the Chamber of Mines of South Africa, Johannesburg. �
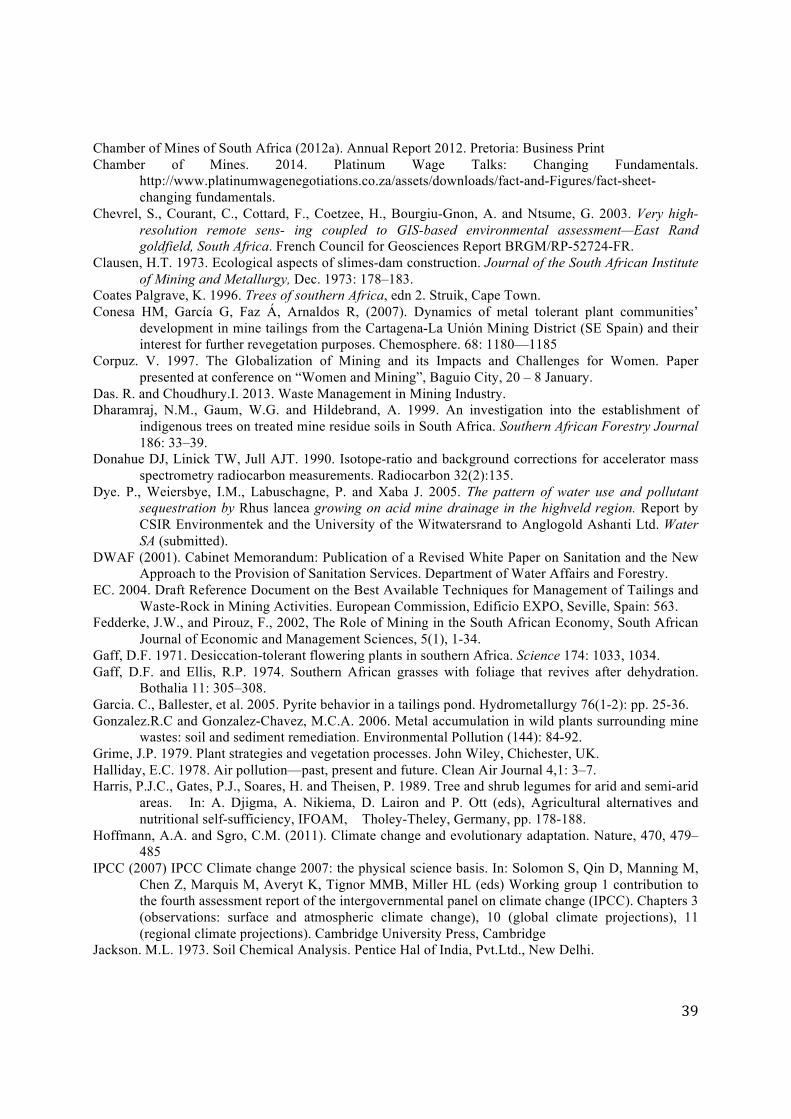
39
Chamber of Mines of South Africa (2012a). Annual Report 2012. Pretoria: Business Print Chamber of Mines. 2014. Platinum Wage Talks: Changing Fundamentals.
http://www.platinumwagenegotiations.co.za/assets/downloads/fact-and-Figures/fact-sheet-changing fundamentals.
Chevrel, S., Courant, C., Cottard, F., Coetzee, H., Bourgiu-Gnon, A. and Ntsume, G. 2003. Very high-resolution remote sens- ing coupled to GIS-based environmental assessment—East Rand goldfield, South Africa. French Council for Geosciences Report BRGM/RP-52724-FR.
Clausen, H.T. 1973. Ecological aspects of slimes-dam construction. Journal of the South African Institute of Mining and Metallurgy, Dec. 1973: 178–183.�
Coates Palgrave, K. 1996. Trees of southern Africa, edn 2. Struik, Cape Town. � Conesa HM, García G, Faz Á, Arnaldos R, (2007). Dynamics of metal tolerant plant communities’
development in mine tailings from the Cartagena-La Unión Mining District (SE Spain) and their interest for further revegetation purposes. Chemosphere. 68: 1180—1185
Corpuz. V. 1997. The Globalization of Mining and its Impacts and Challenges for Women. Paper presented at conference on “Women and Mining”, Baguio City, 20 – 8 January.
Das. R. and Choudhury.I. 2013. Waste Management in Mining Industry. Dharamraj, N.M., Gaum, W.G. and Hildebrand, A. 1999. An investigation into the establishment of
indigenous trees on treated mine residue soils in South Africa. Southern African Forestry Journal 186: 33–39.
Donahue DJ, Linick TW, Jull AJT. 1990. Isotope-ratio and background corrections for accelerator mass spectrometry radiocarbon measurements. Radiocarbon 32(2):135.
Dye. P., Weiersbye, I.M., Labuschagne, P. and Xaba J. 2005. The pattern of water use and pollutant sequestration by Rhus lancea growing on acid mine drainage in the highveld region. Report by CSIR Environmentek and the University of the Witwatersrand to Anglogold Ashanti Ltd. Water SA (submitted).
DWAF (2001). Cabinet Memorandum: Publication of a Revised White Paper on Sanitation and the New Approach to the Provision of Sanitation Services. Department of Water Affairs and Forestry.
EC. 2004. Draft Reference Document on the Best Available Techniques for Management of Tailings and Waste-Rock in Mining Activities. European Commission, Edificio EXPO, Seville, Spain: 563.
Fedderke, J.W., and Pirouz, F., 2002, The Role of Mining in the South African Economy, South African Journal of Economic and Management Sciences, 5(1), 1-34.
Gaff, D.F. 1971. Desiccation-tolerant flowering plants in southern Africa. Science 174: 1033, 1034. Gaff, D.F. and Ellis, R.P. 1974. Southern African grasses with foliage that revives after dehydration.
Bothalia 11: 305–308. Garcia. C., Ballester, et al. 2005. Pyrite behavior in a tailings pond. Hydrometallurgy 76(1-2): pp. 25-36. Gonzalez.R.C and Gonzalez-Chavez, M.C.A. 2006. Metal accumulation in wild plants surrounding mine
wastes: soil and sediment remediation. Environmental Pollution (144): 84-92. Grime, J.P. 1979. Plant strategies and vegetation processes. John Wiley, Chichester, UK. Halliday, E.C. 1978. Air pollution—past, present and future. Clean Air Journal 4,1: 3–7. Harris, P.J.C., Gates, P.J., Soares, H. and Theisen, P. 1989. Tree and shrub legumes for arid and semi-arid
areas. � In: A. Djigma, A. Nikiema, D. Lairon and P. Ott (eds), Agricultural alternatives and nutritional self-sufficiency, IFOAM, � Tholey-Theley, Germany, pp. 178-188.
Hoffmann, A.A. and Sgro, C.M. (2011). Climate change and evolutionary adaptation. Nature, 470, 479–485
IPCC (2007) IPCC Climate change 2007: the physical science basis. In: Solomon S, Qin D, Manning M, Chen Z, Marquis M, Averyt K, Tignor MMB, Miller HL (eds) Working group 1 contribution to the fourth assessment report of the intergovernmental panel on climate change (IPCC). Chapters 3 (observations: surface and atmospheric climate change), 10 (global climate projections), 11 (regional climate projections). Cambridge University Press, Cambridge
Jackson. M.L. 1973. Soil Chemical Analysis. Pentice Hal of India, Pvt.Ltd., New Delhi.
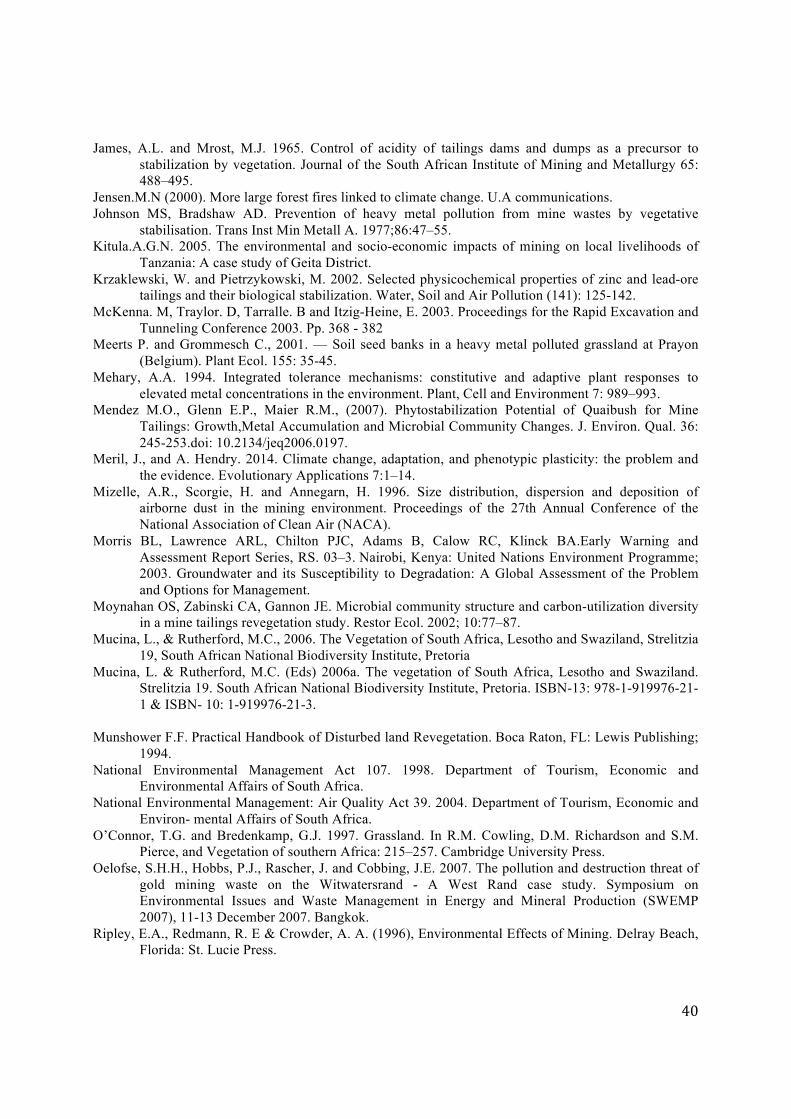
40
James, A.L. and Mrost, M.J. 1965. Control of acidity of tailings dams and dumps as a precursor to stabilization by vegetation. Journal of the South African Institute of Mining and Metallurgy 65: 488–495. �
Jensen.M.N (2000). More large forest fires linked to climate change. U.A communications. Johnson MS, Bradshaw AD. Prevention of heavy metal pollution from mine wastes by vegetative
stabilisation. Trans Inst Min Metall A. 1977;86:47–55. Kitula.A.G.N. 2005. The environmental and socio-economic impacts of mining on local livelihoods of
Tanzania: A case study of Geita District. Krzaklewski, W. and Pietrzykowski, M. 2002. Selected physicochemical properties of zinc and lead-ore
tailings and their biological stabilization. Water, Soil and Air Pollution (141): 125-142. McKenna. M, Traylor. D, Tarralle. B and Itzig-Heine, E. 2003. Proceedings for the Rapid Excavation and
Tunneling Conference 2003. Pp. 368 - 382 Meerts P. and Grommesch C., 2001. — Soil seed banks in a heavy metal polluted grassland at Prayon
(Belgium). Plant Ecol. 155: 35-45. Mehary, A.A. 1994. Integrated tolerance mechanisms: constitutive and adaptive plant responses to
elevated metal concentrations in the environment. Plant, Cell and Environment 7: 989–993. Mendez M.O., Glenn E.P., Maier R.M., (2007). Phytostabilization Potential of Quaibush for Mine
Tailings: Growth,Metal Accumulation and Microbial Community Changes. J. Environ. Qual. 36: 245-253.doi: 10.2134/jeq2006.0197.
Meril, J., and A. Hendry. 2014. Climate change, adaptation, and phenotypic plasticity: the problem and the evidence. Evolutionary Applications 7:1–14.
Mizelle, A.R., Scorgie, H. and Annegarn, H. 1996. Size distribution, dispersion and deposition of airborne dust in the mining environment. Proceedings of the 27th Annual Conference of the National Association of Clean Air (NACA).
Morris BL, Lawrence ARL, Chilton PJC, Adams B, Calow RC, Klinck BA.Early Warning and Assessment Report Series, RS. 03–3. Nairobi, Kenya: United Nations Environment Programme; 2003. Groundwater and its Susceptibility to Degradation: A Global Assessment of the Problem and Options for Management.
Moynahan OS, Zabinski CA, Gannon JE. Microbial community structure and carbon-utilization diversity in a mine tailings revegetation study. Restor Ecol. 2002; 10:77–87.
Mucina, L., & Rutherford, M.C., 2006. The Vegetation of South Africa, Lesotho and Swaziland, Strelitzia 19, South African National Biodiversity Institute, Pretoria
Mucina, L. & Rutherford, M.C. (Eds) 2006a. The vegetation of South Africa, Lesotho and Swaziland. Strelitzia 19. South African National Biodiversity Institute, Pretoria. ISBN-13: 978-1-919976-21-1 & ISBN- 10: 1-919976-21-3.
Munshower F.F. Practical Handbook of Disturbed land Revegetation. Boca Raton, FL: Lewis Publishing;
1994. National Environmental Management Act 107. 1998. Department of Tourism, Economic and
Environmental Affairs of South Africa. National Environmental Management: Air Quality Act 39. 2004. Department of Tourism, Economic and
Environ- mental Affairs of South Africa. O’Connor, T.G. and Bredenkamp, G.J. 1997. Grassland. In R.M. Cowling, D.M. Richardson and S.M.
Pierce, and Vegetation of southern Africa: 215–257. Cambridge University Press. Oelofse, S.H.H., Hobbs, P.J., Rascher, J. and Cobbing, J.E. 2007. The pollution and destruction threat of
gold mining waste on the Witwatersrand - A West Rand case study. Symposium on Environmental Issues and Waste Management in Energy and Mineral Production (SWEMP 2007), 11-13 December 2007. Bangkok.
Ripley, E.A., Redmann, R. E & Crowder, A. A. (1996), Environmental Effects of Mining. Delray Beach, Florida: St. Lucie Press.
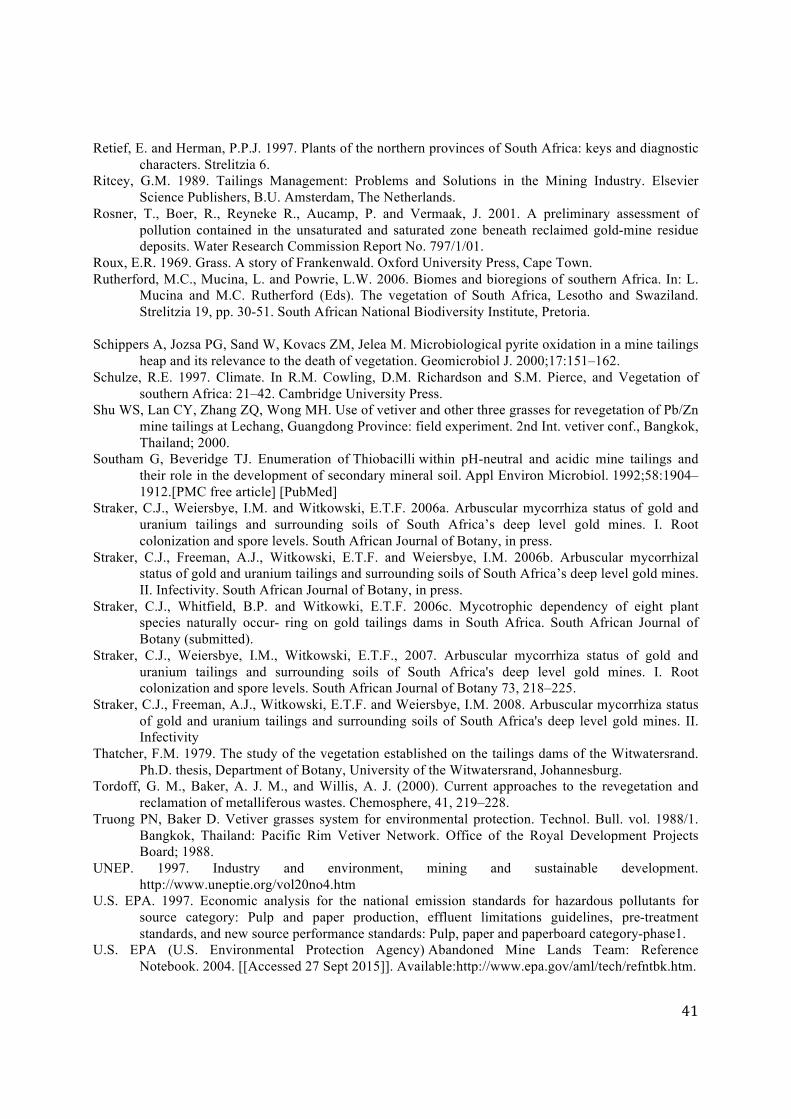
41
Retief, E. and Herman, P.P.J. 1997. Plants of the northern provinces of South Africa: keys and diagnostic characters. Strelitzia 6.
Ritcey, G.M. 1989. Tailings Management: Problems and Solutions in the Mining Industry. Elsevier Science Publishers, B.U. Amsterdam, The Netherlands.
Rosner, T., Boer, R., Reyneke R., Aucamp, P. and Vermaak, J. 2001. A preliminary assessment of pollution contained in the unsaturated and saturated zone beneath reclaimed gold-mine residue deposits. Water Research Commission Report No. 797/1/01.
Roux, E.R. 1969. Grass. A story of Frankenwald. Oxford University Press, Cape Town. Rutherford, M.C., Mucina, L. and Powrie, L.W. 2006. Biomes and bioregions of southern Africa. In: L.
Mucina and M.C. Rutherford (Eds). The vegetation of South Africa, Lesotho and Swaziland. Strelitzia 19, pp. 30-51. South African National Biodiversity Institute, Pretoria.
Schippers A, Jozsa PG, Sand W, Kovacs ZM, Jelea M. Microbiological pyrite oxidation in a mine tailings
heap and its relevance to the death of vegetation. Geomicrobiol J. 2000;17:151–162. Schulze, R.E. 1997. Climate. In R.M. Cowling, D.M. Richardson and S.M. Pierce, and Vegetation of
southern Africa: 21–42. Cambridge University Press. Shu WS, Lan CY, Zhang ZQ, Wong MH. Use of vetiver and other three grasses for revegetation of Pb/Zn
mine tailings at Lechang, Guangdong Province: field experiment. 2nd Int. vetiver conf., Bangkok, Thailand; 2000.
Southam G, Beveridge TJ. Enumeration of Thiobacilli within pH-neutral and acidic mine tailings and their role in the development of secondary mineral soil. Appl Environ Microbiol. 1992;58:1904–1912.[PMC free article] [PubMed]
Straker, C.J., Weiersbye, I.M. and Witkowski, E.T.F. 2006a. Arbuscular mycorrhiza status of gold and uranium tailings and surrounding soils of South Africa’s deep level gold mines. I. Root colonization and spore levels. South African Journal of Botany, in press.
Straker, C.J., Freeman, A.J., Witkowski, E.T.F. and Weiersbye, I.M. 2006b. Arbuscular mycorrhizal status of gold and uranium tailings and surrounding soils of South Africa’s deep level gold mines. II. Infectivity. South African Journal of Botany, in press.
Straker, C.J., Whitfield, B.P. and Witkowki, E.T.F. 2006c. Mycotrophic dependency of eight plant species naturally occur- ring on gold tailings dams in South Africa. South African Journal of Botany (submitted).
Straker, C.J., Weiersbye, I.M., Witkowski, E.T.F., 2007. Arbuscular mycorrhiza status of gold and uranium tailings and surrounding soils of South Africa's deep level gold mines. I. Root colonization and spore levels. South African Journal of Botany 73, 218–225.
Straker, C.J., Freeman, A.J., Witkowski, E.T.F. and Weiersbye, I.M. 2008. Arbuscular mycorrhiza status of gold and uranium tailings and surrounding soils of South Africa's deep level gold mines. II. Infectivity
Thatcher, F.M. 1979. The study of the vegetation established on the tailings dams of the Witwatersrand. Ph.D. thesis, Department of Botany, University of the Witwatersrand, Johannesburg.
Tordoff, G. M., Baker, A. J. M., and Willis, A. J. (2000). Current approaches to the revegetation and reclamation of metalliferous wastes. Chemosphere, 41, 219–228.
Truong PN, Baker D. Vetiver grasses system for environmental protection. Technol. Bull. vol. 1988/1. Bangkok, Thailand: Pacific Rim Vetiver Network. Office of the Royal Development Projects Board; 1988.
UNEP. 1997. Industry and environment, mining and sustainable development. http://www.uneptie.org/vol20no4.htm
U.S. EPA. 1997. Economic analysis for the national emission standards for hazardous pollutants for source category: Pulp and paper production, effluent limitations guidelines, pre-treatment standards, and new source performance standards: Pulp, paper and paperboard category-phase1.
U.S. EPA (U.S. Environmental Protection Agency) Abandoned Mine Lands Team: Reference Notebook. 2004. [[Accessed 27 Sept 2015]]. Available:http://www.epa.gov/aml/tech/refntbk.htm.
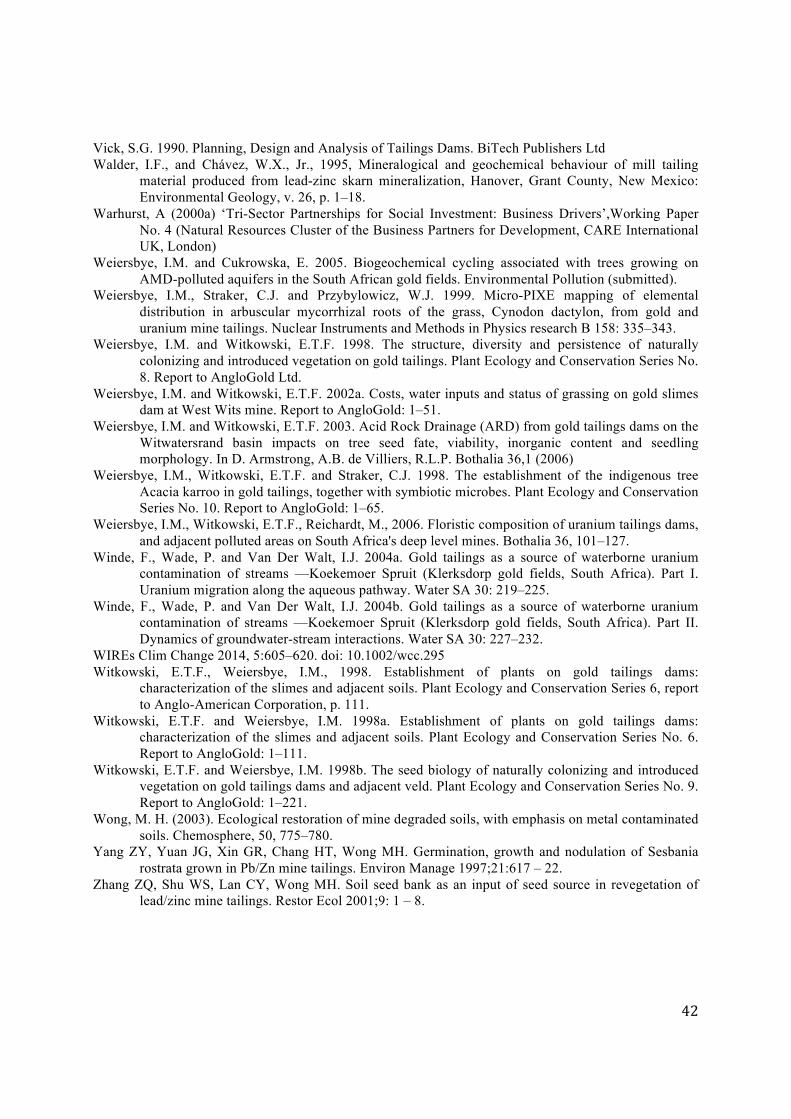
42
Vick, S.G. 1990. Planning, Design and Analysis of Tailings Dams. BiTech Publishers Ltd Walder, I.F., and Chávez, W.X., Jr., 1995, Mineralogical and geochemical behaviour of mill tailing
material produced from lead-zinc skarn mineralization, Hanover, Grant County, New Mexico: Environmental Geology, v. 26, p. 1–18.
Warhurst, A (2000a) ‘Tri-Sector Partnerships for Social Investment: Business Drivers’,Working Paper No. 4 (Natural Resources Cluster of the Business Partners for Development, CARE International UK, London)
Weiersbye, I.M. and Cukrowska, E. 2005. Biogeochemical cycling associated with trees growing on AMD-polluted aquifers in the South African gold fields. Environmental Pollution (submitted).
Weiersbye, I.M., Straker, C.J. and Przybylowicz, W.J. 1999. Micro-PIXE mapping of elemental distribution in arbuscular mycorrhizal roots of the grass, Cynodon dactylon, from gold and uranium mine tailings. Nuclear Instruments and Methods in Physics research B 158: 335–343.
Weiersbye, I.M. and Witkowski, E.T.F. 1998. The structure, diversity and persistence of naturally colonizing and introduced vegetation on gold tailings. Plant Ecology and Conservation Series No. 8. Report to AngloGold Ltd.
Weiersbye, I.M. and Witkowski, E.T.F. 2002a. Costs, water inputs and status of grassing on gold slimes dam at West Wits mine. Report to AngloGold: 1–51.
Weiersbye, I.M. and Witkowski, E.T.F. 2003. Acid Rock Drainage (ARD) from gold tailings dams on the Witwatersrand basin impacts on tree seed fate, viability, inorganic content and seedling morphology. In D. Armstrong, A.B. de Villiers, R.L.P. Bothalia 36,1 (2006)
Weiersbye, I.M., Witkowski, E.T.F. and Straker, C.J. 1998. The establishment of the indigenous tree Acacia karroo in gold tailings, together with symbiotic microbes. Plant Ecology and Conservation Series No. 10. Report to AngloGold: 1–65.
Weiersbye, I.M., Witkowski, E.T.F., Reichardt, M., 2006. Floristic composition of uranium tailings dams, and adjacent polluted areas on South Africa's deep level mines. Bothalia 36, 101–127.
Winde, F., Wade, P. and Van Der Walt, I.J. 2004a. Gold tailings as a source of waterborne uranium contamination of streams —Koekemoer Spruit (Klerksdorp gold fields, South Africa). Part I. Uranium migration along the aqueous pathway. Water SA 30: 219–225.
Winde, F., Wade, P. and Van Der Walt, I.J. 2004b. Gold tailings as a source of waterborne uranium contamination of streams —Koekemoer Spruit (Klerksdorp gold fields, South Africa). Part II. Dynamics of groundwater-stream interactions. Water SA 30: 227–232.
WIREs Clim Change 2014, 5:605–620. doi: 10.1002/wcc.295 Witkowski, E.T.F., Weiersbye, I.M., 1998. Establishment of plants on gold tailings dams:
characterization of the slimes and adjacent soils. Plant Ecology and Conservation Series 6, report to Anglo-American Corporation, p. 111.
Witkowski, E.T.F. and Weiersbye, I.M. 1998a. Establishment of plants on gold tailings dams: characterization of the slimes and adjacent soils. Plant Ecology and Conservation Series No. 6. Report to AngloGold: 1–111.
Witkowski, E.T.F. and Weiersbye, I.M. 1998b. The seed biology of naturally colonizing and introduced vegetation on gold tailings dams and adjacent veld. Plant Ecology and Conservation Series No. 9. Report to AngloGold: 1–221.
Wong, M. H. (2003). Ecological restoration of mine degraded soils, with emphasis on metal contaminated soils. Chemosphere, 50, 775–780.
Yang ZY, Yuan JG, Xin GR, Chang HT, Wong MH. Germination, growth and nodulation of Sesbania rostrata grown in Pb/Zn mine tailings. Environ Manage 1997;21:617 – 22.
Zhang ZQ, Shu WS, Lan CY, Wong MH. Soil seed bank as an input of seed source in revegetation of lead/zinc mine tailings. Restor Ecol 2001;9: 1 – 8.
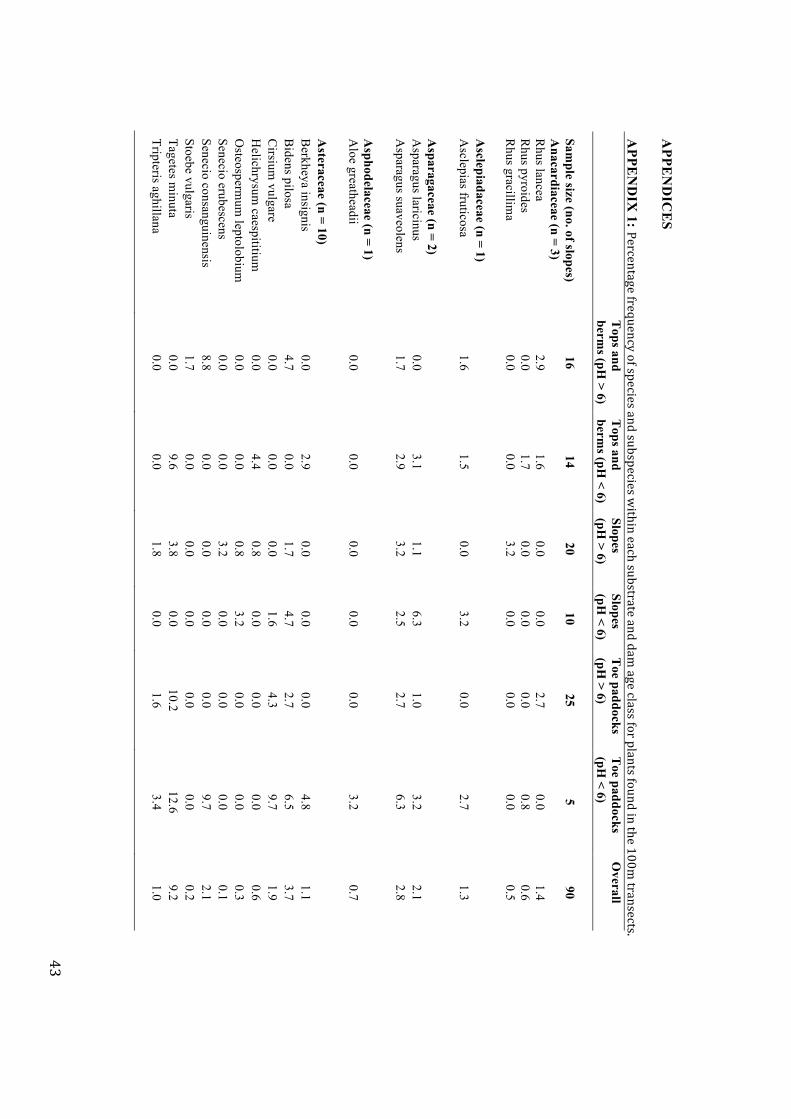
43
APPE
ND
ICE
S
APPE
ND
IX 1: Percentagefrequencyofspeciesandsubspecieswithineachsubstrateanddam
ageclassforplantsfoundinthe100mtransects.
T
ops and berm
s (pH > 6)
Tops and
berms (pH
< 6) Slopes (pH
> 6) Slopes (pH
< 6) T
oe paddocks (pH
> 6) T
oe paddocks (pH
< 6) O
verall
Sample size (no. of slopes)
16 14
20 10
25 5
90 A
nacardiaceae (n = 3)
Rhus lancea
2.9 1.6
0.0 0.0
2.7 0.0
1.4 R
hus pyroides 0.0
1.7 0.0
0.0 0.0
0.8 0.6
Rhus gracillim
a 0.0
0.0 3.2
0.0 0.0
0.0 0.5
Asclepiadaceae (n = 1)
A
sclepias fruticosa 1.6
1.5 0.0
3.2 0.0
2.7 1.3
Asparagaceae (n = 2)
A
sparagus laricinus 0.0
3.1 1.1
6.3 1.0
3.2 2.1
Asparagus suaveolens
1.7 2.9
3.2 2.5
2.7 6.3
2.8
A
sphodelaceae (n = 1)
Aloe greatheadii
0.0 0.0
0.0 0.0
0.0 3.2
0.7
A
steraceae (n = 10)
Berkheya insignis
0.0 2.9
0.0 0.0
0.0 4.8
1.1 B
idens pilosa 4.7
0.0 1.7
4.7 2.7
6.5 3.7
Cirsium
vulgare 0.0
0.0 0.0
1.6 4.3
9.7 1.9
Helichrysum
caespititium
0.0 4.4
0.8 0.0
0.0 0.0
0.6 O
steospermum
leptolobium
0.0 0.0
0.8 3.2
0.0 0.0
0.3 Senecio erubescens
0.0 0.0
3.2 0.0
0.0 0.0
0.1 Senecio consanguinensis
8.8 0.0
0.0 0.0
0.0 9.7
2.1 Stoebe vulgaris
1.7 0.0
0.0 0.0
0.0 0.0
0.2 Tagetes m
inuta 0.0
9.6 3.8
0.0 10.2
12.6 9.2
Tripteris aghillana 0.0
0.0 1.8
0.0 1.6
3.4 1.0
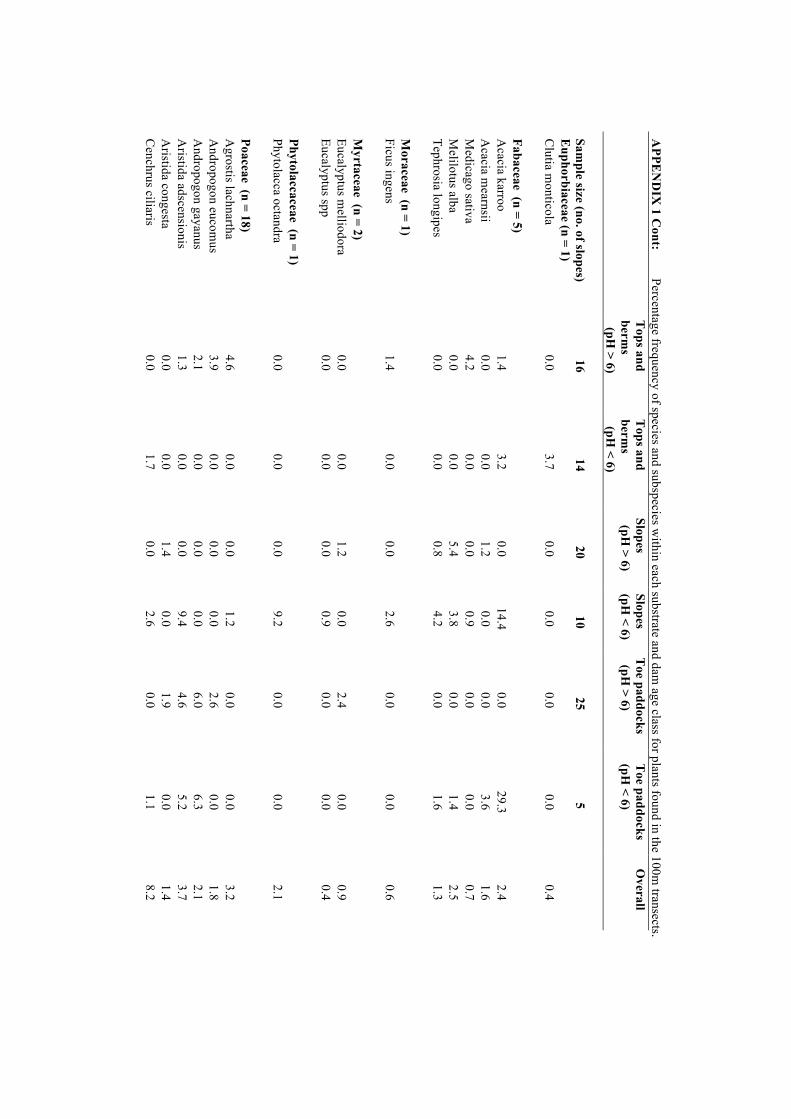
44
APPE
ND
IX 1 C
ont: Percentage frequency of species and subspecies w
ithin each substrate and dam age class for plants found in the 100m
transects.
Tops and
berms
(pH > 6)
Tops and
berms
(pH < 6)
Slopes (pH
> 6) Slopes (pH
< 6) T
oe paddocks (pH
> 6) T
oe paddocks (pH
< 6) O
verall
Sample size (no. of slopes)
16 14
20 10
25 5
Euphorbiaceae (n = 1)
C
lutia monticola
0.0 3.7
0.0 0.0
0.0 0.0
0.4
Fabaceae (n = 5)
A
cacia karroo 1.4
3.2 0.0
14.4 0.0
29.3 2.4
Acacia m
earnsii 0.0
0.0 1.2
0.0 0.0
3.6 1.6
Medicago sativa
4.2 0.0
0.0 0.9
0.0 0.0
0.7 M
elilotus alba 0.0
0.0 5.4
3.8 0.0
1.4 2.5
Tephrosia longipes 0.0
0.0 0.8
4.2 0.0
1.6 1.3
Moraceae (n = 1)
Ficus ingens
1.4 0.0
0.0 2.6
0.0 0.0
0.6
M
yrtaceae (n = 2)
Eucalyptus melliodora
0.0 0.0
1.2 0.0
2.4 0.0
0.9 Eucalyptus spp
0.0 0.0
0.0 0.9
0.0 0.0
0.4
Phytolaccaceae (n = 1)
Phytolacca octandra
0.0 0.0
0.0 9.2
0.0 0.0
2.1
Poaceae (n = 18)
A
grostis lachnartha 4.6
0.0 0.0
1.2 0.0
0.0 3.2
Andropogon eucom
us 3.9
0.0 0.0
0.0 2.6
0.0 1.8
Andropogon gayanus
2.1 0.0
0.0 0.0
6.0 6.3
2.1 A
ristida adscensionis 1.3
0.0 0.0
9.4 4.6
5.2 3.7
Aristida congesta
0.0 0.0
1.4 0.0
1.9 0.0
1.4 C
enchrus ciliaris 0.0
1.7 0.0
2.6 0.0
1.1 8.2
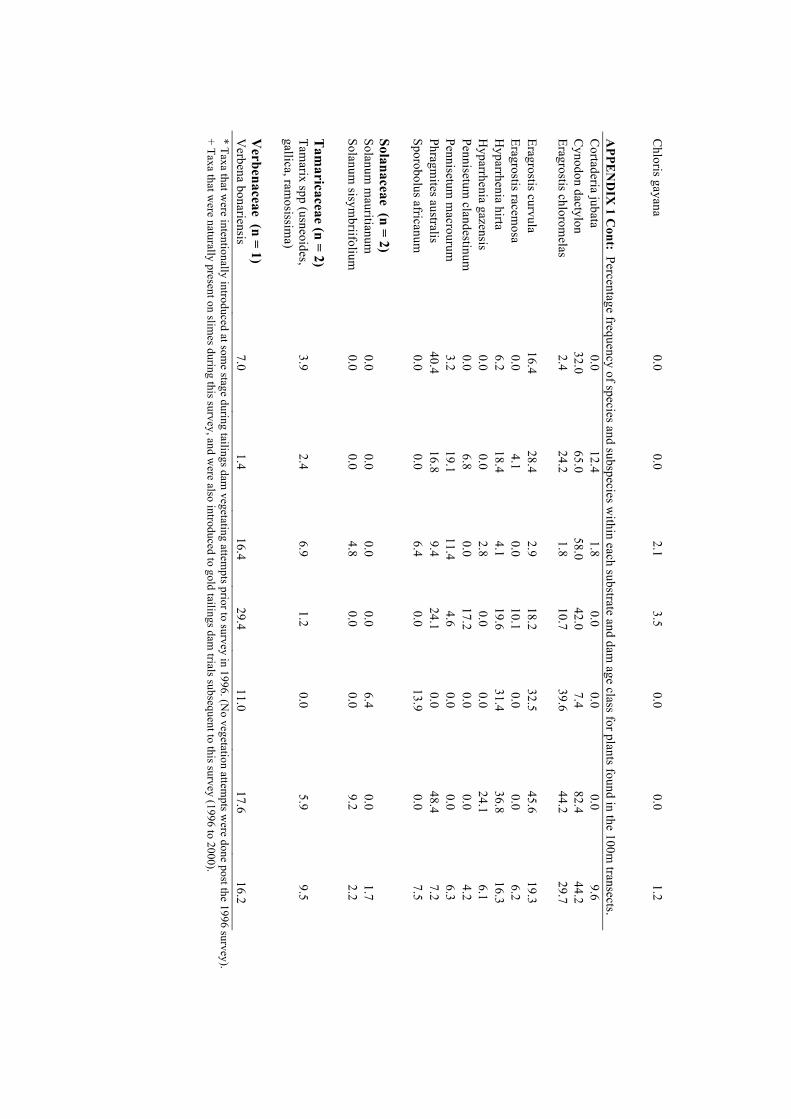
45
Chloris gayana
0.0 0.0
2.1 3.5
0.0 0.0
1.2
APPE
ND
IX 1 C
ont: Percentage frequency of species and subspecies within each substrate and dam
age class for plants found in the 100m transects.
Cortaderia jubata
0.0 12.4
1.8 0.0
0.0 0.0
9.6 C
ynodon dactylon 32.0
65.0 58.0
42.0 7.4
82.4 44.2
Eragrostis chloromelas
2.4 24.2
1.8 10.7
39.6 44.2
29.7 Eragrostis curvula
16.4 28.4
2.9 18.2
32.5 45.6
19.3 Eragrostis racem
osa 0.0
4.1 0.0
10.1 0.0
0.0 6.2
Hyparrhenia hirta
6.2 18.4
4.1 19.6
31.4 36.8
16.3 H
yparrhenia gazensis 0.0
0.0 2.8
0.0 0.0
24.1 6.1
Pennisetum clandestinum
0.0
6.8 0.0
17.2 0.0
0.0 4.2
Pennisetum m
acrourum
3.2 19.1
11.4 4.6
0.0 0.0
6.3 Phragm
ites australis 40.4
16.8 9.4
24.1 0.0
48.4 7.2
Sporobolus africanum
0.0 0.0
6.4 0.0
13.9 0.0
7.5
Solanaceae (n = 2)
Solanum
mauritianum
0.0
0.0 0.0
0.0 6.4
0.0 1.7
Solanum sisym
briifolium
0.0 0.0
4.8 0.0
0.0 9.2
2.2
T
amaricaceae (n = 2)
Tam
arix spp (usneoides, gallica, ram
osissima)
3.9 2.4
6.9 1.2
0.0 5.9
9.5
Verbenaceae (n = 1)
V
erbena bonariensis 7.0
1.4 16.4
29.4 11.0
17.6 16.2
* Taxa that were intentionally introduced at som
e stage during tailings dam vegetating attem
pts prior to survey in 1996. (No vegetation attem
pts were done post the 1996 survey).
+ Taxa that were naturally present on slim
es during this survey, and were also introduced to gold tailings dam
trials subsequent to this survey (1996 to 2000).
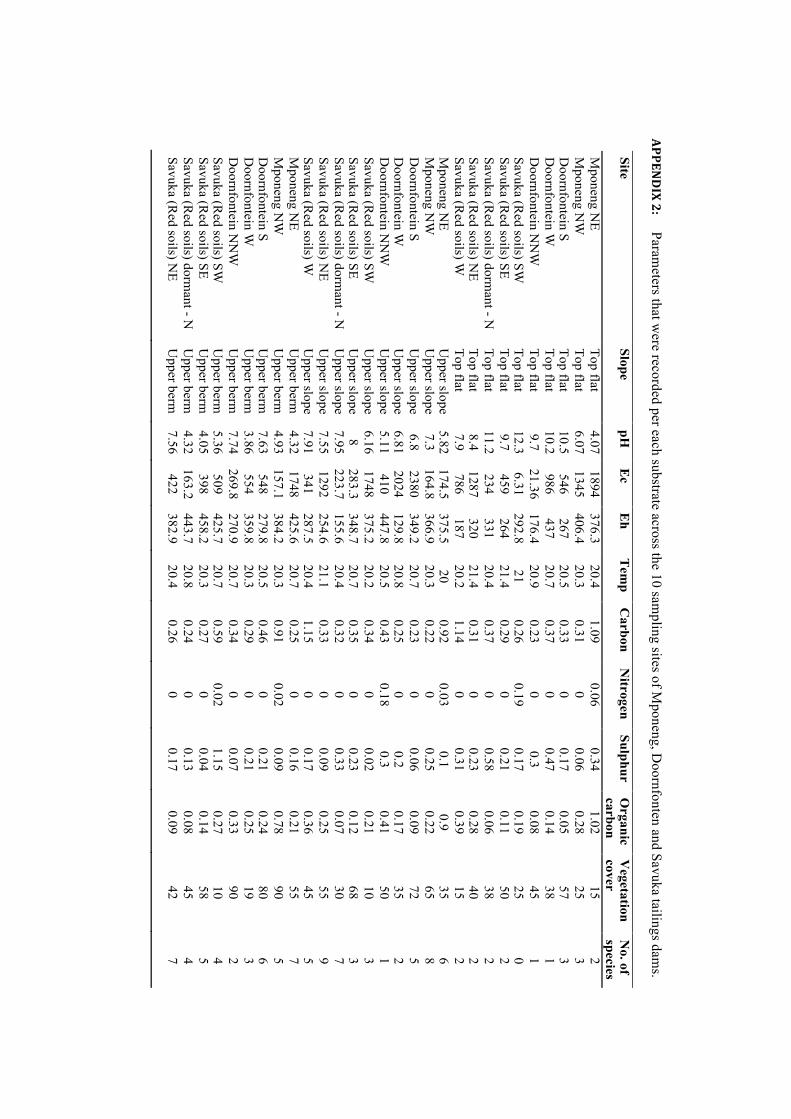
46
APPENDIX2:
Parameters that w
ere recorded per each substrate across the 10 sampling sites of M
poneng, Doornfonten and Savuka tailings dam
s.
Site
Slope pH
E
c E
h T
emp
Carbon
Nitrogen
Sulphur O
rganic carbon
Vegetation
cover N
o. of species
Mponeng N
E
Top flat
4.07 1894
376.3 20.4
1.09 0.06
0.34 1.02
15 2
Mponeng N
W
Top flat
6.07 1345
406.4 20.3
0.31 0
0.06 0.28
25 3
Doornfontein S
Top flat
10.5 546
267 20.5
0.33 0
0.17 0.05
57 3
Doornfontein W
T
op flat 10.2
986 437
20.7 0.37
0 0.47
0.14 38
1 D
oornfontein NN
W
Top flat
9.7 21.36
176.4 20.9
0.23 0
0.3 0.08
45 1
Savuka (Red soils) SW
T
op flat 12.3
6.31 292.8
21 0.26
0.19 0.17
0.19 25
0 Savuka (R
ed soils) SE
Top flat
9.7 459
264 21.4
0.29 0
0.21 0.11
50 2
Savuka (Red soils) dorm
ant - N
Top flat
11.2 234
331 20.4
0.37 0
0.58 0.06
38 2
Savuka (Red soils) N
E
Top flat
8.4 1287
320 21.4
0.31 0
0.23 0.28
40 2
Savuka (Red soils) W
T
op flat 7.9
786 187
20.2 1.14
0 0.31
0.39 15
2 M
poneng NE
U
pper slope 5.82
174.5 375.5
20 0.92
0.03 0.1
0.9 35
6 M
poneng NW
U
pper slope 7.3
164.8 366.9
20.3 0.22
0 0.25
0.22 65
8 D
oornfontein S U
pper slope 6.8
2380 349.2
20.7 0.23
0 0.06
0.09 72
5 D
oornfontein W
Upper slope
6.81 2024
129.8 20.8
0.25 0
0.2 0.17
35 2
Doornfontein N
NW
U
pper slope 5.11
410 447.8
20.5 0.43
0.18 0.3
0.41 50
1 Savuka (R
ed soils) SW
Upper slope
6.16 1748
375.2 20.2
0.34 0
0.02 0.21
10 3
Savuka (Red soils) SE
U
pper slope 8
283.3 348.7
20.7 0.35
0 0.23
0.12 68
3 Savuka (R
ed soils) dormant - N
U
pper slope 7.95
223.7 155.6
20.4 0.32
0 0.33
0.07 30
7 Savuka (R
ed soils) NE
U
pper slope 7.55
1292 254.6
21.1 0.33
0 0.09
0.25 55
9 Savuka (R
ed soils) W
Upper slope
7.91 341
287.5 20.4
1.15 0
0.17 0.36
45 5
Mponeng N
E
Upper berm
4.32
1748 425.6
20.7 0.25
0 0.16
0.21 55
7 M
poneng NW
U
pper berm
4.93 157.1
384.2 20.3
0.91 0.02
0.09 0.78
90 5
Doornfontein S
Upper berm
7.63
548 279.8
20.5 0.46
0 0.21
0.24 80
6 D
oornfontein W
Upper berm
3.86
554 359.8
20.3 0.29
0 0.21
0.25 19
3 D
oornfontein NN
W
Upper berm
7.74
269.8 270.9
20.7 0.34
0 0.07
0.33 90
2 Savuka (R
ed soils) SW
Upper berm
5.36
509 425.7
20.7 0.59
0.02 1.15
0.27 10
4 Savuka (R
ed soils) SE
Upper berm
4.05
398 458.2
20.3 0.27
0 0.04
0.14 58
5 Savuka (R
ed soils) dormant - N
U
pper berm
4.32 163.2
443.7 20.8
0.24 0
0.13 0.08
45 4
Savuka (Red soils) N
E
Upper berm
7.56
422 382.9
20.4 0.26
0 0.17
0.09 42
7
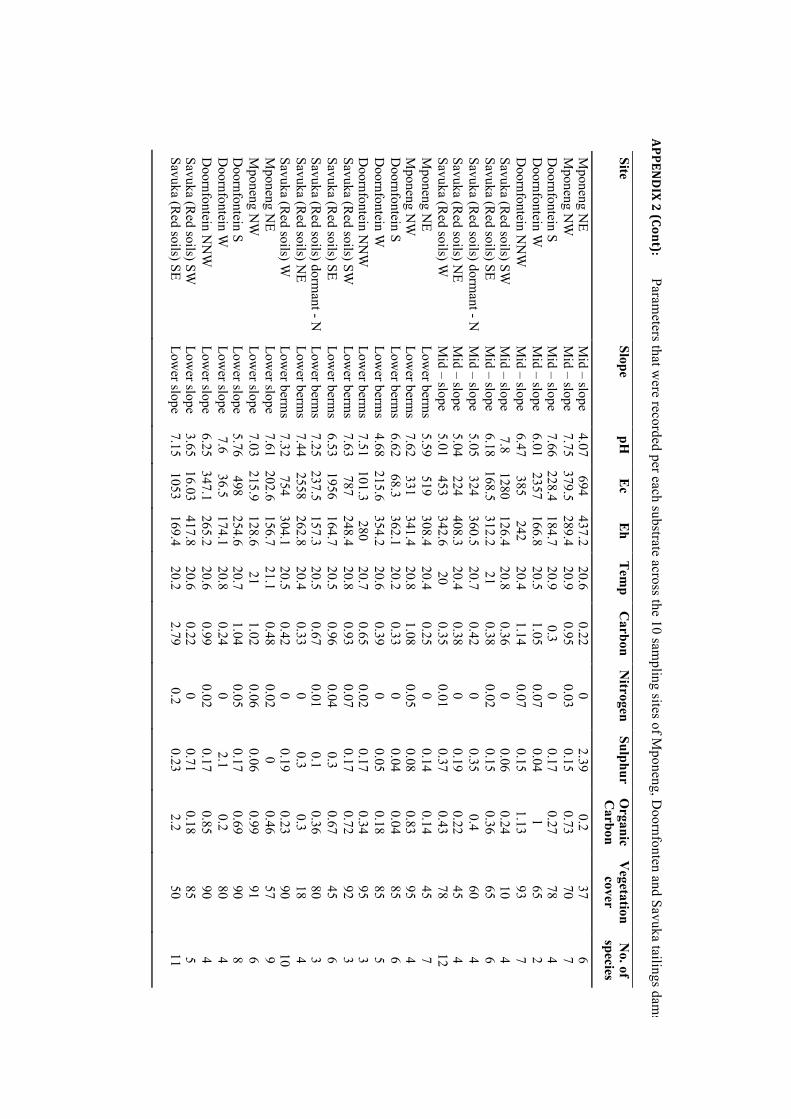
47
APPENDIX2(Cont):
Parameters that w
ere recorded per each substrate across the 10 sampling sites of M
poneng, Doornfonten and Savuka tailings dam
s.
Site Slope
pH
Ec
Eh
Tem
p C
arbon N
itrogen Sulphur
Organic
Carbon
Vegetation cover
No. of
species
Mponeng N
E M
id – slope 4.07
694 437.2
20.6 0.22
0 2.39
0.2 37
6 M
poneng NW
M
id – slope 7.75
379.5 289.4
20.9 0.95
0.03 0.15
0.73 70
7 D
oornfontein S M
id – slope 7.66
228.4 184.7
20.9 0.3
0 0.17
0.27 78
4 D
oornfontein W
Mid – slope
6.01 2357
166.8 20.5
1.05 0.07
0.04 1
65 2
Doornfontein N
NW
M
id – slope 6.47
385 242
20.4 1.14
0.07 0.15
1.13 93
7 Savuka (R
ed soils) SW
Mid – slope
7.8 1280
126.4 20.8
0.36 0
0.06 0.24
10 4
Savuka (Red soils) SE
Mid – slope
6.18 168.5
312.2 21
0.38 0.02
0.15 0.36
65 6
Savuka (Red soils) dorm
ant - N
Mid – slope
5.05 324
360.5 20.7
0.42 0
0.35 0.4
60 4
Savuka (Red soils) N
E M
id – slope 5.04
224 408.3
20.4 0.38
0 0.19
0.22 45
4 Savuka (R
ed soils) W
Mid – slope
5.01 453
342.6 20
0.35 0.01
0.37 0.43
78 12
Mponeng N
E Low
er berms
5.59 519
308.4 20.4
0.25 0
0.14 0.14
45 7
Mponeng N
W
Lower berm
s 7.62
331 341.4
20.8 1.08
0.05 0.08
0.83 95
4 D
oornfontein S Low
er berms
6.62 68.3
362.1 20.2
0.33 0
0.04 0.04
85 6
Doornfontein W
Low
er berms
4.68 215.6
354.2 20.6
0.39 0
0.05 0.18
85 5
Doornfontein N
NW
Low
er berms
7.51 101.3
280 20.7
0.65 0.02
0.17 0.34
95 3
Savuka (Red soils) SW
Low
er berms
7.63 787
248.4 20.8
0.93 0.07
0.17 0.72
92 3
Savuka (Red soils) SE
Lower berm
s 6.53
1956 164.7
20.5 0.96
0.04 0.3
0.67 45
6 Savuka (R
ed soils) dormant - N
Low
er berms
7.25 237.5
157.3 20.5
0.67 0.01
0.1 0.36
80 3
Savuka (Red soils) N
E Low
er berms
7.44 2558
262.8 20.4
0.33 0
0.3 0.3
18 4
Savuka (Red soils) W
Low
er berms
7.32 754
304.1 20.5
0.42 0
0.19 0.23
90 10
Mponeng N
E Low
er slope 7.61
202.6 156.7
21.1 0.48
0.02 0
0.46 57
9 M
poneng NW
Low
er slope 7.03
215.9 128.6
21 1.02
0.06 0.06
0.99 91
6 D
oornfontein S Low
er slope 5.76
498 254.6
20.7 1.04
0.05 0.17
0.69 90
8 D
oornfontein W
Lower slope
7.6 36.5
174.1 20.8
0.24 0
2.1 0.2
80 4
Doornfontein N
NW
Low
er slope 6.25
347.1 265.2
20.6 0.99
0.02 0.17
0.85 90
4 Savuka (R
ed soils) SW
Lower slope
3.65 16.03
417.8 20.6
0.22 0
0.71 0.18
85 5
Savuka (Red soils) SE
Lower slope
7.15 1053
169.4 20.2
2.79 0.2
0.23 2.2
50 11
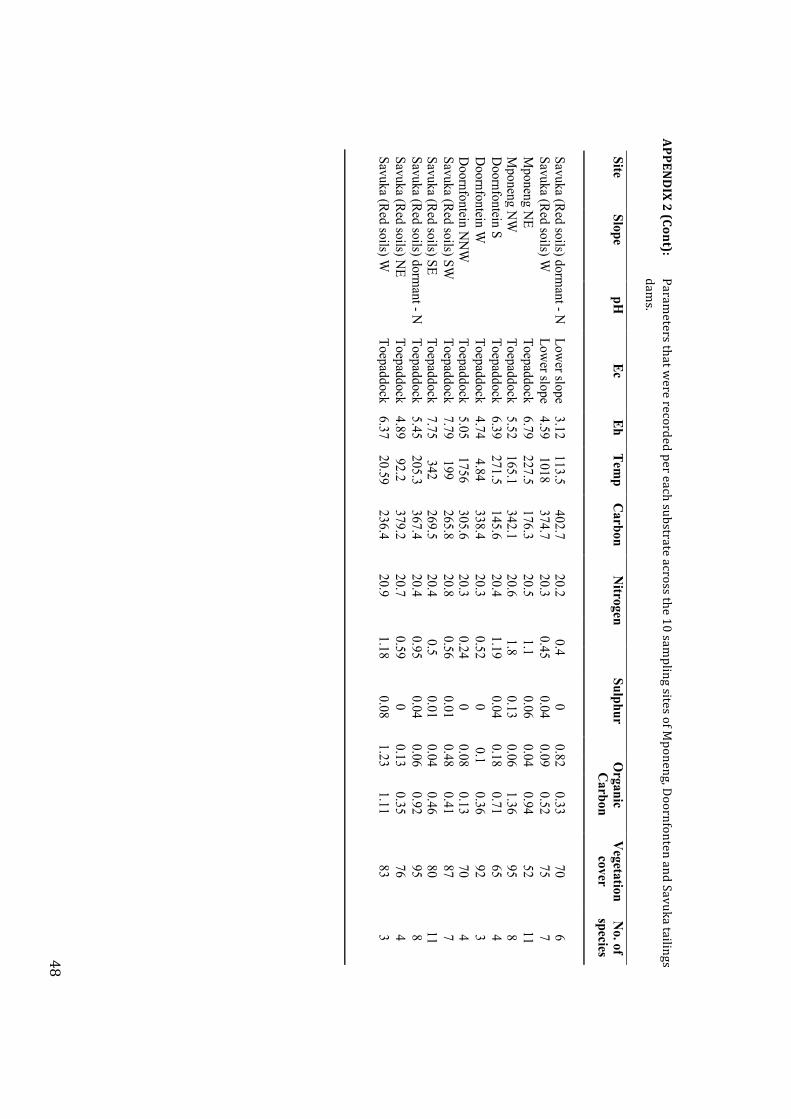
48
APPENDIX2(Cont):
Parametersthatwererecordedpereachsubstrateacrossthe10sam
plingsitesofMponeng,DoornfontenandSavukatailingsdam
s.
Site Slope
pH
Ec Eh
Temp
Carbon
Nitrogen
Sulphur O
rganic C
arbon V
egetation cover
No. of
species
Savuka (Red soils) dorm
ant - N
Low
er slope
3.12
113.5
402.7
20.2 0.4
0
0.82
0.33 70
6 Savuka (R
ed soils) W
Lower slope
4.59 1018
374.7 20.3
0.45 0.04
0.09 0.52
75 7
Mponeng N
E Toepaddock
6.79 227.5
176.3 20.5
1.1 0.06
0.04 0.94
52 11
Mponeng N
W
Toepaddock 5.52
165.1 342.1
20.6 1.8
0.13 0.06
1.36 95
8 D
oornfontein S Toepaddock
6.39 271.5
145.6 20.4
1.19 0.04
0.18 0.71
65 4
Doornfontein W
Toepaddock
4.74 4.84
338.4 20.3
0.52 0
0.1 0.36
92 3
Doornfontein N
NW
Toepaddock
5.05 1756
305.6 20.3
0.24 0
0.08 0.13
70 4
Savuka (Red soils) SW
Toepaddock
7.79 199
265.8 20.8
0.56 0.01
0.48 0.41
87 7
Savuka (Red soils) SE
Toepaddock 7.75
342 269.5
20.4 0.5
0.01 0.04
0.46 80
11 Savuka (R
ed soils) dormant - N
Toepaddock
5.45 205.3
367.4 20.4
0.95 0.04
0.06 0.92
95 8
Savuka (Red soils) N
E Toepaddock
4.89 92.2
379.2 20.7
0.59 0
0.13 0.35
76 4
Savuka (Red soils) W
Toepaddock
6.37 20.59
236.4 20.9
1.18 0.08
1.23 1.11
83 3
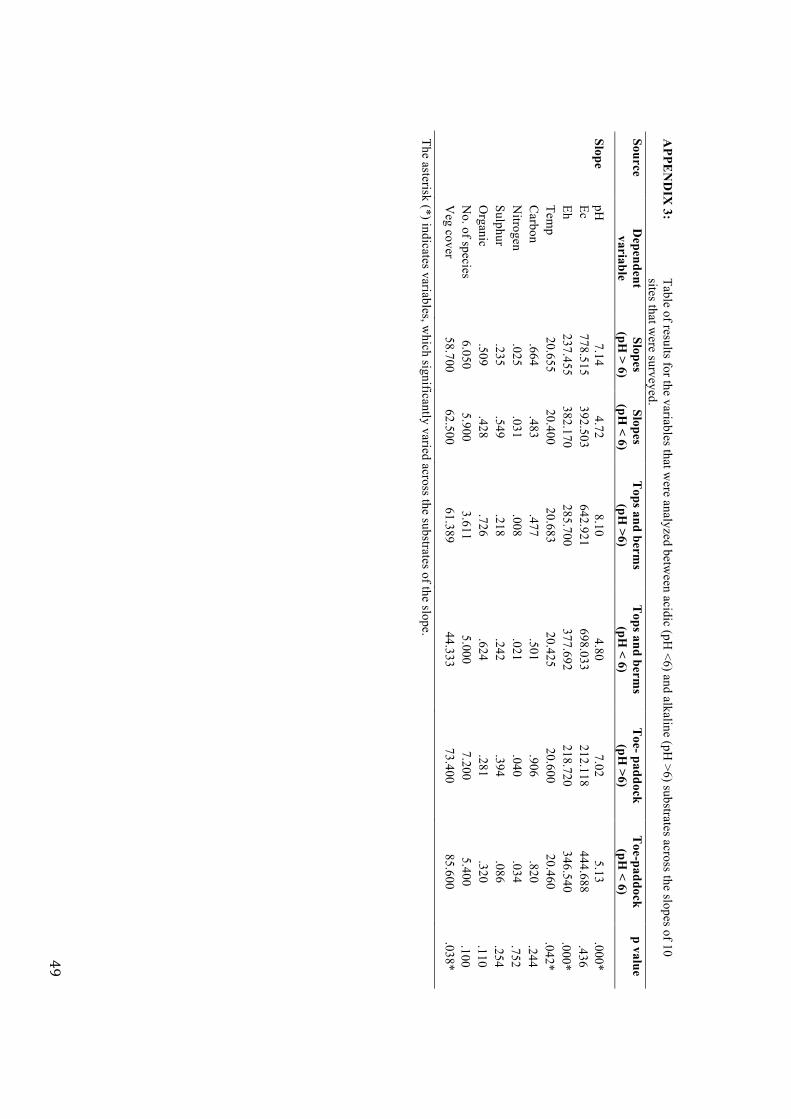
49
APPE
ND
IX 3:
Table of results for the variables that w
ere analyzed between acidic (pH
<6) and alkaline (pH >6) substrates across the slopes of 10
sites that were surveyed.
Source D
ependent variable
Slopes (pH
> 6) Slopes
(pH < 6)
Tops and berm
s (pH
>6) T
ops and berms
(pH < 6)
Toe- paddock
(pH >6)
Toe-paddock (pH
< 6) p value
Slope pH
7.14
4.72 8.10
4.80 7.02
5.13 .000*
Ec
778.515 392.503
642.921 698.033
212.118 444.688
.436
Eh 237.455
382.170 285.700
377.692 218.720
346.540 .000*
Tem
p 20.655
20.400 20.683
20.425 20.600
20.460 .042*
C
arbon .664
.483 .477
.501 .906
.820 .244
N
itrogen .025
.031 .008
.021 .040
.034 .752
Sulphur
.235 .549
.218 .242
.394 .086
.254
Organic
.509 .428
.726 .624
.281 .320
.110
No. of species
6.050 5.900
3.611 5.000
7.200 5.400
.100
Veg cover
58.700 62.500
61.389 44.333
73.400 85.600
.038*
The asterisk (*) indicates variables, which significantly varied across the substrates of the slope.
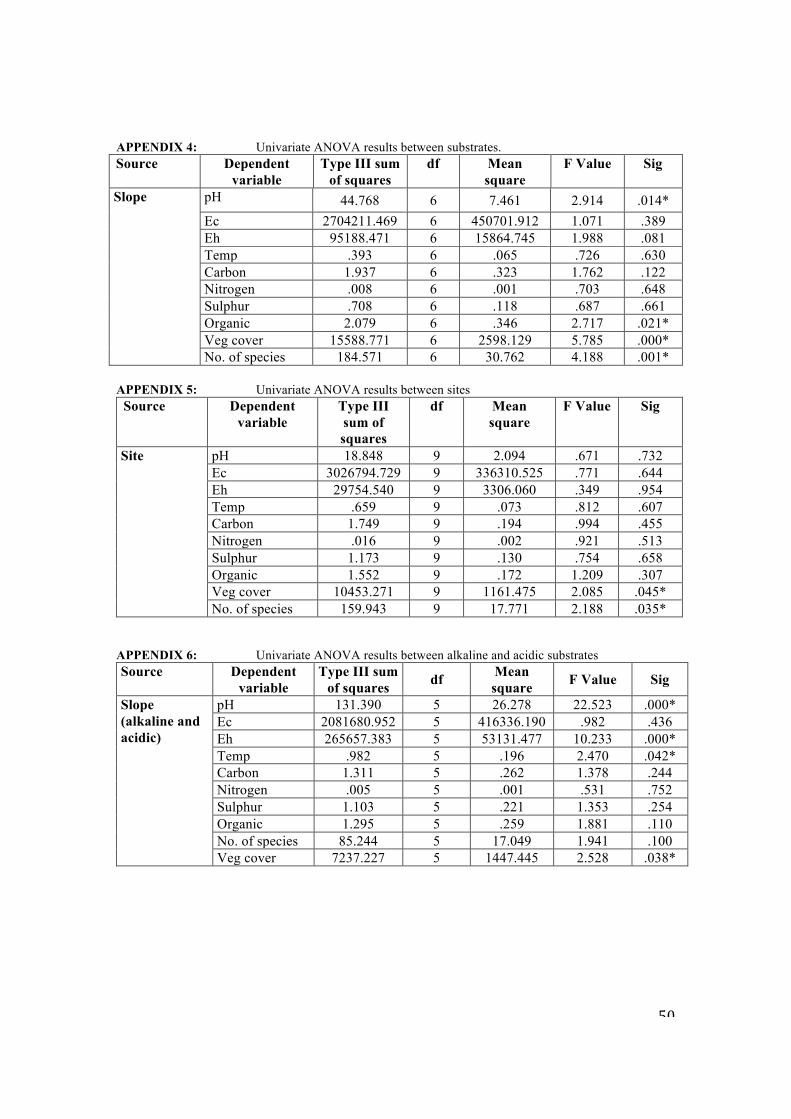
50
APPENDIX 4: Univariate ANOVA results between substrates. Source Dependent
variable Type III sum
of squares df Mean
square F Value Sig
Slope pH 44.768 6 7.461 2.914 .014* Ec 2704211.469 6 450701.912 1.071 .389 Eh 95188.471 6 15864.745 1.988 .081 Temp .393 6 .065 .726 .630 Carbon 1.937 6 .323 1.762 .122 Nitrogen .008 6 .001 .703 .648 Sulphur .708 6 .118 .687 .661 Organic 2.079 6 .346 2.717 .021* Veg cover 15588.771 6 2598.129 5.785 .000* No. of species 184.571 6 30.762 4.188 .001*
APPENDIX 5: Univariate ANOVA results between sites
Source Dependent variable
Type III sum of squares
df Mean square
F Value Sig
Site pH 18.848 9 2.094 .671 .732 Ec 3026794.729 9 336310.525 .771 .644 Eh 29754.540 9 3306.060 .349 .954 Temp .659 9 .073 .812 .607 Carbon 1.749 9 .194 .994 .455 Nitrogen .016 9 .002 .921 .513 Sulphur 1.173 9 .130 .754 .658 Organic 1.552 9 .172 1.209 .307 Veg cover 10453.271 9 1161.475 2.085 .045* No. of species 159.943 9 17.771 2.188 .035*
APPENDIX 6: Univariate ANOVA results between alkaline and acidic substrates Source Dependent
variable Type III sum
of squares df Mean square F Value Sig
Slope (alkaline and acidic)
pH 131.390 5 26.278 22.523 .000* Ec 2081680.952 5 416336.190 .982 .436 Eh 265657.383 5 53131.477 10.233 .000* Temp .982 5 .196 2.470 .042* Carbon 1.311 5 .262 1.378 .244 Nitrogen .005 5 .001 .531 .752 Sulphur 1.103 5 .221 1.353 .254 Organic 1.295 5 .259 1.881 .110 No. of species 85.244 5 17.049 1.941 .100 Veg cover 7237.227 5 1447.445 2.528 .038*
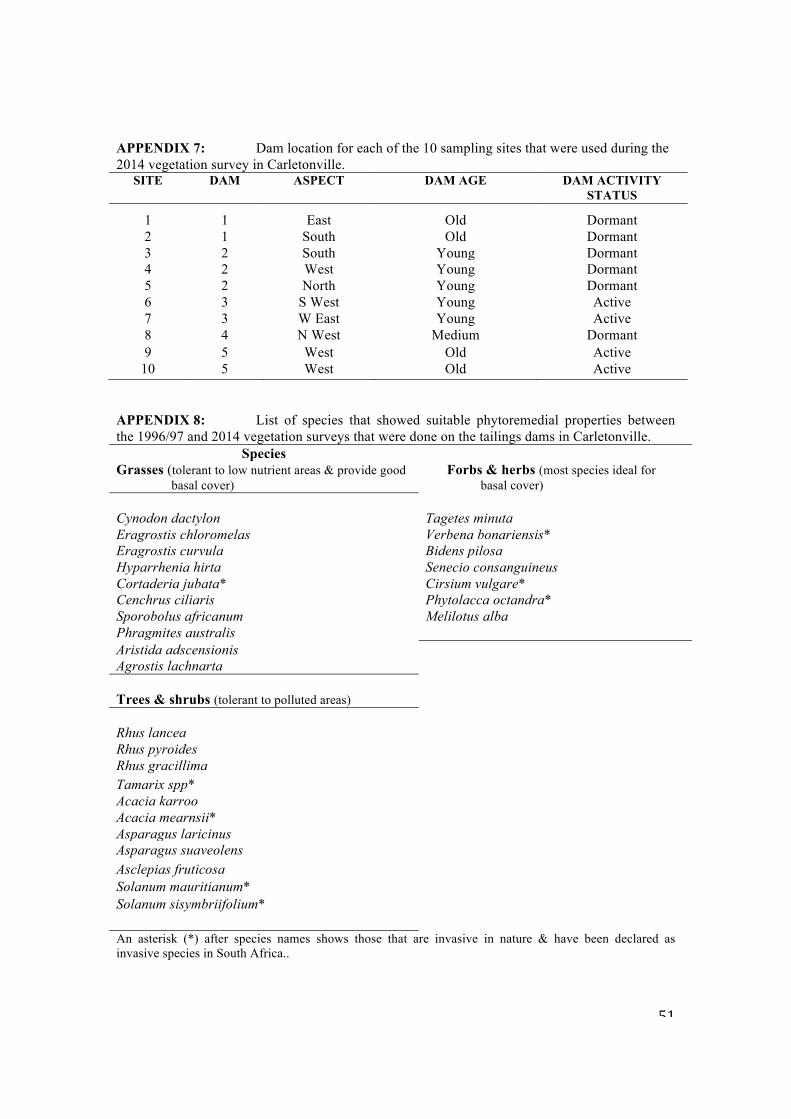
51
APPENDIX 7: Dam location for each of the 10 sampling sites that were used during the 2014 vegetation survey in Carletonville.
SITE DAM ASPECT DAM AGE DAM ACTIVITY STATUS
1 1 East Old Dormant 2 1 South Old Dormant 3 2 South Young Dormant 4 2 West Young Dormant 5 2 North Young Dormant 6 3 S West Young Active 7 3 W East Young Active 8 4 N West Medium Dormant 9 5 West Old Active
10 5 West Old Active
APPENDIX 8: List of species that showed suitable phytoremedial properties between the 1996/97 and 2014 vegetation surveys that were done on the tailings dams in Carletonville.
Species Grasses (tolerant to low nutrient areas & provide good
basal cover) Forbs & herbs (most species ideal for
basal cover) Cynodon dactylon
Tagetes minuta
Eragrostis chloromelas Verbena bonariensis* Eragrostis curvula Bidens pilosa Hyparrhenia hirta Senecio consanguineus Cortaderia jubata* Cirsium vulgare* Cenchrus ciliaris Phytolacca octandra* Sporobolus africanum Melilotus alba Phragmites australis Aristida adscensionis Agrostis lachnarta Trees & shrubs (tolerant to polluted areas) Rhus lancea Rhus pyroides Rhus gracillima Tamarix spp* Acacia karroo Acacia mearnsii* Asparagus laricinus Asparagus suaveolens Asclepias fruticosa Solanum mauritianum* Solanum sisymbriifolium* An asterisk (*) after species names shows those that are invasive in nature & have been declared as invasive species in South Africa..
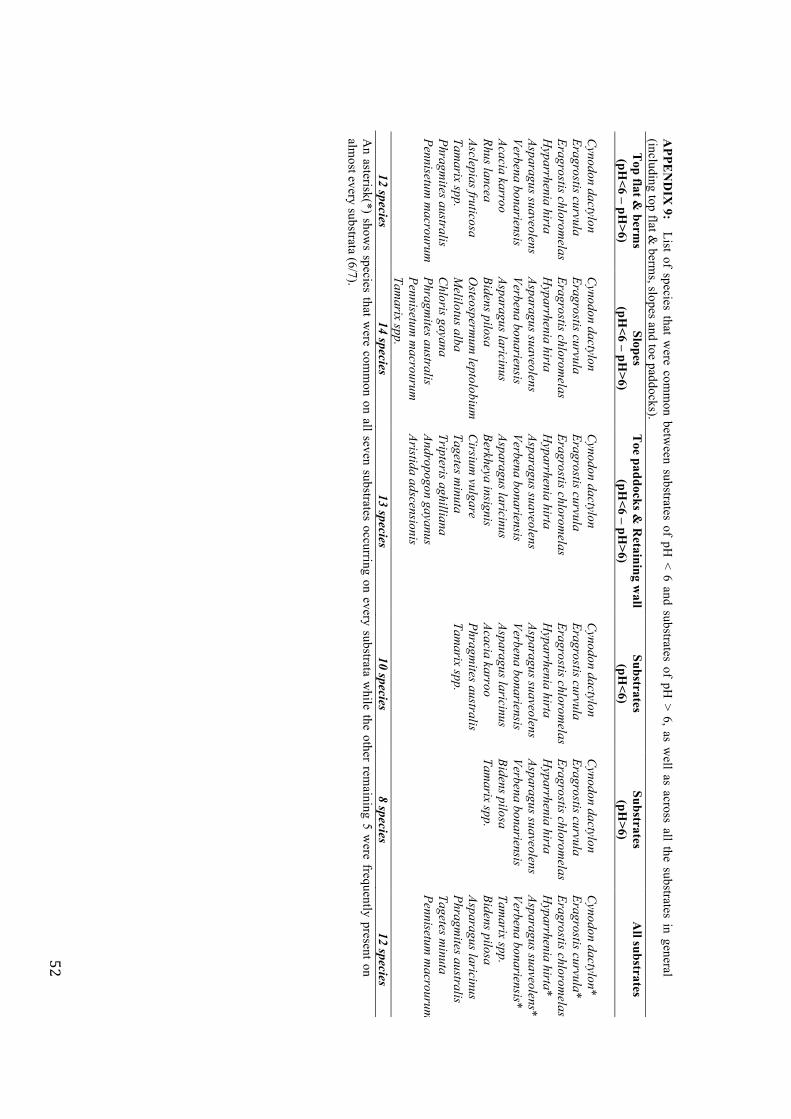
52
APPE
ND
IX 9:
List of species that were com
mon betw
een substrates of pH < 6 and substrates of pH
> 6, as well as across all the substrates in general
(including top flat & berm
s, slopes and toe paddocks). T
op flat & berm
s (pH
<6 – pH>6)
Slopes (pH
<6 – pH>6)
Toe paddocks &
Retaining w
all (pH
<6 – pH>6)
Substrates (pH
<6) Substrates
(pH>6)
All substrates
Cynodon dactylon
Cynodon dactylon
Cynodon dactylon
Cynodon dactylon
Cynodon dactylon
Cynodon dactylon*
Eragrostis curvula Eragrostis curvula
Eragrostis curvula Eragrostis curvula
Eragrostis curvula Eragrostis curvula*
Eragrostis chloromelas
Eragrostis chloromelas
Eragrostis chloromelas
Eragrostis chloromelas
Eragrostis chloromelas
Eragrostis chloromelas*
Hyparrhenia hirta
Hyparrhenia hirta
Hyparrhenia hirta
Hyparrhenia hirta
Hyparrhenia hirta
Hyparrhenia hirta*
Asparagus suaveolens Asparagus suaveolens
Asparagus suaveolens Asparagus suaveolens
Asparagus suaveolens Asparagus suaveolens*
Verbena bonariensis Verbena bonariensis
Verbena bonariensis Verbena bonariensis
Verbena bonariensis Verbena bonariensis*
Acacia karroo Asparagus laricinus
Asparagus laricinus Asparagus laricinus
Bidens pilosa Tam
arix spp. Rhus lancea
Bidens pilosa Berkheya insignis
Acacia karroo Tam
arix spp. Bidens pilosa
Asclepias fruticosa O
steospermum
leptolobium
Cirsium
vulgare Phragm
ites australis
Asparagus laricinus Tam
arix spp. M
elilotus alba Tagetes m
inuta Tam
arix spp.
Phragmites australis
Phragmites australis
Chloris gayana
Tripteris aghilliana
Tagetes m
inuta Pennisetum
macrourum
Phragm
ites australis Andropogon gayanus
Pennisetum m
acrourum
Pennisetum
macrourum
Aristida adscensionis
Tamarix spp.
12 species 14 species
13 species 10 species
8 species 12 species
An asterisk(*) show
s species that were com
mon on all seven substrates occurring on every substrata w
hile the other remaining 5 w
ere frequently present on alm
ost every substrata (6/7).