Embed Size (px)
Citation preview
Changes in Dynamics of SRE-RNA on Binding to theVTS1p-SAM Domain Studied by 13C NMR Relaxation
Florian C. Oberstrass,† Frederic H.-T. Allain,† and Sapna Ravindranathan*,‡
Institute of Molecular Biology and Biophysics, ETH Zurich, CH-8093 Zurich, Switzerland, andCentral NMR Facility, National Chemical Laboratory, Pune 411008, India
Received March 30, 2008; E-mail: [email protected]
Abstract: RNA recognition by proteins is often accompanied by significant changes in RNA dynamics inaddition to conformational changes. However, there are very few studies which characterize the changesin molecular motions in RNA on protein binding. We present a quantitative 13C NMR relaxation study ofthe changes in RNA dynamics in the pico-nanosecond time scale and micro-millisecond time scale resultingfrom interaction of the stem-loop SRE-RNA with the VTS1p-SAM domain. 13C relaxation rates of theprotonated carbons of the nucleotide base and anomeric carbons have been analyzed by employing themodel-free formalism, for a fully 13C/15N-labeled sample of the SRE-RNA in the free and protein-boundforms. In the free RNA, the nature of molecular motions are found to be distinctly different in the stem andthe loop region. On binding to the protein, the nature of motions becomes more homogeneous throughoutthe RNA, with many residues showing increased flexibility at the aromatic carbon sites, while the anomericcarbon sites become more rigid. Surprisingly, we also observe indications of a slow collective motion ofthe RNA in the binding pocket of the protein. The observation of increased motions on binding is interestingin the context of growing evidence that binding does not always lead to motional restrictions and the resultingentropy gain could favor the free energy of association.
Introduction
Structural studies of RNA-protein interactions have shownthat mutual accommodation by conformational adaptability ofone or both components is an important aspect which governshow the intermolecular recognition takes place.1-4 Sinceconformational adaptability implies structural movements indifferent parts of the protein and RNA, a detailed insight intothe molecular basis for RNA-protein recognition is onlypossible by complementing the three-dimensional structuralstudies of RNA-protein complexes by detailed studies ofmolecular dynamics.
We report here a detailed 13C NMR relaxation study of therole of RNA dynamics in the interaction of the Smaugrecognition element stem-loop RNA (SRE-RNA) and the sterilealpha motif domain of Saccharomyces cereVisiae Vts1p (VTS1p-SAM). The SRE-RNA is a stem-loop RNA consisting of 23nucleotides with a CUGGC pentaloop. The VTS1p-SAMdomain adopts a globular fold comprised of six helices that arepacked by a hydrophobic core. Recent solution state NMR andX-ray structural studies of the VTS1p-SAM domain, SRE-RNAand the protein-RNA complex indicate that the SAM domainrecognizes the shape of the loop in the SRE-RNA.5-7 In additionthe nucleotide G which caps the pentaloop is base specificallyrecognized by a hydrophobic cavity formed by the protein.
Most NMR relaxation studies of dynamics involvingRNA-protein recognition have focused on the changes whichoccur in protein dynamics on binding.8-11 The reason for thelarger body of work examining protein dynamics is that themethodology for analysis of NMR relaxation of 15N nuclei inproteins is well established.12 In RNA, on the other hand, the13C nuclei are better reporters of dynamics of the nucleotidebase and sugar moieties of the individual residues. Quantitativeanalysis of 13C relaxation data requires knowledge of 13Cchemical shift anisotropy (CSA) tensors. The orientation andmagnitude of 13C CSA tensors of the various carbons in RNAand DNA determined by solution state NMR methods have onlybecome available recently.13,14 The analysis of the relaxationof 13C nuclei in RNA also becomes complicated in fully isotope-labeled systems by the presence of nearest neighbor 13C-13Cdipolar interactions and detailed quantitative analysis of mo-
† ETH Zurich.‡ National Chemical Laboratory.
(1) Draper, D. E. J. Mol. Biol. 1999, 293, 255–270.(2) Chen, Y.; Varani, G. FEBS J. 2005, 272, 2087–2097.(3) Williamson, J. R. Nat. Struct. Biol. 2000, 7, 834–837.(4) Leulliot, N.; Varani, G. Biochemistry 2001, 40, 7947–7956.(5) Oberstrass, F. C.; Lee, A.; Stefl, R.; Janis, M.; Chanfreau, G.; Allain,
F. H-T. Nat. Struct. Biol. 2006, 13, 160–167.
(6) Johnson, P. E.; Donaldson, L. W. Nat. Struct. Biol. 2006, 13, 177–178.
(7) Aviv, T.; Lin, Z.; Ben-Ari, G.; Smibert, C. A.; Sicheri, F. Nat. Struct.Biol. 2006, 13, 168–176.
(8) Jonker, H. R. A.; Ilin, S.; Grimm, S. K.; Wohnert, J.; Schwalbe, H.Nucleic Acids. Res. 2007, 35, 441–454.
(9) Mittermaier, A.; Varani, L.; Muhandiram, D. R.; Kay, L. E.; Varani,G. J. Mol. Biol. 1999, 294, 967–979.
(10) Deka, P.; Paranji, P. K.; Perez-Canadillas, J. M.; Varani, G. J. Mol.Biol. 2005, 347, 719–733.
(11) Slijper, M.; Boelens, R.; Davis, A. L.; Konings, R. N. H.; Van DerMarel, G. A.; Van Boom, J. H.; Kaptein, R. Biochemistry 1997, 36,249–254.
(12) Palmer, A. G., III Chem. ReV. 2004, 104, 3623–3640.(13) Ying, J.; Grishaev, A.; Bryce, D. L.; Bax, A. J. Am. Chem. Soc. 2006,
128, 11443–11454.(14) Bryce, D. L.; Grishaev, A.; Bax, A. J. Am. Chem. Soc. 2005, 127,
7387–7396.
Published on Web 08/13/2008
10.1021/ja8023115 CCC: $40.75 2008 American Chemical Society J. AM. CHEM. SOC. 2008, 130, 12007–12020 9 12007
lecular motions in such systems are fairly recent.15-18 Detailedinvestigations of changes in RNA dynamics on binding to smallligands have been reported.18,19 To our knowledge, however,only one recent study has examined the changes in RNAdynamics accompanying a protein recognition event.20 Eventhough the dynamics of the free RNA has been analyzedquantitatively on the basis of motional models, the data analysisof the protein-bound RNA is based primarily on comparisonswith observations in the free RNA. This study however providesvaluable insights into the role of dynamics in the RNA-proteinrecognition event and is the only example where structural anddynamical aspects of the interaction have been examined forboth binding partners.
In the present work, we extend the previous structural studiesby characterizing the dynamics of SRE-RNA in its free formand when bound to the VTS1p-SAM domain (VTS1p-SRE-RNA). We report quantitative analysis of fast dynamicalprocesses in the picosecond (ps) to nanosecond (ns) time scaleand slow motions in the microsecond (µs) to millisecond (ms)time scale for SRE-RNA and VTS1p-SRE-RNA. Relaxationrate measurements at C2, C5, C6 and C8 sites of the nucleotidebase and C1′ site of the ribose moieties have been carried outto obtain residue-specific dynamics information. Quantitativeanalysis of the relaxation data has been carried out employingthe model-free formalism by including 13C-13C dipolar interac-tions and fully asymmetric CSA tensors recently reported for13C sites in nucleic acids.13,14 Our results show that in theabsence of the protein there is a clear distinction between thenature of motions in the loop and stem of SRE-RNA. Onbinding, this distinction is lost, but most residues, including afew which make important protein contacts, still retain theirflexibility in the bound state. We also see evidence for a verydynamic interaction interface between the protein and RNAwhich probably involves collective slow motions.
Theory
13C Relaxation. Relaxation of a 13C spin is dominated bydipolar interaction with the directly attached proton and the 13CCSA interaction with the static magnetic field. In RNA, thereare several 13C nuclei located in the nucleotide base and sugarmoieties which can be studied by NMR relaxation techniquesto probe molecular motion. Of these only C2 and C8 carbonsof the G and A nucleotides with their directly bonded protonscan be approximated as isolated two-spin systems in fullyisotope labeled RNA samples. For such isolated spin systemsthe expressions for longitudinal and transverse relaxation ratesand the heteronuclear NOE can be written in terms of spectraldensity functions involving C-H dipolar interaction and 13CCSA.21 The carbons C5, C6 and sugar carbons have neighboring13C nuclei; hence, additional terms involving 13C-13C dipolarinteractions enter the relaxation rate expressions. In a uniformlylabeled sample, C2 and C8 form 13C2,8-1H2,8 spin systems, C6
and C1′ form 1H6,1′-13C6,1′-13C5,2′-1H5,2′ spin systems and C5forms 1H5-13C5-(13C4)-13C6-1H6 spin system. The longitu-dinal relaxation rate is given by,15,18,22
R1C ) 1
10dCH
2 [(3J(ωC)+ J(ωH -ωC)+ 6J(ωH +ωC))]+
110
dCX2 [J(ωX -ωC)+ 3J(ωC)+ 6J(ωX +ωC)]+
215
∆σeff2 ωC
2 [3J(ωC)] (1)
The transverse relaxation rate is,15,18
R2C ) 1
20dCH
2 [4J(0)+ 3J(ωC)+
J(ωH -ωC)+ 6J(ωH)+ 6J(ωH +ωC)]+120
dCX2 [5J(ωX -ωC)+ 9J(ωC)+ 6J(ωX +ωC)]+
145
∆σeff2 ωC
2 [4J(0)+ 3J(ωC)]+Rex (2)
The dipolar interaction constant is given by dCi ) (µ0/8π2)(γCγih/r3
Ci), where i ) H,X and X represents nearestneighbor 13C nuclei. The CSA tensor is not axially symmetricfor the carbon nuclei in RNA and the effective anisotropy ∆σeff,contributing to the relaxation is defined as,
∆σeff ) √(σ11 - σ33)2 + (σ22 - σ33)
2 + 2(σ11 - σ33)(σ22 - σ33)
(3)
where σ11, σ22 and σ33 are the principal components of the CSAtensor, with σ11 denoting the least shielded component. Theexchange rate Rex in eq 2 accounts for the contribution totransverse relaxation from slow motions in the µs-ms time scaleand has a quadratic dependence on the static field strength.
These expressions do not include cross correlation spectraldensity terms between dipolar and CSA interactions since theexperimental schemes employed to measure the relaxation ratesadequately suppresses the contributions from 13C-1H dipolar/13C CSA cross-correlation effects by appropriate use of proton180° pulses in the relaxation period.22,23 Cross correlation termsinvolving 13C-13C dipolar interactions are 2-3 orders ofmagnitude smaller than the auto relaxation rates and maybesafely ignored.
For a typical spin system encountered in a fully labeled RNAsample, the expression for heteronuclear NOE also becomesmore complicated. The C5, C6 and C1′ carbons are located inspin systems of the form 1H-13C-X-H′ where X is aneighboring 13C with a directly attached proton H′, and theexpression for NOE is given by,22
NOE) 1+ RHC
R1C (γH
γC)- RCXRXH′
R1CR1
X (γH′
γX)
1- RCX2
R1CR1
X (4)
The terms RHC and RCX are cross relaxation rates given by,
RCi ) 110
dCi2 [6J(ωi +ωC)- J(ωi -ωC)] (5)
(15) Boisbouvier, J.; Wu, Z.; Ono, A.; Kainosho, M.; Bax, A. J. Biomol.NMR 2003, 27, 133–142.
(16) Duchardt, E.; Schwalbe, H. J. Biomol. NMR 2005, 32, 295–308.(17) Shajani, Z.; Varani, G. J. Mol. Biol. 2005, 349, 699–715.(18) Hansen, A. L.; Al-Hashimi, H. M. J. Am. Chem. Soc. 2007, 129,
16072–16082.(19) Dayie, K. T.; Brodsky, A. S.; Williamson, J. R. J. Mol. Biol. 2002,
317, 263–278.(20) Shajani, Z.; Drobny, G.; Varani, G. Biochemistry 2007, 46, 5875–
5883.(21) Boisbouvier, J.; Brutscher, B.; Simorre, J.-P.; Marion, D. J. Biomol.
NMR 1999, 14, 241–252.
(22) Yamazaki, T.; Muhandiram, R.; Kay, L. E. J. Am. Chem. Soc. 1994,116, 8266–8278.
(23) Kay, L. E.; Nicholson, L. K.; Delaglio, F.; Bax, A.; Torchia, D. A. J.Magn. Reson. 1992, 97, 359–375.
12008 J. AM. CHEM. SOC. 9 VOL. 130, NO. 36, 2008
A R T I C L E S Oberstrass et al.
where i ) H,X. If R1C ) R1
X and RHC ) RXH′, the aboveexpression for NOE simplifies to,
NOE) 1+ (γH
γC)[ RHC
R1 +RCX] (6)
Note that when RCX is very small, as is the case when overalltumbling correlation time is <5 ns or in the absence of aneighboring carbon, the NOE expression becomes identical tothe expression for an isolated 1H-13C two-spin system.
We now consider the relative significance of the 13C-13Cdipolar interaction in the relaxation rates of the various carbonnuclei in the free RNA and protein-bound RNA. The majorfactors which determine the extent to which 13C-13C dipolarinteraction contributes to relaxation are the correlation time foroverall motion and the C-C internuclear distance along withthe product of gyromagnetic ratios. Compared to rCH interatomicdistances of 1.08 Å (aromatic carbons) and 1.09 Å (anomericcarbon), the average rCC distances are 1.36, 1.43 and 1.53 Åfor C5-C6, C5-C4 and C1′-C2′ respectively.15,16 For the 23-nucleotide SRE-RNA, the correlation time for overall motionis about 5 ns, and the 13C-13C dipolar interaction contributionto the relaxation rates is negligible compared to 13C-1H dipolarinteraction and 13C CSA.15,17 For the VTS1p-SRE-RNA onthe other hand, the RNA is bound to the protein and has acorrelation time for overall motion that is nearly twice that ofthe free RNA. In this case, calculations show that there is asignificant contribution from 13C-13C dipolar interactions tothe R1 rate which cannot be neglected. This is largely becauseof the spectral density term J(ωX-ωC) in eq 1. This is essentiallya zero frequency term which increases with correlation timeand hence becomes significant for 13C nuclei in large RNAs orRNA which is part of a macromolecular complex. The effecton R2 rate is not as much because of the presence of a muchlarger zero frequency spectral density term involving the13C-1H dipolar interaction which is more dominant. In calcula-tions, we included 13C-13C dipolar interactions for all the ratesof VTS1p-SRE-RNA but not for SRE-RNA.
The 13C-13C dipolar interaction also leads to the morecomplicated expression for NOE given above. This is becauseduring proton irradiation in an NOE experiment, enhancementof intensity also occurs on the neighboring carbon which thentransfers to the target carbon through the C-C cross relaxationprocess, which becomes more efficient at higher correlationtimes. Hence, the actual intensity increase observed at the targetcarbon during proton irradiation will be more than what isexpected from transfer via its directly bonded proton alone andhas to be calculated by including all relaxation rates of theextended spin system involving the neighboring carbon and itsattached proton. For calculations of NOE in SRE-RNA theexpression for an isolated two-spin system was employed. Inthe case of VTS1p-SRE-RNA, we employed the simplifiedversion of the NOE expression in presence of 13C-13C dipolarinteractions given by eq 6. The assumption that RHC ) RXH′
and R1C ) R1
X was verified by calculations assuming onlyoverall motion. The difference in cross rates (RH1′C1′ - RH2’C2′
and RH5C5 - RH6C6) are in the range 0.001-0.01 s-1, whilethe difference in corresponding R1
C rates was at most 0.2 s-1.
Motional Models. In the case of nucleic acid molecules withlong base-paired stems, the overall motion is usually describedby an axially symmetric rotational diffusion tensor and the
spectral density functions JuV(ω) for a pair of interactions u andV in the relaxation rate equations are given by,24,25
J(ω)) ∑a)0,2
Ca
Da
Da2 +ω2
(7)
where Da ) 6D⊥ + a2(D| - D⊥ ). D| and D⊥ are the rotationaldiffusion constants for rotation about the long axis of themolecule and an axis perpendicular to it, respectively, and relateto the correlation time for overall motion as τc ) (4D⊥ +2D|)-1.The coefficients in the spectral density function are, C0 ) 0.25(3cos2 θu - 1)(3 cos2 θV - 1), C1 ) 3 cos θu cos θV sin θu sin θV
cos(φu - φV), C2 ) 0.75 sin2 θu sin2 θV cos(2φu - 2φV).
In the relaxation rate equations, the dipolar interactions onlyhave an auto correlated spectral density function for which u) V. The asymmetric CSA, however, is expressed in terms oftwo axially symmetric CSA tensors, and hence the spectraldensity function involving CSA interaction will also have a crossterm with u and V corresponding to (σ11 - σ33) and (σ22 - σ33)respectively. The polar angles (θu,φu) and (θV,φV) define theorientations of the spin interactions with respect to the rotationaldiffusion tensor.
In the analysis of relaxation data of nuclei in biomolecules,the contribution from internal motions is introduced accordingto the model-free formalism which assumes that overall andinternal motions occur independently of each other at widelydiffering time scales.26 This separation is straightforward whenthe overall motion is described by isotropic rotational diffusion,and the total spectral density function is a sum of two termsweighted by an order parameter S2 which is a measure ofmotional flexibility. Even though the separation is not straight-forward when the overall motion is anisotropic, it is convenientto express global and internal motions within the framework ofthe well-established model-free formalism by defining the orderparameter associated with each term in eq 7 in terms of a singleorder parameter S2 for a specific interaction as, Sa
2 ) CaS2.
The total spectral density function then becomes,27,28
JuV(ω)) S2 ∑a)0,2
Ca
Da
Da2 +ω2
+ (1- S2) ∑a)0,2
Ca
Dai
Dai2 +ω2
(8)
where S2 is the order parameter for the corresponding spininteraction, and the terms incorporating internal motion cor-relation times is given by Dai ) 6D⊥ + a2(D|| - D⊥ ) + τi
–1
where τi is the correlation time for internal motion. An additionalcomplication which arises in 13C interactions in RNA is thatthe 1H-13C dipolar interaction, 13C-13C dipolar interaction andcomponents of the asymmetric CSA do not coincide. Thisimplies that ideally a separate set of S2, τi parameters shouldbe defined for each interaction. The approximation used in eq8 which employs the same S2 and τi values for all interactionsof a given 13C spin can be justified when considering the relative
(24) Woessner, D. E. J. Chem. Phys. 1962, 3, 647–654.(25) Schwalbe, H.; Carlomagno, T.; Hennig, M.; Junker, J.; Reif, B.;
Richter, C.; Griesinger, C. Methods Enzymol. 2001, 338, 35–81.(26) Lipari, G.; Szabo, A. J. Am. Chem. Soc. 1982, 104, 4546–4558.(27) Barbato, G.; Ikura, M.; Kay, L. E.; Pastor, R. W.; Bax, A. Biochemistry
1992, 31, 5269–5278.(28) Akke, M.; Fiala, J. F.; Patel, D.; Palmer, A. G., III RNA 1997, 3,
702–709.
J. AM. CHEM. SOC. 9 VOL. 130, NO. 36, 2008 12009
Dynamics of SRE-RNA on Binding to the VTS1p-SAM Domain A R T I C L E S
contributions of the various interactions to the relaxation rates(discussed further below).
Materials and Methods
Protein, RNA and Complex Preparation. The SAM domainof S. cereVisiae Vts1p has been expressed and purified as previouslydescribed.5 Escherichia coli host cells BL21(DE3)+RIL (Strat-agene) were grown in M9 medium containing 15NH4Cl as nitrogensource for 15N labeling of the protein samples. After purificationthe proteins were dialyzed against NMR-Buffer (50 mM NaCl, 20mM NaH2PO4, pH 6.5) and concentrated. For this study, a 23nucleotide long RNA stem-loop (5′-GGAGAGGCUCUGGCAGC-UUUUCC-3′) with two different labeling schemes was used (eitherG and C or A and U being 13C 15N-labeled). RNA samples wereproduced by in Vitro T7 polymerase runoff transcription and purifiedby anion-exchange HPLC under denaturing conditions. The RNAoligonucleotides were annealed in NMR-Buffer (50 mM NaCl, 20mM NaH2PO4, pH 6.5) by heating to 95 °C and snap cooling onice to favor a stem-loop conformation. For complex formationproteins and RNAs were mixed with a 1:1 ratio. Concentrationswere determined by UV spectroscopy (εprot,280 ) 16500 M-1 cm-1;εRNA,260 ) 217300 M-1 cm-1). All samples used for NMRspectroscopy were approximately 1 mM.
NMR Spectroscopy. Longitudinal relaxation rates (R1), trans-verse relaxation rates in the rotating frame (R1F) and heteronuclearNOE measurements were carried out for C2, C5, C6, C8 and C1′carbons in two sets of SRE-RNA and VTS1p-SRE-RNA samples,with isotope labeling of G,U residues in the first set and A,Cresidues in the second.
Standard pulse sequences involving an INEPT transfer, a variablerelaxation period, 13C frequency labeling and final INEPT transferfor proton detection, were employed for relaxation rate measure-ments of the C2 and C8 carbons which do not have 13Cneighbors.23,29 R1 relaxation was sampled at time points 20, 40,80, 160, 240, 340, 480, 800, 1000 ms and R1F relaxation wassampled at 4, 8, 12, 16, 24, 32, 40 ms with repeat measurements attwo time points in both cases. In the case of VTS1p-SRE-RNAsample the R1F relaxation was sampled for shorter delays (4, 8, 12,16, 20, 24, 28 ms) because of faster relaxation in the RNA-proteincomplex. The NOEs were measured from spectra recorded withand without proton presaturation using a total relaxation delay of5 s, in which proton irradiation was applied for 3 s in the former.
For measurements on C5, C6 and C1′ carbons with 13Cneighbors, the standard pulse sequences were modified to includea selective 13C 180° IBURP-shaped pulse during the first INEPTtransfer to allow selective excitation of the desired carbon resonance.In addition the 13C frequency labeling was implemented with aconstant-time evolution period set to n/JCC ms where JCC is thescalar coupling between directly bonded carbons.15,17,22 In experi-ments on the SRE-RNA sample n ) 2 was used for C5 and C6carbons and n was set to 1 for C1′ carbon. In the VTS1p-SRE-RNA sample, n was set to 1 for all carbons to minimize relaxationlosses resulting from fast transverse relaxation in the complex. Thetime points for R1 measurements were set to 20, 40, 80, 120, 240,340, 480, 800, 1000 ms and the R1F measurements were carriedout for time points 4, 8, 12, 16, 20, 24, 28 ms with additional timepoints at 40 and 48 ms included for the slower relaxing C1′ carbons.For the VTS1p-SRE-RNA sample, the last time points wereomitted. Both SRE-RNA and VTS1p-SRE-RNA have modestmolecular masses of about 8 and 16 kDa so that spectra with fairlygood signal-to-noise ratios could be obtained on a low temperatureprobe; hence, TROSY enhanced sequences18 were not employedin the measurements.
In the R1F experiments a spin-lock field strength of 3 KHz wasemployed with the carrier positioned at the center of the 13Cresonance region of interest and taking care to avoid Hartmann-Hahntype magnetization transfers. Since the different pairs of scalar
coupled carbons resonate in distinct spectral regions, R1F can bemeasured for C6, C5 and C1′ without interference from unwantedmagnetization transfers. Nonzero offsets of individual resonancescauses the measured R1F values to have contributions from R1 inaddition to R1F. The true R1F values were extracted according toR1F (measured) ) R1 cos2 + R1F sin2, in which ) arctan(νSL/Ω) is the effective tilt angle of the spin-lock field, with νSL and Ωbeing the spin-lock field strength and resonance offset in Hzrespectively.30 R1F measurements were also carried out at 1, 2, 4.5and 6 KHz to examine spin-lock dependence of relaxation ratesresulting from slow motions.
The 13C-1H correlation experiments were carried out with 200× 1024 points for relaxation rate measurements on C2 and C8carbons. Experiments on C5 and C6 carbons of SRE-RNA werecarried out with 224 × 1024 points, whereas 176 × 1024 pointswere used for C1′ carbon. In the VTS1p-SRE-RNA sample thedata matrix was 80 × 1024 points for C5, C6 carbons and 170 ×1024 for C1′ carbon. Sufficient resolution of resonances wereobtained in all cases since each sample used had isotope labels ononly two nucleotide types, thereby reducing spectral overlap. The1H carrier was set on the residual water resonance, while the 13Ccarrier frequency was set to the center of the carbon resonanceregion of interest (C2,C8: 135.3 ppm, C6: 139.8 ppm, C5: 101.5and 93.5 ppm respectively for G,U and A,C labeled samples, C1′:89.5 ppm).
Experiments were carried out on a DRX Bruker 500 MHzspectrometer equipped with a 5 mm triple resonance cryogenicprobe and an Avance II Bruker 600 MHz spectrometer with 5 mmtriple resonance TXI probe. All measurements were carried out at303 K.
All numerical calculations were carried out using in-houseFortran software implementing the general computational strategyemployed for model-free analysis in proteins.31 The calculationsare based on the equations in the text and include 13C-1H dipolar,nearest neighbor 13C-13C dipolar and fully asymmetric CSAinteractions. The asymmetric CSA tensors were incorporated intothe calculation of relaxation rates by decomposing into a sum oftwo axially symmetric CSA contributions.32 The magnitudes andorientations reported recently for the CSA tensors of aromatic andanomeric carbons have been employed in numerical calculations.13,14
The CSA tensors have been determined for an A-form RNA helixwhich favors a C3′ endo sugar conformation; hence. these valuesare approximate when applied to anomeric carbons of the C10 andU11 residues of SRE-RNA which have ribose moieties in C2′ endoconformation. Density functional theory calculations predict aslightly higher CSA for anomeric carbons in a C2′ endo sugar.33
Since dipolar interactions largely dominate relaxation of C1′carbons, the use of CSA tensors of C3′ endo sugars in thecalculations is unlikely to affect the estimation of dynamicsparameters of C1′ carbons in C10 and U11 residues significantly.
Standard C-H and C-C bond lengths (see Theory section) havebeen employed in all calculations. In more recent work, the use ofmotionally averaged C-H distances (1.102 or 1.104 Å for aromaticsites and 1.118 or 1.115 Å for anomeric sites) in the analysis of13C relaxation data in RNA has been suggested.18,34 Incorporationof these longer bond distances results in an increase of estimatedorder parameters by 10% on average for aromatic sites and 16%for anomeric sites when compared to estimates employing standardbond lengths. For several residues, the use of motionally averagedC-H distances thus results in S2 parameters exceeding unity whichis contrary to its definition (0 e S2 e 1). A similar observation on
(29) Peng, J. W.; Wagner, G. J. Magn. Reson. 1992, 98, 308–332.
(30) Akke, M.; Palmer III, A. G. J. Am. Chem. Soc. 1996, 118, 911–912.(31) Mandel, A. M.; Akke, M.; Palmer, A. G., III J. Mol. Biol. 1995, 246,
144–163.(32) Goldman, M. J. Magn. Reson. 1984, 60, 437–452.(33) Dejaegere, A. P.; Case, D. P. J. Phys. Chem. A 1998, 102, 5280–
5289.(34) Ferner, J.; Villa, A.; Duchardt, E.; Widjajakusuma, E.; Wohnert, J.;
Stock, G.; Schwalbe, H. Nucleic Acids. Res 2008, 36, 1928–1940.
12010 J. AM. CHEM. SOC. 9 VOL. 130, NO. 36, 2008
A R T I C L E S Oberstrass et al.
using larger rCH distances has been reported and the discrepancyin the case of aromatic carbons has been explained on the basis ofanunderestimationofCSAmagnitudesemployedinthecalculations.16,34
However, in the case of C1′ carbons for which CSA contributionto relaxation is very small, the reason for S2 values exceeding unityis not clear.16 Here we retain standard C-H bond lengths in allcalculations for estimating parameters relating to molecular dynam-ics. Comparing results from calculations employing both sets ofbond distances show that the relative variations of estimatedparameters among the different residues and changes observedbetween SRE-RNA and VTS1p-SRE-RNA are unaffected. Hence,the conclusions regarding the nature of motions at different sitesin the RNA and changes resulting from binding to the protein arenot influenced by the use of standard C-H distances. The molecularstructure coordinates required for the calculations are available inthe protein data bank with accession codes 2ES5 (SRE-RNA) and2ESE (VTS1p-SRE-RNA).
Results and Discussion
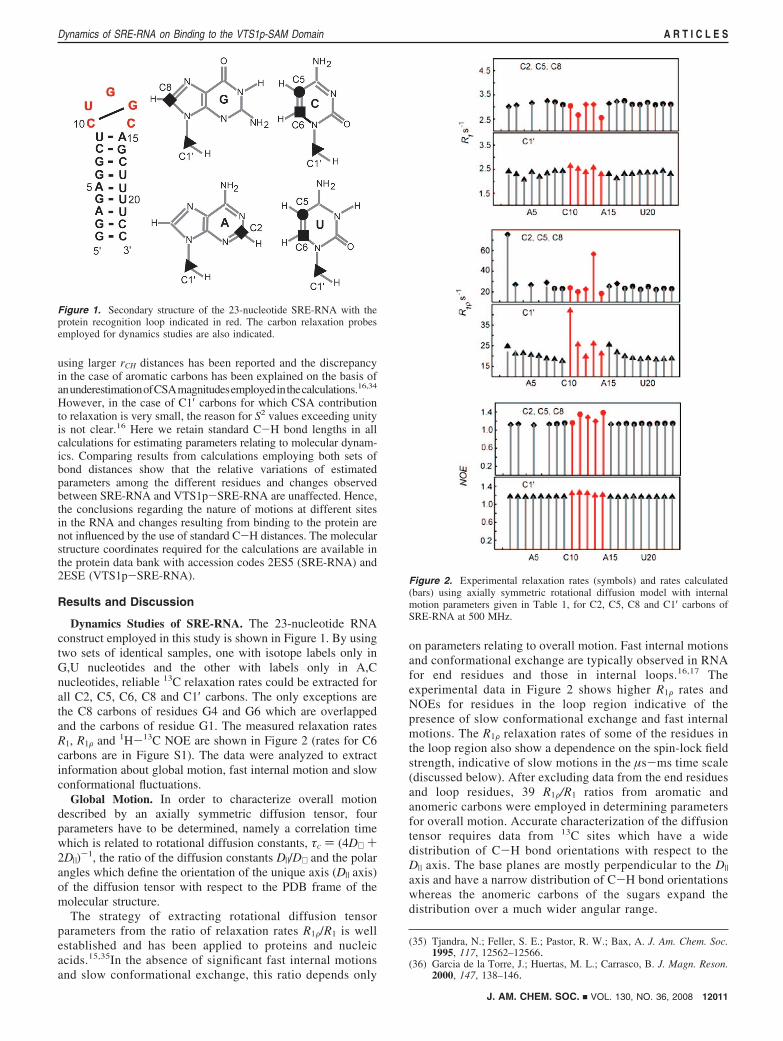
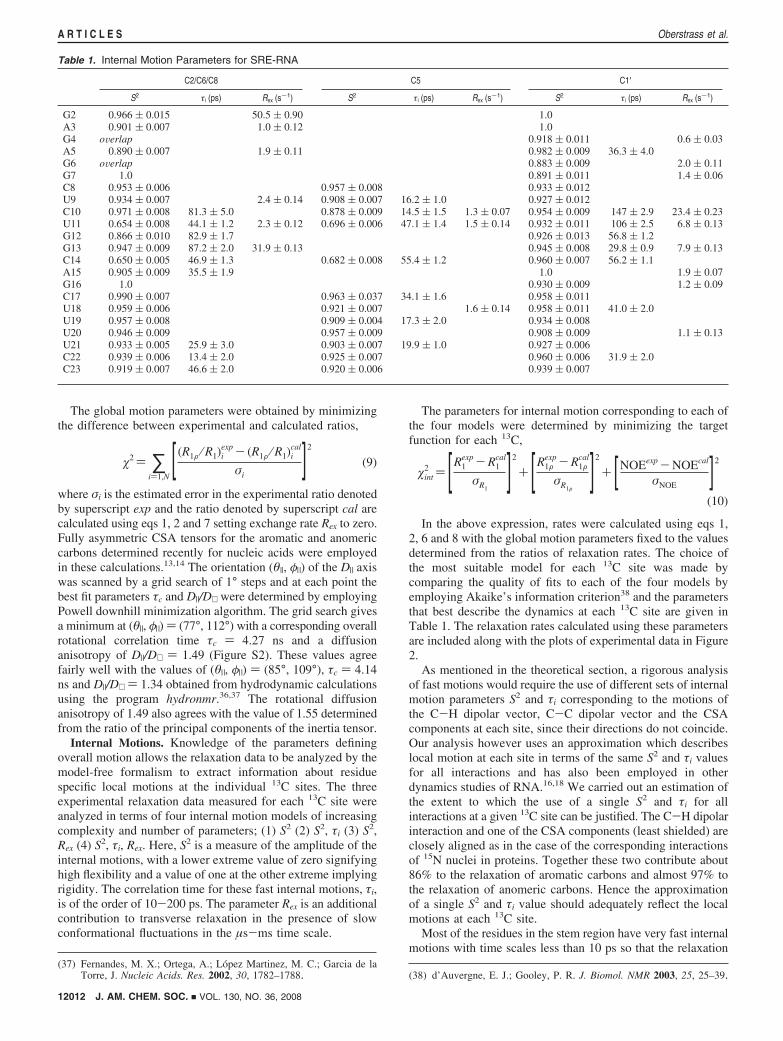
Dynamics Studies of SRE-RNA. The 23-nucleotide RNAconstruct employed in this study is shown in Figure 1. By usingtwo sets of identical samples, one with isotope labels only inG,U nucleotides and the other with labels only in A,Cnucleotides, reliable 13C relaxation rates could be extracted forall C2, C5, C6, C8 and C1′ carbons. The only exceptions arethe C8 carbons of residues G4 and G6 which are overlappedand the carbons of residue G1. The measured relaxation ratesR1, R1F and 1H-13C NOE are shown in Figure 2 (rates for C6carbons are in Figure S1). The data were analyzed to extractinformation about global motion, fast internal motion and slowconformational fluctuations.
Global Motion. In order to characterize overall motiondescribed by an axially symmetric diffusion tensor, fourparameters have to be determined, namely a correlation timewhich is related to rotational diffusion constants, τc ) (4D⊥ +2D|)-1, the ratio of the diffusion constants D|/D⊥ and the polarangles which define the orientation of the unique axis (D| axis)of the diffusion tensor with respect to the PDB frame of themolecular structure.
The strategy of extracting rotational diffusion tensorparameters from the ratio of relaxation rates R1F/R1 is wellestablished and has been applied to proteins and nucleicacids.15,35In the absence of significant fast internal motionsand slow conformational exchange, this ratio depends only
on parameters relating to overall motion. Fast internal motionsand conformational exchange are typically observed in RNAfor end residues and those in internal loops.16,17 Theexperimental data in Figure 2 shows higher R1F rates andNOEs for residues in the loop region indicative of thepresence of slow conformational exchange and fast internalmotions. The R1F relaxation rates of some of the residues inthe loop region also show a dependence on the spin-lock fieldstrength, indicative of slow motions in the µs-ms time scale(discussed below). After excluding data from the end residuesand loop residues, 39 R1F/R1 ratios from aromatic andanomeric carbons were employed in determining parametersfor overall motion. Accurate characterization of the diffusiontensor requires data from 13C sites which have a widedistribution of C-H bond orientations with respect to theD| axis. The base planes are mostly perpendicular to the D|axis and have a narrow distribution of C-H bond orientationswhereas the anomeric carbons of the sugars expand thedistribution over a much wider angular range.
(35) Tjandra, N.; Feller, S. E.; Pastor, R. W.; Bax, A. J. Am. Chem. Soc.1995, 117, 12562–12566.
(36) Garcia de la Torre, J.; Huertas, M. L.; Carrasco, B. J. Magn. Reson.2000, 147, 138–146.
Figure 1. Secondary structure of the 23-nucleotide SRE-RNA with theprotein recognition loop indicated in red. The carbon relaxation probesemployed for dynamics studies are also indicated.
Figure 2. Experimental relaxation rates (symbols) and rates calculated(bars) using axially symmetric rotational diffusion model with internalmotion parameters given in Table 1, for C2, C5, C8 and C1′ carbons ofSRE-RNA at 500 MHz.
J. AM. CHEM. SOC. 9 VOL. 130, NO. 36, 2008 12011
Dynamics of SRE-RNA on Binding to the VTS1p-SAM Domain A R T I C L E S
The global motion parameters were obtained by minimizingthe difference between experimental and calculated ratios,
2 ) ∑i)1,N
[ (R1F ⁄ R1)iexp - (R1F ⁄ R1)i
cal
σi]2
(9)
where σi is the estimated error in the experimental ratio denotedby superscript exp and the ratio denoted by superscript cal arecalculated using eqs 1, 2 and 7 setting exchange rate Rex to zero.Fully asymmetric CSA tensors for the aromatic and anomericcarbons determined recently for nucleic acids were employedin these calculations.13,14 The orientation (θ||, φ|) of the D| axiswas scanned by a grid search of 1° steps and at each point thebest fit parameters τc and D|/D⊥ were determined by employingPowell downhill minimization algorithm. The grid search givesa minimum at (θ|, φ|) ) (77°, 112°) with a corresponding overallrotational correlation time τc ) 4.27 ns and a diffusionanisotropy of D|/D⊥ ) 1.49 (Figure S2). These values agreefairly well with the values of (θ|, φ|) ) (85°, 109°), τc ) 4.14ns and D|/D⊥ ) 1.34 obtained from hydrodynamic calculationsusing the program hydronmr.36,37 The rotational diffusionanisotropy of 1.49 also agrees with the value of 1.55 determinedfrom the ratio of the principal components of the inertia tensor.
Internal Motions. Knowledge of the parameters definingoverall motion allows the relaxation data to be analyzed by themodel-free formalism to extract information about residuespecific local motions at the individual 13C sites. The threeexperimental relaxation data measured for each 13C site wereanalyzed in terms of four internal motion models of increasingcomplexity and number of parameters; (1) S2 (2) S2, τi (3) S2,Rex (4) S2, τi, Rex. Here, S2 is a measure of the amplitude of theinternal motions, with a lower extreme value of zero signifyinghigh flexibility and a value of one at the other extreme implyingrigidity. The correlation time for these fast internal motions, τi,is of the order of 10-200 ps. The parameter Rex is an additionalcontribution to transverse relaxation in the presence of slowconformational fluctuations in the µs-ms time scale.
The parameters for internal motion corresponding to each ofthe four models were determined by minimizing the targetfunction for each 13C,
int2 ) [R1
exp -R1cal
σR1]2
+ [R1Fexp -R1F
cal
σR1F]2
+ [NOEexp -NOEcal
σNOE]2
(10)
In the above expression, rates were calculated using eqs 1,2, 6 and 8 with the global motion parameters fixed to the valuesdetermined from the ratios of relaxation rates. The choice ofthe most suitable model for each 13C site was made bycomparing the quality of fits to each of the four models byemploying Akaike’s information criterion38 and the parametersthat best describe the dynamics at each 13C site are given inTable 1. The relaxation rates calculated using these parametersare included along with the plots of experimental data in Figure2.
As mentioned in the theoretical section, a rigorous analysisof fast motions would require the use of different sets of internalmotion parameters S2 and τi corresponding to the motions ofthe C-H dipolar vector, C-C dipolar vector and the CSAcomponents at each site, since their directions do not coincide.Our analysis however uses an approximation which describeslocal motion at each site in terms of the same S2 and τi valuesfor all interactions and has also been employed in otherdynamics studies of RNA.16,18 We carried out an estimation ofthe extent to which the use of a single S2 and τi for allinteractions at a given 13C site can be justified. The C-H dipolarinteraction and one of the CSA components (least shielded) areclosely aligned as in the case of the corresponding interactionsof 15N nuclei in proteins. Together these two contribute about86% to the relaxation of aromatic carbons and almost 97% tothe relaxation of anomeric carbons. Hence the approximationof a single S2 and τi value should adequately reflect the localmotions at each 13C site.
Most of the residues in the stem region have very fast internalmotions with time scales less than 10 ps so that the relaxation
(37) Fernandes, M. X.; Ortega, A.; Lopez Martinez, M. C.; Garcia de laTorre, J. Nucleic Acids. Res. 2002, 30, 1782–1788. (38) d’Auvergne, E. J.; Gooley, P. R. J. Biomol. NMR 2003, 25, 25–39.
Table 1. Internal Motion Parameters for SRE-RNA
C2/C6/C8 C5 C1′
S2 τi (ps) Rex (s-1) S2 τi (ps) Rex (s-1) S2 τi (ps) Rex (s-1)
G2 0.966 ( 0.015 50.5 ( 0.90 1.0A3 0.901 ( 0.007 1.0 ( 0.12 1.0G4 oVerlap 0.918 ( 0.011 0.6 ( 0.03A5 0.890 ( 0.007 1.9 ( 0.11 0.982 ( 0.009 36.3 ( 4.0G6 oVerlap 0.883 ( 0.009 2.0 ( 0.11G7 1.0 0.891 ( 0.011 1.4 ( 0.06C8 0.953 ( 0.006 0.957 ( 0.008 0.933 ( 0.012U9 0.934 ( 0.007 2.4 ( 0.14 0.908 ( 0.007 16.2 ( 1.0 0.927 ( 0.012C10 0.971 ( 0.008 81.3 ( 5.0 0.878 ( 0.009 14.5 ( 1.5 1.3 ( 0.07 0.954 ( 0.009 147 ( 2.9 23.4 ( 0.23U11 0.654 ( 0.008 44.1 ( 1.2 2.3 ( 0.12 0.696 ( 0.006 47.1 ( 1.4 1.5 ( 0.14 0.932 ( 0.011 106 ( 2.5 6.8 ( 0.13G12 0.866 ( 0.010 82.9 ( 1.7 0.926 ( 0.013 56.8 ( 1.2G13 0.947 ( 0.009 87.2 ( 2.0 31.9 ( 0.13 0.945 ( 0.008 29.8 ( 0.9 7.9 ( 0.13C14 0.650 ( 0.005 46.9 ( 1.3 0.682 ( 0.008 55.4 ( 1.2 0.960 ( 0.007 56.2 ( 1.1A15 0.905 ( 0.009 35.5 ( 1.9 1.0 1.9 ( 0.07G16 1.0 0.930 ( 0.009 1.2 ( 0.09C17 0.990 ( 0.007 0.963 ( 0.037 34.1 ( 1.6 0.958 ( 0.011U18 0.959 ( 0.006 0.921 ( 0.007 1.6 ( 0.14 0.958 ( 0.011 41.0 ( 2.0U19 0.957 ( 0.008 0.909 ( 0.004 17.3 ( 2.0 0.934 ( 0.008U20 0.946 ( 0.009 0.957 ( 0.009 0.908 ( 0.009 1.1 ( 0.13U21 0.933 ( 0.005 25.9 ( 3.0 0.903 ( 0.007 19.9 ( 1.0 0.927 ( 0.006C22 0.939 ( 0.006 13.4 ( 2.0 0.925 ( 0.007 0.960 ( 0.006 31.9 ( 2.0C23 0.919 ( 0.007 46.6 ( 2.0 0.920 ( 0.006 0.939 ( 0.007
12012 J. AM. CHEM. SOC. 9 VOL. 130, NO. 36, 2008
A R T I C L E S Oberstrass et al.
data can be accounted for in terms of the order parameter S2.The 13C sites of the loop and flanking residues on the otherhand, have fast internal motions with correlation times rangingfrom about 30-100 ps and the fits to relaxation data are obtainedwith more complex models of internal motion (models 2 and4). This suggests that the nature of fast internal motions isdistinctly different in the stem and loop regions.
For the 13C sites in the nucleotide base, the amplitude of fastmotions as defined by the S2 values, show variations betweenstem and loop region. With the exception of C10 and G13residues, S2 values are significantly lower in the loop regioncompared to the stem. It is interesting that the C10 and G13residues are hydrogen bonded across the loop and have S2 valuessimilar to those for the base-paired residues in the stem. ResiduesU11 and C14 have much lower S2 values indicating a high levelof local flexibility whereas the G12 residue which stacks overthe C10-G13 base pair, has an S2 value which is intermediatebetween the more rigid C10-G13 pair and the highly flexibleU11, C14 residues.
The observed relative flexibility of the different residues isconsistent with the solution structure of the SRE-RNA.5 Base-pairing between the C10 and G13 residues in the loop wassuggested in the SRE-RNA structure and is supported by thesimilarity of the S2 parameters of C10 and G13 to those of thebase-paired residues in the stem. The higher S2 values observedfor the aromatic sites of C10, G12 and G13 along with theanomeric sites of the loop residues, supports the idea that theloop adopts a well-defined structure that aids shape specificrecognition by the VTS1p-SAM domain. The nucleotide baseplanes of the U11 and C14 residues are seen to project outwardfrom the sugar-phosphate backbone in the structure. The muchlower S2 values observed for the aromatic carbons of theseresidues indicate a high degree of motional freedom. Thenucleotide base in U11 and C14 are like side groups attachedto the sugar-phosphate backbone, and high amplitude motionsabout the glycosidic linkage is feasible. In contrast to the 13Csites in the nucleotide base, the anomeric sites do not showsignificant differences in S2 values between the loop and stemregion.
Slow Conformational Fluctuations. The presence of slowmotions in the µs-ms time scale leads to an increase in thetransverse relaxation rate by a factor Rex. Resonances that exhibitslow motions in this time scale will show a decrease in R1Frelaxation rates as the power of the spin-lock field is increased.The dependence of the transverse relaxation rates of 13C nucleiexchanging between two sites (R1F
ex), on the spin-lock fieldstrength is given by,30,39
R1Fex )R1 cos2 +R2 sin2 + p1p2∆ω2 sin2
τex
1+ωe2τex
2
(11)
where is the tilt angle of the spin-lock field as defined in themethods section and the effective field, ωe ) (∆ωo
2 + ωSL2)0.5,
is expressed in terms of the spin-lock carrier offset with respectto the exchange averaged resonance position (∆ωo) and the fieldstrength, ωSL in radians/s. The parameter τex is the exchangetime constant characterizing exchange between two sites withfractional populations p1 and p2. The chemical shift differencebetween the two sites is given by ∆ω.
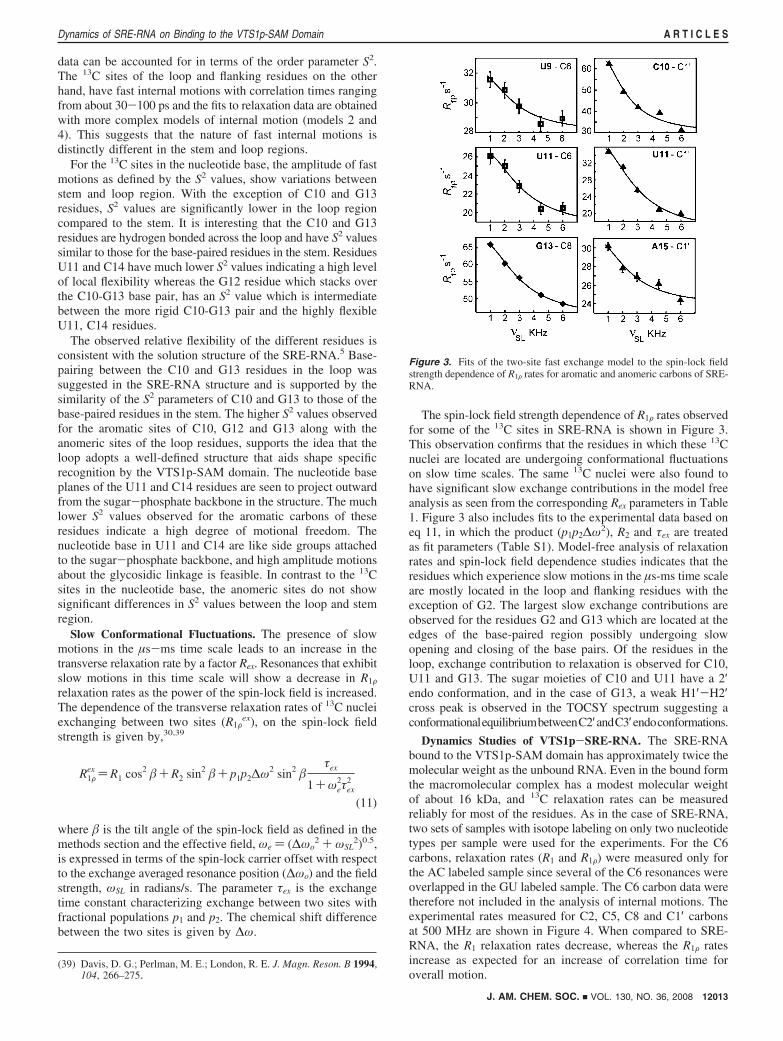
The spin-lock field strength dependence of R1F rates observedfor some of the 13C sites in SRE-RNA is shown in Figure 3.This observation confirms that the residues in which these 13Cnuclei are located are undergoing conformational fluctuationson slow time scales. The same 13C nuclei were also found tohave significant slow exchange contributions in the model freeanalysis as seen from the corresponding Rex parameters in Table1. Figure 3 also includes fits to the experimental data based oneq 11, in which the product (p1p2∆ω2), R2 and τex are treatedas fit parameters (Table S1). Model-free analysis of relaxationrates and spin-lock field dependence studies indicates that theresidues which experience slow motions in the µs-ms time scaleare mostly located in the loop and flanking residues with theexception of G2. The largest slow exchange contributions areobserved for the residues G2 and G13 which are located at theedges of the base-paired region possibly undergoing slowopening and closing of the base pairs. Of the residues in theloop, exchange contribution to relaxation is observed for C10,U11 and G13. The sugar moieties of C10 and U11 have a 2′endo conformation, and in the case of G13, a weak H1′-H2′cross peak is observed in the TOCSY spectrum suggesting aconformationalequilibriumbetweenC2′ andC3′ endoconformations.
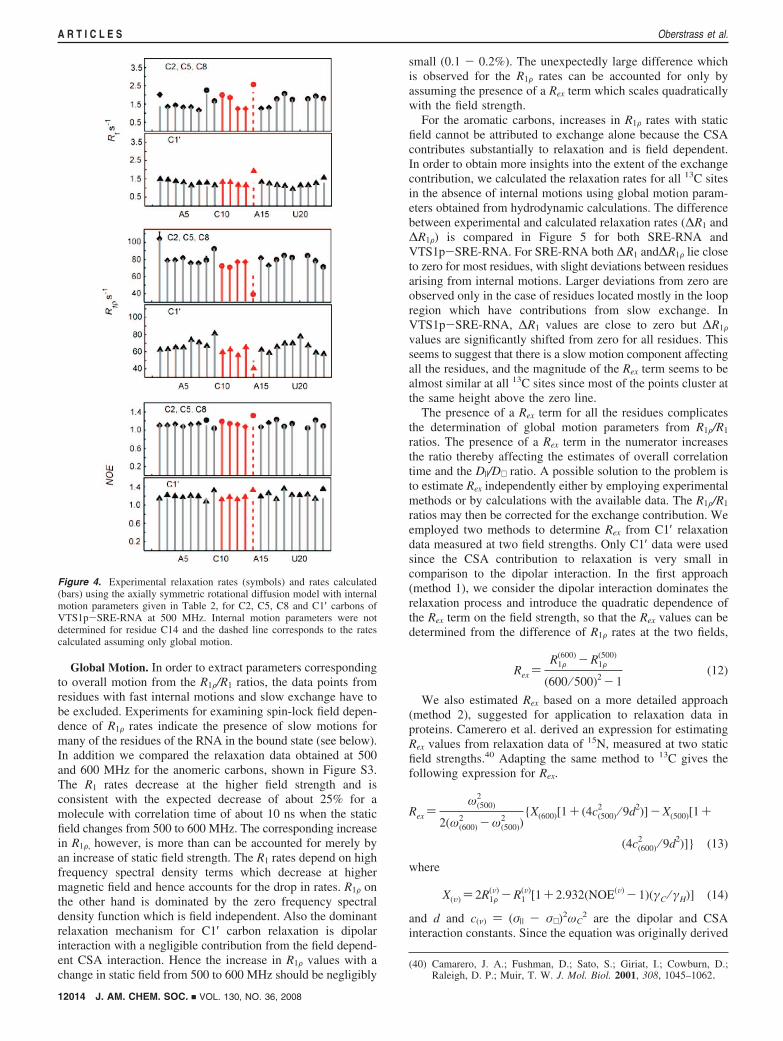
Dynamics Studies of VTS1p-SRE-RNA. The SRE-RNAbound to the VTS1p-SAM domain has approximately twice themolecular weight as the unbound RNA. Even in the bound formthe macromolecular complex has a modest molecular weightof about 16 kDa, and 13C relaxation rates can be measuredreliably for most of the residues. As in the case of SRE-RNA,two sets of samples with isotope labeling on only two nucleotidetypes per sample were used for the experiments. For the C6carbons, relaxation rates (R1 and R1F) were measured only forthe AC labeled sample since several of the C6 resonances wereoverlapped in the GU labeled sample. The C6 carbon data weretherefore not included in the analysis of internal motions. Theexperimental rates measured for C2, C5, C8 and C1′ carbonsat 500 MHz are shown in Figure 4. When compared to SRE-RNA, the R1 relaxation rates decrease, whereas the R1F ratesincrease as expected for an increase of correlation time foroverall motion.
(39) Davis, D. G.; Perlman, M. E.; London, R. E. J. Magn. Reson. B 1994,104, 266–275.
Figure 3. Fits of the two-site fast exchange model to the spin-lock fieldstrength dependence of R1F rates for aromatic and anomeric carbons of SRE-RNA.
J. AM. CHEM. SOC. 9 VOL. 130, NO. 36, 2008 12013
Dynamics of SRE-RNA on Binding to the VTS1p-SAM Domain A R T I C L E S
Global Motion. In order to extract parameters correspondingto overall motion from the R1F/R1 ratios, the data points fromresidues with fast internal motions and slow exchange have tobe excluded. Experiments for examining spin-lock field depen-dence of R1F rates indicate the presence of slow motions formany of the residues of the RNA in the bound state (see below).In addition we compared the relaxation data obtained at 500and 600 MHz for the anomeric carbons, shown in Figure S3.The R1 rates decrease at the higher field strength and isconsistent with the expected decrease of about 25% for amolecule with correlation time of about 10 ns when the staticfield changes from 500 to 600 MHz. The corresponding increasein R1F, however, is more than can be accounted for merely byan increase of static field strength. The R1 rates depend on highfrequency spectral density terms which decrease at highermagnetic field and hence accounts for the drop in rates. R1F onthe other hand is dominated by the zero frequency spectraldensity function which is field independent. Also the dominantrelaxation mechanism for C1′ carbon relaxation is dipolarinteraction with a negligible contribution from the field depend-ent CSA interaction. Hence the increase in R1F values with achange in static field from 500 to 600 MHz should be negligibly
small (0.1 - 0.2%). The unexpectedly large difference whichis observed for the R1F rates can be accounted for only byassuming the presence of a Rex term which scales quadraticallywith the field strength.
For the aromatic carbons, increases in R1F rates with staticfield cannot be attributed to exchange alone because the CSAcontributes substantially to relaxation and is field dependent.In order to obtain more insights into the extent of the exchangecontribution, we calculated the relaxation rates for all 13C sitesin the absence of internal motions using global motion param-eters obtained from hydrodynamic calculations. The differencebetween experimental and calculated relaxation rates (∆R1 and∆R1F) is compared in Figure 5 for both SRE-RNA andVTS1p-SRE-RNA. For SRE-RNA both ∆R1 and∆R1F lie closeto zero for most residues, with slight deviations between residuesarising from internal motions. Larger deviations from zero areobserved only in the case of residues located mostly in the loopregion which have contributions from slow exchange. InVTS1p-SRE-RNA, ∆R1 values are close to zero but ∆R1Fvalues are significantly shifted from zero for all residues. Thisseems to suggest that there is a slow motion component affectingall the residues, and the magnitude of the Rex term seems to bealmost similar at all 13C sites since most of the points cluster atthe same height above the zero line.
The presence of a Rex term for all the residues complicatesthe determination of global motion parameters from R1F/R1
ratios. The presence of a Rex term in the numerator increasesthe ratio thereby affecting the estimates of overall correlationtime and the D|/D⊥ ratio. A possible solution to the problem isto estimate Rex independently either by employing experimentalmethods or by calculations with the available data. The R1F/R1
ratios may then be corrected for the exchange contribution. Weemployed two methods to determine Rex from C1′ relaxationdata measured at two field strengths. Only C1′ data were usedsince the CSA contribution to relaxation is very small incomparison to the dipolar interaction. In the first approach(method 1), we consider the dipolar interaction dominates therelaxation process and introduce the quadratic dependence ofthe Rex term on the field strength, so that the Rex values can bedetermined from the difference of R1F rates at the two fields,
Rex )R1F
(600) -R1F(500)
(600 ⁄ 500)2 - 1(12)
We also estimated Rex based on a more detailed approach(method 2), suggested for application to relaxation data inproteins. Camerero et al. derived an expression for estimatingRex values from relaxation data of 15N, measured at two staticfield strengths.40 Adapting the same method to 13C gives thefollowing expression for Rex.
Rex )ω(500)
2
2(ω(600)2 -ω(500)
2 )X(600)[1+ (4c(500)
2 ⁄ 9d2)]-X(500)[1+
(4c(600)2 ⁄ 9d2)] (13)
where
X(υ) ) 2R1F(V) -R1
(V)[1+ 2.932(NOE(V) - 1)(γC ⁄ γH)] (14)
and d and c(ν) ) (σ| - σ⊥ )2ωC2 are the dipolar and CSA
interaction constants. Since the equation was originally derived
(40) Camarero, J. A.; Fushman, D.; Sato, S.; Giriat, I.; Cowburn, D.;Raleigh, D. P.; Muir, T. W. J. Mol. Biol. 2001, 308, 1045–1062.
Figure 4. Experimental relaxation rates (symbols) and rates calculated(bars) using the axially symmetric rotational diffusion model with internalmotion parameters given in Table 2, for C2, C5, C8 and C1′ carbons ofVTS1p-SRE-RNA at 500 MHz. Internal motion parameters were notdetermined for residue C14 and the dashed line corresponds to the ratescalculated assuming only global motion.
12014 J. AM. CHEM. SOC. 9 VOL. 130, NO. 36, 2008
A R T I C L E S Oberstrass et al.
in the context of 15N spins in proteins for which CSA is assumedto be axially symmetric, we assumed a symmetric C1′ CSAtensor with (σ| - σ⊥ ) value of 40 ppm for the purpose of thiscalculation.17 Since the method is applied only to C1′ carbonsfor which the contribution from CSA to relaxation is low, theassumption of axially symmetric CSA does not lead to largeerrors. Note that these approaches cannot be applied to aromaticcarbons because of the large contribution from the asymmetricCSA to relaxation rates. The Rex values determined by both theseapproaches is given in Table S2. The values obtained by bothmethods agree closely and implies that the simpler approach inmethod 1 for estimating Rex is acceptable.
The Rex values estimated using eq 12 were subtracted fromthe R1F values of the C1′ carbons to correct for the exchangecontribution and utilized to obtain the R1F/R1 ratios for determin-ing parameters for overall motion. As in the case of SRE-RNA,the ratios from the loop residues were excluded and therotational diffusion parameters were determined from 16exchange corrected R1F/R1 ratios from the 500 MHz data of C1′carbons. The best fit to experimental ratios are obtained for (θ|,φ|) ) (75°, 71°), overall rotational correlation time τc ) 10.93ns and a diffusion anisotropy of D|/D⊥ ) 1.65 (Figure S4),which were used in subsequent calculations. These valuescompare favorably with the values obtained from hydronmr,(θ|, φ|) ) (67°, 73°), τc ) 10.12 ns and D|/D⊥ ) 1.82.
The overall motion parameters were also determined by usingR1F/R1 of aromatic and anomeric carbons at 500 MHz withoutapplying any correction for exchange and excluding data fromloop residues. This gives parameters (θ|, φ|) ) (88°, 70°), τc )12.69 ns and D|/D⊥ ) 1.57. When overall motion parameterswere set to these values, most residues still required a Rex termfor a good fit of the R1, R1F and NOE data in the model-freeanalysis. Hence, a correction for exchange contribution seemsto be necessary before determining the overall motion param-eters. Since the large CSA makes it difficult to estimate Rex
contribution to relaxation of the aromatic carbons, we used onlycorrected C1′ data for determining parameters for rotationaldiffusion.
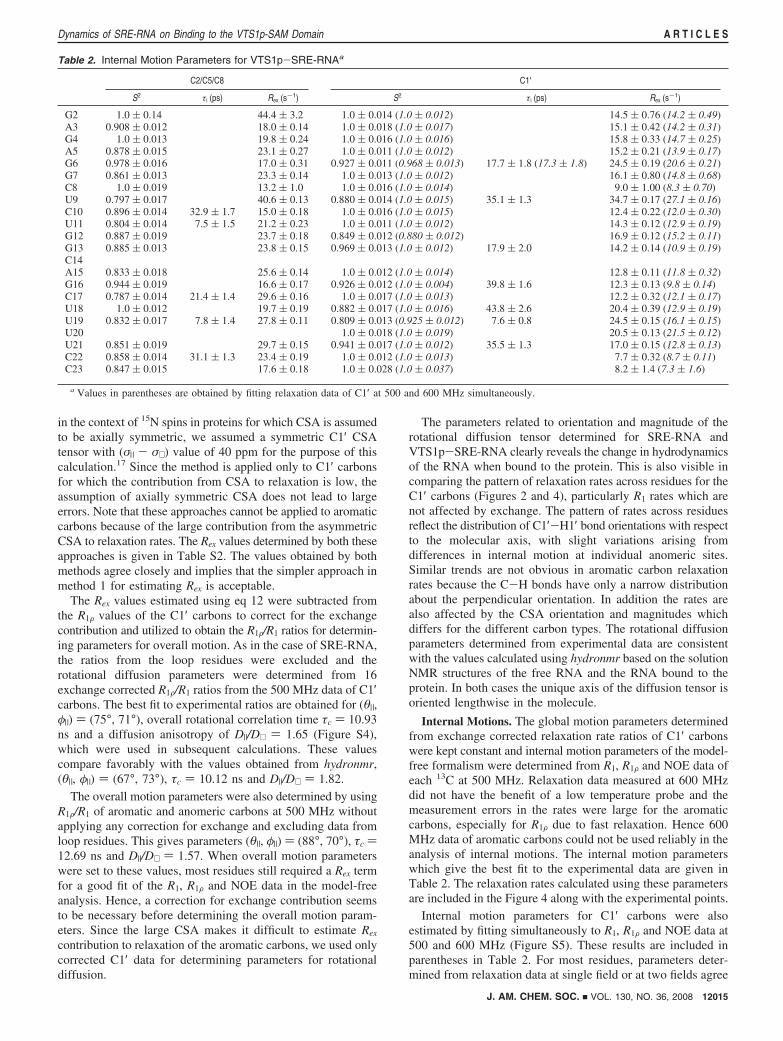
The parameters related to orientation and magnitude of therotational diffusion tensor determined for SRE-RNA andVTS1p-SRE-RNA clearly reveals the change in hydrodynamicsof the RNA when bound to the protein. This is also visible incomparing the pattern of relaxation rates across residues for theC1′ carbons (Figures 2 and 4), particularly R1 rates which arenot affected by exchange. The pattern of rates across residuesreflect the distribution of C1′-H1′ bond orientations with respectto the molecular axis, with slight variations arising fromdifferences in internal motion at individual anomeric sites.Similar trends are not obvious in aromatic carbon relaxationrates because the C-H bonds have only a narrow distributionabout the perpendicular orientation. In addition the rates arealso affected by the CSA orientation and magnitudes whichdiffers for the different carbon types. The rotational diffusionparameters determined from experimental data are consistentwith the values calculated using hydronmr based on the solutionNMR structures of the free RNA and the RNA bound to theprotein. In both cases the unique axis of the diffusion tensor isoriented lengthwise in the molecule.
Internal Motions. The global motion parameters determinedfrom exchange corrected relaxation rate ratios of C1′ carbonswere kept constant and internal motion parameters of the model-free formalism were determined from R1, R1F and NOE data ofeach 13C at 500 MHz. Relaxation data measured at 600 MHzdid not have the benefit of a low temperature probe and themeasurement errors in the rates were large for the aromaticcarbons, especially for R1F due to fast relaxation. Hence 600MHz data of aromatic carbons could not be used reliably in theanalysis of internal motions. The internal motion parameterswhich give the best fit to the experimental data are given inTable 2. The relaxation rates calculated using these parametersare included in the Figure 4 along with the experimental points.
Internal motion parameters for C1′ carbons were alsoestimated by fitting simultaneously to R1, R1F and NOE data at500 and 600 MHz (Figure S5). These results are included inparentheses in Table 2. For most residues, parameters deter-mined from relaxation data at single field or at two fields agree
Table 2. Internal Motion Parameters for VTS1p-SRE-RNAa
C2/C5/C8 C1′
S2 τi (ps) Rex (s-1) S2 τi (ps) Rex (s-1)
G2 1.0 ( 0.14 44.4 ( 3.2 1.0 ( 0.014 (1.0 ( 0.012) 14.5 ( 0.76 (14.2 ( 0.49)A3 0.908 ( 0.012 18.0 ( 0.14 1.0 ( 0.018 (1.0 ( 0.017) 15.1 ( 0.42 (14.2 ( 0.31)G4 1.0 ( 0.013 19.8 ( 0.24 1.0 ( 0.016 (1.0 ( 0.016) 15.8 ( 0.33 (14.7 ( 0.25)A5 0.878 ( 0.015 23.1 ( 0.27 1.0 ( 0.011 (1.0 ( 0.012) 15.2 ( 0.21 (13.9 ( 0.17)G6 0.978 ( 0.016 17.0 ( 0.31 0.927 ( 0.011 (0.968 ( 0.013) 17.7 ( 1.8 (17.3 ( 1.8) 24.5 ( 0.19 (20.6 ( 0.21)G7 0.861 ( 0.013 23.3 ( 0.14 1.0 ( 0.013 (1.0 ( 0.012) 16.1 ( 0.80 (14.8 ( 0.68)C8 1.0 ( 0.019 13.2 ( 1.0 1.0 ( 0.016 (1.0 ( 0.014) 9.0 ( 1.00 (8.3 ( 0.70)U9 0.797 ( 0.017 40.6 ( 0.13 0.880 ( 0.014 (1.0 ( 0.015) 35.1 ( 1.3 34.7 ( 0.17 (27.1 ( 0.16)C10 0.896 ( 0.014 32.9 ( 1.7 15.0 ( 0.18 1.0 ( 0.016 (1.0 ( 0.015) 12.4 ( 0.22 (12.0 ( 0.30)U11 0.804 ( 0.014 7.5 ( 1.5 21.2 ( 0.23 1.0 ( 0.011 (1.0 ( 0.012) 14.3 ( 0.12 (12.9 ( 0.19)G12 0.887 ( 0.019 23.7 ( 0.18 0.849 ( 0.012 (0.880 ( 0.012) 16.9 ( 0.12 (15.2 ( 0.11)G13 0.885 ( 0.013 23.8 ( 0.15 0.969 ( 0.013 (1.0 ( 0.012) 17.9 ( 2.0 14.2 ( 0.14 (10.9 ( 0.19)C14A15 0.833 ( 0.018 25.6 ( 0.14 1.0 ( 0.012 (1.0 ( 0.014) 12.8 ( 0.11 (11.8 ( 0.32)G16 0.944 ( 0.019 16.6 ( 0.17 0.926 ( 0.012 (1.0 ( 0.004) 39.8 ( 1.6 12.3 ( 0.13 (9.8 ( 0.14)C17 0.787 ( 0.014 21.4 ( 1.4 29.6 ( 0.16 1.0 ( 0.017 (1.0 ( 0.013) 12.2 ( 0.32 (12.1 ( 0.17)U18 1.0 ( 0.012 19.7 ( 0.19 0.882 ( 0.017 (1.0 ( 0.016) 43.8 ( 2.6 20.4 ( 0.39 (12.9 ( 0.19)U19 0.832 ( 0.017 7.8 ( 1.4 27.8 ( 0.11 0.809 ( 0.013 (0.925 ( 0.012) 7.6 ( 0.8 24.5 ( 0.15 (16.1 ( 0.15)U20 1.0 ( 0.018 (1.0 ( 0.019) 20.5 ( 0.13 (21.5 ( 0.12)U21 0.851 ( 0.019 29.7 ( 0.15 0.941 ( 0.017 (1.0 ( 0.012) 35.5 ( 1.3 17.0 ( 0.15 (12.8 ( 0.13)C22 0.858 ( 0.014 31.1 ( 1.3 23.4 ( 0.19 1.0 ( 0.012 (1.0 ( 0.013) 7.7 ( 0.32 (8.7 ( 0.11)C23 0.847 ( 0.015 17.6 ( 0.18 1.0 ( 0.028 (1.0 ( 0.037) 8.2 ( 1.4 (7.3 ( 1.6)
a Values in parentheses are obtained by fitting relaxation data of C1′ at 500 and 600 MHz simultaneously.
J. AM. CHEM. SOC. 9 VOL. 130, NO. 36, 2008 12015
Dynamics of SRE-RNA on Binding to the VTS1p-SAM Domain A R T I C L E S
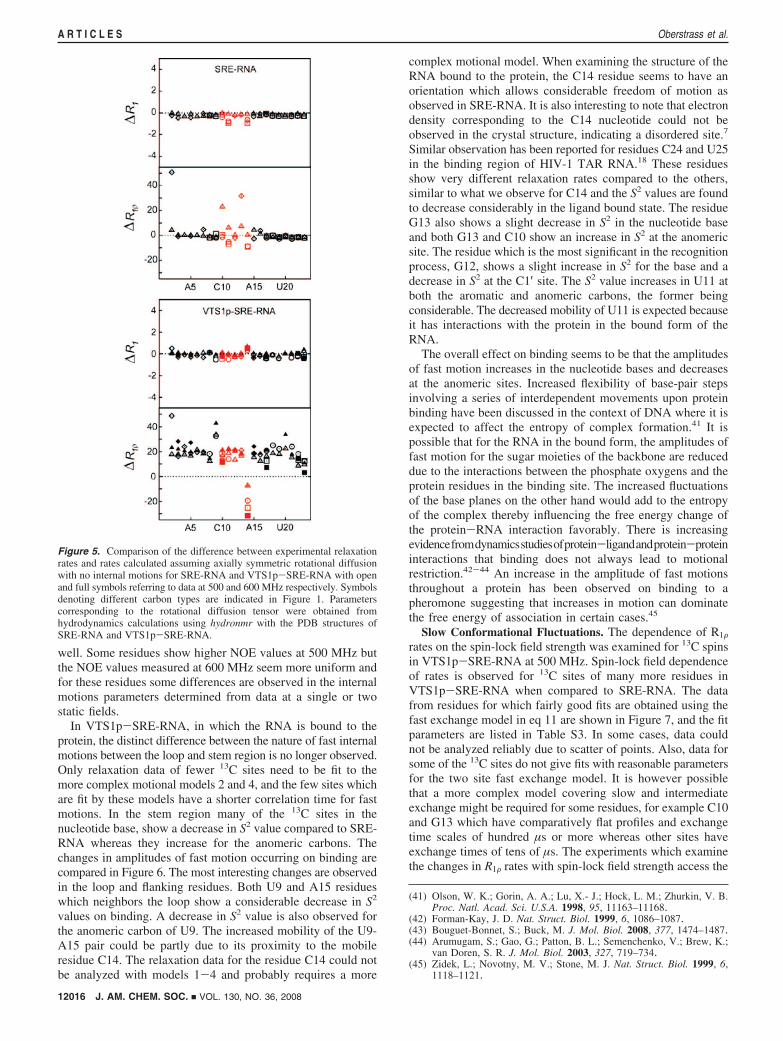
well. Some residues show higher NOE values at 500 MHz butthe NOE values measured at 600 MHz seem more uniform andfor these residues some differences are observed in the internalmotions parameters determined from data at a single or twostatic fields.
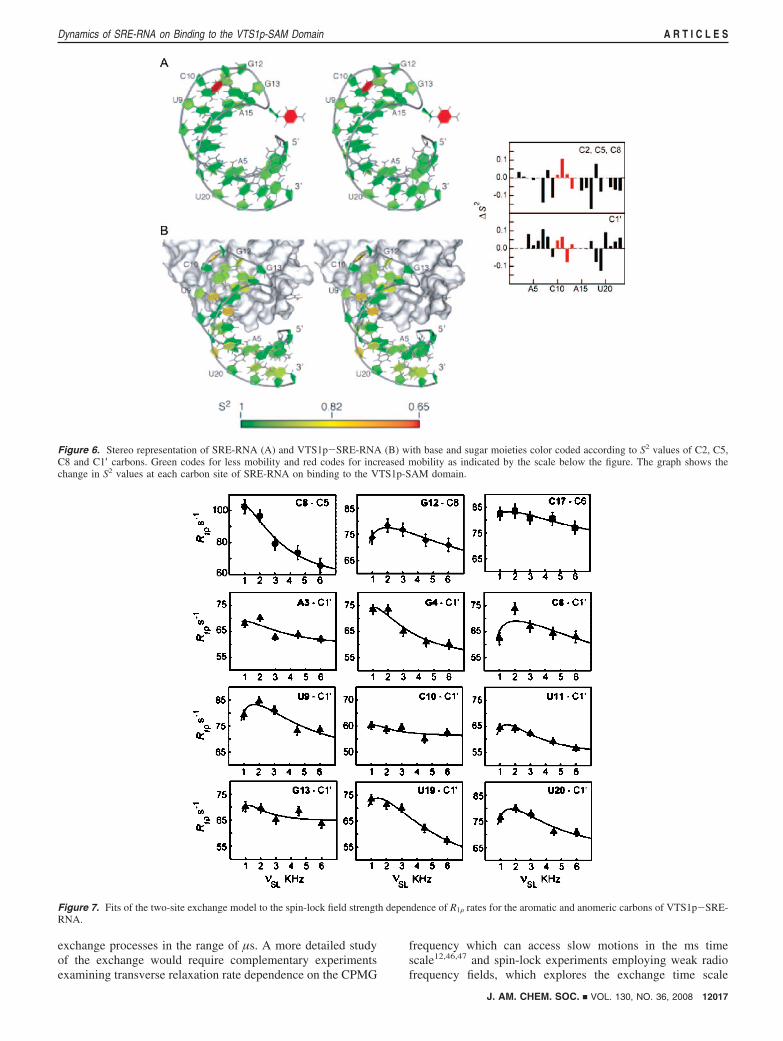
In VTS1p-SRE-RNA, in which the RNA is bound to theprotein, the distinct difference between the nature of fast internalmotions between the loop and stem region is no longer observed.Only relaxation data of fewer 13C sites need to be fit to themore complex motional models 2 and 4, and the few sites whichare fit by these models have a shorter correlation time for fastmotions. In the stem region many of the 13C sites in thenucleotide base, show a decrease in S2 value compared to SRE-RNA whereas they increase for the anomeric carbons. Thechanges in amplitudes of fast motion occurring on binding arecompared in Figure 6. The most interesting changes are observedin the loop and flanking residues. Both U9 and A15 residueswhich neighbors the loop show a considerable decrease in S2
values on binding. A decrease in S2 value is also observed forthe anomeric carbon of U9. The increased mobility of the U9-A15 pair could be partly due to its proximity to the mobileresidue C14. The relaxation data for the residue C14 could notbe analyzed with models 1-4 and probably requires a more
complex motional model. When examining the structure of theRNA bound to the protein, the C14 residue seems to have anorientation which allows considerable freedom of motion asobserved in SRE-RNA. It is also interesting to note that electrondensity corresponding to the C14 nucleotide could not beobserved in the crystal structure, indicating a disordered site.7
Similar observation has been reported for residues C24 and U25in the binding region of HIV-1 TAR RNA.18 These residuesshow very different relaxation rates compared to the others,similar to what we observe for C14 and the S2 values are foundto decrease considerably in the ligand bound state. The residueG13 also shows a slight decrease in S2 in the nucleotide baseand both G13 and C10 show an increase in S2 at the anomericsite. The residue which is the most significant in the recognitionprocess, G12, shows a slight increase in S2 for the base and adecrease in S2 at the C1′ site. The S2 value increases in U11 atboth the aromatic and anomeric carbons, the former beingconsiderable. The decreased mobility of U11 is expected becauseit has interactions with the protein in the bound form of theRNA.
The overall effect on binding seems to be that the amplitudesof fast motion increases in the nucleotide bases and decreasesat the anomeric sites. Increased flexibility of base-pair stepsinvolving a series of interdependent movements upon proteinbinding have been discussed in the context of DNA where it isexpected to affect the entropy of complex formation.41 It ispossible that for the RNA in the bound form, the amplitudes offast motion for the sugar moieties of the backbone are reduceddue to the interactions between the phosphate oxygens and theprotein residues in the binding site. The increased fluctuationsof the base planes on the other hand would add to the entropyof the complex thereby influencing the free energy change ofthe protein-RNA interaction favorably. There is increasingevidencefromdynamicsstudiesofprotein-ligandandprotein-proteininteractions that binding does not always lead to motionalrestriction.42-44 An increase in the amplitude of fast motionsthroughout a protein has been observed on binding to apheromone suggesting that increases in motion can dominatethe free energy of association in certain cases.45
Slow Conformational Fluctuations. The dependence of R1Frates on the spin-lock field strength was examined for 13C spinsin VTS1p-SRE-RNA at 500 MHz. Spin-lock field dependenceof rates is observed for 13C sites of many more residues inVTS1p-SRE-RNA when compared to SRE-RNA. The datafrom residues for which fairly good fits are obtained using thefast exchange model in eq 11 are shown in Figure 7, and the fitparameters are listed in Table S3. In some cases, data couldnot be analyzed reliably due to scatter of points. Also, data forsome of the 13C sites do not give fits with reasonable parametersfor the two site fast exchange model. It is however possiblethat a more complex model covering slow and intermediateexchange might be required for some residues, for example C10and G13 which have comparatively flat profiles and exchangetime scales of hundred µs or more whereas other sites haveexchange times of tens of µs. The experiments which examinethe changes in R1F rates with spin-lock field strength access the
(41) Olson, W. K.; Gorin, A. A.; Lu, X.- J.; Hock, L. M.; Zhurkin, V. B.Proc. Natl. Acad. Sci. U.S.A. 1998, 95, 11163–11168.
(42) Forman-Kay, J. D. Nat. Struct. Biol. 1999, 6, 1086–1087.(43) Bouguet-Bonnet, S.; Buck, M. J. Mol. Biol. 2008, 377, 1474–1487.(44) Arumugam, S.; Gao, G.; Patton, B. L.; Semenchenko, V.; Brew, K.;
van Doren, S. R. J. Mol. Biol. 2003, 327, 719–734.(45) Zidek, L.; Novotny, M. V.; Stone, M. J. Nat. Struct. Biol. 1999, 6,
1118–1121.
Figure 5. Comparison of the difference between experimental relaxationrates and rates calculated assuming axially symmetric rotational diffusionwith no internal motions for SRE-RNA and VTS1p-SRE-RNA with openand full symbols referring to data at 500 and 600 MHz respectively. Symbolsdenoting different carbon types are indicated in Figure 1. Parameterscorresponding to the rotational diffusion tensor were obtained fromhydrodynamics calculations using hydronmr with the PDB structures ofSRE-RNA and VTS1p-SRE-RNA.
12016 J. AM. CHEM. SOC. 9 VOL. 130, NO. 36, 2008
A R T I C L E S Oberstrass et al.
exchange processes in the range of µs. A more detailed studyof the exchange would require complementary experimentsexamining transverse relaxation rate dependence on the CPMG
frequency which can access slow motions in the ms timescale12,46,47 and spin-lock experiments employing weak radiofrequency fields, which explores the exchange time scale
Figure 6. Stereo representation of SRE-RNA (A) and VTS1p-SRE-RNA (B) with base and sugar moieties color coded according to S2 values of C2, C5,C8 and C1′ carbons. Green codes for less mobility and red codes for increased mobility as indicated by the scale below the figure. The graph shows thechange in S2 values at each carbon site of SRE-RNA on binding to the VTS1p-SAM domain.
Figure 7. Fits of the two-site exchange model to the spin-lock field strength dependence of R1F rates for the aromatic and anomeric carbons of VTS1p-SRE-RNA.
J. AM. CHEM. SOC. 9 VOL. 130, NO. 36, 2008 12017
Dynamics of SRE-RNA on Binding to the VTS1p-SAM Domain A R T I C L E S
window between the ones accessed by spin-lock field strengthand CPMG frequency experiments.48
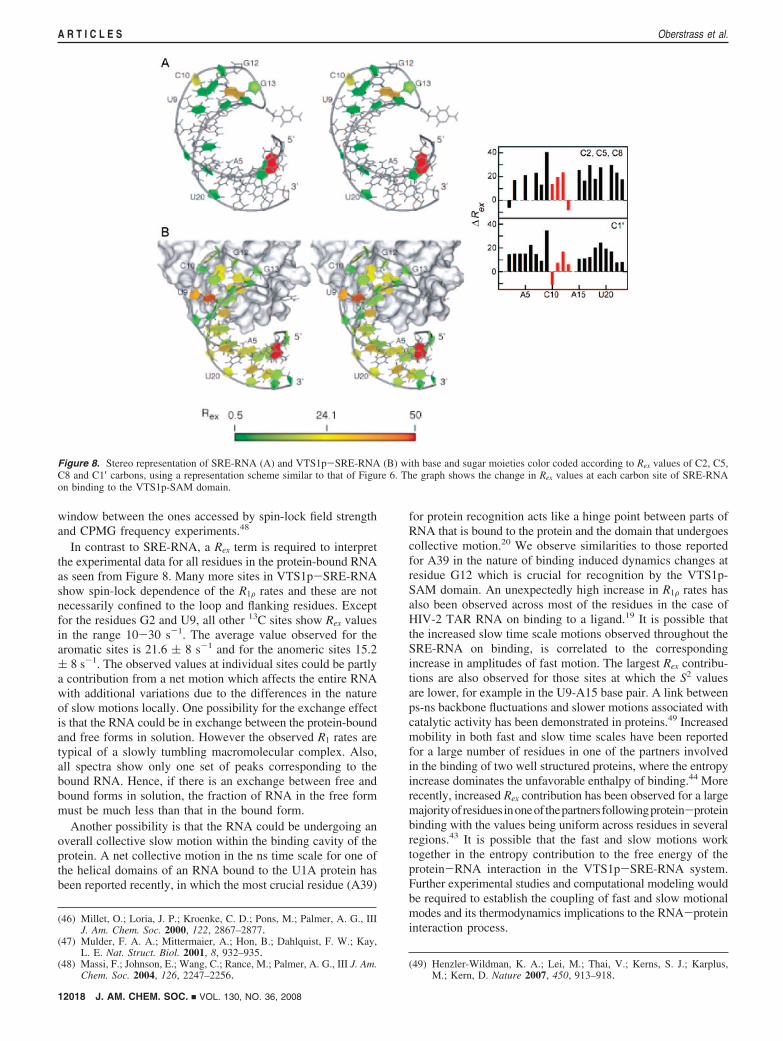
In contrast to SRE-RNA, a Rex term is required to interpretthe experimental data for all residues in the protein-bound RNAas seen from Figure 8. Many more sites in VTS1p-SRE-RNAshow spin-lock dependence of the R1F rates and these are notnecessarily confined to the loop and flanking residues. Exceptfor the residues G2 and U9, all other 13C sites show Rex valuesin the range 10-30 s-1. The average value observed for thearomatic sites is 21.6 ( 8 s-1 and for the anomeric sites 15.2( 8 s-1. The observed values at individual sites could be partlya contribution from a net motion which affects the entire RNAwith additional variations due to the differences in the natureof slow motions locally. One possibility for the exchange effectis that the RNA could be in exchange between the protein-boundand free forms in solution. However the observed R1 rates aretypical of a slowly tumbling macromolecular complex. Also,all spectra show only one set of peaks corresponding to thebound RNA. Hence, if there is an exchange between free andbound forms in solution, the fraction of RNA in the free formmust be much less than that in the bound form.
Another possibility is that the RNA could be undergoing anoverall collective slow motion within the binding cavity of theprotein. A net collective motion in the ns time scale for one ofthe helical domains of an RNA bound to the U1A protein hasbeen reported recently, in which the most crucial residue (A39)
for protein recognition acts like a hinge point between parts ofRNA that is bound to the protein and the domain that undergoescollective motion.20 We observe similarities to those reportedfor A39 in the nature of binding induced dynamics changes atresidue G12 which is crucial for recognition by the VTS1p-SAM domain. An unexpectedly high increase in R1F rates hasalso been observed across most of the residues in the case ofHIV-2 TAR RNA on binding to a ligand.19 It is possible thatthe increased slow time scale motions observed throughout theSRE-RNA on binding, is correlated to the correspondingincrease in amplitudes of fast motion. The largest Rex contribu-tions are also observed for those sites at which the S2 valuesare lower, for example in the U9-A15 base pair. A link betweenps-ns backbone fluctuations and slower motions associated withcatalytic activity has been demonstrated in proteins.49 Increasedmobility in both fast and slow time scales have been reportedfor a large number of residues in one of the partners involvedin the binding of two well structured proteins, where the entropyincrease dominates the unfavorable enthalpy of binding.44 Morerecently, increased Rex contribution has been observed for a largemajorityofresiduesinoneofthepartnersfollowingprotein-proteinbinding with the values being uniform across residues in severalregions.43 It is possible that the fast and slow motions worktogether in the entropy contribution to the free energy of theprotein-RNA interaction in the VTS1p-SRE-RNA system.Further experimental studies and computational modeling wouldbe required to establish the coupling of fast and slow motionalmodes and its thermodynamics implications to the RNA-proteininteraction process.
(46) Millet, O.; Loria, J. P.; Kroenke, C. D.; Pons, M.; Palmer, A. G., IIIJ. Am. Chem. Soc. 2000, 122, 2867–2877.
(47) Mulder, F. A. A.; Mittermaier, A.; Hon, B.; Dahlquist, F. W.; Kay,L. E. Nat. Struct. Biol. 2001, 8, 932–935.
(48) Massi, F.; Johnson, E.; Wang, C.; Rance, M.; Palmer, A. G., III J. Am.Chem. Soc. 2004, 126, 2247–2256.
(49) Henzler-Wildman, K. A.; Lei, M.; Thai, V.; Kerns, S. J.; Karplus,M.; Kern, D. Nature 2007, 450, 913–918.
Figure 8. Stereo representation of SRE-RNA (A) and VTS1p-SRE-RNA (B) with base and sugar moieties color coded according to Rex values of C2, C5,C8 and C1′ carbons, using a representation scheme similar to that of Figure 6. The graph shows the change in Rex values at each carbon site of SRE-RNAon binding to the VTS1p-SAM domain.
12018 J. AM. CHEM. SOC. 9 VOL. 130, NO. 36, 2008
A R T I C L E S Oberstrass et al.
Dynamics Changes in the SRE-RNA Pentaloop. The changesin dynamics at individual sites may be examined in the contextof the relevance of the various residues in the loop region tothe recognition process. The structural studies have shown thatG12 of the loop is the most important residue in the recognitionprocess. G12 occupies the binding cavity and is the residuewhich makes maximum number of contacts with the proteinthrough hydrogen-bonded interactions involving the amino andimino protons of the base and the oxygen of the phosphategroup. The order parameter of the nucleotide base carbon ofG12 increases on protein binding indicating a decrease inamplitude of fast motion (ps) of the base moiety. The orderparameter at the anomeric site on the other hand decreases. Thissupports the observation of hydrogen-bonded interactionsinvolving the G12 base in the protein-bound RNA structure.No indications of µs-ms motions were observed for the G12residue in the free RNA but in the bound form G12 is subjectto slow motions. It is significant that in the free RNA unlikeother loop residues, G12 which is specifically recognized bythe VTS1p-SAM domain has no slow conformational fluctua-tions, and the fast motions are also more restricted comparedto other nonbase-paired residues of the loop.
Comparison of order parameters indicate that the flexibilityof the base of G13 increases slightly in the bound form. Theanomeric site however becomes more rigid for both C10 andG13. Both C10 and G13 have contacts to the protein throughphosphate oxygens. The spin-lock field profiles for R1F rates ofthe anomeric carbons are also very similar in C10 and G13,suggesting their local dynamics are very closely related. Thetwo residues are linked across the loop by a hydrogen bond,and this could explain the similarity of the local motionsinvolving these residues. The C10-G13 base pairing is anessential feature which stabilizes the RNA fold. The residuesC10, G12 and G13 are the most important for recognition bythe VTS1p-SAM domain, and a mutation of any one of theseresidues drastically reduces the binding affinity.50 These threeresidues form an arrangement very similar to those observedfor nucleotides G25, C38 and A39 in the U1A protein-RNAcomplex.20 The residue A39 which has stacking interactionswith the G25-C38 base pair is the most significant residue inthe recognition process. As observed in the case of G12 inVTS1p-SRE-RNA, A39 is comparatively rigid in the free RNAand on binding to U1A protein, the base becomes more rigid,whereas the anomeric site becomes more flexible.
The dynamics of residue U11 becomes considerablyrestricted in the protein-bound form when compared to thelarge amplitude motions of this residue in the free RNA. Thisresidue also forms contacts with the protein through thephosphate group and is flanked by other residues which havesignificant contacts with the protein. Residue C14 on the otherhand, has R1 and NOE values in the bound form which aremuch higher than that observed for other residues while theR1F rates are lower, indicating that the carbon sites on C14could be associated with considerably lower S2 values. It ispossible that the high freedom of motion of this residue inthe free state is also retained to some extent in the boundform since it is looped out in the structure. The dynamics atthis site probably needs to be analyzed in terms of a morecomplex model, for example the extension of the model-free approach which considers fast internal motions in two
time scales, 10-200 ps and over 1000 ps.51 Even thoughC14 has contact to the protein through the phosphate group,it is not essential in protein binding. Mutation or deletion ofthis residue does not have a strong effect on the binding.50Theresidue U9 which flanks the loop shows considerablyincreased mobility on protein binding. It is interesting thateven though U9 is flanked by residues which have contactsto the protein, U9 itself does not make any specific contactwith the protein. In general all residues which make contactswith the protein through the sugar-phosphate backbone showmore restricted mobility at the anomeric site with theexception of G12.
Protein binding also results in significant contributions tothe R1F relaxation rate from an exchange term. It is interestingto consider examples of other biomolecules in which a largenumber of residues show evidence of motions in the µs-mstime scale.43,52 A striking example is that of RNase A inwhich almost one-third of the backbone residues showsignificant slow motions, many of them being located in theactive site and substrate binding sites.52 The exchange timescales were observed to be identical for all the residues withinexperimental error, suggesting a collective motion involvingthese sites. The presence of a collective slow motion in theµs-ms time scale in an RNA binding protein is interestingin the context of our observations for the protein-bound RNA.It is possible that the interface at which protein-RNAinteractions occur is dynamic, with concerted slow motionsover a continuously maintained and tightly packed interface.Interface dynamics have also been shown to be important inprotein-DNA interactions.53 As part of this project we arealso carrying out studies of dynamics changes in the VTS1p-SAM domain on SRE-RNA binding which should throw morelight on the nature of the binding interface dynamics. Thedynamics of the VTS1p-SAM domain in the free formresembles that reported for RNase-A with restricted flexibilityon the fast time scale (ps-ns) and mobility on the slowertime scale at various regions some being located close tothe binding region. Further work examining changes in thedynamics on RNA binding is in progress.
Conclusions
Relaxation rates for C2, C5, C6 and C8 nuclei of thenucleotide bases and the C1′ carbons of SRE-RNA in thefree and protein-bound states have been analyzed assumingaxially symmetric rotational diffusion for the overall motionand a model-free description of the internal motion, byincluding all relevant spin interactions. Quantitative analysisof the dynamics of the SRE-RNA in its free form and in theprotein-bound state indicates that molecular motions play animportant role in its recognition by the VTS1p-SAM domain.One of the important observations is that in the free RNAthe nucleotide which is specifically recognized by the proteinis fairly rigid in a loop, whereas other non-hydrogen-bondedresidues are highly flexible. This has also been noted fornucleotides specifically recognized by proteins in few of theother dynamics studies of RNA-protein/ligand complexesand could be a significant feature in RNA-protein recogni-tion. In most residues, flexibility seems to increase at thearomatic carbon sites while it decreases at the anomeric sites.
(50) Aviv, T.; Lin, Z.; Lau, S.; Rendl, L. M.; Sicheri, F.; Smibert, C. A.Nat. Struct. Biol. 2003, 10, 614–621.
(51) Clore, G. M.; Szabo, A.; Bax, A.; Kay, L. E.; Driscoll, P. C.;Gronenborn, A. J. Am. Chem. Soc. 1990, 112, 4989–4991.
(52) Cole, R.; Loria, J. P. Biochemistry 2002, 41, 6072–6081.
J. AM. CHEM. SOC. 9 VOL. 130, NO. 36, 2008 12019
Dynamics of SRE-RNA on Binding to the VTS1p-SAM Domain A R T I C L E S
Much of the dynamics changes noted for the nucleotides ofthe pentaloop which forms the binding interface with theprotein are consistent with the establishment of direct contactswith the protein sidechains. The surprising observation is thepresence of significant slow motions in the RNA in itsprotein-bound form. The role of slow motions have not beenanalyzed quantitatively in the other reported dynamics studiesof RNA-protein/ligand complexes. However, such enhancedslow motions of entire domains on binding have beenobserved in protein-protein interactions and has beensuggested from detailed analysis of several DNA-proteinstructures. Since SRE-RNA binding to VTS1p-SAM domaindoes not involve significant structural changes in eitherpartner, it is possible that enhanced flexibility in the boundstate contributes toward making the association an entropy-driven process.
Acknowledgment. This work was supported by the Indo-SwissBilateral Research Initiative (ISBRI) program, a research grant to
S.R. from the Department of Science and Technology, India, andgrants from the Swiss National Science Foundation (Nr: 3100A0-118118) and from the Structural Biology National Center ofCompetence in Research (SNF-NCCR) to FHTA.
Supporting Information Available: Figures showing experi-mental and calculated relaxation data for C6 carbons, fits toanisotropic rotational diffusion model, multiple field experi-mental and calculated relaxation data for C1′ carbons and tablesof calculated exchange rates and fit parameters for spin-lockfield dependence of transverse relaxation rates.This material isavailable free of charge via the Internet at http://pubs.acs.org.
JA8023115
(53) Kalodimos, C. G.; Boelens, R.; Kaptein, R. Chem. ReV. 2004, 104,3567–3586.
12020 J. AM. CHEM. SOC. 9 VOL. 130, NO. 36, 2008
A R T I C L E S Oberstrass et al.