Embed Size (px)
Citation preview
IOSR Journal of Pharmacy and Biological Sciences (IOSR-JPBS)
e-ISSN:2278-3008, p-ISSN:2319-7676. Volume 12, Issue 1 Ver. IV (Jan. - Feb.2017), PP 74-87
www.iosrjournals.org
DOI: 10.9790/3008-1201047487 www.iosrjournals.org 74 | Page
Change of Soil Bacteria Diversity between Desertification and
Restoration
Feijie Li1,2,3
, Haiyan Jia1,2
, Yan Wang1,2
, Hui Tang1,2
,Liping Zhang1,2,3
1(College of Life Sciences, Hebei University, Baoding 071002, PR China)
2(The Key Lab of Microbial Diversity Research and Application of Hebei Province, Baoding 071002, PR China)
3(Key Laboratory of Medicinal Chemistry and Molecular Diagnosis, Hebei UniversityMinistry of Education,
Baoding 071002, PR China)
Abstract:The control of desertification has focused for centuries on plants and animals; microbial profiles are
largely unknown. We collected soil samples from the aeoliansandy land (SL), sandy grassland (SG), and
restored sandy land (RS), respectively. Diversity indexes were determined based on 16S rDNA sequencing.
Results show that SL is of the highest species diversity and richness as deduced from Shannon
index(SL>RS>SG)and Menhinick index (SL>RS>SG), while the microbial distribution is most homogeneous in
RS and most inhomogeneous in SG as deduced from Evenness index (RS>SL>SG). Acidobacteria,
Proteobacteria, Actinobacteriaand Firmicuteswere among the highly abundant taxonomic groups present
across the three sample sites and were designated as the core phyla. Acidobacteriawere dominant in SG(49.8%)
and RS (32.4%), while Actinobacteria (23.9%) and Firmicutes (22.6%) were dominant in SL. Although the
overall microbial composition was more similar between SG and RS, there are more common genus shared by
SL and RS. Besides, compared with SL, only Acidobacteriaand Proteobacteriaincreased, Firmicutesand
Actinobacteriadecreased greatly in SG and RS. We try to explain the microorganisms’ function in the progress
of desertification and restoration, and to provide a theoretical basis for the recovery of aeolian sandy land.
Keywords:bacteria diversity,desertification,restoration, soil samples, 16S rDNA
I. Introduction Desertification was initially defined as the change of productive lands into desert, caused by human
activity[1]. In 1977, the United Nations Environment Program defined desertification as “the diminution or
destruction of biological potential of land which can lead ultimately to desert-like conditions”[2]. UN member
countries have ratified the UNCCD (United Nations Convention to Combat Desertification) which provides
international guidelines for responding to desertification. According to the Convention, desertification is “land
degradation in arid, semi-arid and dry sub-humid areas resulting from various factors including climatic
variations and human activities”[3].
The desert is a xeric environment, and is characterized by low and unpredictable rainfall amounts and
frequency, low amounts of nutrients, and organic matter[4], [5],and temporal patterns of resource distribution. In
these arid ecosystems, water availability and organic matter are the major factors limiting soil-biotic activity[6].
At present, the potential, mild and moderate desertification land occupies 60% of the total desertification
land[7], [8]. But as long as human manage it properly, the desertification land is likely to improve and restore in
a short period of time[9]. There has been a lot of papers reported that in arid and semi-arid areas, desertified
conditions may allow for vegetation and landscape recovery at least temporarily[10]. And over periods of
several decades, changes in rainfall regimes or human activity may allow for self-remediation or „greening‟ of
areas previously described as desertified[11]–[13].
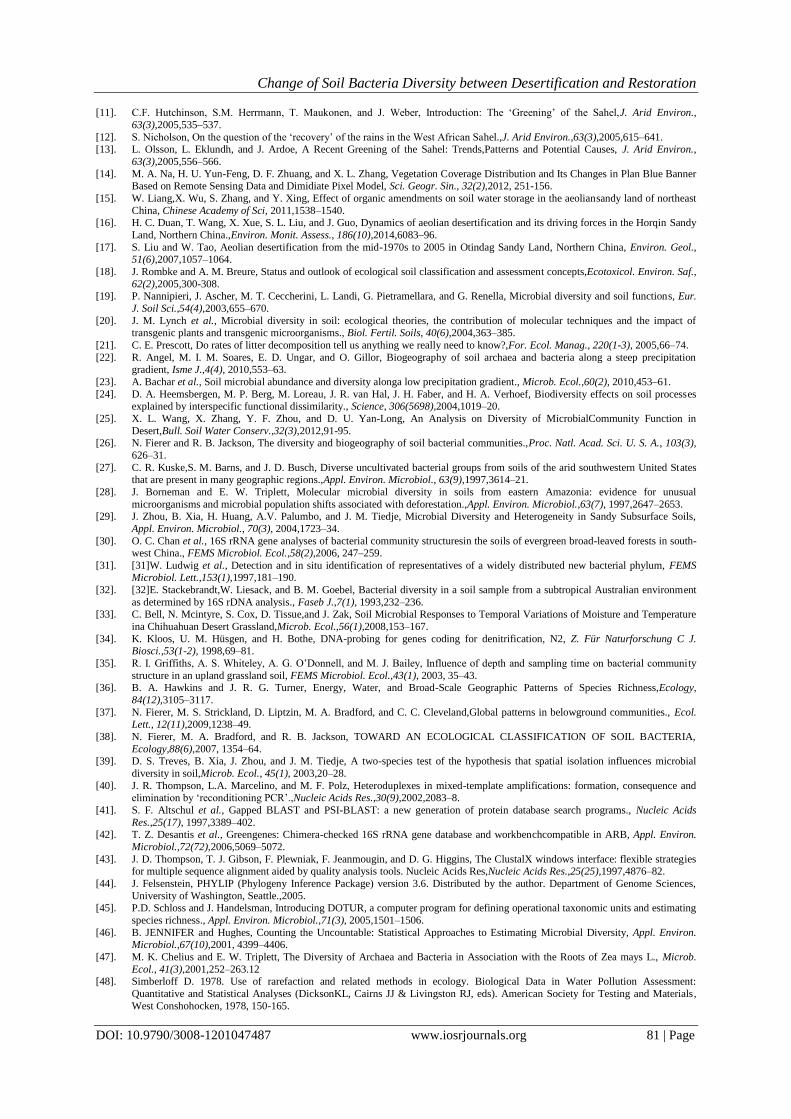
Inner Mongolia, China has a vast territory and a variety of soil types (Fig. 1a[14]). Among those soil
zones, aeolian sandy soil is widely distributed, and it can be found almost all the continents in the world[15],
[16]. Aeolian sandy soil has some common characters compared with desert, but its development and utilization
potential is larger, as long as treat it properly, it is possible for the recovery of aeolian sandy land. However, for
a long time, people have not realized the value of aeolian sandy land. In recent years, with the control and
management of the aeolian sandy land, the situation has been improved obviously[17]. In September and
October 2012, we investigated the status of desertification in Plain Blue Banner, and sampled at the
desertificated aeolian sandy land, restored aeolian sandy land and have not been desertificated aeolian sandy
grassland. We constructed three 16S rDNA clone libraries using the soil samples. Our purpose was just to study
the microbial community and diversity, and the possible functions in desertification and restoration.
In soil ecological systems, soil microbes are predominant over animals and plants, and they are directly
or indirectly involved in the diverse functions of the soil environment[18], playing key roles in energy flow,
nutrient cycle, system stability, and carbon sequestration[19]–[23]. Microbial community is composed of a
plurality of microbial population, its community structure and diversity can sensitively reflect the ecological
Change of Soil Bacteria Diversity between Desertification and Restoration
DOI: 10.9790/3008-1201047487 www.iosrjournals.org 75 | Page
functions and the environment changes, and it is a pioneer of the ecological environment restoration[24].
Largescale surveys conducted in recent years have shown that different ecosystems support unique microbial
populations[25],[26]. A number of molecular microbial diversity studies of soil communities have been
reported[27]–[30], but there has been no comparable analysis of the relationship between sandy land and the
restored sandy land. In our attempt to study the microbial community composition within each of the sample
sites we relied on a previous study[31]in which they tested bacterial diversity, using a scheme that enabled us to
examine triplicate composite soil samples in each plot within each sample site. In their study, statistical analysis
of bacterial fingerprints revealed that the differences among plots within each site are not statistically significant
(P=0.33), indicating that the samples taken from the plots within a site are indeed replicates[32]. According to
this, we decided to study the soil microbial community at a single representative plot within each sample site.
For most terrestrial ecosystems, soil microbial community structure has turned out to be strongly
influenced by soil temperature, soil moisture, soil pH, or a combination of these factors[26], [33]. Changes in
the composition of the microbial community can subsequently affect the rates of decomposition and nutrient
cycling dynamics[34], [35]. Studies have shown that water availability is one of themain limiting factors that
largely determine community functions in sandy ecosystems. For many years, the ecological paradigm has been
that water availability is positively correlated with richness, diversity and abundance of communities[26], [36].
While in recent years, it has been reported that the rules apply to microorganisms do not necessarily hold for
microorganisms, and water availability is not directly correlated with the diversity of all organisms[26]. A broad
scale survey aiming at finding robust patterns in the structure of soil microbial showed that unlike plant
communities, which typically harbor distinct ecosystems, bacterial communities are rather similar in
composition (harboring the same dominant phyla), while differ in structure and biomass[37]. Soil pH and
available carbon could only explain the spatial variance of some bacterial phyla (Acidobacteria, β-
Proteobacteria, and Bacteroidetes), while the variance of Actinobacteria, α-Proteobacteriaand Firmicutescould
not be assigned to the soil characteristics[38].
In our study, we focused on three relatively dry environments (sandy land, sandy grassland and
restored sandy land), suggested that although bacterial abundance may relate to the water content, while
bacterial richness and diversity may not. Each site supported a unique array of OTUs, which had little in
common with the others. These observationssupport the hypothesis that spatial isolation of microbial
populations in soils is a key determinant of microbial community structure[39]. Community composition can be
correlated to an array of environmental factors. It has been suggested that different chemical components can
alter microbial richness in soils. Yet it remains to be seen which of the detected correlations will prove to be
significant to phylum diversity and composition[29].
II. Materials And Methods 2.1Field sites and conditions
Plain BlueBanner is located in southern the Inner Mongolia Autonomous Region, China, 115°00‟-
116°42‟ E, 41°56‟-43°11‟ N. Plain Blue Banner is located at the northern foot of Yinshan Mountains, composed
of low mountains and hills and Hunshandake sandy land two majorlandforms, the general topography is
characterized by the high East and low West, with an altitude of 1200-1600m. Located in the northern part of
Hunshandake sandy land is mainly the aeolian sandy grassland, accounting for 66% of the total area of the
whole banner; southern is low hill, mainly the typical steppe and meadow steppe, accounted for 34% of the total
banner. The banner is semi-arid temperate continental monsoon climate, sandstorm, drought little rain, grassland
degradation, desertification, frequent natural disasters are the main characteristics. The aeolian sandy grassland
desertification degree can be divided into four categories, non desertification sandy grassland (vegetation
coverage ≥60%), mild desertification sandy grassland (vegetation coverage 30%-60%), moderate desertification
sandy grassland (vegetation coverage 10%-30%) and severe desertification sandy grassland (vegetation
coverage <10%). In our study, we choose the non desertification sandy land (sandy grassland), the severe
desertification sandy land (sandy land) and restored desertification sandy land (restored sandy land) as our
sample sites. The selection of sampling sites was based on the vegetation coverage change in Plain Blue Banner
during 2000-2009 (Fig. 1b). In order to facilitate the description we named the sandy grassland as SG, the sandy
land as SL and the restored sandy land as RS.
2.2Soil sampling The soil sample (depth 5-20cm) was collected from SL, SG and RS in September and October 2012
(Fig. 1b). Sampling at each site was based on a spatially stratified, random sampling approach: at each site each
of the three plots was divided into equal sectors of 1 m2, and for each plot, fresh soil samples were collected
randomly from nine points. In the laboratory, the nine soilsamples of each plot were mixed and sieved (<2mm),
and then conserved at -70℃ for the next study. Soil samples from three replicate plots of each treatment were
mixed for DNA extraction.
Change of Soil Bacteria Diversity between Desertification and Restoration
DOI: 10.9790/3008-1201047487 www.iosrjournals.org 76 | Page
2.3Screening of a 16S rDNA clone library for matching sequences Total soil DNA was extracted using a SoilMasterTM DNA Extraction Kit (Epicentre, Madison, WI),
and then purified using the Soil DNA Purification Kit (Genmed Scientifics Inc.). 16S rDNA sequences were
amplified with a GeneAmp PCR System 2400 thermocycler, using 30 cycles of 94℃ for 30s, 56℃ for 30s, and
72℃ for 1min. The PCR mixtures (50μL) contained 10mM Tris-HCl (pH 8.3), 50mM KCl, 3mM MgCl2,
150mM dNTP, 30 pmol of primers 27F and 1392R (Escherichia coli 16S rDNA sequence numbering), 2.5U of
Taq DNA polymerase (Takara Bio Group), and 1μL of template DNA (approximately 100ng). To recondition
the PCR product for elimination of heteroduplexes in mixed-template PCR[40], the amplified reaction was
diluted 10-fold into a fresh reaction mixture of the same composition and cycledthree times using the parameters
specified above. The size and quality of the resulting PCR products was confirmed by agarose gel
electrophoresis (1.4% agarose). They were then cloned into the pUCm-T linear plasmid vector (Takara Bio
Group, Code D101A) and then into E. coliDH5α competent cells as specified by the manufacturer (Takara Bio
Group). After the transformants were grown overnight, single-clone colonies were picked up with sterile
toothpicks and transferred into 1.5-mL microcentrifuge tubes containing 50μL of TE buffer. The tubes were
heated for 15 min at 95℃ to lyse the cells, and then chilled on ice. Insert sequences were amplified with a
thermocycler (as above), using 25 cycles of 94℃ for 30s, 46℃ for 30s, and 72℃ for 50s. The PCR mixtures
(20μL) contained 10mM Tris-HCl (pH 8.3), 50mM KCl, 3mM MgCl2, 150mM each dNTP, 3pmol of primers
M13/pUC sequencing primer (-20) and M13/pUC reverse primer (-26), 1.0U of Taq DNA polymerase, and 1μL
of cell lysate. The vector-specific primers -20 and -26 amplified the region between the multiple cloning sites
where the amplicons should be inserted (approximately 1.5kb), identified by agarose gel electrophoresis, then
sequenced by Shanghai Sangon. Sequences were compared with the GenBank database by BLAST
searches[41]using the MEGABLAST option to identify the closest matches. All sequences were evaluated for
chimeric sequences using the NAST sequence alignment and CHECK_CHIMERA tools[42].
2.4Data analysis Sequences were aligned using CLUSTAL X[43]and imported into DNADIST in PHYLIP version
3.6[44]to generate distance matrices using the Juke-Cantor correction for multiple substitutions, and then
operational taxonomic units (OTUs) were assigned by DOTUR[45]. Unique phylotypes were defined as OTUs
with <99% 16S rDNA sequence similarity as determined by GCG BESTFIT software. To estimate species
richness, the nonparametric Chao1 estimate was calculated with log-linear-transformed confidence intervals at
95%[46]. Coverage (C) was used as a measurement of captured diversity, where C is expressed by 1-n1/N, in
which n1/N is the ratio of clones that appeared only once (n1) tothe total number of clones (N)[47]. A number of
unique phylotypes (phylotype richness, S) were used for the creation of rarefaction curves[48]. The PAST
(http://folk.uio.no/ohammer/past) was used to calculate the Simpson index = 1 -∑(ni/n)2, which measures
„evenness‟ of the community from 0 to 1 (note the confusionin the literature), where ni is the number of
individuals of taxon t. Evenness = eH/S, where S is the number of taxa. Menhinick‟s richness index, the ratio of
the number of taxa to the square root of sample size. The original data that matrixed with phylotype in row and
farming model in the columnwere Z-standardized, and then input to PAST to produce a var-covar matrix for
principal component analysis (PCA). To exclude obvious chimeric 16S rDNA primary structures before the
phylogenetic analysis[49], the „CHECK_CHIMERA‟ program of the Ribosomal Database Project
(RDP)[50]was used, and a separate treeing analysis of the terminal 400 nucleotide sequence positions at the 5‟
and 3‟ ends of the environmental 16S rDNA clones was carried out. The overall levels of similarity between 16S
rDNA sequences were determined using the appropriate tool of the ARB program package. 16S rRNA
sequences used the online alignments and analysis (http://rdp.cme.msu.edu/). In order to assess the phylogenetic
distribution and taxonomic diversity of the soil samples, sequences were classified with the Ribosomal Database
Project Classifier at 0.8 confidence threshold[8].
2.5Nucleotide sequence accession numbers All the sequences of the 16S rRNA gene clone libraries were deposited in GenBank with submissions number
grp 5213155.
III. Results 3.1 Microbial Diversity
We constructed threeclone libraries, to analyzethe composition and change of microbial flora.
Ultimately, the clone libraries amplified from the SL, SG and RS yielded472, 359, and 414 high-quality clones.
In order to compare the microbial diversity within the three samples, 16S rDNA gene sequences of the isolates
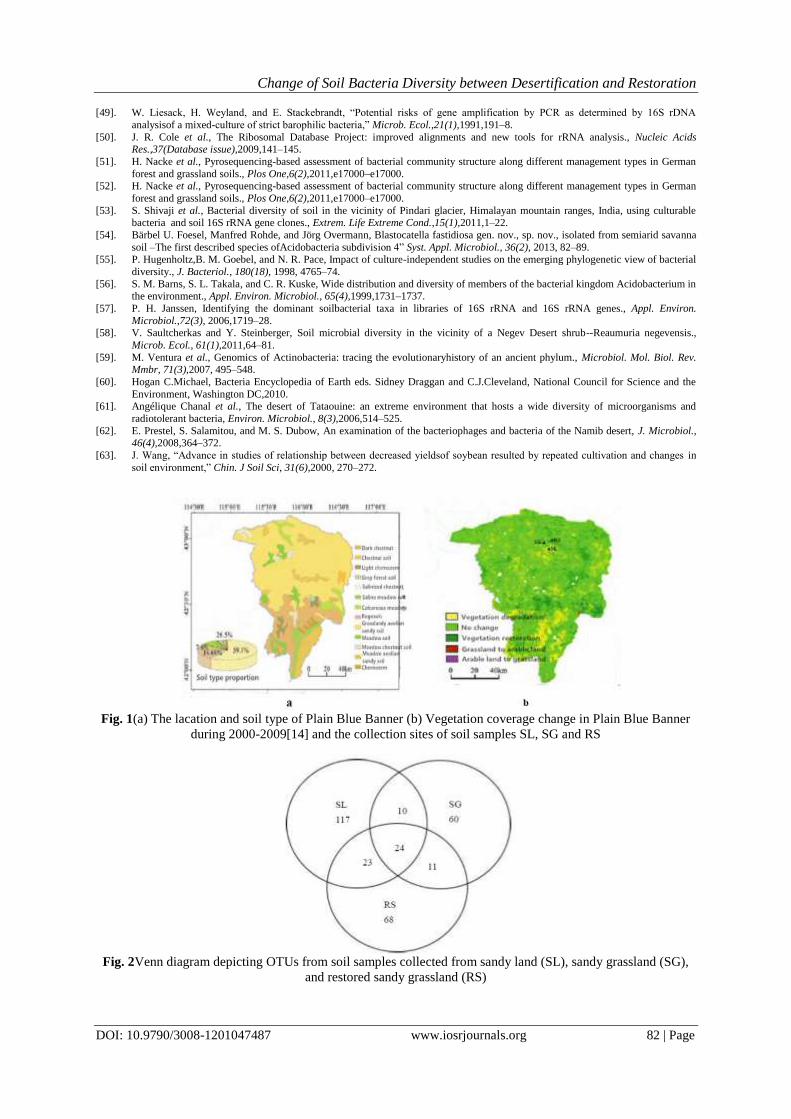
showing ≥97% sequence similarity were grouped into the same OTU, and at last yielded 174, 105and 126
OTUs0.03, respectively. A comparison of the OTUs0.03 resulted in the identification of 313 OTUs in total, with
24 common OTUs shared by the three sample sources. Fig. 2depicts a Venn diagram representing the unique
Change of Soil Bacteria Diversity between Desertification and Restoration
DOI: 10.9790/3008-1201047487 www.iosrjournals.org 77 | Page
and overlapping OTUs at the three sample sites, indicating that most of the members of the soil communities
were unique to their environment.
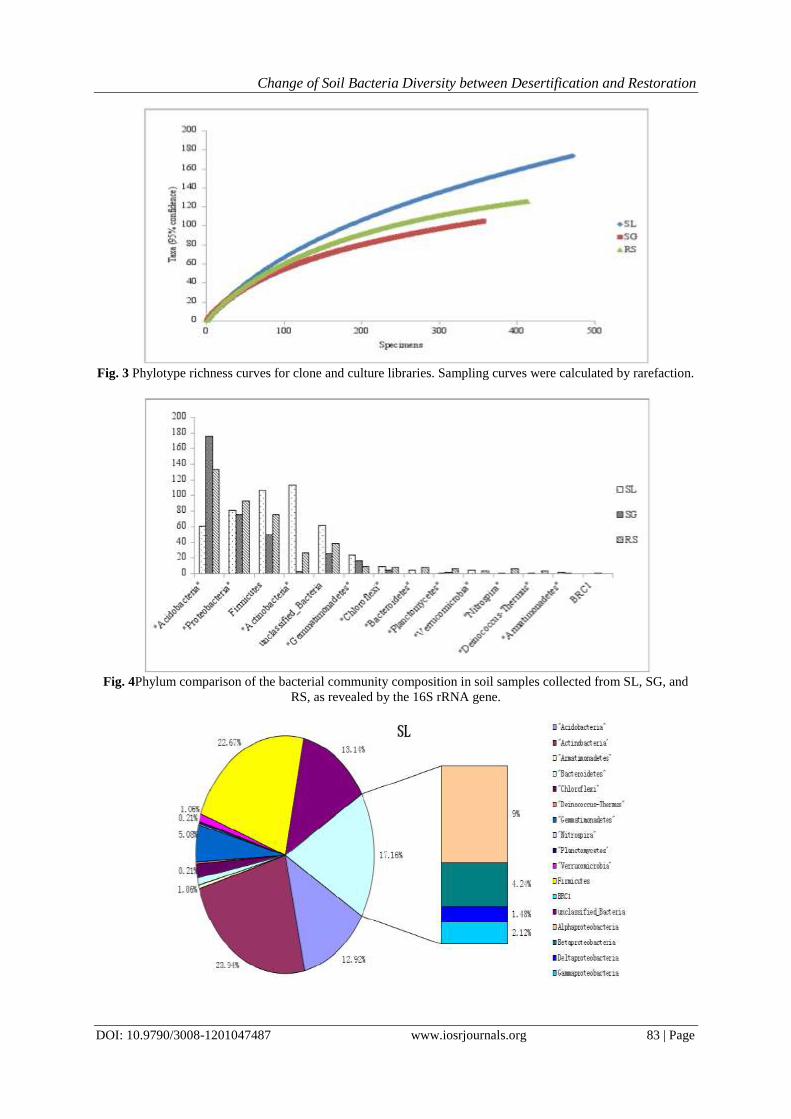
Rarefaction curves (Fig. 3) andCoverage indicated that the bacteria identified from the community
DNA extracts from the SL, SG and RS samples were sampled adequately, the number of sequenced clones from
each library was sufficient tocover the mostenvironmental microbial diversity, and thus they were analyzed
further for diversity characterization.
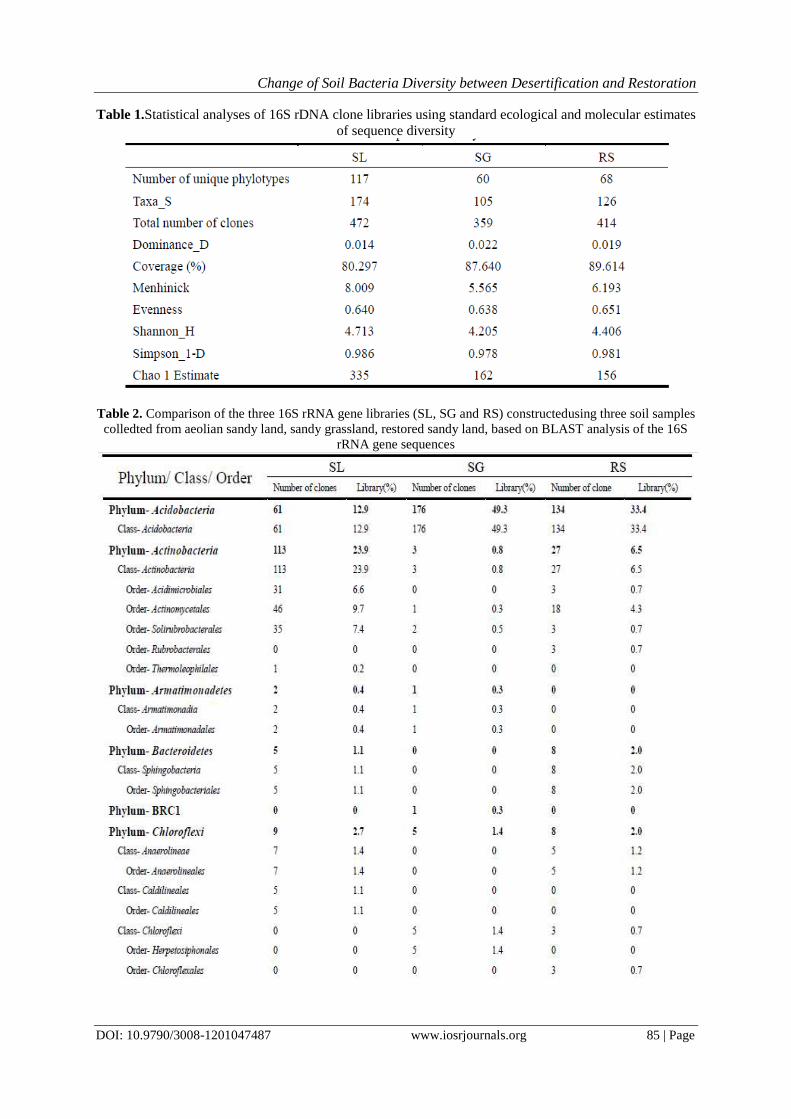
The microbial diversity appears to be differentamong the three sample sites, and SL is of the highest
species diversity and richness as deduced from Shannon index(SL>RS>SG)and Menhinick index (SL>RS>SG).
The Evenness is RS>SL>SG, it means that the population quantities were distributed non-uniformly, and RS is
tended to be more evenly distributed.From the indexes we can summarize that SL is of the highest species
diversity, abundance and dominant species, while the species evenness is at the middle level compared with RS
and SG; SG has the lowest species diversity, abundance and dominant species, besides, the species is more
unevenly distributed than others; RS is at the middle level of species diversity, abundance and dominant species,
while the species distribution is the most homogeneous.
3.2 Phylogenetic structure of microbial communities The composition of microbial communities was determined by analysis of 16S rRNA gene clone
libraries. A total of 613 partial sequences were obtained from the three clone library. These 16S rRNA
sequences were compared with sequences from reference and type strains, as well as environmental clones,
available at the GenBank and RDP II databases. Through the identification and classification of representative
sequences in each OTUs0.03, clone sequences were attributed to 14 phyla, which were shared by the three
sample sites.Fig. 4depicts the different bacterial phyla as number of all group members detected in each
sampling site. We can note that in the three sample sites the overall phylum-level composition was similar and
the Acidobacteria occupiedthe largest proportion, then followed by Proteobacteria, Firmicutes and
Actinobacteria. The four phyla were the most predominant of the total clones. Verrucomicrobia, Chloroflexi,
Gemmatiomonadetes, Bacteroidetes, Planctomycetes, Nitrospira, Deinococcus-Thermus and Armatimonadetes
were present in one or two libraries but the frequency of distribution was truncated. These observations are in
accord with some other earlier studies[51]–[53].
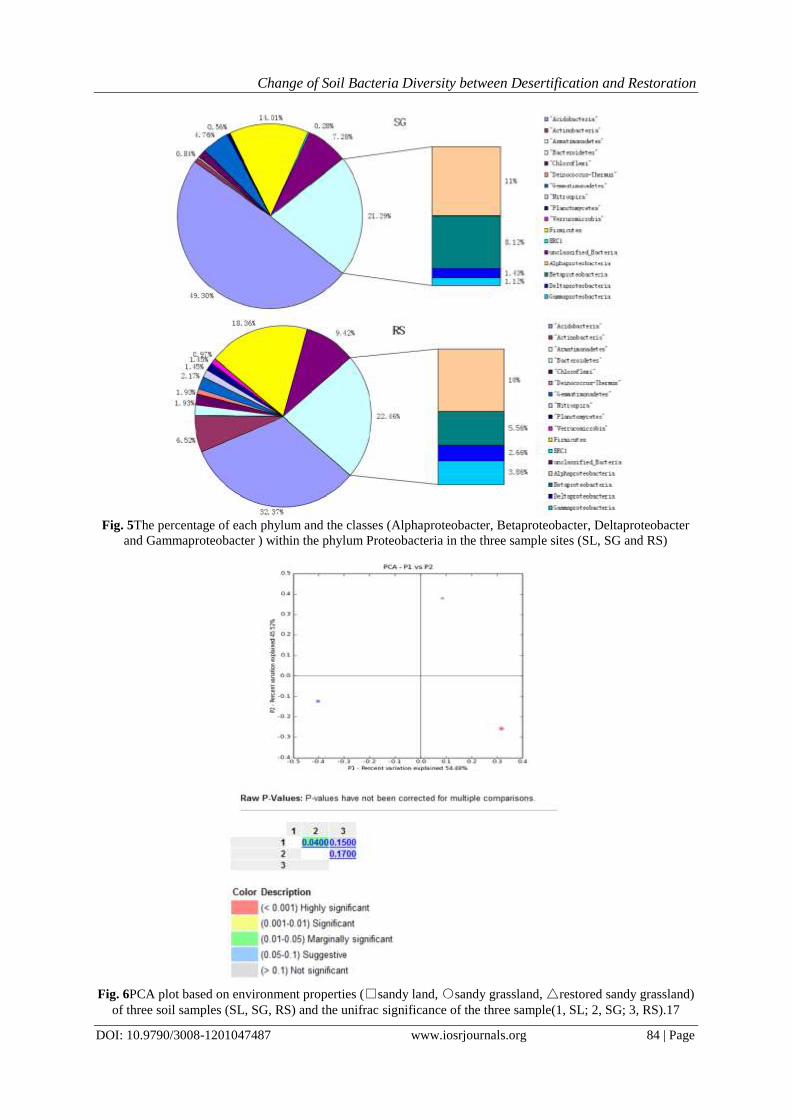
There are great differences in phyla abundance between different soil samples. Fig. 5 showed the
percentage of each phylum in the three soil samples. In SL, it was dominated by Actinobacteria(23.94%), then
followed by Firmicutes(22.67%) and Proteobacteria(17.16%). In SG, the most abundant phylum is
Acidobacteria, accounting for almost 49.30%, then followed by Proteobacteria(21.29%) and
Firmicutes(14.01%). In RS, the Acidobacteria is also the most abundant, but the proportion has been reduced to
32.37%, then followed by Proteobacteria(22.46%) and Firmicutes(18.36%). In phylum Proteobacteria, there
are four classes, Alpha-, Beta-,Delta-and Gammaproteobacteria, from the figure we can see that the percentage
of Alphaproteobacteria is almost the same in three sample sites, while Betaproteobacteria is highest in SG and
nearly twice the percentage than in SL and RS. The percentage of Deta-and Gammaproteobacteria is most high
in RS, then is SL and SG.
IV. Discussion The formation of aeolian sandy soil can be roughly divided into three stages: aeolian sandy soil stage
(Sandy parent material contains a certain amount of nutrients and moisture, provides conditions for sand
vanguard plant to grow, but because of the wind erosion and mobile, growth is very sparse, and coverage is less
than 10%), semi fixed aeolian sandy soil stage (plant coverage often between 10%~30%, wind erosion
weakened,and showed some characteristics of soil formation), and fixed aeolian sandy soil stage (plant coverage
is more than 30%, in additionto the sand plant, there are some zonality plant components, raw soil pedogenesis
is significantly). With the development of fixed aeolian sandy soil it may form the corresponding zonal soil.
In the process of aeolian sandy soil reserved to fixed aeolian sandy soil, environment,pioneer plant and
microorganisms may play important roles. Soil microorganism has a broad ecological adaptation to the desert
area of extreme environment, a lot of drought or high temperature resistant microbial species can change the
sand surface physicochemical properties through the physiological and metabolic activities, and play a positive
role inthe formation of soil and the process of plant nutrition transformation. Microorganism is conductive to the
growth of plants, and thus lay the foundation of transforming moving dune to fixed or semi fixed dune. At the
same time, the composition, quantity and distribution of soil microorganism can be influenced by the physical
and chemical properties of soil, sand dune fixation duration, soil layer, sand layer depth, season, vegetation and
other factors, thus showing a certain amount, composition and distribution change regulation.Our purpose is to
find the microorganisms which may play a critical role in the restoration of sandy land, and thus can provide
some theoretical basis for the comprehensive treatment of sandy land.
4.1 The Phylum Level Analysis
Change of Soil Bacteria Diversity between Desertification and Restoration
DOI: 10.9790/3008-1201047487 www.iosrjournals.org 78 | Page
From these data showed above we can find that the distribution of different kinds of microbes in the
three sample plots is of major difference. Acidobacteria, Actinobacteria, Proteobacteria and Firmicutes all
emerged in the three plots, and occupied a large proportion, except them, Chloroflexi, Gemmatimonadetes and
Nitrospira also found in those plots. Although the seven biological groups shared by the three sample, the gap in
their number is great. Phyla present in the SL and RS sample but absent in the SG sample including
Bacterdidetes, Deinococcus-Thermus, Nitrospira and Verrucomicrobia. Only one phylum Armatimonadetes was
shared by SL and SG. No phylum was found only shared by SG and RS. BRC1 was only found in SG.
Acidobacteria is a newly separated phylum,and is categorized as acidophilic bacteria. Acidobacteria
represents abundant members of soil microbial communities but only few representatives could be isolated and
validly described so far[54]. Culture-independent studies indicate that the diversity ofthe phylum Acidobacteria
is nearly as great as the diversity of the phylum Proteobacteria[55], and currently comprise 26 phylo-genetically
distinct subdivisions[56]. In 16S rRNA gene libraries, they constitute an average fraction of 20% that are only
surpassed by Proteobacteria[57]. The Acidobacteria is one of the most common bacteria in the soil samples,
prefer low pH(3.5~4.5) and use glucose as one of the most favorable substrates[58]. Acidobacteria plays an
important role in the ecosystem, especially in soil. There is a significant increase in SG and RS compared with
SL, the reason maybe that the soil pH in SG and RS is lower than SL and thus provide a suitable environment
for the Acidobacteria to grow. Soil pH is affected by many factors, such as the climate, topography, soil parent
material, vegetation, etc. The vegetation effect on soil pH is mainly due to plant roots had selective absorption
of ions. In addition, soil microbial activity also has a great effect on soil pH, because some kind of microbecan
decompose organic or inorganic compounds in soil, and microorganism itself may secreted some substances,
thus causing the change in soil pH.
Actinobacteria is knew for its ability of surviving under adverse conditions. Actinobacteriaall believed
to have high guanine and cytosine content in their DNA[59], and it is one of the dominant bacterial phyla and
contains one of the largest bacterial genera, Streptomyces[60]. Actinobacteria plays an important role in the
decomposition of organic matter and the antagonism of plant pathogens, thus, a reduction of their group and
proportion in soil may lead to an increase in the number of pathogens, as well as a reduction of effective
nutrients. And the phylum abundance was positively correlated with nitrate and magnesium, but negatively
correlated with phosphorus. In general, Actinobacteria is especially abundant in the soil which is relatively dry,
neutral to alkaline and containing a number of organic substances. However, compared with SG and RS, our
results revealed an outstanding high abundance in SL. This is likely because although SL soil organic matter
content is not very high, but SL have a low water content, and the soil pH is more close to neutral and alkaline,
thus resulting in the high content in SL.
Change regulation of Firmicutes in the three sample sites is almost the same in comparison with
Actionbacteria. According to Fierer N, the phylum Firmicutesis correlated negatively with soil moisture[38],
and was abundant in the deserts[61], [62]. And most of the Firmicutes are capable of forming drought-
withstanding spores, this makes them able to survive in arid and hot environments. Besides, the research[57],
[63]indicate that SL can lead to the loss of soil moisture. These may be the reasons that Firmicutes significantly
more abundant in SL than in SG and RS.
All Proteobacteria are Gram-negative, with an outer membrane mainly composed of
lipopolysaccharides. Proteobacteria can divide into six sections, including Alpha-, Beta-, Gamma-, Delta-,
Epsilon-, andAcidithiobacillia. They include a wide variety of pathogens, such as Escherichia, Helicobacter,
Salmonella, Vibrio, and many other notable genera. Others are free-living (non-parasitic) bacteria, including
many of the bacteria which are responsible for nitrogen fixation. There is also a wide variety type ofmetabolism.
Most of them are facultatively or obligatelyanaerobic, chemoautotrophs, and heterotrophic, but there are also
exceptions, such as purple bacteria. From Fig. 3 we can see that Proteobacteria were not significantly changed
in the three sites, although an increasing trend was detected in the RS sample in comparison with SG and SL. In
the three samples, we only found four classes (Alpha-, Beta-, Gamma-and Deltaproteobacteria), but there is a
large difference between the four classes shared in each sample.
Other phyla Chloroflexi, Bacteroidetes, Gemmatimonadetes, Planctomycetes, verrucomicrobia,
Nitrospira, Deinococcus-Thermus, BRC1 and Armatimonadetes were not significantly abundant in any of the
sample sites, and Bacteroidetes, verrucomicrobia, Nitrospira and Deinococcus-Thermus only find in SL and RS.
This is likely due to RS is the result of partial recovery of SL, and there is still a certain gap compared with SG,
though RS and SG are all sandy grassland, thus it is normal for some microbial species only exist in SL and RS.
In addition, SG ecological system has stabilized to some extent, the composition of microbial communities tend
to be relatively fixed, while SL and RS are still in the development and change stage of the environment,
microbial composition has to change to adapt to the continuous development of environment and soil
conditions.
In spite of the great bacterial diversity frequently found in soils, it is possible to recognize a certain
pattern regarding the contribution of each phylum. The great majority of clones are usually affiliated to nine
Change of Soil Bacteria Diversity between Desertification and Restoration
DOI: 10.9790/3008-1201047487 www.iosrjournals.org 79 | Page
major bacterial phyla and generating stability in the community structure to a certain extent. According to
Janssen[57], dominant phyla usually correspond to approximately 92% of the libraries, being Acidobacteria and
Proteobacteria the most abundant ones, while Actinobacteria would only occupy 13% of total clones. In our
study, phylogenetic analysis of the bacterial community of the threesample sites showed a different distribution
compared with the general pattern. In SL, Actinobacteria and Firmicutes occupied nearly half of the library,
while Proteobacteria and Acidobacteria represented only 17.6% and 13.1%, respectively. In SG, Acidobacteria
had a contribution of almost half of the library, Proteobacteria, Firmicutes and Actinobacteria represented only
21.6%, 14.0% and 0.8%, respectively. In RS, Acidobacteria and Proteobacteria occupied more than half of the
library, while Firmicutes and Actinobacteria represented only 17.1% and 6.5%, respectively.
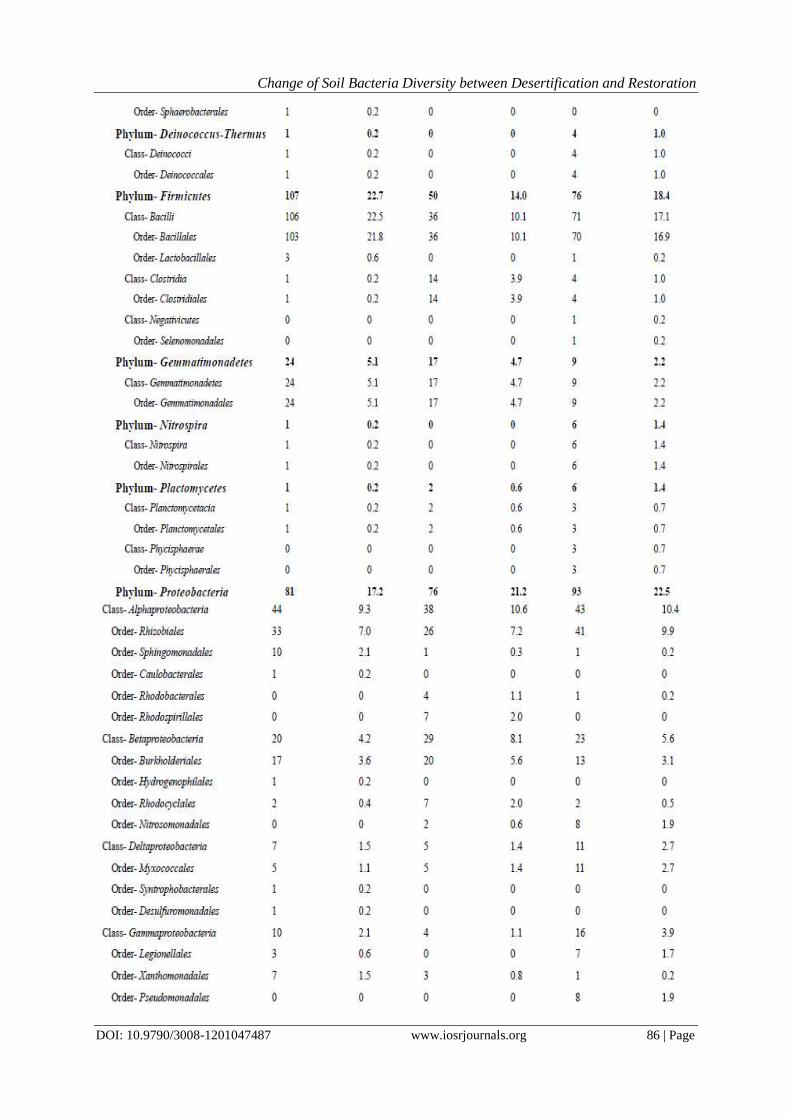
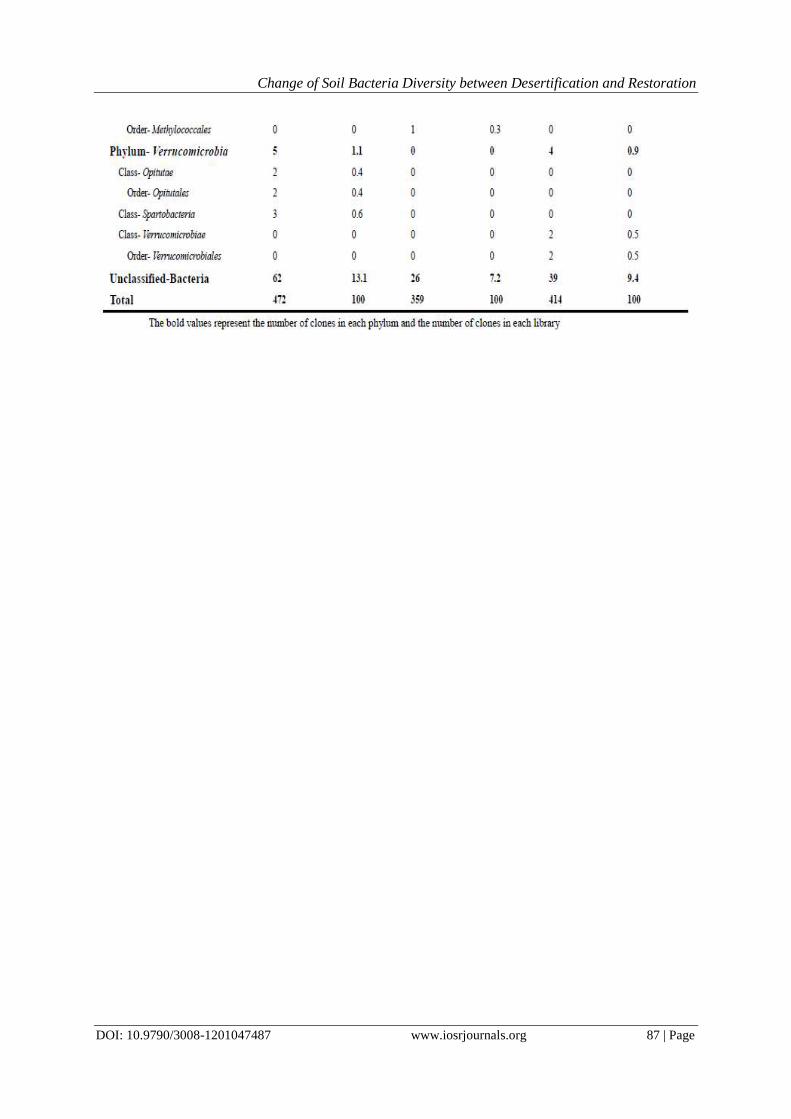
4.2 The microbial change regulation Table 2 showed the comparison of microorganisms in each library at the phylum, class and order level.
From the figure we can roughly compare the changes between three sample sites, here we compared the changes
from SG to SL and from SL to RS, our purpose is to find the possible key microbial groups in the change of soil
sample sites from sandy grassland to sandy land and from sandy land to restored sandy land.
Changes from SG to SL. From table 2 we can easily find Acidobacteria has a great decrease in the
percentage of each library(from 49.3% to 12.9%), and a great increase in Actinobacteria (from 0.8% to 23.9%).
In Actinobacteria, we only find one class Actinobacteria, and the orders Acidimicrobiales, Actinomycetales and
Solirubrobacterals increased greatly from SG to SL. The phylum Firmutes also has an increase in SL (from
14.0% to 22.7%) compared with SG. But in Firmutes, only class Bacilli increased from 10.1% to 22.4%, and the
main orders are Bacillales(from 10.1% to 21.8%) and Lactobacillales (from 0 to 0.6%), while the class
Clostridia dropped greatly from 3.9% to 0.2%. In phylum Proteobacteria, though the clone number increased in
SL compared with SG, the percentage has decreased from 21.2% to 17.2%, and among the four classes
contained in this phylum, Alpha-and Betaproteobacteria decreased greatly, while Delta-and
Gammaproteobacteria increased to some extent. In phylum Chloroflexi, there is an increasein SL compared
with SG (from 1.4% to 2.7%), and three classes Anaerolineae, Caldilineales and Thermomicrobia only find in
SL, and Chloroflexi only find in SG. There are four phyla increased slightly and only find in SL compared with
SG, including Bacteroidetes, Deinococcus-Thermus, Nitrospira and Verrucomicrobia. Armatimonadetes and
Gemmatimonadetes also increased in SL compared with SG (from 0.3% to 0.4% and 4.7% to 5.1%,
respectively), while Plactomycetes decreased from 0.6% to 0.2%. Besides, BRC1 only find one clone and
belonged to SG. Here we can see, in the change procession from SG to SL, except the percentage of phylum
Acidobacteria, Plactomycetes and the class Clostridia decreased, others are all increased in some degree.
Changes from SL to RS. Compared the change tendency with SL to SG, the changes in SL to RS are almost the
same in phylum Acidobacteria, Actinobacteria, Armatimonadetes, Chloroflexi, Firmicutes,
Gemmatimonadetes,Plactomycetes, Verrucomicrobia and Proteobacteria, except the phylum Bacteroidetes,
Deinococcus-Thermus and Nitrospira. In the last three phyla (Bacteroidetes, Deinococcus-Thermus and
Nitrospira), there is an increasing tendency in RS compared with SL, which is opposite with the change from
SL to SG. Besides, the last three phyla only exist in SL and RS, while absent in SG. Although the total change
tendency is almost the same, there still exist some differences. In Proteobacteria, Delta-and
Gammaproteobacteria increased from SL to RS, while decreased from SL to SG.
Comparingthe three sample sites together, the overall phylum-level composition was similar between
SG and RS locations and dominated by Acidobacteria, followed by Proteobacteria, Firmicutes, and
Actinobacteria. SL was dominated by Actinobacteria, followed by Firmicutes, Proteobacteria and
Acidobacteria, which are exactly the backwards of the order of SG and RS.
Considering the data above, we can summarize that only Acidobacteria and Proteobacteria increased
in SG and RS compared with SL, while Firmicutes and Actinobacteria decreased greatly in SG and RS. The
four phyla may play the key role in soil development from SG degenerated to SL and SL restored to RS. And
thus the increase of Acidobacteria and Proteobacteria and the decrease of Firmicutes and Actinobacteria may
help sandy land restored to arable sandy grassland. Besides, we infer that microbes increased obviously in RS
compared with SL and RS, or the microbes only exist in RS may play more important roles in the recovery of
sandy land to sandy grassland. Here we find some microbes in order level may perform this function, including
Rubrobacterales, Sphingobacteriales, Chloroflexales, Deinococcales, Selenomonadales, Nitrospirales,
Phycisphaerales, Nitrosomonadales, Legionellales, Pseudomonadales and Verrucomicrobiales.
4.3 The genus level analysis Results showed that, 613 sequences were identified to 123 different bacterial genera, and there are 73 genera
contained in SL, 48 genera in SG, and 69 genera in RS. There are 17 genera shared by three sample sites, 21
genera shared by SL and RS, 6 genera shared by SL and SG, and 6 genera shared by SG and RS, besides, there
are 29 genera only belonged to SL, 32 genera only belonged to SG and only 25 genera only belonged to RS. SL
Change of Soil Bacteria Diversity between Desertification and Restoration
DOI: 10.9790/3008-1201047487 www.iosrjournals.org 80 | Page
is of the highest microbial diversity, then followed by RS and SG. Though the clone number of common genus
in SL and RS is not very high, there is an interesting phenomenon, that is compared with the common genera
shared by SL and SG, as well as SG and RS, there are more genus shared by SL and RS. SL is the representative
of aeolian sandy soil, while SG and RS are the representative of developed aeolian sandy soil, theoretically, due
to the similarity of the environment, the microbial diversity in SG and RS should be more similar, however, the
common genera are more shared in SL and RS, the reason may be that in the changing progress from SL to RS,
part of the microbial species have good adaptability to environment, and result in part of the microorganisms in
SL can still survive in RS. Besides, RSmay not fully restore to the stage as SG, and there may exist some
transition types of microorganisms in RS, when RS developed further, the type and composition of
microorganisms are likely to be closer to SG. And this phenomenon has already can be seen from the analysis
before that comparing the three sample sites together, the overall phylum-level composition was more similar
between SG and RS.
There are some genera only exist in RS, we guess that they may appear in the stage of SL recover to
RS, while disappeared when RS totally recovered to the stage of SG. These genera may play an important role
in the recovery of sandy land, including Bryobacter, Holophaga, Terriglobus, Amycolatopsis,
Propionibacterium, Rubrobacter, Streptosporangium, Rhodocytophaga, Bellilinea, Blastopirellula, Gemmata,
Verrucomicrobium, Exiguobacterium, Robinsoniella, Sporacetigenium, Staphylococcus, Devosia, Rhodoplanes,
Delftia, Geoalkalibacter, Kofleria, Sorangium, Acinetobacter, Aquicella and Arenimonas. Besides the genera
only belonged to RS and SG may also have this function, just including Gp7, Pedomicrobium,
Rubellimicrobium and Massilia.
A meta-analysis of soil bacteria across seven of the major biomes on earth revealed that all biomes are
dominated by the same soil bacterialphylum (Acidobacteria, Actinobacteria, Proteobacteria, and Firmicutes).
Yet, although distinct biomes harbored similar bacterial communities, the composition of the bacterial
communities varied and could be explained mostly by soil conditions. From Fig. 6we can see that the first two
variation can explain 100% of variance, and from the unifrac significance we can find that the SL and SG
sample‟s environment is of marginally significant difference, but the SG and RS sample are not of great
significance.
V. Conclusion The aeoliansandy land(SL) hasthe highest species diversity and richness as deduced from Shannon
indexand Menhinick index, while the microbial distribution is most homogeneous in restored sandy (RS) land
and most inhomogeneous in sandy grassland (SG) as deduced from Evenness index.
Acidobacteria,Proteobacteria, Actinobacteria and Firmicutes were among the highly abundant taxonomic
groups present across the three sample sites and were designated as the core phyla. Acidobacteria were
dominantin SG(49.8%) and RS (32.4%), while Actinobacteria (23.9%) and Firmicutes (22.6%) were dominant
in SL. Although the overall microbial composition was more similar between SG and RS, there are more
common genus shared by SL and RS. Besides, compared with SL, only Acidobacteria and Proteobacteria
increased, Firmicutes and Actinobacteria decreased greatly in SG and RS. We try to explain the
microorganisms‟ function in the progress of desertification and restoration, and to provide a theoretical basis for
the recovery of aeolian sandy land.
Acknowledgements The work was supported by the National Natural Science Foundation of China (No.30970010)and
Bioengineering key disciplineof HebeiProvince.
References [1]. S. M. Herrmann and C. F. Hutchinson, The changing contextsof the desertification debate,J. Arid Environ., 63(3), 2005,538–555.
[2]. R. Lal, Potential of Desertification Control to Sequester Carbon and Mitigate the Greenhouse Effect,Clim. Change,51(1),2001,35–72.
[3]. N. S. F. S. D. London and N. Unep, United Nations Convention to Combat Desertification in Countries Experiencing Serious
Drought and/or Desertification, particularly in Africa,1994. [4]. E. Michael, S. Leslie, and T. Naphtali, The Negev: the challenge of a desert [Israel]. 2nd ed(the United States of America,Harvard
University Press,1982).
[5]. W. G. Whitford and E. L. Wade, Ecology of desert systems,J. Mammal., 2002(3),1122. [6]. I. Noy-Meir, Desert Ecosystems: Higher Trophic Levels,Ecol. Evol. Syst.,5(5),1974,195–214.
[7]. W. Tao, Progress in sandy desertification research of China,J. Geogr. Sci.,14(4), 2004, 387–400.
[8]. Q. Wang, G. M. Garrity,J. M. Tiedje, and J. R. Cole, Naïve Bayesian Classifier for Rapid Assignment of rRNA Sequences into the New Bacterial Taxonomy,Appl. Environ. Microbiol., 73(16),2007, 5261–7.
[9]. T. H. Zhang et al., A comparison of different measures for stabilizing moving sand dunes in the Horqin Sandy Land of Inner
Mongolia, China.,J. Arid Environ., 58(2), 2004, 203–214. [10]. C. J. Tucker and W. W. Newcomb, Expansion and contraction of the sahara desert from 1980 to 1990.,Science, 253(5017),
1991,299–300.
Change of Soil Bacteria Diversity between Desertification and Restoration
DOI: 10.9790/3008-1201047487 www.iosrjournals.org 81 | Page
[11]. C.F. Hutchinson, S.M. Herrmann, T. Maukonen, and J. Weber, Introduction: The „Greening‟ of the Sahel,J. Arid Environ.,
63(3),2005,535–537.
[12]. S. Nicholson, On the question of the „recovery‟ of the rains in the West African Sahel.,J. Arid Environ.,63(3),2005,615–641. [13]. L. Olsson, L. Eklundh, and J. Ardoe, A Recent Greening of the Sahel: Trends,Patterns and Potential Causes, J. Arid Environ.,
63(3),2005,556–566.
[14]. M. A. Na, H. U. Yun-Feng, D. F. Zhuang, and X. L. Zhang, Vegetation Coverage Distribution and Its Changes in Plan Blue Banner Based on Remote Sensing Data and Dimidiate Pixel Model, Sci. Geogr. Sin., 32(2),2012, 251-156.
[15]. W. Liang,X. Wu, S. Zhang, and Y. Xing, Effect of organic amendments on soil water storage in the aeoliansandy land of northeast
China, Chinese Academy of Sci, 2011,1538–1540. [16]. H. C. Duan, T. Wang, X. Xue, S. L. Liu, and J. Guo, Dynamics of aeolian desertification and its driving forces in the Horqin Sandy
Land, Northern China.,Environ. Monit. Assess., 186(10),2014,6083–96.
[17]. S. Liu and W. Tao, Aeolian desertification from the mid-1970s to 2005 in Otindag Sandy Land, Northern China, Environ. Geol., 51(6),2007,1057–1064.
[18]. J. Rombke and A. M. Breure, Status and outlook of ecological soil classification and assessment concepts,Ecotoxicol. Environ. Saf.,
62(2),2005,300-308. [19]. P. Nannipieri, J. Ascher, M. T. Ceccherini, L. Landi, G. Pietramellara, and G. Renella, Microbial diversity and soil functions, Eur.
J. Soil Sci.,54(4),2003,655–670.
[20]. J. M. Lynch et al., Microbial diversity in soil: ecological theories, the contribution of molecular techniques and the impact of transgenic plants and transgenic microorganisms., Biol. Fertil. Soils, 40(6),2004,363–385.
[21]. C. E. Prescott, Do rates of litter decomposition tell us anything we really need to know?,For. Ecol. Manag., 220(1-3), 2005,66–74.
[22]. R. Angel, M. I. M. Soares, E. D. Ungar, and O. Gillor, Biogeography of soil archaea and bacteria along a steep precipitation gradient, Isme J.,4(4), 2010,553–63.
[23]. A. Bachar et al., Soil microbial abundance and diversity alonga low precipitation gradient., Microb. Ecol.,60(2), 2010,453–61.
[24]. D. A. Heemsbergen, M. P. Berg, M. Loreau, J. R. van Hal, J. H. Faber, and H. A. Verhoef, Biodiversity effects on soil processes explained by interspecific functional dissimilarity., Science, 306(5698),2004,1019–20.
[25]. X. L. Wang, X. Zhang, Y. F. Zhou, and D. U. Yan-Long, An Analysis on Diversity of MicrobialCommunity Function in
Desert,Bull. Soil Water Conserv.,32(3),2012,91-95. [26]. N. Fierer and R. B. Jackson, The diversity and biogeography of soil bacterial communities.,Proc. Natl. Acad. Sci. U. S. A., 103(3),
626–31.
[27]. C. R. Kuske,S. M. Barns, and J. D. Busch, Diverse uncultivated bacterial groups from soils of the arid southwestern United States that are present in many geographic regions.,Appl. Environ. Microbiol., 63(9),1997,3614–21.
[28]. J. Borneman and E. W. Triplett, Molecular microbial diversity in soils from eastern Amazonia: evidence for unusual
microorganisms and microbial population shifts associated with deforestation.,Appl. Environ. Microbiol.,63(7), 1997,2647–2653. [29]. J. Zhou, B. Xia, H. Huang, A.V. Palumbo, and J. M. Tiedje, Microbial Diversity and Heterogeneity in Sandy Subsurface Soils,
Appl. Environ. Microbiol., 70(3), 2004,1723–34.
[30]. O. C. Chan et al., 16S rRNA gene analyses of bacterial community structuresin the soils of evergreen broad-leaved forests in south-west China., FEMS Microbiol. Ecol.,58(2),2006, 247–259.
[31]. [31]W. Ludwig et al., Detection and in situ identification of representatives of a widely distributed new bacterial phylum, FEMS Microbiol. Lett.,153(1),1997,181–190.
[32]. [32]E. Stackebrandt,W. Liesack, and B. M. Goebel, Bacterial diversity in a soil sample from a subtropical Australian environment
as determined by 16S rDNA analysis., Faseb J.,7(1), 1993,232–236. [33]. C. Bell, N. Mcintyre, S. Cox, D. Tissue,and J. Zak, Soil Microbial Responses to Temporal Variations of Moisture and Temperature
ina Chihuahuan Desert Grassland,Microb. Ecol.,56(1),2008,153–167.
[34]. K. Kloos, U. M. Hüsgen, and H. Bothe, DNA-probing for genes coding for denitrification, N2, Z. Für Naturforschung C J. Biosci.,53(1-2), 1998,69–81.
[35]. R. I. Griffiths, A. S. Whiteley, A. G. O‟Donnell, and M. J. Bailey, Influence of depth and sampling time on bacterial community
structure in an upland grassland soil, FEMS Microbiol. Ecol.,43(1), 2003, 35–43. [36]. B. A. Hawkins and J. R. G. Turner, Energy, Water, and Broad-Scale Geographic Patterns of Species Richness,Ecology,
84(12),3105–3117.
[37]. N. Fierer, M. S. Strickland, D. Liptzin, M. A. Bradford, and C. C. Cleveland,Global patterns in belowground communities., Ecol. Lett., 12(11),2009,1238–49.
[38]. N. Fierer, M. A. Bradford, and R. B. Jackson, TOWARD AN ECOLOGICAL CLASSIFICATION OF SOIL BACTERIA,
Ecology,88(6),2007, 1354–64. [39]. D. S. Treves, B. Xia, J. Zhou, and J. M. Tiedje, A two-species test of the hypothesis that spatial isolation influences microbial
diversity in soil,Microb. Ecol., 45(1), 2003,20–28.
[40]. J. R. Thompson, L.A. Marcelino, and M. F. Polz, Heteroduplexes in mixed-template amplifications: formation, consequence and elimination by „reconditioning PCR‟.,Nucleic Acids Res.,30(9),2002,2083–8.
[41]. S. F. Altschul et al., Gapped BLAST and PSI-BLAST: a new generation of protein database search programs., Nucleic Acids
Res.,25(17), 1997,3389–402. [42]. T. Z. Desantis et al., Greengenes: Chimera-checked 16S rRNA gene database and workbenchcompatible in ARB, Appl. Environ.
Microbiol.,72(72),2006,5069–5072.
[43]. J. D. Thompson, T. J. Gibson, F. Plewniak, F. Jeanmougin, and D. G. Higgins, The ClustalX windows interface: flexible strategies for multiple sequence alignment aided by quality analysis tools. Nucleic Acids Res,Nucleic Acids Res.,25(25),1997,4876–82.
[44]. J. Felsenstein, PHYLIP (Phylogeny Inference Package) version 3.6. Distributed by the author. Department of Genome Sciences,
University of Washington, Seattle.,2005. [45]. P.D. Schloss and J. Handelsman, Introducing DOTUR, a computer program for defining operational taxonomic units and estimating
species richness., Appl. Environ. Microbiol.,71(3), 2005,1501–1506.
[46]. B. JENNIFER and Hughes, Counting the Uncountable: Statistical Approaches to Estimating Microbial Diversity, Appl. Environ. Microbiol.,67(10),2001, 4399–4406.
[47]. M. K. Chelius and E. W. Triplett, The Diversity of Archaea and Bacteria in Association with the Roots of Zea mays L., Microb.
Ecol., 41(3),2001,252–263.12 [48]. Simberloff D. 1978. Use of rarefaction and related methods in ecology. Biological Data in Water Pollution Assessment:
Quantitative and Statistical Analyses (DicksonKL, Cairns JJ & Livingston RJ, eds). American Society for Testing and Materials,
West Conshohocken, 1978, 150-165.
Change of Soil Bacteria Diversity between Desertification and Restoration
DOI: 10.9790/3008-1201047487 www.iosrjournals.org 82 | Page
[49]. W. Liesack, H. Weyland, and E. Stackebrandt, “Potential risks of gene amplification by PCR as determined by 16S rDNA
analysisof a mixed-culture of strict barophilic bacteria,” Microb. Ecol.,21(1),1991,191–8.
[50]. J. R. Cole et al., The Ribosomal Database Project: improved alignments and new tools for rRNA analysis., Nucleic Acids Res.,37(Database issue),2009,141–145.
[51]. H. Nacke et al., Pyrosequencing-based assessment of bacterial community structure along different management types in German
forest and grassland soils., Plos One,6(2),2011,e17000–e17000. [52]. H. Nacke et al., Pyrosequencing-based assessment of bacterial community structure along different management types in German
forest and grassland soils., Plos One,6(2),2011,e17000–e17000.
[53]. S. Shivaji et al., Bacterial diversity of soil in the vicinity of Pindari glacier, Himalayan mountain ranges, India, using culturable bacteria and soil 16S rRNA gene clones., Extrem. Life Extreme Cond.,15(1),2011,1–22.
[54]. Bärbel U. Foesel, Manfred Rohde, and Jörg Overmann, Blastocatella fastidiosa gen. nov., sp. nov., isolated from semiarid savanna
soil –The first described species ofAcidobacteria subdivision 4” Syst. Appl. Microbiol., 36(2), 2013, 82–89. [55]. P. Hugenholtz,B. M. Goebel, and N. R. Pace, Impact of culture-independent studies on the emerging phylogenetic view of bacterial
diversity., J. Bacteriol., 180(18), 1998, 4765–74.
[56]. S. M. Barns, S. L. Takala, and C. R. Kuske, Wide distribution and diversity of members of the bacterial kingdom Acidobacterium in the environment., Appl. Environ. Microbiol., 65(4),1999,1731–1737.
[57]. P. H. Janssen, Identifying the dominant soilbacterial taxa in libraries of 16S rRNA and 16S rRNA genes., Appl. Environ.
Microbiol.,72(3), 2006,1719–28. [58]. V. Saultcherkas and Y. Steinberger, Soil microbial diversity in the vicinity of a Negev Desert shrub--Reaumuria negevensis.,
Microb. Ecol., 61(1),2011,64–81.
[59]. M. Ventura et al., Genomics of Actinobacteria: tracing the evolutionaryhistory of an ancient phylum., Microbiol. Mol. Biol. Rev. Mmbr, 71(3),2007, 495–548.
[60]. Hogan C.Michael, Bacteria Encyclopedia of Earth eds. Sidney Draggan and C.J.Cleveland, National Council for Science and the
Environment, Washington DC,2010. [61]. Angélique Chanal et al., The desert of Tataouine: an extreme environment that hosts a wide diversity of microorganisms and
radiotolerant bacteria, Environ. Microbiol., 8(3),2006,514–525.
[62]. E. Prestel, S. Salamitou, and M. S. Dubow, An examination of the bacteriophages and bacteria of the Namib desert, J. Microbiol., 46(4),2008,364–372.
[63]. J. Wang, “Advance in studies of relationship between decreased yieldsof soybean resulted by repeated cultivation and changes in
soil environment,” Chin. J Soil Sci, 31(6),2000, 270–272.
Fig. 1(a) The lacation and soil type of Plain Blue Banner (b) Vegetation coverage change in Plain Blue Banner
during 2000-2009[14] and the collection sites of soil samples SL, SG and RS
Fig. 2Venn diagram depicting OTUs from soil samples collected from sandy land (SL), sandy grassland (SG),
and restored sandy grassland (RS)
Change of Soil Bacteria Diversity between Desertification and Restoration
DOI: 10.9790/3008-1201047487 www.iosrjournals.org 83 | Page
Fig. 3 Phylotype richness curves for clone and culture libraries. Sampling curves were calculated by rarefaction.
Fig. 4Phylum comparison of the bacterial community composition in soil samples collected from SL, SG, and
RS, as revealed by the 16S rRNA gene.
Change of Soil Bacteria Diversity between Desertification and Restoration
DOI: 10.9790/3008-1201047487 www.iosrjournals.org 84 | Page
Fig. 5The percentage of each phylum and the classes (Alphaproteobacter, Betaproteobacter, Deltaproteobacter
and Gammaproteobacter ) within the phylum Proteobacteria in the three sample sites (SL, SG and RS)
Fig. 6PCA plot based on environment properties (□sandy land, ○sandy grassland, △restored sandy grassland)
of three soil samples (SL, SG, RS) and the unifrac significance of the three sample(1, SL; 2, SG; 3, RS).17
Change of Soil Bacteria Diversity between Desertification and Restoration
DOI: 10.9790/3008-1201047487 www.iosrjournals.org 85 | Page
Table 1.Statistical analyses of 16S rDNA clone libraries using standard ecological and molecular estimates
of sequence diversity
Table 2. Comparison of the three 16S rRNA gene libraries (SL, SG and RS) constructedusing three soil samples
colledted from aeolian sandy land, sandy grassland, restored sandy land, based on BLAST analysis of the 16S
rRNA gene sequences
Change of Soil Bacteria Diversity between Desertification and Restoration
DOI: 10.9790/3008-1201047487 www.iosrjournals.org 86 | Page
Change of Soil Bacteria Diversity between Desertification and Restoration
DOI: 10.9790/3008-1201047487 www.iosrjournals.org 87 | Page