Embed Size (px)
Citation preview

This report represents the work of two WPI undergraduate students submitted to the faculty as evidence of completion of a degree requirement. WPI routinely publishes these reports on its web site without editorial or peer review. The opinions expressed herein are those of the student authors and do not reflect the policies or views of the sponsoring agency or its staff.
IQP-HXA-1201
Change Management in the Consumer Electronics Industry
MAY 29, 2013
An Interactive Qualifying Project: submitted to the faculty of
WORCESTER POLYTECHNIC INSTITUTE
In the partial fulfillment of the
Degree of Bachelor of Science
Submitted by:
Greg Shannon
Alicia Manley
Faculty Advisor:
Professor Holly K. Ault

i
ABSTRACT The objective of this project was to investigate the use of best practices for change
management in one engineering department of an industry-leading consumer electronics company.
The goal was to identify guidelines and tools for quantifying the effect of changes on employees.
First, we studied popular management techniques and best practices used today.
Management was found to have the most profound impact on the employee experience due to their
ability to engage the worker. Among the many tools for measuring the workplace environment
discovered, we chose and employed a well-studied survey tool that has an accompanying
benchmark with which to compare our case study results. We administered the survey consecutively
with the first set of questions geared to everyday felt stress and then the second set of questions
was altered to target a period of adjustment to a specific software upgrade. In this way, we
measured the department’s baseline to compare it first to the survey benchmark and second, to
itself during internal change.
In five out of the seven categories of questions used by the survey tool, the department
managers received positive scores from employees. The two areas that were problematic for the
department were demands and relationships in the workplace. In both areas, the employees
reported lower than 90% of the benchmark respondents in the baseline survey. Comparing this
baseline score with the responses during the technology change. Based on research, specific
methods for improving the environment to manage job demands and relationships were
recommended.

ii
ACKNOWLEDGEMENTS The group would like to thank Professor Holly Ault for her extensive support throughout this
project. Also, our thanks go WPI faculty members who volunteered their time and valuable
information in order to help us achieve the project goals through interviews and technological
assistance. Further thanks go to the librarians for their research guidance. On a final note, the group
would like to thank the Department of Mechanical Engineers who took the time to take our survey
and listen to our results and recommendations.
iii
AUTHORSHIP This report is the combined effort of Alicia Manley and Greg Shannon.

iv
TABLE OF CONTENTS
ABSTRACT ......................................................................................................................... i
ACKNOWLEDGEMENTS ..................................................................................................... ii
AUTHORSHIP ................................................................................................................... iii
TABLE OF CONTENTS ....................................................................................................... iv
LIST OF FIGURES .............................................................................................................. vi
LIST OF TABLES ................................................................................................................ vi
EXECUTIVE SUMMARY .................................................................................................... vii
INTRODUCTION ................................................................................................................ 1
BACKGROUND .................................................................................................................. 3
Stress in the Workplace ............................................................................................................ 3
Types of Stress ................................................................................................................................ 3
Fulfillment vs. Stress ....................................................................................................................... 3
Measuring Stress ............................................................................................................................. 5
Effects of Stress ............................................................................................................................... 6
Workplace Environment ........................................................................................................... 8
Differences in Management Style ................................................................................................... 8
Measuring the Work Environment ................................................................................................. 9
Engagement is the Key .................................................................................................................. 10
Management Styles ...................................................................................................................... 11
Change in the Workplace ........................................................................................................ 13
Causes of Change .......................................................................................................................... 13
Efficiency Driven Changes ............................................................................................................. 14
Possible Negative Impact of Change ............................................................................................. 16
Need for Change Management ..................................................................................................... 16
Steps of Change Management ...................................................................................................... 16
Going Forward............................................................................................................................... 18
METHODOLOGY ............................................................................................................. 19
Objectives...................................................................................................................................... 19
Methods ........................................................................................................................................ 19
Process .......................................................................................................................................... 20
v
FINDINGS ....................................................................................................................... 22
DISCUSSION ................................................................................................................... 29
CONCLUSION AND RECOMMENDATIONS ........................................................................ 35
REFERENCES ................................................................................................................... 37
APPENDIX A: Confidence Calculations ............................................................................. 42
APPENDIX B: Survey Questions ....................................................................................... 43
APPENDIX C: A Case Study .............................................................................................. 48
Consumer Electronics Technology: ............................................................................................... 48
Consumer Electronics Technology Change ................................................................................... 48
APPENDIX D: Stress Management Competency Indicator Tool ........................................ 57
APPENDIX E: HSE Management Standards Analysis Tool 153 User manual ....................... 59

vi
LIST OF FIGURES FIGURE 1: Maslow’s Hierarchy of Needs………………………………………………………………………..p.5
FIGURE 2: Job Strain Model, Karasek …………………………………………………………………………….p. 7
FIGURE 3: Aggregate Business as Usual Results from HSE Survey…………………….……………p.24
FIGURE 4: Aggregate Change Results from HSE Survey…………………………………………….…..p.25
FIGURE 5: Question by Question Business as Usual Survey Results…………………….…………p.26
FIGURE 6: Question by Question Change Survey Results………………………………………………p.27
FIGURE 7: Percentile Ranking of Company "A" Organization…………………………………………p.28
FIGURE 8: Control Questions Average Results………………………………………………………………p.28
FIGURE 9: Job Demands Resource Model…………………………………………………………………….p.34
FIGURE 10: Employee Relationship Management Components……………………………….…..p.36
LIST OF TABLES TABLE 1: HSE 7 Assessment Factors of Workplace Design………………………………………….p.11
TABLE 2: Manager by Manager Comparison HSE Survey Results………………………………..p.29
TABLE 3: DuBrin’s Seven Practical Ways to be More Relational………………………………….p.36

vii
EXECUTIVE SUMMARY An organization’s ability to increase worker productivity over an extended period of
time is a key driver in a company’s long-term success. Changes in technology are one factor
that helps in achieving this goal. Change induces stress that not only affects the individuals
but also affects the management team and consequently, the whole organization. In times
of stress, a team has to adjust and continue the work set forth by the company to maintain
a successful plan. If the organization does not change with the times, it risks losing its
competitive edge and may be forced to make undesirable changes, such as cutbacks, in
order to survive.
The goal of this project was to investigate how a leader in the consumer electronics
industry manages workplace stress during design process change. The background research
delved into common issues surrounding both stress at work and management of change.
We discovered that there are many techniques and tools for maintaining or improving
workplace environment.
First we uncovered what is known about stress; the contributing components and
potential outcomes. From this we learned how integral the workplace environment is to the
employee experience. In the simplest form, change is a component of stress, and the
reception of change depends greatly on the connection to the organization felt by the
employee. The effect can be anywhere along a continuum of stress from positive to
negative.
This spurred us on to look for ways that management could ensure a positive
workplace. We investigated many resources and tools for implementing best practices that
have developed from over a hundred years of research. These best practices all focus
around management style. Assessing an industry leader for their resiliency to stress of
change could potentially reveal the effectiveness of the business practices currently in use.
During our research, we found methods to assess the performance of “Company A” both
before and after a large change to their design process technology.
We utilized an industry survey tool that asks the employees about their work
environment on the basis of seven components. The tool is called the Health and Safety
Executive (HSE) Management Standards Indicator Tool (MSIT) and it is widely used for
tracking work-related stress. The seven categories are demand, control, manager support,
peer support, relationships, role and change. The HSE tool includes a benchmark from a
viii
study of 136 other organizations (HSE Management Standards, 2013) that we compared to
the data from one engineering department at Company A.
We used the survey tool in two ways. The first was to get a “business as usual”
baseline of the department environment. The second was to modify the HSE questions
around the recent change in the Microsoft Office Suite. The upgrade added in Microsoft Link
2010, which had a significant impact on the way the employees communicated. We then
compared these “business as usual” and “change” results to those from the HSE benchmark.
The department we studied consisted of seven managed teams of five to seven
engineers. Due to the small sample size, it was not possible to observe differences between
managers. However, we were able to use the aggregate data across each category and
compare the before and after change snapshots. The survey responders were kept
anonymous to protect both individuals and managers from being targeted for either
improvement or praise.
We recognize that the department we surveyed was smaller than the usual
organization, but feel that we gained 95% confidence in the results by getting a large
response rate. We learned that the department we surveyed ranked very highly relative to
the other 136 organizations in five of the seven categories. The results did show two areas
for improvement for the whole department, particularly in the stressor categories of
relationships and demands for both the “business as usual” and the “change” states. The
results did show a very small degradation through the “change” in all categories except
control. Because the organization size is small and the percent of change is minute, there is
no statistical relevance to the lack of degradation of the scores for control. Although there
were some differences from manager to manager in a few categories, relationships were
the closest in response grouping. The whole group may not have felt the same about each
manager’s effect on relationships, but none of them felt it was acceptable.
We are recommending to the managers some new methods and resources to build
and strengthen their relationships with employees while finding ways to better balance the
demands on everyone. The department should continue to be proud of how management
ranked in all the other categories being sure to not lose sight of the importance of
continued support through change.

1
INTRODUCTION Enter any electronics store and the diversity of products is staggering. Now, try to get a
replacement part for an older electronic component. It becomes obvious that advances in
technology are happening at a very rapid rate, which puts pressure on the consumer electronics
industry to bring products to market faster and faster. This requires a shorter product design and
development cycle, which means that the design processes will change in order to keep up with
technology and demand.
New Product Development Planning (NPDP) is the process of creating a master plan for the
design and development of products from definition to production. The management staff from
each engineering discipline works with the NPDP Planners to make a process that increases
efficiency and reduces waste. When one discipline makes a change that increases its group’s
efficiency, then another discipline with the next longest process becomes the next target of change.
This creates a virtually ongoing state of change for the employees. Even though mechanical
engineers work in a high stress environment as a norm, an organization’s approach to change can
have a profound effect on the outcome from the engineer’s perspective.
Today there is a branch of management specifically called Change Management that
commonly refers to a “set of basic tools or structures intended to keep any change effort under
control” (Belkic, 2003). The intent is to mitigate the “distractions and impacts of the change”
(Belkic, 2003). Since change is only one aspect of stress (“Health and Safety Executive”, 2013) the
larger concern is managing stress. The fields of psychology and business management have studied
stress extensively and have shown there is a correlation between the environment created by those
in authority and the resulting stress levels experienced by employees within the organization. This
is how best practices were developed.
When management implements change well, positive associations can occur which benefit
the individual, group and the corporation as a whole. However, workers can have a very difficult
time when change is not managed well. The impact of efficiency measures on the people involved is
an important consideration. This impact is tracked under a category called stress-related illnesses.
The scientific community has a clear understanding of the effect that negative stress can have on a
person. From decades of research, direct correlations have been found between management
practices and the resulting employee experience. The results can be either positive or negative

2
depending on the level of engagement. Engagement is a feeling of importance, relevance and
mutual concern. High levels of engagement result in reduction of stress and the illnesses associated
with stress.
Research of workplace dynamics draws strong correlations between high demand jobs that
do not offer high levels of control for their employees, and the increased incidence of work-related
stress. In 1981, a study defined seven factors of stress, of which time constraints, productivity
emphasis, and heavy workload are only three (Parasuraman and Alutto, 1981). All three of these
aspects can be dramatically affected when a routine is interrupted during a process change.
As we researched the history of successful and unsuccessful design processes, differing ways
of effectively implementing change in a work community surfaced. Ideally, using best practices in
stress management minimizes the negative stress effects. Unfortunately, there are workplaces
where stress management tools are not being utilized to their full capacity. As these techniques
rely heavily on management styles and methods that either work well or do not (Gerwin and
Barrowman, 2002), we decided to study “Company A” to measure its stress management
effectiveness.
How well change is managed in “Company A” was unknown. By surveying and comparing
the stress level of the mechanical engineering department before and after a change was
implemented, the workplace environment can be measured. Since “Company A” is a large industry
leader who aims to create a better work process, they are interested in data that can help them
achieve their goal. Once this investigation produced data, we expected the analysis would identify
areas of strength and/or weakness.
The surveys questioned participants first about their routine experiences with their direct
managers using the Human Safety Executive Indicator tool. Then an adjunct survey asked them to
rate their subjective experience during a large technological infrastructure change, specifically a
software package upgrade. The differences in management as related to stress level were
compared both within the company and as compared to data collected using the same survey tool
by the HSE benchmark study of 136 companies. In this way, an assessment of management during
change implementation indicated how well “Company A” is at stress management. We then offer
suggested material and methods commonly used to improve workplace environments for the
benefit of all.

3
BACKGROUND To properly investigate a workplace and its effectiveness for its employees, what drives the
company objectives as well as the personal objectives of the employees had to be researched. The
many years of research that has predated this report has led to a thorough understanding of all the
components that converge to create an overall work environment. This body of evidence and tools
equips the layperson to conduct a study with some applicable relevance.
Stress in the Workplace The modern work environment has been long suspected as a cause of stressors that are
related to adverse health effects. Through decades of research, experts have developed best
practices for employers to follow to minimize workplace stress and thereby reduce stress-related
illnesses. These techniques become even more necessary during times of change, as change at any
level produces stress. This study considers first the effects of stress, and then the two key
contributing factors of environment and change, with the purpose of considering what can or
cannot be done to reduce stress in the workplace.
Types of Stress Webster’s dictionary defines stress as “a physical, chemical, or emotional factor that causes bodily
or mental tension and may be a factor in disease causation”(Merriam-Webster, 2013). There are
two types of stress: distress and eustress. Distress is defined as “pain or suffering affecting the
body, a bodily part, or the mind; a state of danger or desperate need” (Merriam-Webster, 2013).
The term “eustress,” also referred to as a “good stress”1 that comes with a challenge and during a
time of growth, is used to describe stress that is deemed healthful, giving one a sense of fulfillment.
Fulfillment vs. Stress In 1943, psychologist Abraham Maslow put forth his five-part model known as the Hierarchy
of Needs, as shown in Figure 1 (McLeod, 2007). Maslow stated that people are motivated to meet
certain needs. When one need is fulfilled, a person seeks to fulfill the next one, and so on. This is a
good evaluative starting point because of how integral a workplace environment is to the provision
of these needs, from the lowest level of providing food and shelter all the way potentially to self-
esteem and status.
1 the word “eustress” was developed by an endocrinologist as a combination of the Greek word “eu” , meaning “good”, added as a prefix to the word
stress. http://en.wikipedia.org/wiki/Eustress

4
Figure 1. Maslow's Hierarchy of Needs reprinted from simplypsychology, by S.A. McLeod, (2007). Updated 2013. Retrieved on April 20, 2013 from www.simplypsychology.org/maslow.html. Reprinted with permission.
Below is a list wherein each level is defined.
1. Biological and Physiological needs - air, food, drink, shelter, warmth, sex, sleep.
2. Safety needs - protection from elements, security, order, law, limits, and stability.
3. Belongingness and Love needs - work group, family, affection, relationships.
4. Esteem needs - self-esteem, achievement, mastery, independence, status, dominance, prestige, and managerial responsibility.
5. Self-Actualization needs - realizing personal potential, self-fulfillment, seeking personal growth and peak experiences.
(McLeod, 2013)
This version of Maslow’s needs uses words and phrases like “work group” with
“relationships” under level 3, which is labeled as Social Needs in some versions. Maslow calls all
need levels except the highest level, Self-Actualization, “basic needs”.
The top most level contains what are called growth needs. These needs are only important
to us when the lower levels are satisfied. When looking at Figure 1 above, it is clear that all needs
5
have the possibility of being fulfilled in the workplace. According to Maslow’s theory, only when
the lower levels are satisfied will a desire to achieve progressively higher levels be demonstrated. In
the workplace, just having a job is most important, and then feeling secure in that job is more
important than forming alliances. This can explain why office politics becomes so cutthroat during
layoffs. If an employee is unclear about expectations, this represents job insecurity to them. If they
lose their job, their physiological needs are threatened.
Measuring Stress Responses to stress are shown to vary based on several factors. Different researchers may
call a factor by different names, however they are very consistent in their framing of human needs
and how those needs relate to workplace experience.
Stress, in the workplace as in the laboratory, has been found to be a product of two factors:
the elasticity of the material and the percentage of change. For the purposes of this study, the
material is the workplace environment. This environment can be defined further as a construct of
job demands and job control. Demands from a job can be constant or changeable. Likewise,
personal control over time management, for instance, may be relatively consistent as part of the
company culture or it may be more or less flexible depending on the project. This creates a
continuum of possible stress level outcomes felt by the employees.

6
Job Strain Model In 1979, Robert Karasek
published his model, Figure 2, showing
how differing levels of job demands and
employee control resulted in stress,
either positive or negative. It is called
the Job Strain Model (JSM), also called
the Demand-Control Model.2 Other
models discussed later have expanded
this model by dividing each of the
original two factors into subcategories
that focus on the personal interactions
and their effect on workplace stress. They
are therefore better able to measure the entire workplace environment, so they are explained
under the “Measuring the Workplace Environment” section to follow.
In Figure 2, Point A is where both the demand is highest and personal control is lowest. In
this model, demand and control (aka decision-making latitude) are set on different axes, therefore
an increase in either factor results in a change in stress.
Effects of Stress
Stress-Related Illnesses In Figure 2, section 4 relates to a work situation where even though there is low demand,
there is very little control given to the employee. Even though this might represent low stress to
many, there are negative health effects even at this “Passive” level. This was confirmed by a
Harvard School of Public Health study in 1990 that concluded that a person unable to control the
demands of their environment could become depressed. It also stated that depression has been
recognized as the second worst cause of “life reduction and loss of productivity”, following ischemic
heart disease (Murray, 1996). Heart disease is the indicator used in many studies on stress-related
2 Johnson and Hall (1988) added social support to the two main aspects, demand and control.
Figure 2 Job Strain Model developed by Robert Karasek

7
illnesses. While estimates vary greatly between studies, in 1990, Karasek, joined by Theorell,
estimated that up to 23 percent of heart disease might be prevented if the level of "job strain" in
jobs with the highest strain levels was reduced (Karasek, 1990).
Stress has been found to be not only a direct cause of illness, but also an indirect cause
when other related unhealthy habits and risk increase. In one study, these secondary risks are
referred to as “lifestyle risks”, which are the unhealthy changes in lifestyle that occur as a result of
stress in the workplace. For example, smokers may smoke more because they are under increased
stress. Another lifestyle risk is associated with employees eating unhealthily at work due to
pressures to grab something quickly. This in turn can increase obesity and its associated costs, such
as absenteeism and lowered productivity (Tunwall, 2012).
In the Whithall II Study, Paul Tearle showed that an increased incidence of coronary heart
disease “could not be explained by conventional risk factors, such as smoking, being overweight
and having high blood pressure” (Tearle, 2007). The research showed that the stress factors of high
levels of job demand, low levels of job control, and imbalances in effort to reward, were related
directly to an increased incidence of coronary heart disease. The conclusion is that stress alone has
a negative impact on health. This further supports the correlation between the two factors of
demand and control proposed by Karasek’s JSM.
Reduced Productivity Since stress can have serious health consequences, monitoring levels of demand and
increasing workplace flexibility (control) are imperative to keeping the modern worker healthy.
This is a concern that goes beyond the individual employee and their family. In 1999 the US
Department of Health and Human Services’ Surgeon General stated the ability of an employer to
prevent mental illness and promote wellbeing was compatible with the mission of the public’s
health. The HSE reported 10.4 million days of work lost to stress within one year within the UK
(“Health and Safety Executive”, 2012). Improvements to workplace environment have been shown
to have a profound impact on increasing employee productivity in large part by reducing the
number of sick days (Human Resource Management International Digest, 2008). The result is a cost
benefit to the corporation and ultimately society.
Increased Autonomy There is also a positive outcome that can be brought about by stress. Point “B” in Figure 2
would illustrate eustress as a challenging growth environment at work. Sometimes when pressures

8
increase in a workplace, new collaborations form and different methods of time management are
employed. Professionals, like the engineers in the CE industry within this study, generally enjoy
more autonomy in the workplace, perhaps because of attributes such as self-discipline (Chan,
2007). According to the Health and Safety Executive (HSE) website, a UK national risk control
organization, the employees more likely to feel stressed are managers, professionals, women and
middle aged workers (ages 35-54) and those employed within large corporations (>250 employees)
(“Health and Safety Executive”, 2012). Therefore, professionals would generally fall into the
“active” category in Figure 2, enjoying more control over how they meet a high level of demand.
This higher level of autonomy is a practical response to workplace stress.
Workplace Environment Considering that the rate of change cannot be effectively reduced in the CE Industry, the
focus turns to controlling the way it impacts the people within the design department. As defined
earlier, not all stress is considered “bad”. Distress and eustress are two ends of a continuum of
possible experiences that a person can have in the workplace. Some studies use the words strain
and boredom to consider the two possible outcomes of change in the workplace.
Differences in Management Style How management handles changes makes a big difference in the subjective experiences of
the employees. The book “Flourishing: The Positive Person and the Good Life”, pulls together many
stress and health reports and statistical data (Harter et al, 2003). This report contains transcripts
from a study involving two focus groups within a single organization undergoing both restructuring
and ongoing changes. The contrast in emotions can easily be associated with the two very different
management types.
Even though these two groups were within the same company during the same transitional
time, the employees described two very different experiences. The first group acknowledged that
many changes had occurred, but their supervisor had 1) kept them informed of what changes were
happening, 2) explained why the changes were occurring, and 3) asked for their input on how to
continue to succeed amongst such major changes.
On the other hand, a second group said that they were “scared” by the restructuring. They
stated that many quality team members had left the organization, and those hired to replace them
were described as not knowing “the business”. Communication with managers had changed from

9
two-way to a top down style that did not incorporate input from the employees who knew best
how to serve the customer’s needs.
This difference in experience is a result of differing workplace environments. Therefore, the
starting point for comparison is during a time when the given occupational environment is
functioning routinely. Comparisons can be made regarding the effect on the team members when
different types of teams encounter the same change. Stress is qualitative and subjective by nature.
Our study requires us to know how the experts measure (quantify) the human experience so that
levels of stress can be tracked and studied and therefore be mitigated.
Measuring the Work Environment Research into the safety of the workplace has been conducted for over a hundred years
(Aldrich, 2010). Since then, the American Psychology Association and other major organizations
have developed tools for measuring the physical, psychological and social impacts of varying
workplace conditions on those working there. Three of the many survey tools used to measure
workplace competence and resulting stress levels and outcomes are described here.
GWA Developed from 30 years of research questionnaires, the Gallup Workplace Audit (GWA) is a
twelve-question survey of employee perceptions of management practices used by the trusted
Gallup Organization. Some of the concise questions in the survey ask the respondents to rate their
employer and managers on job clarity, sufficient work resources, job satisfaction and personal
connectedness with people at work among other criteria (Harter et al, 2003).
OSI Dr. Karen Belkic, along with her colleagues, has developed the Occupational Stress Index that
she includes in her book “Occupational stress index: an approach derived from cognitive
ergonomics and brain research for clinical practice” (Belkic, 2003). This tool is an important part of
the website, www.workhealth.org, that is a rich resource of collaborative information on stress in
the workplace.
HSE According to the HSE website, seven key areas of work design are primary indicators of stress
in the workplace. They are described below as seen on the website (“Health and Safety Executive”,
2012).

10
Demands - issues such as workload, work patterns and the work environment.
Control - how much latitude the person has in the way they do their work.
Management Support
- encouragement, sponsorship and resources provided by the organization and line management.
Peer Support - encouragement, sponsorship and resources provided by colleagues.
Relationships - promoting positive working to avoid conflict when dealing with unacceptable behavior.
Role - whether people understand their role within the organization and whether the organization ensures that they do not have conflicting roles.
Change - how organizational change (large or small) is managed and communicated in the organization.
Table 1 HSE 7 Assessment Factors of Workplace Design
Adapted from the website www.hse.gov.uk. Adapted with permission
The HSE defines Demands and Control the same as in the JSM discussed previously. Change is
so important that it holds its own category. Role refers to how well the staff understands the
responsibilities as communicated by the organization. Relationships, Management Support and
Peer Support work together to form a social environment at work. This creates an emotional
connection often referred to as engagement.
Engagement is the Key Over and over in the research, the concept of engagement was repeated as a factor that
made the difference between distress and eustress. Simon Albrecht writes in the International
Journal of Manpower, “The science and practice of employee engagement, a key indicator of
employee well-being, continues to evolve with ongoing incremental refinements to existing models
and measures”(Albrecht, 2012). Those existing models and measures, some of which are laid out
for us in “Flourishing”, are based on a review of Gallup Organization findings. Chapter 9 is
particularly focused on “well-being”. The hypothesized model of this chapter is not a new one, but
instead highlights the “reemergence of interest in the happy-productive worker hypothesis” (Harter
et al, 2003). This theory holds that employee engagement produces a positive effect more often
than without engagement. These positive effects spillover in a good way resulting in increased work
efficiency, higher employee retention rates and better “business outcomes.”
This text goes on to say that a feeling of engagement is a result of employees having their
needs fulfilled in the workplace. Four key needs are identified as need for personal growth, a need
to feel important, a need to belong, and need to be able to succeed. The ability to succeed is a
result of clear expectations coupled with the materials needed to meet those goals. Even without

11
managers being personally involved with each employee, their communication of goals and
provision of necessary materials can begin to either make or break the connection between the
employee and the organization.
Relationships with supportive peers and managers lead to higher work engagement that is
found to mitigate perceptions of distress. In this way, managers who use best practices
management styles reap results from increased employee engagement and job satisfaction.
Management Styles While management is not necessarily the source of stress, research has clearly defined
differences in the effects on employees based on management styles. For example, the way a
manager relates to the employee with regard to communication has an effect on the employee’s
productivity. According to Isobel Rimmer, an expert in management training and HR management,
a manager’s appropriate feedback can help reduce stress-related illnesses. In 2008, Rimmer,
individually trained managers at the HR department of the West Yorkshire Probation Service
(WYPS). After training managers to give clear objectives and regular feedback, employee absence
fell so dramatically that the HR manager reported, “it was like adding eight or nine new employees
when considering the increase in efficiencies” (Human Resource Management International Digest,
2008). This is one example of where demand was not reduced per se, however a clearer
understanding of the expectations increased the employee’s feeling of control. This benefitted both
the employees and the corporate bottom line.
S.M.A.R.T. With over 20 years of experience, Rimmer, has developed training that incorporates best-
practice techniques in performance management. She developed her S.M.A.R.T. approach that
gives trainees opportunities to practice skills and incorporates at least two facilitators for groups of
more than ten people. The steps to take to achieve management success begin with setting clear
objectives.
“First, managers must set clear objectives, which need to specific, measurable, agreed,
realistic and with a clear timeline (Smart). Managers must observe and measure their
team members’ performance against these impartial objectives in order to give accurate
feedback on their performance” (Human Resource Management International Digest,
2008).

12
The second essential step to success is giving and receiving feedback with care and skill. This
involves using performance data wisely. Note that receiving feedback as a manager is the second
part of the two-way communication model.
The third step is management training. Managers that feel comfortable answering a variety of
questions and concerns will be better equipped to be an equitable resource for the staff. This is
where role-playing helps managers practice skills until they are comfortable using them even in
uncomfortable circumstances.
Participative Leadership This method is defined by shared decision-making with team members. There are three
subcategories that help classify the many positive behaviors included:
1. Consultative Leaders who get the advice of the other members before making a decision.
2. Consensus Leaders who open up discussion and then make a decision based on the general feelings of the group.
3. Democratic Leaders who leave the final decision to the team members.
(DuBrin, 2013)
Transformational Leadership This management technique was developed from the writings of James MacGregor Burns in
1978. It is broken into four components: intellectual stimulation, individualized consideration,
inspirational motivation and idealized influence (Cooley, 1979).
Intellectual Stimulation encourages questioning the “norm” and creating new solutions
under the leader’s visioning of the big picture and how everyone fits together to overcome
any obstacle.
Individualized Consideration is given to each employee in the form of mentoring, coaching
and opportunities for growth, which helps fulfill the individual’s needs for using their
potential, feeling valuable and achieving their personal goals.
Inspirational Motivation provides challenges and meaning for employees to share in tasks
and goals where they feel necessary to the forward movement of the team/company.
Idealized Influence can be described as the relationship of mutual trust that is built on high
moral and ethical standards.

13
This type of management clearly uses eustress, or “good stress,” opportunities to bring about
ownership and engagement in employees. The indirect effect of this type of leadership was an
increase to the subjective occupational success as a result of the direct increase in work
engagement. The results showed a significant relationship between transformational leadership
and work engagement, positively effecting occupational success, especially in women. Since higher
levels of engagement are related to lower levels of job-related stress, these findings suggest ways
for leadership to enhance the employee’s work success (Halper et al, 2012). Further study could be
helpful to suggest methods of leadership to increase employee success and decrease distress while
increasing eustress.
Optimally, everyone would benefit from reducing stress by both limiting demands and by
creating a work environment with more personal control for employees. Unfortunately, businesses
are not always capable of minimizing both factors of workplace stress simultaneously. One
approach to reduce distress for workers is to reduce the amount of change in the workplace.
Change in the Workplace Consumer electronics companies need changes in technology to increase productivity.
During the transition to a new or upgraded technology, implementation strategies play a key role in
a successful outcome. Manager style and communication methods have been studied to
understand ongoing best practices for a management team. There have been continuous
improvements on Change Management since the early 1990s (Murthy, 2007).
Causes of Change If the demands at work remained relatively constant, a worker could establish a pattern
using available controls to effectively manage their stress. However, changes to demands in the
workplace are occurring at an ever-increasing speed. Dr. Karen Belkic, writer and the developer of
the Occupational Stress Index, sums up the current situation.
“Reflecting pressures of global competition, trends in working life are towards increasing job
demands, working hours and job instability. Growing dependence on computer technology,
which could improve working life, has de facto lead to greater workload and pressure.”
(Belkic, 2003)

14
Global competition has produced a situation where manufacturers locally must compete
against products that may be produced where the costs of production are lower. If the competitor
has lower labor costs, for example, then the local manufacturer will want to leverage either a low-
cost strategy or try to differentiate their product. These are just two of the strategies employed by
companies who compete internationally. The most efficient producer enjoys an advantage called
Economies of Scale, and others must work hard to compete with them (Hill, 2013). This is
particularly true in the case of the electronics industry, where the supply chain is heavily dependent
on overseas component manufacturing where labor is considerably less expensive. There are also
companies that produce the entire product overseas and market it internationally where they can
sell for well below the local competitor’s price. This is why competing in the global marketplace
requires speed and agility within the consumer electronics industry (CEI).
In some industries, the pressures and technologies may be relatively stable, however in CEI,
a robust plan is required to keep ahead of technology and develop products that make it to market
first and/or at the best price. Joel Brockner observed that companies have to manage the product
development process in response to the changes in the market (Brockner, 1992). Some
corporations refer to this as a New Product Development Plan (NPDP). It is the process of
developing a master plan of how to proceed from the product definition phase to the start of
production. The NPDP is continually under revision and may change from product to product.
Efficiency Driven Changes Since one important goal of process change is to increase overall efficiency, the company must
consider what factors influence efficiency, both internally and externally. Efficiency by definition means
producing the desired outcome without waste (Merriam-Webster, 2013). Consider three important factors
that affect efficiency in the product development process: the time to market, the cost of doing business
(CODB) and advances in internal technology.
Time to Market “Time to market” refers to how long a company takes to get a product from conception to
delivery. As technology changes more product market categories are created. It is believed that the
first to market in that category will win the greatest share of the market and hopefully hold it. The
benefits of doing this are numerous. Kuwant, Unny and Reidel listed increased sales, achieving
profitability sooner, extending the life of the product on the market, gaining customer loyalty, and
setting the price as among the most significant benefits (Kuwant et al., 1994).
15
Delivering products to the market for certain selling seasons, for instance, requires a
product development process (NPDP) built on a solid understanding of when and how to start the
process so that the product is finished on time (Hong, 2007). Optimally, the timing is designed to
capture the greatest market share and profit. The primary focus of the marketing department is
profit maximization. This is the backbone of how CEI companies schedule their development
process, often centering on holiday selling seasons, like Father’s Day and Christmas. Success in this
process can bring a large influx of money that then finances the year round Cost of Doing Business
(CODB) and hopefully allows enough for corporate expansion and diversification.
Cost of Doing Business There are several components that make up the CODB. Labor is usually the most expensive
portion of the total cost. Therefore, if the corporation can make the product using fewer man-
hours, the cost of production is reduced. A shorter product development cycle can reduce the labor
expense and amortizes the investment cost over a shorter time. When NPDP considers changes to
the development process, the purpose is a more efficient work stream. This means that engineers
are freed up sooner to work on the next product or the number of engineers needed to for a
specific product is reduced. Either way, the goal is to get more products out to market faster
and/or at reduced cost.
Understanding the pressures of time and competition better, it is clear that the CE industry
changes rapidly to keep up with new product technology. What is less evident is the way that
changes in the design process technology itself affects the engineers.
Internal Technology Advances The third efficiency improvement is the implementation of advances in internal technology.
This can come in the form of system software improvements or even new technology developed in
house. Efficiency in the evolution of a design organization has been mostly driven by technological
advancements especially in the area of Computer Aided Design (CAD). Updates to a host of other
analysis engineering packages, such as Structural, Thermal and Tolerance Analysis, have also been
assimilated.
Within the CE industry, technological changes can affect both the type of product that can
be built along with the method of its development. Advances in internal technology, as discussed
above, are the improvements in software and other supportive frameworks that increase the
efficiency of the design process. Therefore, internal technology advances are also a type of change.

16
Possible Negative Impact of Change There can be consequences if production timeframes are pushed too far. Quality of
product, therefore brand image, can be affected if the process improvements are not done
carefully (Clark and Fujimoto, 1991). Also, this does not mean a decrease in the overall workload for
the engineers. Rebecca Wettemen relates that greater productivity should be corroborated by
measurable outcomes, such as additional product output and increased profits. However, she
points out that increases in productivity sometimes show up as more work being done without the
addition of more staff (Wettemen, 2005). In other words, making employees more efficient means
making them more productive. For the corporation this is beneficial initially to the bottom line,
however as discussed earlier, there is a potential for a negative impact on the staff as well.
Need for Change Management With upgrades advancing as quickly as available technology, the burden on the organization
is to manage the implementation while at the same time being mindful of time lost during
assimilation. For instance, if the advantage is time saving, but there is a lag time during the early
phase of implementation when engineers are becoming accustomed to the new methods, some of
the time advantage is negated.
The managers need a well thought out plan to research new technology, assess the best-fit
tools for the organization, test the applications’ boundaries, disseminate the change, train the
employees, introduce the new tool and then support its implementation. While they work through
this process, they still have to maintain the day-to-day operations at an acceptable level. This, of
course, puts an increased level of stress on the management team. In this way, technology
adaption affects the whole organization.
Steps of Change Management
Preparing For a Change Initially, decisions are made as to what should change and how it should change. The
managers also have to prepare the organization and the corporation for the impending delays due
to training and post training ramp up. This is a crucial part of the equation. Without a plan that is
accepted by the whole organization the onus is left on the engineer to get back up to speed.
Varying levels of skill and adaptability among engineers can lead to some teams weathering the
change better than others. An understanding of the workload on the engineers before the change is
necessary to create time for the engineers to go through training.

17
Training For Change Managers play a key role in this phase both because they are the first to be trained and
because they set precedent. Management that is well versed in best practices will ensure their
team’s smooth transition. As the forerunners, it is important that the training managers reinforce
the new behavior in others as well as show acceptance themselves. Management acceptance is a
key motivator to subordinates (Nevis et al., 1996).
The challenge facing many companies is to meet the training needs of all levels of engineers
at the same time. This may result in either training groups by level or widening the training
material to be understood by all. The latter approach may beget frustration from those that feel
they need less training, while the first approach may leave new engineers struggling post training
(Langstrand, 2012).
While the management team is preparing, an overall timeline that will accommodate
everyone’s schedules must be put in place. A suitable learning environment needs to be created
and the teams enticed to come. Management needs to concern itself that all employees are
engaged and learning without being discouraged or overwhelmed. The trainers must be prepared
for questions that are outside the scope of the learning materials while continuing to deliver a
consistent message for congruent understanding (Emerald Group, 2012).
Trainers could be individuals from inside the organization who are proficient, also known as
“super users”, or they could be experts from outside the organization. Either way the trainer has to
be seen as a credible resource for the employees being trained (Emerald Group, 2012). Preparing
managers to handle challenges in employee relations, using role-playing practice, increases the
managers’ confidence and ability to be effective and fair (Human Resource Management
International Digest, 2008). The additional advantage of calling on experts from outside the
organization is that they can potentially work without special alliances to specific individuals.
Implementation Once the employees are trained, the cautious and planned roll out of the change comes
next. There are different methods of introducing the change. Some companies decide to begin
organization-wide post training. Other places start with a few teams or one team to prove out the
new process before implementing to the entire organization. Either way, communication remains
important to the success of the transition. The employee who feels that the change is legitimate is
more likely to accept the change. Therefore, an employee who had originally felt the change was

18
not justified needs to be reconciled in order to fully embrace the new changes (Ford, Ford, Damelio,
2008). When the whole organization has gone through the change and started to move back into
just normal work issues that arise, then the organization can be thought of as back to routine.
Reception of Change The engineer’s mindset on the change influences how well he or she accepts the change. If the
engineers feel as though the change is not necessary, then they will likely not help incorporate the
change (Ford et al, 2002). This can lead to differing product development processes being done by
different teams in the same organization. This may create the most confusion of any scenario as
one team approaches different support organizations and suppliers with one approach and another
is doing something different. Credibility of the whole organization is at stake and can take a lot of
effort.
Going Forward The benefit of all the research into stress management is only realized when put into action.
The potential outcome is that employers everywhere have ready access to the tools by which they
can inspire and implement improvements that benefit the people they employ.

19
METHODOLOGY The goal of this project was to investigate the best practices of Change Management
through technological change. Utilizing research and a case study approach, we compared the
work of industry and academia against one mechanical engineering design department. The
outcomes of this study allow the departmental management team to gain a better understanding
of how this particular organization’s management style affects the acceptance of a particular
technological change such as Microsoft Office enhancements.
Objectives OBJECTIVE 1 – Determine how the organization rates in the HSE Management Standards Indicator
Tool Survey (MSIT) on an ongoing basis. Compare the survey results to the database of companies
that have already taken the survey.
OBJECTIVE 2 - Measure the effect that changes have on the staff through the HSE Management
Standards Indicator Tool by administering the survey tool again with an emphasis on the specific
technological change with some added targeted questions.
OBJECTIVE 3 – Investigate if there are any correlations between the managers’ communication
style and employee felt stress through the change.
Methods Assess the employees’ perception of the managers through a widely used survey tool (HSE
Management Standards Indicator Tool) to see how the managers rate on an ongoing basis. Give
the same survey again and have it targeted to the specific technological change and compare the
results of the measurements. Utilizing the original survey data and the information that has been
collected in over 136 other organizations, determine how this department’s practices compare to
industry and if there are areas where improvement is warranted. Correlate the targeted change
survey’s output to that of the ongoing indicator survey and identify any differences.
The HSE Management Standards Indicator tool was administered to all mechanical
engineers and their direct managers who were working in this department during the targeted
change. Managers all have someone they report to and therefore have a work environment
influenced by upper level managers. According to the website of the Health and Safety Executive
(HSE), the UK national risk control organization, the seven key areas of work design that are primary

20
sources of routine stress in the workplace are utilized as the output sections to define how well the
managers perform in these seven key categories as well as in aggregate across all seven categories.
Demands – this includes issues such as workload, work patterns and the work environment.
Control – how much latitude the person has in the way they do their work.
Support – Management and Peer - this includes the encouragement, sponsorship and resources provided by the organization, line management and colleagues.
Relationships – this includes promoting positive working to avoid conflict and dealing with unacceptable behavior.
Role – whether people understand their role within the organization and whether the organization ensures that they do not have conflicting roles.
Change – how organizational change (large or small) is managed and communicated in the organization.
The HSE has been compared to other commonly used tools in research into work-related
stress. A study conducted by the University of Siena, Italy, validated the accuracy of the HSE (Health
and Safety Executive) indicator tool compared with the General Health Questionnaire (GHQ-12) and
the Work Ability Index (WAI) (Guidi et al., 2012). The HSE indicator tool is among the most used
tools for assessing the risk of work-related stress.
The HSE MSIT has a well-structured analysis tool to help the investigator assess the seven
key areas for each manager. We utilized the MSIT to compare the five managers’ practices and
look for areas of weakness and strength. We then reported back to the staff and management of
the department with results of the managers’ overall ranking and gave suggested actions for
improvement.
Process The step by step process for administering the survey is detailed below.
1) Administered the HSE Management Standards Indicator tool to the engineers and
managers.
2) Reviewed the aggregate survey data while protecting the identity of each participant. The
only identification recorded was the manager code which was labeled as Managers
“01,02,03,04,05,06”. This is coded in the survey as each participant answers the first
question to identify their manager by typing in the appropriate code. The codes were then
changed to a color basis to further protect the managers’ identities.

21
3) Administered the HSE Management Standards Indicator tool again with the addition of
targeted questions regarding the technological change (Microsoft Office upgrade) and asked
the participants to answer the full survey with the technological change in mind. This was
done at the end of the original survey.
4) Gathered and analyzed the data. Grouped the responses into the seven key categories.
5) Compared our data to data gathered by HSE of the 136 companies they referenced.
There were five groups from a mechanical engineering design department with an average of
seven people in each group. For fewer than 500 people in a survey of this nature, a response rate
of over 50% could be considered adequate; over 60% desirable, over 70% good and more than 80%
very good. With a response rate of less than 50%, the data cannot be considered representative
(HSE Indicator Tool).

22
FINDINGS The HSE survey outputs scores in each of the seven categories and sets a short term goal
and a long term goal for the organization to strive for. The categories are related to stress factors
and have been determined to be integral with worker satisfaction and company success (HSE,
2008). In our study the sample size was 35 people, we received a response rate of 82.8%. This
provides a confidence level of 95%. This surveyed department is small and therefore a large
response rate was vital to increased statistical relevance (Tutorvista.com, 2013).
The results for each individual manager are more susceptible to variation because of the
small sample size. Managers names were eliminated by assigning a color label to each instead.
Only one subordinate responded for the “indigo” manager, so that manager was not evaluated
separately. Three subordinates of the red manager responded; five or more engineers responded
for each of the other managers. Listed below are tables of data extracted from the HSE tool. These
tables illustrate the results of the department compared to the other 136 organizations for both the
business as usual (Figure 3) and for the technical change (Figure 4).
The department as a whole is doing very well in five out of seven categories. This should be
highlighted and further research could be done to understand why the department did so well in
these categories. We will discuss the two categories, Demands and Relationships, where there is
opportunity for improvement within the department.
The next output of results is based on the same survey taken but in relation to the upgrade
to Microsoft 365. The questions were tailored to reflect the management practices during the time
Figure 3 Aggregate Business as Usual Results from HSE Survey

23
of change. All of the respondents answered both sets of questions as part of the survey. They were
unaware that the second set of questions existed until they reached that section of the survey. The
results from the aggregate group through the change can be seen in Figure 4.
The department as a whole continued to perform well during the time of change. Note that
Demands and Relationships continue to be areas that indicate a need for improvement. Role has
dropped slightly, from very well to good. The other interesting fact about this is that all categories
have decreased a small amount in goodness factor provided by HSE except Control. These changes
are small though and may not be statistically significant.
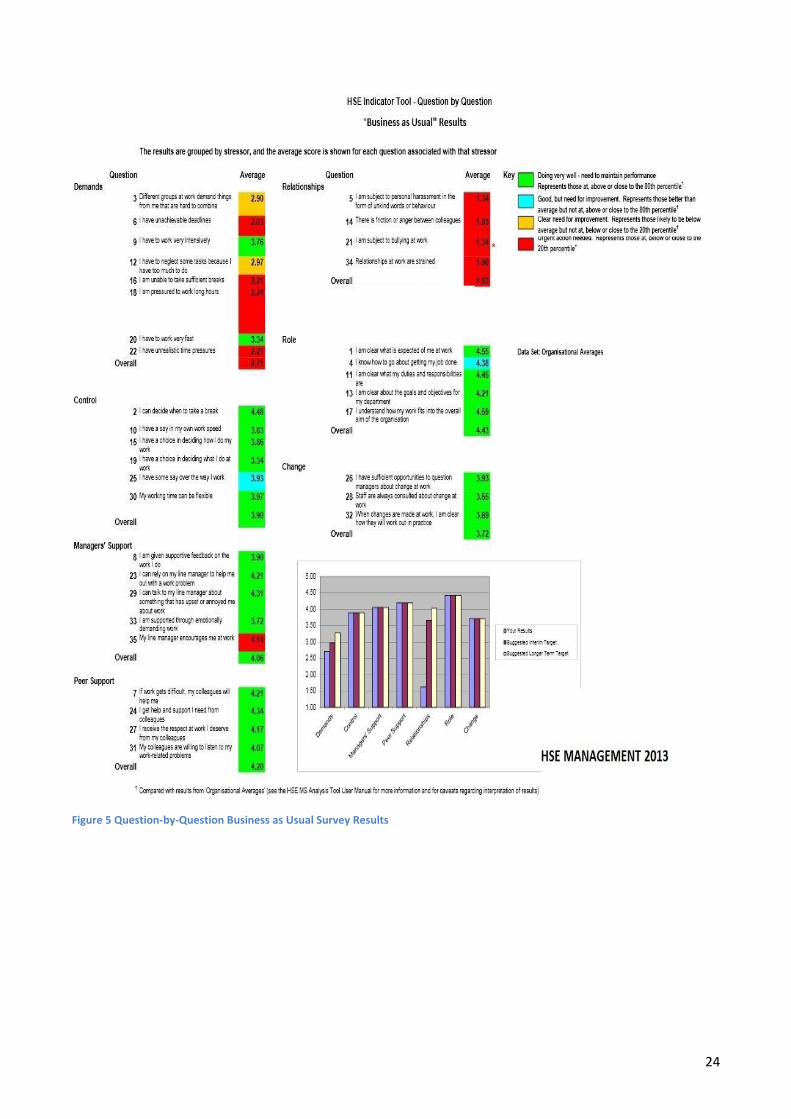
Interesting results appear when looking at the aggregate results of both the “business as
usual” case and the “change” case. Figure 5 illustrates the question-by-question results in the
“business as usual” case and Figure 6 displays the “change” results question by question.
In both Relationships and Demands most questions need immediate attention in the
“Business as Usual” case. An example of a question that needs improvement is “Relationships at
work are strained”. This, when combined with other questions from Demands like “I am unable to
take sufficient breaks” seems to correlate into a manifestation of the issues that plague these
categories.
Figure 4 Aggregate Change Results from HSE Survey
24
Figure 5 Question-by-Question Business as Usual Survey Results

25
Figure 6 Question-by-Question Change Survey Results
Both the “Business as Usual” case and the “Change” case have questions that stand out and
require deeper investigation for complete understanding.
The “Change” case follows similar trends as the “Business as Usual” case. The responses
degrade to a good status in the question “I have to work very fast”. The results suggest a perceived
awareness by the employees that the change requires a heightened sense of urgency to get the job
done. The department’s professional behavior is exhibited in this event. Figure 7 is a percentile
view of the survey results ranking vs. the 136 HSE organizations. This was determined by utilizing
the Figure 4 in Appendix C and interpolating to get the actual percentage ranking for this

26
department. This again shows the strength of the department in the 3 categories, Control, Support
and Change. It also displays the effect the change had on the Role category. With the support question
#42 shown in Figure 8, “I found the types of training offered for the change were effective” and the drop in
Role for the department from 90% as good as the other companies to 63% as good directs us to imply that
through the change the department’s employees are less certain how they fit in the structure of the
organization. Proper training methods and even more training options may improve the employees
perception of how they fit in the department.
Figure 7 Percentile Ranking of Company "A" Organization
The control questions that were based solely on the specific change and not part of the HSE
indicator tool can be seen in Figure 8.
Figure 8 Control questions average result
The group definitely uses the software but the group did not find the change to have any real effect
on their job. They were displeased with the types of training offered so this could be a point of
emphasis for the managers going forward. To increase the types of training being offered or to
focus on more effective training methods for the employees can help to give the perception of their
role back to the employee through the change.
27
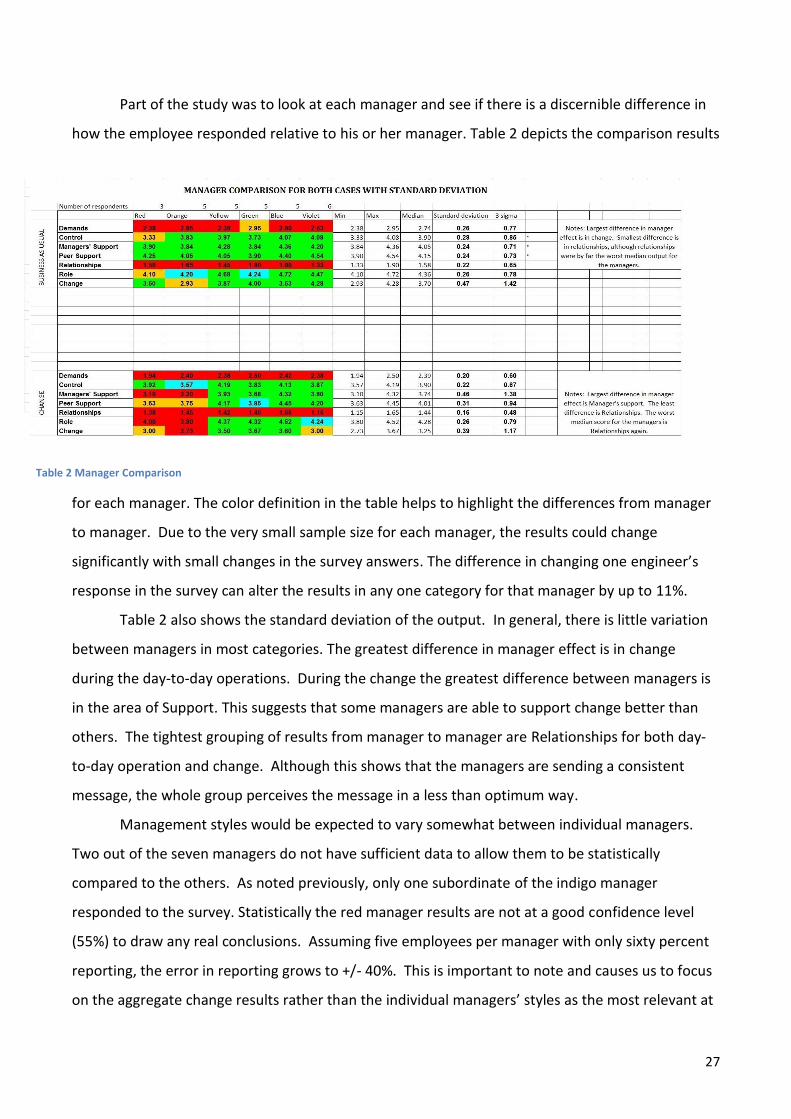
Part of the study was to look at each manager and see if there is a discernible difference in
how the employee responded relative to his or her manager. Table 2 depicts the comparison results
for each manager. The color definition in the table helps to highlight the differences from manager
to manager. Due to the very small sample size for each manager, the results could change
significantly with small changes in the survey answers. The difference in changing one engineer’s
response in the survey can alter the results in any one category for that manager by up to 11%.
Table 2 also shows the standard deviation of the output. In general, there is little variation
between managers in most categories. The greatest difference in manager effect is in change
during the day-to-day operations. During the change the greatest difference between managers is
in the area of Support. This suggests that some managers are able to support change better than
others. The tightest grouping of results from manager to manager are Relationships for both day-
to-day operation and change. Although this shows that the managers are sending a consistent
message, the whole group perceives the message in a less than optimum way.
Management styles would be expected to vary somewhat between individual managers.
Two out of the seven managers do not have sufficient data to allow them to be statistically
compared to the others. As noted previously, only one subordinate of the indigo manager
responded to the survey. Statistically the red manager results are not at a good confidence level
(55%) to draw any real conclusions. Assuming five employees per manager with only sixty percent
reporting, the error in reporting grows to +/- 40%. This is important to note and causes us to focus
on the aggregate change results rather than the individual managers’ styles as the most relevant at
Table 2 Manager Comparison

28
this size. However, it is of interest that the other five are grouped well together in nearly all
stressor categories. The blue manager is rated the overall highest across all categories in both
business as usual and the change. One notable exception shows a difference in the business as
usual change category, where the orange manager is ranked somewhat lower than the other
managers. Note that during the technology change event, the rankings of the orange manager fell
sharply, whereas the yellow, green, blue and violet managers were able to maintain relatively
consistent levels of performance. We are not going to concentrate the discussion further on these
differences, as the data set is so small it does not create statistical confidence.

29
DISCUSSION Utilizing an industry-standard stress management survey tool, we broke down a Mechanical
Design department into manager teams and looked at the differences in results through day-to-day
or “business as usual” operations and compared that to the results through a technical change. The
change we chose was the group’s move from Microsoft Office (2004) to Microsoft Office 365. The
department as a whole was studied in regard to the Microsoft Office changes and compared to the
“business as usual” state. Each manager team was studied to determine if there were large
differences in the staff’s perceptions of the managers’ styles or if there was a consistent message
being delivered to the staff from the management team.
To truly understand how these questions relate to the stress management categories, a look
at the HSE survey analysis tool is needed to utilize their wealth of knowledge in this area. The HSE
authors provide a guide to what these questions try to reveal. We will comment on the categories
that are most interesting: Demands, Control, Role and Relationships. For further study into the
other categories one can look at the complete survey results listed in the appendix and the HSE
Management survey analysis tool manual (“Health and Safety Executive”, 2013).
The survey data are compared to the aggregate outcomes from 136 other organizations.
Figure 2 in Appendix C depicts the percentile grading for each stressor category and the cutoff
limits for each category’s goodness rating. For example to be rated red (urgent action needed) in
the Control category the average answer would have to be under 3.224 in the scale from 1 (never)
to 5 (often). This would be equivalent to scoring below the 20th percentile of the population of all
136 companies.
Also provided by the HSE is an adjunct tool that is attached in Appendix D. It is their
management self-assessment tool that uses four categories to measure areas of strength and
weakness. These four categories are:
1. Respectful and responsible: Managing emotions and having integrity 2. Managing and communicating existing and future work 3. Managing the individual within the team 4. Reasoning/Managing difficult situations
There are also many resources for self-improvement and continued support available through
this website, as well as the Dr. Belkic’s website, www.workhealth.org.

30
Demands Job demands refer to those physical, social, or organizational aspects of the job that require
sustained physical or mental effort and are therefore associated with certain physiological and
psychological costs such as exhaustion (Demerouti et al., 2001). Early models, like the Job Strain
Model (JSM), used only the two broad categories, demand and control . Subsequent models
expanded, always keeping demand as a crucial component. Since then, demand has been isolated
for further study. The Oldenburg Burnout Inventory (OLBI) measures two dimensions of job
demands: exhaustion (both physical and cognitive) and disengagement from work and was
constructed and validated among different occupational groups (Demerouti, 1999; Demerouti &
Nachreiner, 1999). The broad spectrum of occupations involved in the study made the OLBI more
relevant than some earlier survey models that had only focused on human service industry
burnout. Demand remains one of the most important aspects of workplace stress.
Going back to the simplest model, the JSM by Robert Karasek, the way to manage high
demands was to increase the level of latitude, or control, for the worker to exercise. Our data show
that the company has strength in the control region while demand does not compare well to the
benchmark study. Only About 5 % of the benchmark companies displayed such high demand. This
would appear consistent with our research regarding the high level of demands that are intrinsic in
the CE industry.
According to Hockey's (1993) control model of demand management, when job demands
are too high, the ultimate outcome is that the employee will find ways to use performance-
protection. Hockey's theory identified several different patterns of indirect degradation that may be
referred to as strategy adjustments, such as narrowing of attention and redefinition of task
requirements, and fatigue after-effects like making risky choices. The long-term effect of
performance-protection strategies is the energy drain on the individual and a potential for a
breakdown under the additional influence of stressors (e.g., noise, heat, workload, and time
pressure).
The Job-Demands Resource Model of Burnout (JD-R) also proposes that the development of
burnout follows two processes (see Figure 9). In the first process, unmanaged job demands lead to
constant overtaxing and eventually exhaustion. In the second process, a lack of resources in the
workplace complicates the ability to meet demands. This leads to behavior that is withdrawn and
disengaged, similar to the OLBI model.

31
Job Demands Resource Model
Figure 9 JDR Model
In the Consumer Electronics industry, the job demands for mechanical design engineers may be
higher than other occupations. It is not easily understood how these demands compare to those in
other industries, such as nursing, air traffic control or even a more physically demanding job such as
a line worker. The Abitibi-Price Supervisory Style (APSS) study was designed to investigate multiple
factors of occupational stress. This study reported three factors that are consistent measures across
industry: demand-latitude stressor, role stressors (specifically ambiguity and conflict), and
supervisory style stresses. The first factor matches the Job Strain model by Karasek, and role
definition is very similar to the wording used by HSE. The APSS hypothesized that the demand and
role stresses mediate the relationship between supervisory style and job satisfaction. For example,
ineffective communications arising from poor supervisory relationships may hinder the ability of
subordinates to resolve perceptions of role ambiguity or role conflict, and may not allow them to
address concerns over latitude to make decisions or job demand (Lobban, Husted & Farewell,
1998). Here again, as in our background research, management style is directly related to job
satisfaction. If a manager can’t control the demands the job places on the employee, the manager
can at least affect the job satisfaction of that employee by increasing the level of engagement with
the employee.

32
Relationships Relationships are a key area of focus for the group, indicating the need for improvement.
Relationships are built through being real and creating one-on-one trust with each employee
(Mulhern, 2009). According to Judith Bardwick, the single best way to find out how people feel
about an organization is to ask them what they think about their boss. If they are all in with the
organization, they’re invariably happy with their boss. If they are lukewarm about their boss,
they’re just waiting to move on (Bardwick, 2008).
Several key factors have been identified in relationship building. These include
communication, shared values, power and dependency, cooperation, trust and commitment. A
need exists to examine the interactions that occur within working relationships by exploring how
they work and what elements must be present for success. This will provide a much deeper view
and understanding of the relationship itself.
Aspects of relationships such as relationship quality, relationship development,
relationship closeness, and relationship strength have received attention as conceptualizations of
deeper investigations of the actual relationship (Herington, Johnson & Scott, 2007). We propose
that further investigation could be done in these areas. The best relationships involve chemistry or
rapport, which means liking that person and the individuals get along easily. Working with or for a
person is an enjoyable experience that others look forward to (Bardwick, 2008). Managers have to
give feedback to help coach their subordinates. For the feedback to be effective a preexisting
mutual trust and respect must present (Bardwick, 2008). Not unlike personal relationships,
employee relationships are complex and require commitment from the employer. Managers need
to continuously look for new ways to enhance the psychological work life of the employee
(O’Malley, 2000).
The large majority of motivation theories do not take individual human differences into
account. There are tools available to help break down to the individual. The Employee
Relationship Management (ERM) tool is a strategic tool and a human resource management
process which focuses on the continuous perfection of the relationships between organizations and
employees through increased communication and knowledge of individual and shared interests.
Well-managed relationships in organizations lead to higher levels of motivation (Wargborn, 2008).
A pictorial view of the ERM is seen in Figure 10.
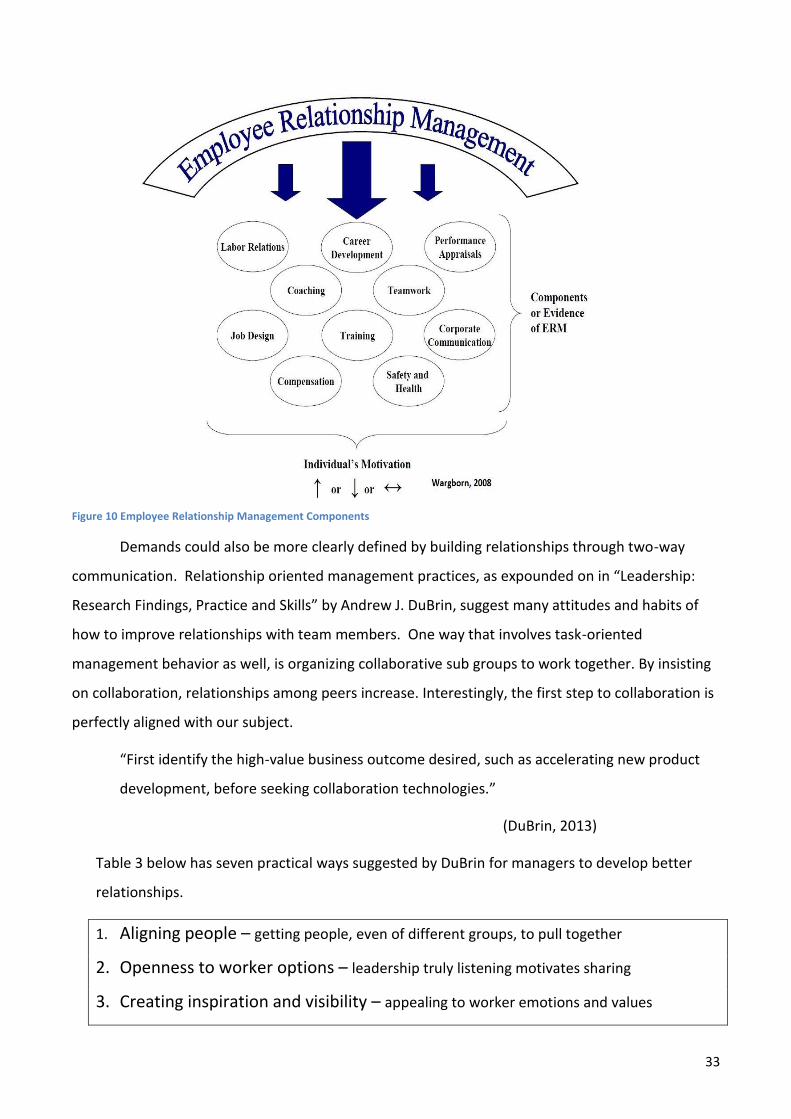
33
Figure 10 Employee Relationship Management Components
Demands could also be more clearly defined by building relationships through two-way
communication. Relationship oriented management practices, as expounded on in “Leadership:
Research Findings, Practice and Skills” by Andrew J. DuBrin, suggest many attitudes and habits of
how to improve relationships with team members. One way that involves task-oriented
management behavior as well, is organizing collaborative sub groups to work together. By insisting
on collaboration, relationships among peers increase. Interestingly, the first step to collaboration is
perfectly aligned with our subject.
“First identify the high-value business outcome desired, such as accelerating new product
development, before seeking collaboration technologies.”
(DuBrin, 2013)
Table 3 below has seven practical ways suggested by DuBrin for managers to develop better
relationships.
1. Aligning people – getting people, even of different groups, to pull together
2. Openness to worker options – leadership truly listening motivates sharing
3. Creating inspiration and visibility – appealing to worker emotions and values

34
4. Satisfying higher level needs – giving opportunities for recognition and control
5. Giving emotional support and encouragement – frequently praising
6. Promoting principles and values – focusing on morals and the greater cause
7. Being a servant leader by…
*Placing service before self-interest
*Listening first to express confidence in others
*Inspiring trust by being trustworthy
*Focusing on what is feasible to accomplish
*Lending a hand
*Providing emotional healing
Table 3 DuBrin’s Seven Practical Ways to be More Relational
These are just some of the methods for building relationships suggested by one of the many
resources available in the field of management relating to recommended best practices.

35
CONCLUSION AND RECOMMENDATIONS Each team and/or individual improvement can benefit the whole organization. The data
suggests an overall positive work experience in which the engineers feel they have some say and
control in their work environment. Areas for improvement surfaced, giving everyone the
knowledge necessary to get started in a focused direction for greater positive impact. Improvement
in these targeted areas will influence the productivity of the current talent as well as the ability of
the company to retain and attract the best employees in the future.
The impressive rating of the department’s response through change indicates a level of
resilience that is something this department can share with other departments to help build the
overall organization’s stress management strategies. What we saw was consistent with the
response that was modeled in Figure 2, the Job Strain Model by Karasek. The scores for control
were very strong across the department. When demand is high, empowering employees with
control or latitude brings the worker into a more eustress situation where they can become actively
engaged. The flexibility of the managers as a group is evidenced by the positive result felt among
the whole group. Analysis using a larger sample size could be done to determine the root cause
driving these strengths.
Looking at the areas for improvement, demands and relationships take the focus. This could
indicate that if the managers strengthen relationships and clarify demands, change may be better
received by the engineers. We suggest collaborative meetings including all seven teams. Some
companies have regular outings, on company time, perhaps during lunch, so as to not add to the
long day. Additionally the department could add meetings where engineers can give management
positive feedback about what they found most helpful. Manager note taking could indicate that
employee feedback is valued. A suggestion box for anything from ideas for activities to
implementation suggestions would help those who currently feel too isolated to engage directly.
Since relationships are known to have a profound impact on the perception of a workplace by an
employee, building these may take some time and with individual effort. Utilizing the techniques
described in the discussion section to build these relationships should be a goal of the managers.
In the meantime, demands could also be more clearly defined by building relationships
through two-way communication. Relationship oriented management practices, suggest many
attitudes and habits of how to improve relationships with team members. A couple of the practical
recommendations can have a combined effect on clearer demand communication, improved

36
engagement through relationships as well as develop training support systems that work better for
the people who may be currently struggling to adjust.
Aligning people (1) from different levels of experience and backgrounds during training can
(5) give more emotional support and encouragement among peers, whose higher level needs (4) for
recognition and esteem can be built up as well in the process. We also suggest that manager’s
become better servant leaders (7) by taking a more active role, *listening carefully to understand
the employee need, and then *lending a hand, therefore being more in touch with *what is feasible
from a first hand perspective. (Note: the numbers reference Table 3)
Further study into the other parts of the overall organization to compare this Mechanical
Engineering department relative to their direct peers would be informative for management. The
whole organization could then be compared to the other larger organizations in the study. This
would increase the overall understanding of how this Mechanical Engineering department
approaches change management so that potentially the management can measure their movement
toward best practices.
Leadership is “the ability to inspire confidence and support among the people who are
needed to achieve organizational goals” (DuBrin, 2013). Making a thoughtful shift to an approach
that values “leadership” over just “management” can have a profound inspirational effect on those
in authority that can have a positive impact on the employees. A self-assessment test is one way a
manager can make that change in mindset.
Attached in Appendix D is an adjunct tool from the HSE. It is their management self-
assessment tool. This leads a manager through questions to measure areas of strength and
weakness in four categories as referenced in the previous chapter. They are: (1) Respectful and
responsible: Managing emotions and having integrity; (2) Managing and communicating existing
and future work; (3) Managing the individual within the team; and (4) Reasoning/Managing difficult
situations.
Our final recommendation may in fact be the first step: that management use this self-
assessment tool on an individual basis, understanding how very important their input is to
everyone who looks to them for leadership. As leaders, they can lead the charge to higher ground.

37
REFERENCES Albrecht, S. L. (2012). The influence of job, team and organizational level resources on
employee well-being, engagement, commitment and extra-role performance.
International Journal of Manpower 33. 7 pp840-853.
Aldrich, M. (2010). History of Workplace Safety in the United States, 1880-1970. Economic
History Association website. Posted 2010-02-05. Retrieved on May 21, 2013.
http://eh.net/encyclopedia/article/aldrich.safety.workplace.us
Bardwick, Judith M., Ph.D. (2008). One foot out the door, how to combat the psychological
recession that’s alienating employees and hurting American business. Amacom
Books.
Belkic, K. (2003). Occupational stress index: an approach derived from cognitive ergonomics
and brain research for clinical practice. Cambridge, GBR: Cambridge International
Science Publishing. pp vi.
Brockner, J. (1992). The escalation of commitment to a failing course of action: toward
theoretical progress. The Academy of Management Review, Vol. 17, No. 1 . Jan. pp.
39-61. Stable URL: http://www.jstor.org/stable/258647
Carlson, R. (1995). Build successful employee relationships. Transportation & Distribution,
Apr.
Chan, K. B. (2007). Work stress and coping among professionals. Ebrary Academic Complete.
Vol 11. Boston: Brill.
Cooley, R. W., (1979). The Journal of Politics, Vol. 41, No. 4. Nov., pp. 1226-1227. Cambridge
University Press on behalf of the Southern Political Science Association. Stable URL:
http://www.jstor.org/stable/2129747
38
Demerouti, E. (1999). Burnout: Eine Folge konkreter Arbeitsbedingungen bei Dienstleistungs-
und Produktionstätigkeiten. [Burnout: A consequence of specific working conditions
among human service, and production tasks].
Demerouti, E., Bakker, A. B., Nachreiner, F., Schaufeli, W. B., (2001) The Job Demands-
Resources model of burnout, June.
Demerouti, E., Nachreiner, F., (1999). Burnout as an outcome of job demands, job resources
and specific short-term consequences of strain. Paper presented at the Fifth
European Conference on Organizational Psychology and Health Care, Ghent,
Belgium. October.
DuBrin, A. J. (2013). Leadership: research findings, practice, and skills, Seventh Ed., South-
Western CENGAGE Learning. pp 114
Guidi S, Bagnara S, Fichera, G. P. (2012). Occup Med, London.. Apr;62(3):203-9. doi:
10.1093/occmed/kqs021. Epub 2012 Mar
Halper, S. V., Muser, C., Janneck, M.. (2012). Transformational leadership, work
engagement, and occupational success. Career Development International. 17. 7
pp663-682.
Harter, J. K., Schmidt, F. L., Keyes, C. L. M.. (2003). Well-being in the workplace and its
relationship to business outcomes; A review of Gallup studies. From “Flourishing:
The Positive Person and the Good Life “ Ch 9, pp. 205-224. originally published in the
American Psychological Association, Nov.
Health and Safety Executive. (2012). Retrieved December 20, 2012 from
www.hse.gov.uk/stress/standards/index.html.

39
Herington, C., Johnson, L. W., & Scott, D., (2007). Measuring firm-employee relationship
strength, Australian Marketing Journal 15. 3.
Hill, C. W. L. (2013). International business: competing in the global marketplace. Chapter
13, pp 430. McGraw-Hill Companies, Inc. New York, NY.
Hockey, G. R. J. (1993). Cognitive-energetical control mechanisms in the management of
work demands and psychological health. In A. Baddely & L. Weiskrantz (Eds.),
Attention: Selection, awareness, and control (pp. 328-345). Oxford, England:
Clarendon Press.
Hong, P. (2007). Role change of design engineers in product development. Journal of
Operations Management 24.1 63-79.
Human Resource Management International Digest, (2008). ISSN 0967-0734. Volume 16,
Issue 1, pp 35 – 37 .
Johnson J. V., Hall, E. M. (1988). Job strain, work place, social support and Cardiovascular
Disease; A cross-sectional study of a random sample of the Swedish working
population, American Journal of Public Health 78:1336-42
Karasek, R. A., Theorell, T. (1990). Healthy Work. New York: Basic Books, pg 167
Katzell, R. A., & Austin, J. T. (1992). From then to now: The development of industrial-
organizational psychology in the united states. Journal of Applied Psychology, 77(6),
803-835. doi: 10.1037/0021-9010.77.6.803 Link
Kotter, John, Change Management vs. Change Leadership – What is the Difference, Forbes
Magazine online, published July 12, 2011, retrieved 2/2/13.
Levinson, M. H. (2004). Managing organizational stress through general semantics. Et

40
Cetera, 61(2), pp245. Link
Lobban, R.K., Husted, J. & Farewell, V. T., (1998). A comparison of the effect of job demand,
decision latitude, role and supervisory style on self-reported job satisfaction.
McLeod, S. A. (2007). Maslow's Hierarchy of Needs - Simply Psychology. Retrieved on April
20, 2013 from http://www.simplypsychology.org/maslow.html
Merriam-Webster Dictionary website, retrieved November 3, 2012. http://www.merriam-
webster.com/dictionary/stress
Mulhern, B. (2009). Building Relationships: Corporate Report Jan.
Murray, C. J. L., Lopez, A. D. (Eds.). (1996). The global burden of disease; A comprehensive
assessment of mortality and disability from diseases, injuries, and risk factors in 1990
and projected to 2020, Cambridge, MA, Harvard School of Public Health.
Murthy, C. S. V. (2007). Change Management. New Delhi: Himalaya Publishing House.
O’Malley, M. N. (2000). Creating commitment: how to attract and retain talented employees
by building relationships that last. Aug.
Pace, A. (2013). The importance of being known: relationship building and employee
engagement go hand-in-hand. T+D Jan.
Parasuraman, S., Alutto, J. A., (1981). An Examination of the Organizational Antecedents of
Stressors at Work. Academy of Management Journal, Vol.24, No 1, Mar. p 48-67.
Tearle, P. (2002). Work related stress: communicable disease and public health / PHLS, 5(2), 174.
Tunwall, T. K., Stutzman, M. L. (2012). Sustainability of the workforce: human resource
influence. GSTF Journal of Law and Social Sciences (JLSS) 1. 1 Jan. 133-138.
Tutorvista.com (2013).
41
Wargborn, C. (2008). Managing motivation in organizations: why employee relationship
management matters, Dissertacoes de mestrado.
Wettemann, R. (2005). Efficiency gains: can you prove it? Optimize 4.5. 45.

42
APPENDIX A: Confidence Calculations
A: Percent confidence calculation from Tutorvista.com:
Step 1: Observe the value of given mean and standard deviation for a respective
sample size to find the confidence interval at a particular confidence level for mean
percent.
Step 2: Apply the Confidence Interval Formula:
If(n ≥ 30)
Confidence Interval = x ± z α 2 × (σ n √ )
If(n < 30)
Confidence Interval = x ± t α 2 × (σ n √ )
Where,
x = Sample Mean
σ = Standard Deviation
α = 1 - (Confidence Level 100 )
Z α 2 = Value of the z-table
t α 2 = Value of the t-table.
z and t tables can be found in statistical mathematics books

43
APPENDIX B: Survey Questions
1. Disclosure/Waiver Dear Mechanical Engineering Team Member, We recognize that work-related stress is a health and safety issue and acknowledge the importance of tackling the causes of stress in the workplace. Your employer has agreed to cooperate with this small-scale case study and they welcome information that can assist them in making your workplace better. We do not ask for any information that would identify you. The survey is designed to find out how you feel about various aspects of working conditions here on a regular basis. If everyone participates, we will get reliable results that will be shared with employees and managers. Please read the instructions carefully, and complete your questionnaire as soon as you can. Your participation is completely voluntary, you may choose to not answer all questions, and you can withdraw from the study at any time. The attached questionnaire consists of 78 multiple choice questions. The questionnaire will take approximately 20 minutes to complete. For each question, tick the box that most accurately reflects your job as it is presently. If you have any questions concerning completion of the survey please contact Alicia Manley at [email protected] or by phone at **********. Please include the words “WPI survey” in the subject line and I will respond within one business day. You may also call WPI's Institutional Review Board (Professor Kent Rissmiller, Tel. 508-831-5019, Email [email protected] ) or the University Compliance officer Michael J. Curley, Tel. 508-831-6919, Email: [email protected] ) Thank you for participating. Sincerely, Alicia Manley Survey Coordinator WPI Interactive Qualifying Project Select "Yes" if you have read and agree with the above terms. At any time you can close your browser and end the Survey.
2. Were you working in the Mechanical Product Development (MPD) organization during the transition to Microsoft Office 365? Yes No 3. please find the name below that corresponds to the manager you worked under at the time of the Outlook change. This code will be converted to a color output to maintain annonymity. Enter the two digit code into the box provided below.

44
MANAGER CODE red orange yellow green blue indigo violet
Following Questions have responses of
Never
Seldom
Sometimes
Consistently
Often
4. PRESENT WORK ENVIRONMENT Please answer the following 35 questions based on your everyday experience in the workplace. 5. I can decide when to take a break 6. Different groups at work demand things from me that are hard to combine 7. I know how to go about getting my job done 8. I am subject to personal harassment in the form of unkind words or behavior 9. I have unachievable deadlines 10. If work gets difficult, my colleagues will help me 11. I am given supportive feedback on the work I do 12. I have to work very intensively 13. I have a say in my own work speed 14. I am clear what my duties and responsibilities are 15. I have to neglect some tasks because I have too much to do 16. I am clear about the goals and objectives for my department 17. There is friction or anger between colleagues 18. I have a choice in deciding how I do my work 19. I am unable to take sufficient breaks 20. I understand how my work fits into the overall aim of the organization

45
21. I am pressured to work long hours 22. I have a choice in deciding what I do at work 23. I have to work very fast 24. I am subject to bullying at work 25. I have unrealistic time pressures 26. I can rely on my manager to help me out with a work problem 27. I get help and support I need from colleagues 28. I have some say over the way I work 29. I have sufficient opportunities to question managers about change at work 30. I receive the respect at work I deserve from my colleagues 31. Staff are always consulted about change at work 32. I can talk to my manager about something that has upset or annoyed me about work 33. My working time can be flexible 34. My colleagues are willing to listen to my work related problems 35. When changes are made at work I am clear how they will work out in practice 36. I am supported through emotionally demanding work 37. Relationships at work are strained 38. My manager encourages me at work 39. DURING A TIME OF CHANGE You have recently gone through a change to the version of Microsoft Outlook. We are trying to understand how this change affected your job during the transition. This series of questions should be answered in the context of that change. I find that I use Outlook 365… 40. Adapting to the change affected my efficiency for a period of time 41. I feel more efficient now with Outlook 365 than I did before 42. I found the types of training offered for the change were effective 43. The training was appropriately timed with respect to the time of implementing the change (i.e. It happened at the right time so that I could utilize and remember the training when I had to start using the updated software) 44. Now, please answer the rest of the questions specifically thinking about the change to Microsoft Outlook 360. During the change, I was clear what was expected of me at work

46
45. During the change, I could decide when to take a break 46. Different groups at work demanded things from me that were hard to combine during the change 47. During the change, I knew how to go about getting my job done 48. During the change, I was subject to personal harassment in the form of unkind words or behavior 49. During the change to 365, I had unachievable deadlines 50. If work got difficult during the change, my colleagues would help me 51. During the change, I was given supportive feedback on the work I did 52. I had to work very intensively during the change to Outlook 360
53. I had a say in my own work speed during the change 54. I was clear what my duties and responsibilities were during the change 55. During the change, I had to neglect some tasks because I had too much to do 56. I was clear about the goals and objectives for my department during the change 57. There was friction or anger between colleagues because of the change 58. I had a choice in deciding how I did my work during the change 59. During the change, I was unable to take sufficient breaks 60. During the change, I understood how my work fit into the overall aim of the organization 61. I was pressured to work long hours during the change 62. During the change, I had a choice in deciding what I did at work 63. I had to work very fast during the change 64. I was subject to bullying at work during the change 65. During the change, I had unrealistic time pressures 66. I could rely on my manager to help me out with a work problem during the change 67. I got the help and support I needed from colleagues during the change 68. I had some say over the way I worked during the change 69. I had sufficient opportunities to question managers about the Outlook 365 change at work 70. During the change, I received the respect at work I deserved from my colleagues 71. During the change, staff were consulted about change at work 72. During the change, I could talk to my manager about something that had upset or annoyed me about work 73. During the change, my working time could be flexible 74. During the change, my colleagues were willing to listen to my work-related problems

47
75. While this change was made at work, I was clear how this change would work out in practice 76. During the change, I was supported through emotionally demanding work 77. During the change, relationships at work were strained 78. During the change, my manager encouraged me at work 79. If you want to SUBMIT this survey, choose "yes". If you want to NOT submit, and OPT OUT, choose "no" or close browser now.

48
APPENDIX C: A Case Study
Consumer Electronics Technology:
Greg Shannon and Alicia Manley
Abstract
Consumer electronics companies need changes in technology to increase productivity. During the transition
to the new or upgraded technology, implementation strategies play a key role in a successful outcome.
Manager style and communication methods have been studied to understand ongoing best practices for a
management team. There have been continuous improvements on Change Management since the early
1990s (Murthy, 2007). We studied the manager’s effect on change success in a single 46 person department
inside a large Consumer Electronics company with a change management analysis tool (HSE) utilized industry
wide. We then propose enhancements to the organization in areas of weakness.
What is known about the topic?
While a lot has been written about change management and about management best practices, correlation
of the two is not widely discussed. A manager’s ability to be a leader in change management rather than a
bystander to it will be a factor for success (Pace, 2013).
What does this paper add?
This paper investigates the ability to use the HSE tool to measure the perceived differences in manager styles
caused by a technology upgrade implementation that affected the whole organization. The paper also looks
at the change management component of work satisfaction.
What are the implications for the management team?
The management team can look at these data as an aggregate account of the perceptions and feelings of the
staff and what they can do to improve management of future technology changes. The management can
take stock in the positive results shown in the study. The management should continue with the style they
have shown and use these results to guide them in their ongoing principles of management.
Consumer Electronics Technology Change The benefits
An organization’s ability to increase worker productivity over an extended period of time is a key
driver in a company’s long term success. To increase worker productivity, changes in technology
are one factor that helps in achieving this goal. Technology changes need to be consistent with

49
company growth. The organization that is capable of withstanding the stress imposed on it by the
change will have an advantage over its rivals. Technology change will help create this advantage.
The difficulties
Change induces stress. This stress is not only imparted on the individuals that are directly affected
but also the management team and the whole organization. In times of stress a team has to adjust
and continue the work set forth by the company to maintain a successful plan. If the organization
stays stagnant in their operations they will lose the competitive edge over time and be forced into
unwanted types of change to survive.
The case study
Utilizing an industry-standard stress management survey tool, we broke down a Mechanical
Design department into manager teams and looked at the differences in results through day to day
or “business as usual” operations and compared that to the results through a technical change. The
change we chose was the group’s move from Microsoft Office (2004) to Microsoft Office 365. The
department as a whole was studied in regard to the Microsoft office changes and compared to the
“business as usual” state. Each manager team was studied to determine if there were large
differences in the staff’s perceptions of the managers’ styles or if there was a consistent message
being delivered to the staff from the management team.
Methods
A forty-six person Mechanical Design department with three levels of employees was
surveyed. The Engineering Manager led a team of seven team managers. Each team manager had
approximately five direct reports. The survey responses were anonymous so as to not target any
individual or manager for improvement or praise but to show differences between management
styles and as an aggregate group.
The survey used is known as the Health and Safety Executive (HSE) stress management
survey. It compares the output of the survey to one hundred and thirty-six other organizations. It
also puts the strategic questions into seven different known stressor categories. The categories
are:
Demands: issues such as workload, work patterns and the work environment
Control: how much say the person has in the way they do their work

50
Support (Manager and Peer): encouragement, sponsorship and resources provided by the
organization, management and colleagues.
Relationships: promoting positive, working to avoid conflict and dealing with unacceptable
behavior.
Role: whether people understand their role within the organization and whether the organization
ensures that they do not have conflicting roles.
Change: how organization change (large or small) is managed and communicated in the
organization. (HSE Management Standards 2013). The ranking and color coding of the output from
this survey can be seen in Figure 4.
The HSE analysis tool was used twice. The first set of questions was related to business as
usual practices within the department. The second round of questions were the same as the first
but tailored around the discussion of this technical change.
Findings
The survey outputs scores in each of the seven categories and sets a short term goal and a
long term goal for the organization to strive for. The categories are related to stress factors and
have been determined to be integral with worker satisfaction and company success (HSE, 2008). In
our study the sample size was 35 people, we received a response rate of 82.8%. This provides a
confidence level of 95% (Tutorvista.com, 2013). The results for each individual manager are more
susceptible to variation because of such a small sample size. Managers are denoted by assigning a
color label to each individual. For the “indigo” manager only one subordinate responded so that
manager was not evaluated separately. The red manager had three people respond all others had
five or more. This surveyed department is small and therefore a large response rate was vital to
increased statistical relevance.
Listed below are tables of data extracted from the HSE tool. These tables illustrate the
results of the department compared to the questions answered by the other 136 organizations for
both the business as usual and for the technical change. Figure 1 shows the output of the
aggregate group and how it ranked compared to the other 136 organizations in the business as
usual survey.

51
The department as a whole is doing very well in five out of seven categories. This should be
highlighted and further work could be done to understand why the organization did so well. We will
discuss the two categories Demand and Relationship in the discussion and recommendations
sections. Areas that the group may want to look at developing.
The next output of results is based on the same survey taken but in relation to the upgrade
to Microsoft 365. The questions were tailored to reflect the management practices during the time
of change. All of the respondents answered both sets of questions as part of the survey. They were

52
unaware that the second set of questions existed until they reached that section of the survey. The
results from the aggregate group through the change can be seen in Figure 2.
The group as a whole is again doing well compared to industry. Note that Demands and
Relationships are the areas that indicate a need for improvement. Role has dropped in output
goodness as well, from very well to good. The other interesting fact about this is that all categories
have decreased a small amount in goodness factor provided by HSE except control. These changes
are small though and do not offer great statistical backing. What, if anything, should be done to
improve on areas that suggest there is such a need? This will be examined further in the
conclusions and recommendations to follow.
When comparing each manager to the others many interesting results are shown. The color
definition in the table helps to highlight the differences from manager to manager. The scale and
the actual results could change significantly with small changes in the survey answers The
difference in changing one persons response in the survey can alter the results in any one category
for that manager by up to 11%. . This causes a concern in judging this with too much detail. Figure
3 depicts the comparison results from each manager. The red manager had three responses while
each other manager had five responses. Also shown is the standard deviation of the output. This
clearly shows that the greatest difference in manager effect is in Change during the day to day
operations. During the change the greatest effect a manager has is in Support. The tightest
grouping of results from manager to manager are Relationships for both day to day operation and
change. Although this shows that the managers are sending a consistent message, the message is
perceived in a less than optimum way by the whole group. The blue manager is rated the overall
highest across all categories in both business as usual and the change. The red manager with only
three respondents is rated the overall lowest. Statistically the red manager results are not at a
good confidence level 55% to draw any real conclusions. Assuming five employees per manager
with only sixty percent reporting the error in reporting grows to +/- 40%. This is important to note
and causes us to focus on the aggregate change results rather than the management style as the
most relevant at this size. Two out of the seven managers do not have sufficient data to allow them
to be statistically compared to the others. It is of interest that the other five are grouped well
together in all stressor categories except the business as usual Change category. Here there are
perceived differences from manager to manager.

53
Discussion
To truly understand how these questions relate to the stress management categories we
must look at the HSE survey analysis tool and utilize their wealth of knowledge in this area. In the
table are the parameters as based on the benchmark study.
We will comment on the categories that are most interesting: Demand, Control, Role and
Relationships. For further study into the other categories one can look at the complete survey
results listed in the appendix and the HSE Management survey analysis tool manual. (HSE, 2013)
Analysis of our survey data is compared to the other 136 organizations. Figure 4 depicts the
percentile grading for each stressor category and the cutoff limits for each category’s goodness
rating. For example to be rated red in the control category the average answer would have to be
under 3.224 in the scale from 1 to 5 where 1 is equal to seldom and 5 equal to consistently in the
survey. This would be equivalent to scoring below the 20th percentile of the population of all 136
companies (HSE Management Analysis Tool Manual 2013).
The department shows areas of real strength in Control, Support, Role and Change.
Although Demand is a category that shows red the group is only a half a point improvement away
from a very good status. Relationships are a key area of focus for the group to improve.
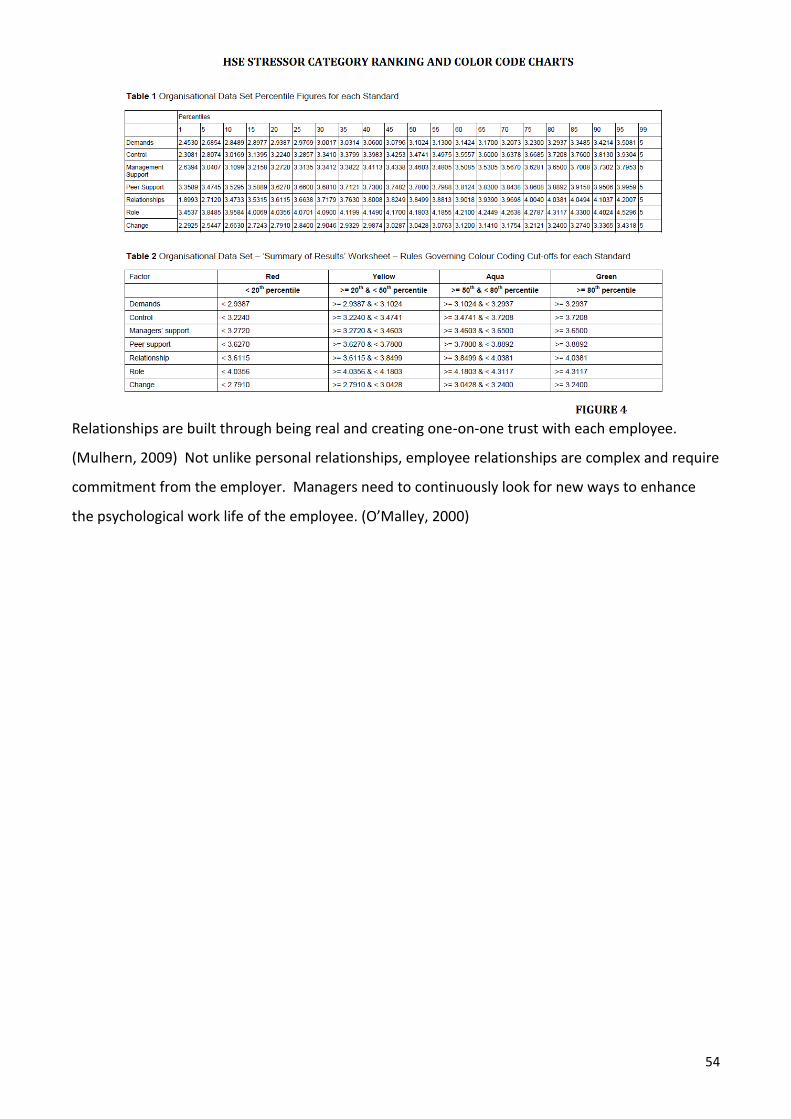
54
Relationships are built through being real and creating one-on-one trust with each employee.
(Mulhern, 2009) Not unlike personal relationships, employee relationships are complex and require
commitment from the employer. Managers need to continuously look for new ways to enhance
the psychological work life of the employee. (O’Malley, 2000)

55
Conclusion and Recommendations
Relationships, as seen in the literature review have a profound impact in the perception of
an employee. These relationships are built over time and with effort. Utilizing the techniques
described in the discussion section to build these relationships should be a goal of the managers.
The impressive rating of the department through change is something this department can share
with other departments to help build the overall organizations change management strategies.
Analysis could be done to determine what is driving these strengths and break it down to the root
cause. This would be interesting to see if there are direct correlations with the survey results and
change management techniques.
In the meantime, demands could be more clearly defined by building relationships through
two-way communication. Relationship oriented management practices, as expounded on in
“Leadership: Research Findings, Practice and Skills” by Andrew J. DuBrin, suggest many attitudes
and habits of how to improve relationships with team members. One way that involves task-
oriented management behavior as well, is organizing collaborative sub groups to work together. By
insisting on collaboration, relationships among peers increase. Interestingly, the first step to
collaboration is perfectly aligned with our subject.
“First identify the high-value business outcome desired, such as accelerating new product
development, before seeking collaboration technologies.
Practical ways to be more relational are by:
1. Aligning people
2. Openness to worker options
3. Creating inspiration and visibility
4. Satisfying higher level needs*****
5. Giving emotional support and encouragement
6. Promoting principles and values
7. Being a servant leader by
*Placing service before self-interest
*Listening first to express confidence in others
*Inspiring trust by being trustworthy
*Focusing on what is feasible to accomplish
56
*Lending a hand
*Providing emotional healing
Further study to compare the Mechanical Engineers of this department to their direct peers
could prove valuable to managers. The whole organization could then be compared to the other
larger organizations within the corporation. The most important outcome of this study is that the
conversation has begun. Employees and managers can continue to keep the lines of
communication open and flowing in both directions. Being mindful of how this change
management is handled now and how it can move toward best practices. Ultimately, the
Mechanical Engineering department can reflect on the analysis and judge for themselves what
improvements will be most beneficial to all. The data suggests an overall positive work experience
in which the engineers feel they have some input and control over their work environment. The
areas that need improvement can be targeted to improve the productivity and longevity of
employment of the current high quality staff while also helping the company continue to attract
more great engineers in the future.

57
APPENDIX D: Stress Management Competency Indicator Tool
The excerpt below is to give the framework of the management self-assessment tool and introduce the
wealth of resources that link to this website for workplace improvement. The entire tool can be found on the
website along with a large amount of other helpful aids.
http://www.hse.gov.uk/stress/standards/downloads.htm
Stress management competency indicator
tool How effective are you at preventing and reducing stress in your
staff?
Use the following questionnaire to assess your behaviour
The ‘Stress management competency indicator tool’ in this document is designed to allow you to assess whether the behaviours identified as effective for preventing and reducing stress at work are part of your management repertoire or not. The aim is to help you to reflect upon your own behaviour and management style.
The next four pages look in turn at four behavioural areas identified as being important for managers to prevent and reduce stress in their staff. You are asked to consider a range of specific manager behaviours and put a tick in the column that most closely represents your level of agreement with each statement. You can then use the instructions at the end of each table to calculate your score on the behavioural area covered by that table. (NB the term ‘team members’ is used to refer to people who report directly to you/who you manage.)
The overall assessment process on page 6 allows you to use the scores from the questionnaire to assess your effectiveness in preventing and reducing stress in your staff. It allows you to identify whether any of the areas are Development Needs for you, or whether you are Reasonable or Effective in each area.
Some tips and ideas on how you can use your assessment to improve your effectiveness in preventing and reducing stress at work, through your management behaviour, are provided on page 7. Finally, page 8 provides a summary of the competencies required to prevent and reduce stress at work.
For more information on the framework of ‘Management competencies for preventing and reducing stress at work’ and the key messages for managers, please refer to the guidance leaflet available for download at:
www.cipd.co.uk/subjects/health/stress/_strwklnmgr.htm.
To read more about how the ‘Management competencies for preventing and reducing stress at work’ were identified, and how the stress management competency indicator tool was developed, please refer to the
full research report available for download at: www.hse.gov.uk/ research/rrhtm/rr633.htm.
WHAT DO I DO NEXT? In order to improve your effectiveness at preventing and reducing stress at work, we suggest the following

58
steps: 1 Look for the behavioural area in which you received the lowest score and focus on this as top priority. If you have identified several Development Needs or areas that you would like to move into the ‘Effective’ zone, take them one at a time – you don’t have to change everything at once! 2 Look back at the questionnaire to explore what behaviours are relevant to this area. On the following page is also a summary of the four behavioural areas, and outlines of the key behaviours in each. Identify the ones that you indicated you do least and consider what you need to do in order to show these behaviours more often. It may simply be a matter of being more aware of how you are behaving at the moment and making small shifts to add the relevant additional (or alternative) behaviours to your repertoire. 3 You may find it helpful to check out with your team whether they would find it helpful for you to show more of these particular behaviours and how that would be different from what you do at the moment. You could ask them to give you feedback on how you are doing. 4 If you feel that it will be difficult for you to make these behavioural changes on your own, consider seeking support. For example, informal coaching or support from your own manager and/or from the HR department might be helpful; you might find it helpful to get some formal coaching or mentoring; and/or you might want to attend a training course to develop the relevant skills. 5 Finally, in addition to the information provided on the Health and Safety Executive website, you may find the following useful for gaining more information about managing stress and mental health at work: ␣ SHIFT Line Manager’s Resource: for practical guidance on managing and supporting people with mental health problems in the workplace: www.shift.org.uk ␣ Mental Health Foundation and Mind websites: for information about mental health issues: www.mentalhealth.org.uk and www.mind.org.uk ␣ Information and resources may also be available through your employer, for example from: Occupational Health, Employee Assistance Programme/Welfare Service and Human Resources.
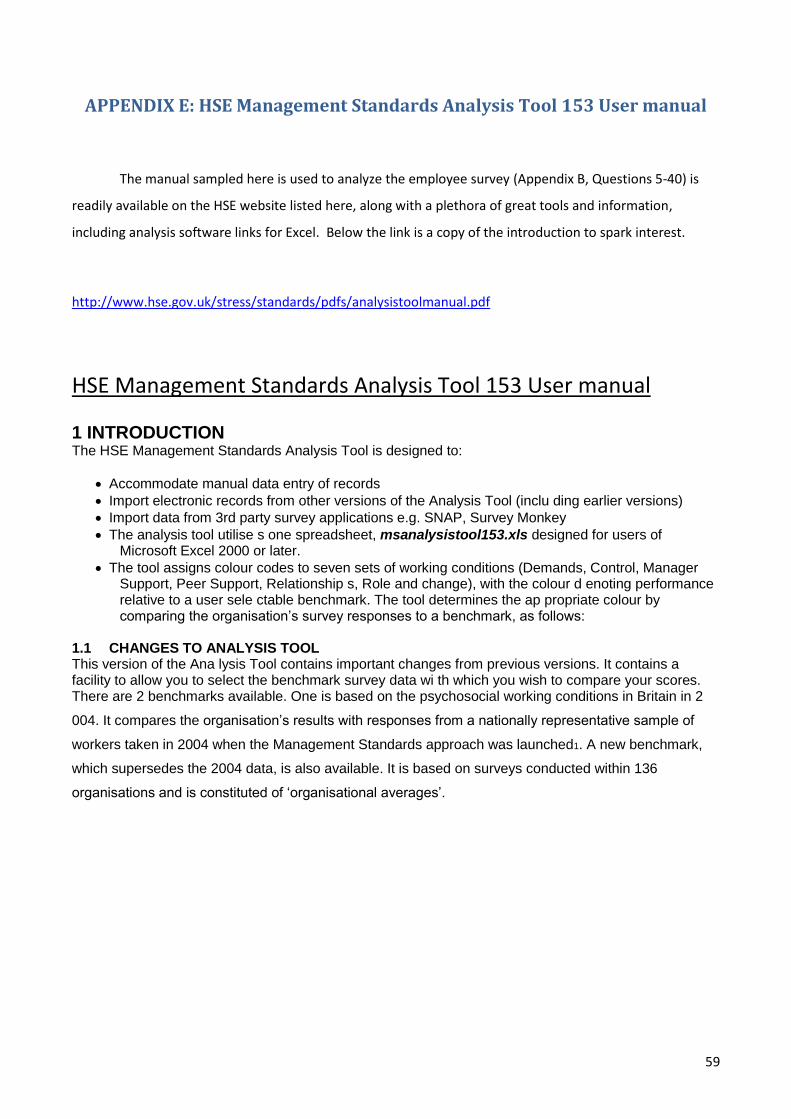
59
APPENDIX E: HSE Management Standards Analysis Tool 153 User manual
The manual sampled here is used to analyze the employee survey (Appendix B, Questions 5-40) is
readily available on the HSE website listed here, along with a plethora of great tools and information,
including analysis software links for Excel. Below the link is a copy of the introduction to spark interest.
http://www.hse.gov.uk/stress/standards/pdfs/analysistoolmanual.pdf
HSE Management Standards Analysis Tool 153 User manual
1 INTRODUCTION The HSE Management Standards Analysis Tool is designed to:
Accommodate manual data entry of records
Import electronic records from other versions of the Analysis Tool (inclu ding earlier versions)
Import data from 3rd party survey applications e.g. SNAP, Survey Monkey
The analysis tool utilise s one spreadsheet, msanalysistool153.xls designed for users of Microsoft Excel 2000 or later.
The tool assigns colour codes to seven sets of working conditions (Demands, Control, Manager Support, Peer Support, Relationship s, Role and change), with the colour d enoting performance relative to a user sele ctable benchmark. The tool determines the ap propriate colour by comparing the organisation’s survey responses to a benchmark, as follows:
1.1 CHANGES TO ANALYSIS TOOL This version of the Ana lysis Tool contains important changes from previous versions. It contains a facility to allow you to select the benchmark survey data wi th which you wish to compare your scores. There are 2 benchmarks available. One is based on the psychosocial working conditions in Britain in 2
004. It compares the organisation’s results with responses from a nationally representative sample of
workers taken in 2004 when the Management Standards approach was launched1. A new benchmark,
which supersedes the 2004 data, is also available. It is based on surveys conducted within 136
organisations and is constituted of ‘organisational averages’.