Embed Size (px)
Citation preview

Change Control Notification
31 March 2018

Contents
Page 1
Change Control Notification for the year ended 31 March 2018
Section 1 Introduction to the Change Control Notification ..................................................................................................................................................................................... 2
Section 1.1 Introduction ...................................................................................................................................................................................................................................... 3
Section 1.2 Overall structure of the report ......................................................................................................................................................................................................... 3
Section 2 Impact of each of the changes on the figures at the level of the Markets and Technical Areas ............................................................................................................. 4
Section 2.1 Total revenue impact of each of the changes on the figures at the level of the Markets and Technical Areas for published 2016/17 RFS figures ....................... 5
Section 2.2 Total CCA operating cost impact of each of the changes on the figures at the level of the Markets and Technical Areas for published 2016/17 RFS figures ...... 7
Section 2.3 Total MCE impact of each of the changes on the figures at the level of the Markets and Technical Areas for published 2016/17 RFS figures ............................. 9
Section 2.4 Total returns impact of each of the changes on the figures at the level of the Markets and Technical Areas for published 2016/17 RFS figures ....................... 11
Section 3 Explanation of methodology changes .................................................................................................................................................................................................... 13
Appendix ................................................................................................................................................................................................................................................................ 42
Appendix 1 - Template for change control provided in Ofcom’s Regulatory Financial Reporting Final Statement (May 2014): ..................................................................... 43
Section 1 – Introduction to the Change Control Notification
Page 2
Section 1
Introduction to the Change Control Notification
Section 1 – Introduction to the Change Control Notification
Page 3
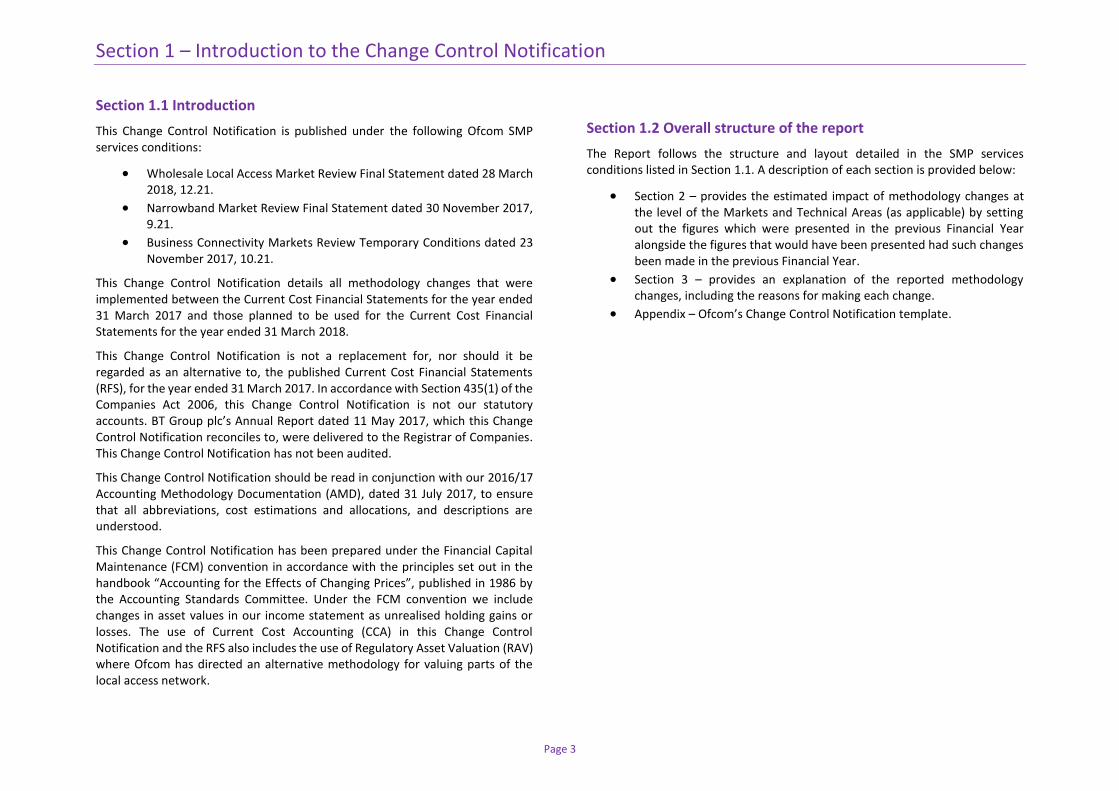
Section 1.1 Introduction
This Change Control Notification is published under the following Ofcom SMP services conditions:
Wholesale Local Access Market Review Final Statement dated 28 March 2018, 12.21.
Narrowband Market Review Final Statement dated 30 November 2017, 9.21.
Business Connectivity Markets Review Temporary Conditions dated 23 November 2017, 10.21.
This Change Control Notification details all methodology changes that were implemented between the Current Cost Financial Statements for the year ended 31 March 2017 and those planned to be used for the Current Cost Financial Statements for the year ended 31 March 2018.
This Change Control Notification is not a replacement for, nor should it be regarded as an alternative to, the published Current Cost Financial Statements (RFS), for the year ended 31 March 2017. In accordance with Section 435(1) of the Companies Act 2006, this Change Control Notification is not our statutory accounts. BT Group plc’s Annual Report dated 11 May 2017, which this Change Control Notification reconciles to, were delivered to the Registrar of Companies. This Change Control Notification has not been audited.
This Change Control Notification should be read in conjunction with our 2016/17 Accounting Methodology Documentation (AMD), dated 31 July 2017, to ensure that all abbreviations, cost estimations and allocations, and descriptions are understood.
This Change Control Notification has been prepared under the Financial Capital Maintenance (FCM) convention in accordance with the principles set out in the handbook “Accounting for the Effects of Changing Prices”, published in 1986 by the Accounting Standards Committee. Under the FCM convention we include changes in asset values in our income statement as unrealised holding gains or losses. The use of Current Cost Accounting (CCA) in this Change Control Notification and the RFS also includes the use of Regulatory Asset Valuation (RAV) where Ofcom has directed an alternative methodology for valuing parts of the local access network.
Section 1.2 Overall structure of the report
The Report follows the structure and layout detailed in the SMP services conditions listed in Section 1.1. A description of each section is provided below:
Section 2 – provides the estimated impact of methodology changes at the level of the Markets and Technical Areas (as applicable) by setting out the figures which were presented in the previous Financial Year alongside the figures that would have been presented had such changes been made in the previous Financial Year.
Section 3 – provides an explanation of the reported methodology changes, including the reasons for making each change.
Appendix – Ofcom’s Change Control Notification template.

Section 2 – Impact of each of the changes on the figures at the level of the Markets and Technical Areas
Page 4
Section 2
Impact of each of the changes on the figures at the level of the Markets and Technical Areas
Section 2 – Impact of each of the changes on the figures at the level of the Markets and Technical Areas
Page 5
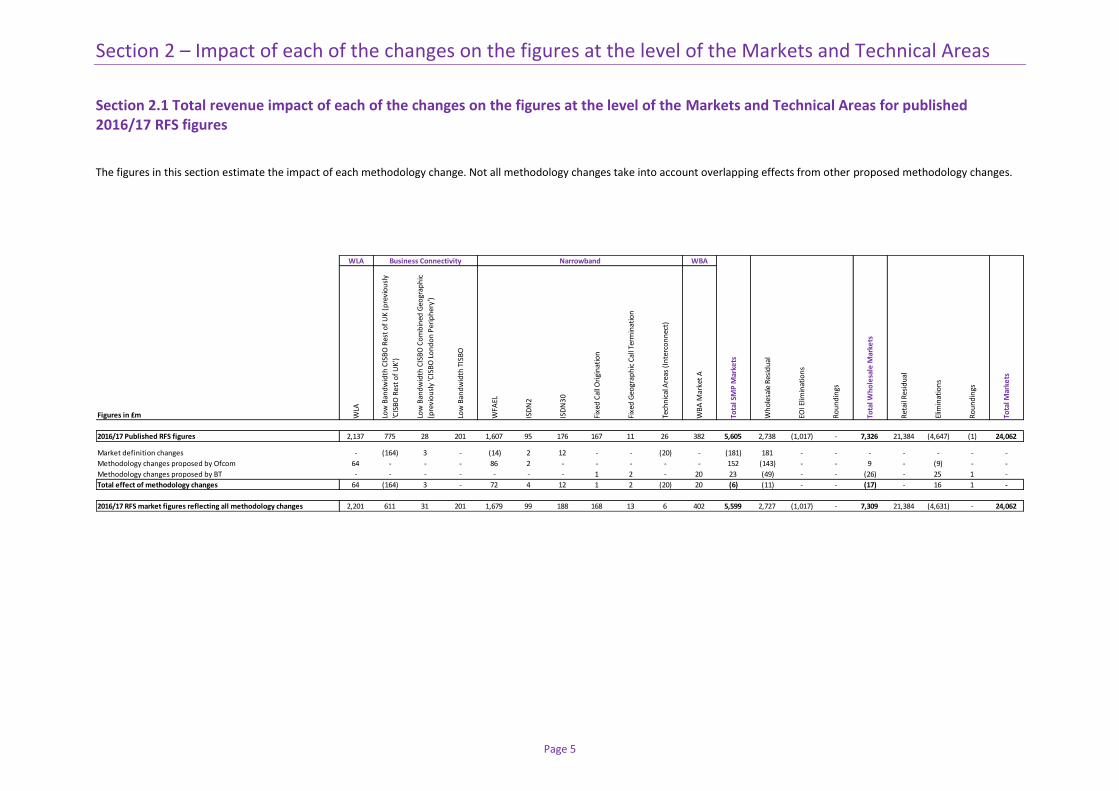
Section 2.1 Total revenue impact of each of the changes on the figures at the level of the Markets and Technical Areas for published 2016/17 RFS figures
The figures in this section estimate the impact of each methodology change. Not all methodology changes take into account overlapping effects from other proposed methodology changes.
WLA WBA
Figures in £m WLA
Low
Ban
dw
idth
CIS
BO
Res
t o
f U
K (
pre
vio
usl
y
'CIS
BO
Res
t o
f U
K')
Low
Ban
dw
idth
CIS
BO
Co
mb
ined
Geo
grap
hic
(pre
vio
usl
y 'C
ISB
O L
on
do
n P
erip
her
y')
Low
Ban
dw
idth
TIS
BO
WFA
EL
ISD
N2
ISD
N3
0
Fixe
d C
all O
rigi
nat
ion
Fixe
d G
eogr
aph
ic C
all T
erm
inat
ion
Tech
nic
al A
reas
(In
terc
on
nec
t)
WB
A M
arke
t A
Tota
l SM
P M
arke
ts
Wh
ole
sale
Res
idu
al
EOI E
limin
atio
ns
Ro
un
din
gs
Tota
l Wh
ole
sale
Mar
kets
Ret
ail R
esid
ual
Elim
inat
ion
s
Ro
un
din
gs
Tota
l Mar
kets
2016/17 Published RFS figures 2,137 775 28 201 1,607 95 176 167 11 26 382 5,605 2,738 (1,017) - 7,326 21,384 (4,647) (1) 24,062
Market definition changes - (164) 3 - (14) 2 12 - - (20) - (181) 181 - - - - - - -
Methodology changes proposed by Ofcom 64 - - - 86 2 - - - - - 152 (143) - - 9 - (9) - -
Methodology changes proposed by BT - - - - - - - 1 2 - 20 23 (49) - - (26) - 25 1 -
Total effect of methodology changes 64 (164) 3 - 72 4 12 1 2 (20) 20 (6) (11) - - (17) - 16 1 -
2016/17 RFS market figures reflecting all methodology changes 2,201 611 31 201 1,679 99 188 168 13 6 402 5,599 2,727 (1,017) - 7,309 21,384 (4,631) - 24,062
Business Connectivity Narrowband
Section 2 – Impact of each of the changes on the figures at the level of the Markets and Technical Areas
Page 6
WLA WBA
Figures in £m WLA
Low
Ban
dw
idth
CIS
BO
Res
t o
f U
K (
pre
vio
usl
y
'CIS
BO
Res
t o
f U
K')
Low
Ban
dw
idth
CIS
BO
Co
mb
ined
Geo
grap
hic
(pre
vio
usl
y 'C
ISB
O L
on
do
n P
erip
her
y')
Low
Ban
dw
idth
TIS
BO
WFA
EL
ISD
N2
ISD
N3
0
Fixe
d C
all O
rigi
nat
ion
Fixe
d G
eogr
aph
ic C
all T
erm
inat
ion
Tech
nic
al A
reas
(In
terc
on
nec
t)
WB
A M
arke
t A
Tota
l SM
P M
arke
ts
Wh
ole
sale
Res
idu
al
EOI E
limin
atio
ns
Ro
un
din
gs
Tota
l Wh
ole
sale
Mar
kets
Ret
ail R
esid
ual
Elim
inat
ion
s
Ro
un
din
gs
Tota
l Mar
kets
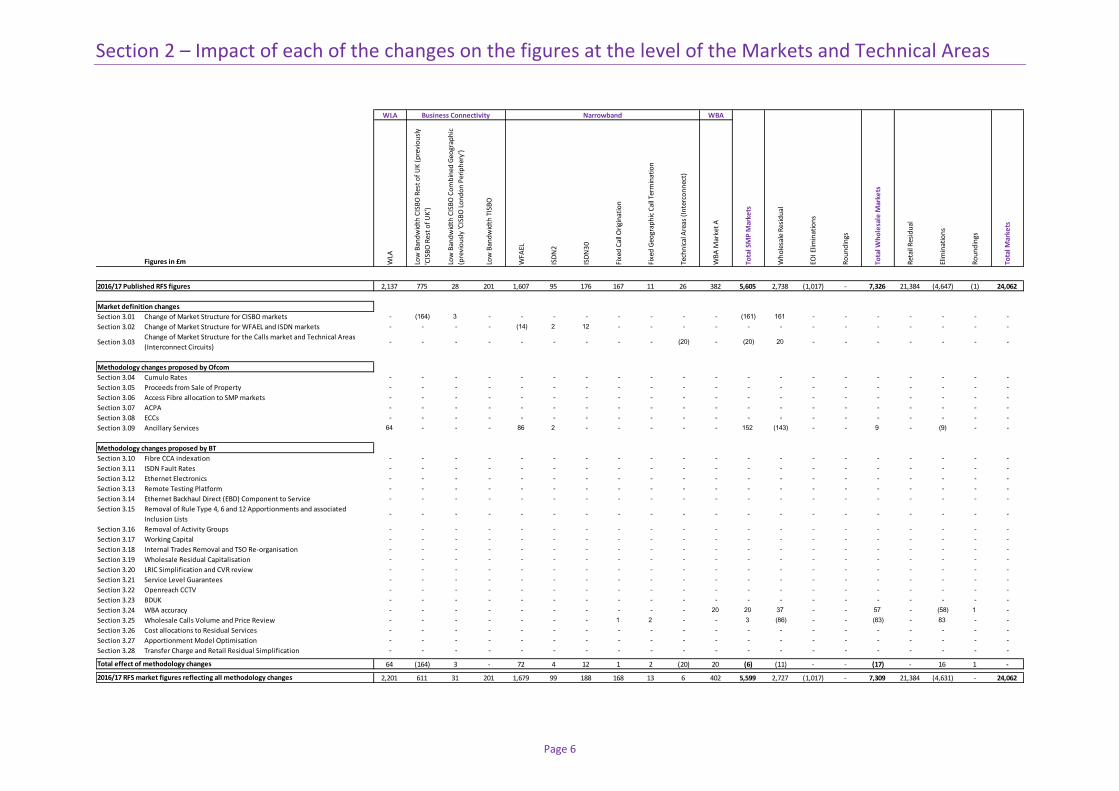
2,137 775 28 201 1,607 95 176 167 11 26 382 5,605 2,738 (1,017) - 7,326 21,384 (4,647) (1) 24,062
Market definition changes
Section 3.01 Change of Market Structure for CISBO markets - (164) 3 - - - - - - - - (161) 161 - - - - - - -
Section 3.02 Change of Market Structure for WFAEL and ISDN markets - - - - (14) 2 12 - - - - - - - - - - - - -
Section 3.03Change of Market Structure for the Calls market and Technical Areas
(Interconnect Circuits)- - - - - - - - - (20) - (20) 20 - - - - - - -
Methodology changes proposed by Ofcom
Section 3.04 Cumulo Rates - - - - - - - - - - - - - - - - - - - -
Section 3.05 Proceeds from Sale of Property - - - - - - - - - - - - - - - - - - - -
Section 3.06 Access Fibre allocation to SMP markets - - - - - - - - - - - - - - - - - - - -
Section 3.07 ACPA - - - - - - - - - - - - - - - - - - - -
Section 3.08 ECCs - - - - - - - - - - - - - - - - - - - -
Section 3.09 Ancillary Services 64 - - - 86 2 - - - - - 152 (143) - - 9 - (9) - -
Methodology changes proposed by BT
Section 3.10 Fibre CCA indexation - - - - - - - - - - - - - - - - - - - -
Section 3.11 ISDN Fault Rates - - - - - - - - - - - - - - - - - - - -
Section 3.12 Ethernet Electronics - - - - - - - - - - - - - - - - - - - -
Section 3.13 Remote Testing Platform - - - - - - - - - - - - - - - - - - - -
Section 3.14 Ethernet Backhaul Direct (EBD) Component to Service - - - - - - - - - - - - - - - - - - - -
Section 3.15 Removal of Rule Type 4, 6 and 12 Apportionments and associated
Inclusion Lists- - - - - - - - - - - - - - - - - - - -
Section 3.16 Removal of Activity Groups - - - - - - - - - - - - - - - - - - - -
Section 3.17 Working Capital - - - - - - - - - - - - - - - - - - - -
Section 3.18 Internal Trades Removal and TSO Re-organisation - - - - - - - - - - - - - - - - - - - -
Section 3.19 Wholesale Residual Capitalisation - - - - - - - - - - - - - - - - - - - -
Section 3.20 LRIC Simplification and CVR review - - - - - - - - - - - - - - - - - - - -
Section 3.21 Service Level Guarantees - - - - - - - - - - - - - - - - - - - -
Section 3.22 Openreach CCTV - - - - - - - - - - - - - - - - - - - -
Section 3.23 BDUK - - - - - - - - - - - - - - - - - - - -
Section 3.24 WBA accuracy - - - - - - - - - - 20 20 37 - - 57 - (58) 1 -
Section 3.25 Wholesale Calls Volume and Price Review - - - - - - - 1 2 - - 3 (86) - - (83) - 83 - -
Section 3.26 Cost allocations to Residual Services - - - - - - - - - - - - - - - - - - - -
Section 3.27 Apportionment Model Optimisation - - - - - - - - - - - - - - - - - - - -
Section 3.28 Transfer Charge and Retail Residual Simplification - - - - - - - - - - - - - - - - - - - -
64 (164) 3 - 72 4 12 1 2 (20) 20 (6) (11) - - (17) - 16 1 -
2,201 611 31 201 1,679 99 188 168 13 6 402 5,599 2,727 (1,017) - 7,309 21,384 (4,631) - 24,062
Business Connectivity Narrowband
2016/17 Published RFS figures
Total effect of methodology changes
2016/17 RFS market figures reflecting all methodology changes
Section 2 – Impact of each of the changes on the figures at the level of the Markets and Technical Areas
Page 7
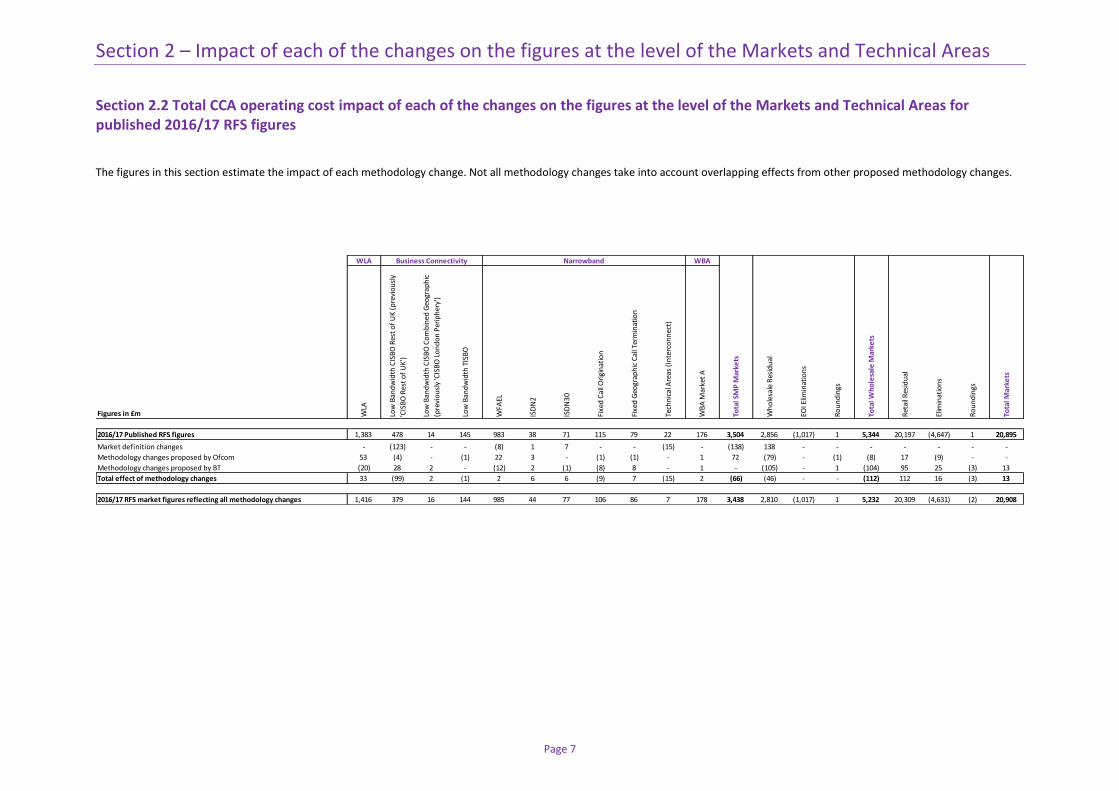
Section 2.2 Total CCA operating cost impact of each of the changes on the figures at the level of the Markets and Technical Areas for published 2016/17 RFS figures
The figures in this section estimate the impact of each methodology change. Not all methodology changes take into account overlapping effects from other proposed methodology changes.
WLA WBA
Figures in £m WLA
Low
Ban
dw
idth
CIS
BO
Res
t o
f U
K (
pre
vio
usl
y
'CIS
BO
Res
t o
f U
K')
Low
Ban
dw
idth
CIS
BO
Co
mb
ined
Geo
grap
hic
(pre
vio
usl
y 'C
ISB
O L
on
do
n P
erip
her
y')
Low
Ban
dw
idth
TIS
BO
WFA
EL
ISD
N2
ISD
N3
0
Fixe
d C
all O
rigi
nat
ion
Fixe
d G
eogr
aph
ic C
all T
erm
inat
ion
Tech
nic
al A
reas
(In
terc
on
nec
t)
WB
A M
arke
t A
Tota
l SM
P M
arke
ts
Wh
ole
sale
Res
idu
al
EOI E
limin
atio
ns
Ro
un
din
gs
Tota
l Wh
ole
sale
Mar
kets
Ret
ail R
esid
ual
Elim
inat
ion
s
Ro
un
din
gs
Tota
l Mar
kets
2016/17 Published RFS figures 1,383 478 14 145 983 38 71 115 79 22 176 3,504 2,856 (1,017) 1 5,344 20,197 (4,647) 1 20,895
Market definition changes - (123) - - (8) 1 7 - - (15) - (138) 138 - - - - - - -
Methodology changes proposed by Ofcom 53 (4) - (1) 22 3 - (1) (1) - 1 72 (79) - (1) (8) 17 (9) - -
Methodology changes proposed by BT (20) 28 2 - (12) 2 (1) (8) 8 - 1 - (105) - 1 (104) 95 25 (3) 13
Total effect of methodology changes 33 (99) 2 (1) 2 6 6 (9) 7 (15) 2 (66) (46) - - (112) 112 16 (3) 13
2016/17 RFS market figures reflecting all methodology changes 1,416 379 16 144 985 44 77 106 86 7 178 3,438 2,810 (1,017) 1 5,232 20,309 (4,631) (2) 20,908
Business Connectivity Narrowband

Section 2 – Impact of each of the changes on the figures at the level of the Markets and Technical Areas
Page 8
WLA WBA
Figures in £m WLA
Low
Ban
dw
idth
CIS
BO
Res
t o
f U
K (
pre
vio
usl
y
'CIS
BO
Res
t o
f U
K')
Low
Ban
dw
idth
CIS
BO
Co
mb
ined
Geo
grap
hic
(pre
vio
usl
y 'C
ISB
O L
on
do
n P
erip
her
y')
Low
Ban
dw
idth
TIS
BO
WFA
EL
ISD
N2
ISD
N3
0
Fixe
d C
all O
rigi
nat
ion
Fixe
d G
eogr
aph
ic C
all T
erm
inat
ion
Tech
nic
al A
reas
(In
terc
on
nec
t)
WB
A M
arke
t A
Tota
l SM
P M
arke
ts
Wh
ole
sale
Res
idu
al
EOI E
limin
atio
ns
Ro
un
din
gs
Tota
l Wh
ole
sale
Mar
kets
Ret
ail R
esid
ual
Elim
inat
ion
s
Ro
un
din
gs
Tota
l Mar
kets
1,383 478 14 145 983 38 71 115 79 22 176 3,504 2,856 (1,017) 1 5,344 20,197 (4,647) 1 20,895
Market definition changes
Section 3.01 Change of Market Structure for CISBO markets - (123) - - - - - - - - - (123) 123 - - - - - - -
Section 3.02 Change of Market Structure for WFAEL and ISDN markets - - - - (8) 1 7 - - - - - - - - - - - - -
Section 3.03Change of Market Structure for the Calls market and Technical Areas
(Interconnect Circuits)- - - - - - - - - (15) - (15) 15 - - - - - - -
Methodology changes proposed by Ofcom
Section 3.04 Cumulo Rates - - - - - - - - - - - - - - - - - - - -
Section 3.05 Proceeds from Sale of Property (1) - - (1) (1) - - (1) (1) - - (5) (2) - (1) (8) 8 - - -
Section 3.06 Access Fibre allocation to SMP markets 6 (4) - - - - (1) - - - - 1 (1) - - - - - - -
Section 3.07 ACPA - - - - - - - - - - - - - - - - - - - -
Section 3.08 ECCs - - - - - - - - - - - - - - - - - - - -
Section 3.09 Ancillary Services 48 - - - 23 3 1 - - - 1 76 (76) - - - 9 (9) - -
Methodology changes proposed by BT
Section 3.10 Fibre CCA indexation (5) 8 - 2 (2) 1 (1) - - - - 3 10 - - 13 - - - 13
Section 3.11 ISDN Fault Rates - - - - - 1 - - - - - 1 - - (1) - - - - -
Section 3.12 Ethernet Electronics - 29 2 - - - - - - - - 31 (31) - - - - - - -
Section 3.13 Remote Testing Platform - (10) - - - - - - - - - (10) (1) - - (11) 12 - (1) -
Section 3.14 Ethernet Backhaul Direct (EBD) Component to Service - 8 - - - - - - - - - 8 (9) - 1 - - - - -
Section 3.15 Removal of Rule Type 4, 6 and 12 Apportionments and associated Inclusion
Lists(15) (4) - (1) (13) - - (3) - - - (36) (5) - - (41) 42 - (1) -
Section 3.16 Removal of Activity Groups - (3) - (1) 3 - - - - - - (1) 1 - 1 1 (1) - - -
Section 3.17 Working Capital - - - - - - - - - - - - - - - - - - - -
Section 3.18 Internal Trades Removal and TSO Re-organisation - - - - - - - - - - - - (65) - - (65) 65 - - -
Section 3.19 Wholesale Residual Capitalisation - - - - - - - - - - - - - - - - - - - -
Section 3.20 LRIC Simplification and CVR review - - - - - - - - - - - - - - - - - - - -
Section 3.21 Service Level Guarantees - - - - - - - - - - - - - - - - - - - -
Section 3.22 Openreach CCTV - - - - - - - - - - - - - - - - - - - -
Section 3.23 BDUK - - - - - - - - - - - - - - - - - - - -
Section 3.24 WBA accuracy - - - - - - - - - - - - - - - - 58 (58) - -
Section 3.25 Wholesale Calls Volume and Price Review - - - - - - - (5) 8 - - 3 (3) - - - (83) 83 - -
Section 3.26 Cost allocations to Residual Services - - - - - - - - - - 1 1 (3) - - (2) 2 - - -
Section 3.27 Apportionment Model Optimisation - - - - - - - - - - - - - - - - - - - -
Section 3.28 Transfer Charge and Retail Residual Simplification - - - - - - - - - - - - 1 - - 1 - - (1) -
33 (99) 2 (1) 2 6 6 (9) 7 (15) 2 (66) (46) - - (112) 112 16 (3) 13
1,416 379 16 144 985 44 77 106 86 7 178 3,438 2,810 (1,017) 1 5,232 20,309 (4,631) (2) 20,908
Business Connectivity Narrowband
2016/17 Published RFS figures
Total effect of methodology changes
2016/17 RFS market figures reflecting all methodology changes
Section 2 – Impact of each of the changes on the figures at the level of the Markets and Technical Areas
Page 9
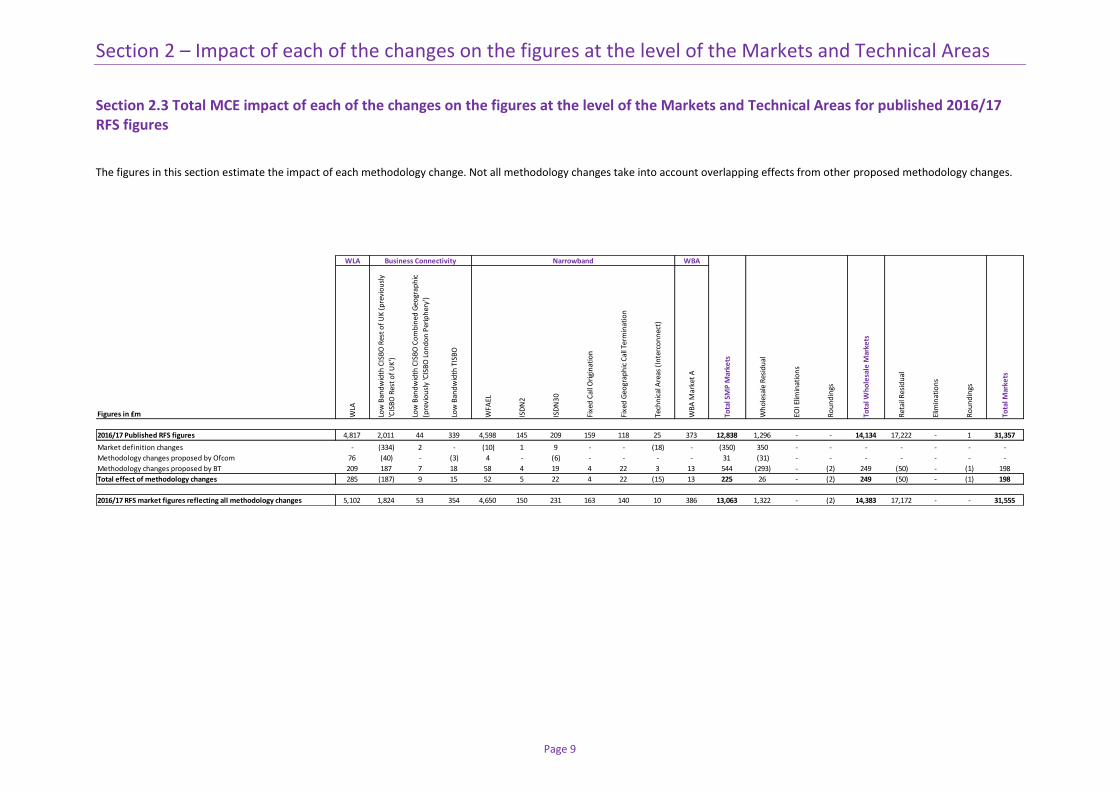
Section 2.3 Total MCE impact of each of the changes on the figures at the level of the Markets and Technical Areas for published 2016/17 RFS figures
The figures in this section estimate the impact of each methodology change. Not all methodology changes take into account overlapping effects from other proposed methodology changes.
WLA WBA
Figures in £m WLA
Low
Ban
dw
idth
CIS
BO
Res
t o
f U
K (
pre
vio
usl
y
'CIS
BO
Res
t o
f U
K')
Low
Ban
dw
idth
CIS
BO
Co
mb
ined
Geo
grap
hic
(pre
vio
usl
y 'C
ISB
O L
on
do
n P
erip
her
y')
Low
Ban
dw
idth
TIS
BO
WFA
EL
ISD
N2
ISD
N3
0
Fixe
d C
all O
rigi
nat
ion
Fixe
d G
eogr
aph
ic C
all T
erm
inat
ion
Tech
nic
al A
reas
(In
terc
on
nec
t)
WB
A M
arke
t A
Tota
l SM
P M
arke
ts
Wh
ole
sale
Res
idu
al
EOI E
limin
atio
ns
Ro
un
din
gs
Tota
l Wh
ole
sale
Mar
kets
Ret
ail R
esid
ual
Elim
inat
ion
s
Ro
un
din
gs
Tota
l Mar
kets
2016/17 Published RFS figures 4,817 2,011 44 339 4,598 145 209 159 118 25 373 12,838 1,296 - - 14,134 17,222 - 1 31,357
Market definition changes - (334) 2 - (10) 1 9 - - (18) - (350) 350 - - - - - - -
Methodology changes proposed by Ofcom 76 (40) - (3) 4 - (6) - - - - 31 (31) - - - - - - -
Methodology changes proposed by BT 209 187 7 18 58 4 19 4 22 3 13 544 (293) - (2) 249 (50) - (1) 198
Total effect of methodology changes 285 (187) 9 15 52 5 22 4 22 (15) 13 225 26 - (2) 249 (50) - (1) 198
2016/17 RFS market figures reflecting all methodology changes 5,102 1,824 53 354 4,650 150 231 163 140 10 386 13,063 1,322 - (2) 14,383 17,172 - - 31,555
Business Connectivity Narrowband

Section 2 – Impact of each of the changes on the figures at the level of the Markets and Technical Areas
Page 10
WLA WBA
Figures in £m WLA
Low
Ban
dw
idth
CIS
BO
Res
t o
f U
K (
pre
vio
usl
y
'CIS
BO
Res
t o
f U
K')
Low
Ban
dw
idth
CIS
BO
Co
mb
ined
Geo
grap
hic
(pre
vio
usl
y 'C
ISB
O L
on
do
n P
erip
her
y')
Low
Ban
dw
idth
TIS
BO
WFA
EL
ISD
N2
ISD
N3
0
Fixe
d C
all O
rigi
nat
ion
Fixe
d G
eogr
aph
ic C
all T
erm
inat
ion
Tech
nic
al A
reas
(In
terc
on
nec
t)
WB
A M
arke
t A
Tota
l SM
P M
arke
ts
Wh
ole
sale
Res
idu
al
EOI E
limin
atio
ns
Ro
un
din
gs
Tota
l Wh
ole
sale
Mar
kets
Ret
ail R
esid
ual
Elim
inat
ion
s
Ro
un
din
gs
Tota
l Mar
kets
4,817 2,011 44 339 4,598 145 209 159 118 25 373 12,838 1,296 - - 14,134 17,222 - 1 31,357
Market definition changes
Section 3.01 Change of Market Structure for CISBO markets - (334) 2 - - - - - - - - (332) 332 - - - - - - -
Section 3.02 Change of Market Structure for WFAEL and ISDN markets - - - - (10) 1 9 - - - - - - - - - - - - -
Section 3.03Change of Market Structure for the Calls market and Technical Areas
(Interconnect Circuits)- - - - - - - - - (18) - (18) 18 - - - - - - -
Methodology changes proposed by Ofcom
Section 3.04 Cumulo Rates - - - - - - - - - - - - - - - - - - - -
Section 3.05 Proceeds from Sale of Property - - - - - - - - - - - - - - - - - - - -
Section 3.06 Access Fibre allocation to SMP markets 53 (40) - (3) - - (6) - - - - 4 (4) - - - - - - -
Section 3.07 ACPA - - - - - - - - - - - - - - - - - - - -
Section 3.08 ECCs - - - - - - - - - - - - - - - - - - - -
Section 3.09 Ancillary Services 23 - - - 4 - - - - - - 27 (27) - - - - - - -
Methodology changes proposed by BT
Section 3.10 Fibre CCA indexation 60 128 4 3 (4) (1) 9 - - - (4) 195 (3) - - 192 6 - - 198
Section 3.11 ISDN Fault Rates - - - - - - - - - - - - - - - - - - - -
Section 3.12 Ethernet Electronics - 42 3 - - - - - - - - 45 (44) - (1) - - - - -
Section 3.13 Remote Testing Platform - - - - - - - - - - - - - - - - - - - -
Section 3.14 Ethernet Backhaul Direct (EBD) Component to Service - 17 1 - - - - - - - - 18 (17) - (1) - - - - -
Section 3.15 Removal of Rule Type 4, 6 and 12 Apportionments and associated
Inclusion Lists17 (11) (1) 12 39 4 6 14 10 2 8 100 79 - (1) 178 (177) - (1) -
Section 3.16 Removal of Activity Groups (6) (2) - (2) (6) - - (1) (1) - - (18) - - (1) (19) 19 - - -
Section 3.17 Working Capital 141 12 - 5 29 1 4 5 2 (1) 7 205 (301) - - (96) 95 - 1 -
Section 3.18 Internal Trades Removal and TSO Re-organisation - - - - - - - - - - - - (6) - - (6) 7 - (1) -
Section 3.19 Wholesale Residual Capitalisation - - - - - - - - - - - - - - - - - - - -
Section 3.20 LRIC Simplification and CVR review - - - - - - - - - - - - - - - - - - - -
Section 3.21 Service Level Guarantees - - - - - - - - - - - - - - - - - - - -
Section 3.22 Openreach CCTV - - - - - - - - - - - - - - - - - - - -
Section 3.23 BDUK (3) 1 - - - - - - - - - (2) - - 2 - - - - -
Section 3.24 WBA accuracy - - - - - - - - - - 2 2 (2) - - - - - - -
Section 3.25 Wholesale Calls Volume and Price Review - - - - - - - (14) 11 2 - (1) 1 - - - - - - -
Section 3.26 Cost allocations to Residual Services - - - - - - - - - - - - - - - - - - - -
Section 3.27 Apportionment Model Optimisation - - - - - - - - - - - - - - - - - - - -
Section 3.28 Transfer Charge and Retail Residual Simplification - - - - - - - - - - - - - - - - - - - -
Total effect of methodology changes 285 (187) 9 15 52 5 22 4 22 (15) 13 225 26 - (2) 249 (50) - (1) 198
2016/17 RFS market figures reflecting all methodology changes 5,102 1,824 53 354 4,650 150 231 163 140 10 386 13,063 1,322 - (2) 14,383 17,172 - - 31,555
Business Connectivity Narrowband
2016/17 Published RFS figures
Section 2 – Impact of each of the changes on the figures at the level of the Markets and Technical Areas
Page 11
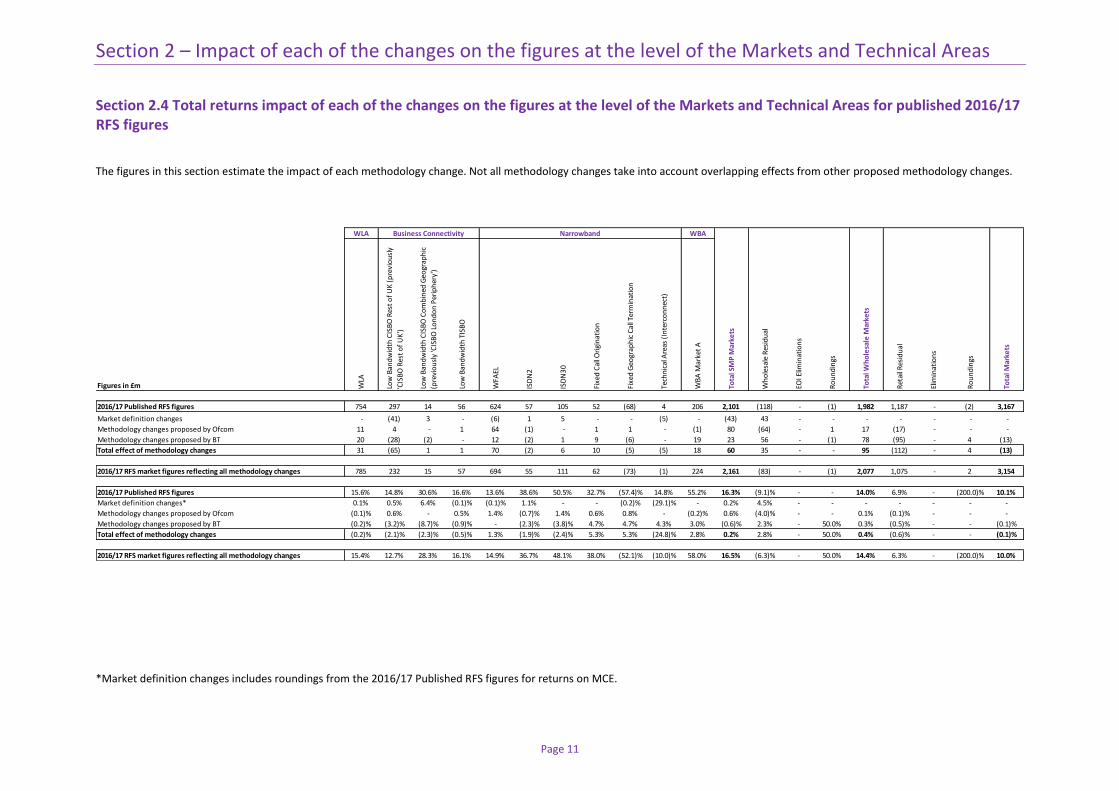
Section 2.4 Total returns impact of each of the changes on the figures at the level of the Markets and Technical Areas for published 2016/17 RFS figures
The figures in this section estimate the impact of each methodology change. Not all methodology changes take into account overlapping effects from other proposed methodology changes.
*Market definition changes includes roundings from the 2016/17 Published RFS figures for returns on MCE.
WLA WBA
Figures in £m WLA
Low
Ban
dw
idth
CIS
BO
Res
t o
f U
K (
pre
vio
usl
y
'CIS
BO
Res
t o
f U
K')
Low
Ban
dw
idth
CIS
BO
Co
mb
ined
Geo
grap
hic
(pre
vio
usl
y 'C
ISB
O L
on
do
n P
erip
her
y')
Low
Ban
dw
idth
TIS
BO
WFA
EL
ISD
N2
ISD
N3
0
Fixe
d C
all O
rigi
nat
ion
Fixe
d G
eogr
aph
ic C
all T
erm
inat
ion
Tech
nic
al A
reas
(In
terc
on
nec
t)
WB
A M
arke
t A
Tota
l SM
P M
arke
ts
Wh
ole
sale
Res
idu
al
EOI E
limin
atio
ns
Ro
un
din
gs
Tota
l Wh
ole
sale
Mar
kets
Ret
ail R
esid
ual
Elim
inat
ion
s
Ro
un
din
gs
Tota
l Mar
kets
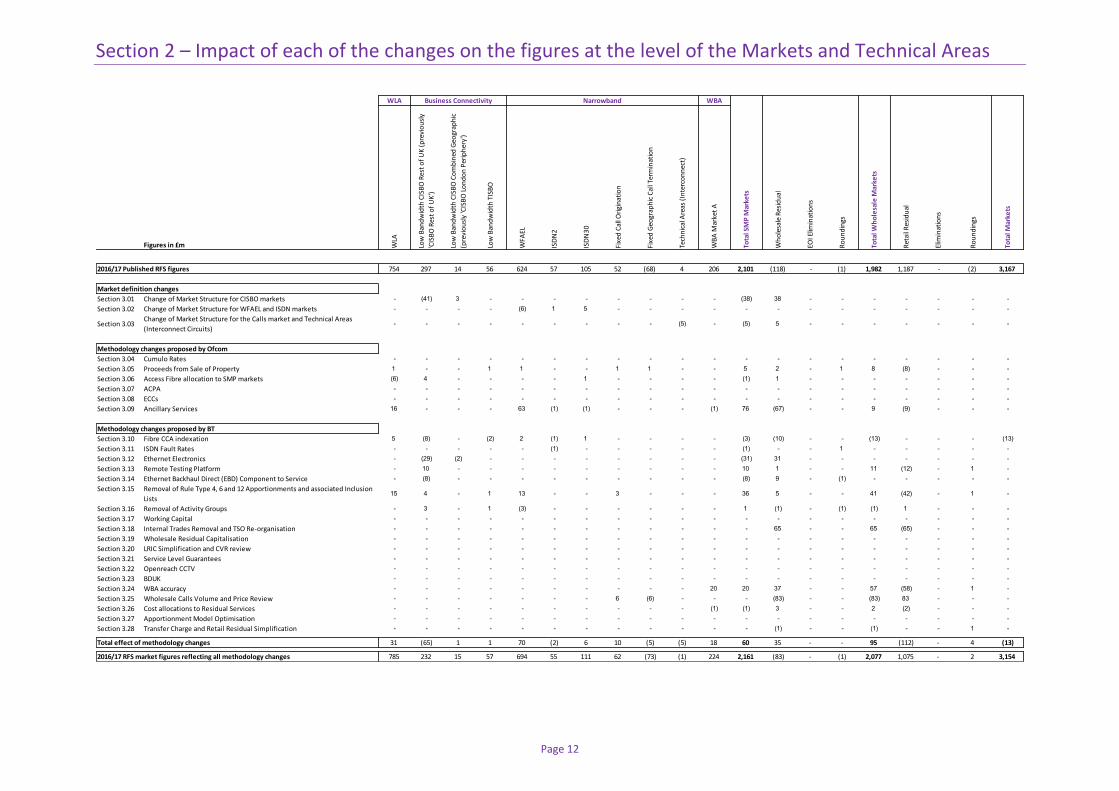
2016/17 Published RFS figures 754 297 14 56 624 57 105 52 (68) 4 206 2,101 (118) - (1) 1,982 1,187 - (2) 3,167
Market definition changes - (41) 3 - (6) 1 5 - - (5) - (43) 43 - - - - - - -
Methodology changes proposed by Ofcom 11 4 - 1 64 (1) - 1 1 - (1) 80 (64) - 1 17 (17) - - -
Methodology changes proposed by BT 20 (28) (2) - 12 (2) 1 9 (6) - 19 23 56 - (1) 78 (95) - 4 (13)
Total effect of methodology changes 31 (65) 1 1 70 (2) 6 10 (5) (5) 18 60 35 - - 95 (112) - 4 (13)
2016/17 RFS market figures reflecting all methodology changes 785 232 15 57 694 55 111 62 (73) (1) 224 2,161 (83) - (1) 2,077 1,075 - 2 3,154
2016/17 Published RFS figures 15.6% 14.8% 30.6% 16.6% 13.6% 38.6% 50.5% 32.7% (57.4)% 14.8% 55.2% 16.3% (9.1)% - - 14.0% 6.9% - (200.0)% 10.1%
Market definition changes* 0.1% 0.5% 6.4% (0.1)% (0.1)% 1.1% - - (0.2)% (29.1)% - 0.2% 4.5% - - - - - - -
Methodology changes proposed by Ofcom (0.1)% 0.6% - 0.5% 1.4% (0.7)% 1.4% 0.6% 0.8% - (0.2)% 0.6% (4.0)% - - 0.1% (0.1)% - - -
Methodology changes proposed by BT (0.2)% (3.2)% (8.7)% (0.9)% - (2.3)% (3.8)% 4.7% 4.7% 4.3% 3.0% (0.6)% 2.3% - 50.0% 0.3% (0.5)% - - (0.1)%
Total effect of methodology changes (0.2)% (2.1)% (2.3)% (0.5)% 1.3% (1.9)% (2.4)% 5.3% 5.3% (24.8)% 2.8% 0.2% 2.8% - 50.0% 0.4% (0.6)% - - (0.1)%
2016/17 RFS market figures reflecting all methodology changes 15.4% 12.7% 28.3% 16.1% 14.9% 36.7% 48.1% 38.0% (52.1)% (10.0)% 58.0% 16.5% (6.3)% - 50.0% 14.4% 6.3% - (200.0)% 10.0%
Business Connectivity Narrowband
Section 2 – Impact of each of the changes on the figures at the level of the Markets and Technical Areas
Page 12
WLA WBA
Figures in £m WLA
Low
Ban
dw
idth
CIS
BO
Res
t o
f U
K (
pre
vio
usl
y
'CIS
BO
Res
t o
f U
K')
Low
Ban
dw
idth
CIS
BO
Co
mb
ined
Geo
grap
hic
(pre
vio
usl
y 'C
ISB
O L
on
do
n P
erip
her
y')
Low
Ban
dw
idth
TIS
BO
WFA
EL
ISD
N2
ISD
N3
0
Fixe
d C
all O
rigi
nat
ion
Fixe
d G
eogr
aph
ic C
all T
erm
inat
ion
Tech
nic
al A
reas
(In
terc
on
nec
t)
WB
A M
arke
t A
Tota
l SM
P M
arke
ts
Wh
ole
sale
Res
idu
al
EOI E
limin
atio
ns
Ro
un
din
gs
Tota
l Wh
ole
sale
Mar
kets
Ret
ail R
esid
ual
Elim
inat
ion
s
Ro
un
din
gs
Tota
l Mar
kets
754 297 14 56 624 57 105 52 (68) 4 206 2,101 (118) - (1) 1,982 1,187 - (2) 3,167
Market definition changes
Section 3.01 Change of Market Structure for CISBO markets - (41) 3 - - - - - - - - (38) 38 - - - - - - -
Section 3.02 Change of Market Structure for WFAEL and ISDN markets - - - - (6) 1 5 - - - - - - - - - - - - -
Section 3.03Change of Market Structure for the Calls market and Technical Areas
(Interconnect Circuits)- - - - - - - - - (5) - (5) 5 - - - - - - -
Methodology changes proposed by Ofcom
Section 3.04 Cumulo Rates - - - - - - - - - - - - - - - - - - - -
Section 3.05 Proceeds from Sale of Property 1 - - 1 1 - - 1 1 - - 5 2 - 1 8 (8) - - -
Section 3.06 Access Fibre allocation to SMP markets (6) 4 - - - - 1 - - - - (1) 1 - - - - - - -
Section 3.07 ACPA - - - - - - - - - - - - - - - - - - - -
Section 3.08 ECCs - - - - - - - - - - - - - - - - - - - -
Section 3.09 Ancillary Services 16 - - - 63 (1) (1) - - - (1) 76 (67) - - 9 (9) - - -
Methodology changes proposed by BT
Section 3.10 Fibre CCA indexation 5 (8) - (2) 2 (1) 1 - - - - (3) (10) - - (13) - - - (13)
Section 3.11 ISDN Fault Rates - - - - - (1) - - - - - (1) - - 1 - - - - -
Section 3.12 Ethernet Electronics - (29) (2) - - - - - - - - (31) 31 - - - - - - -
Section 3.13 Remote Testing Platform - 10 - - - - - - - - - 10 1 - - 11 (12) - 1 -
Section 3.14 Ethernet Backhaul Direct (EBD) Component to Service - (8) - - - - - - - - - (8) 9 - (1) - - - - -
Section 3.15 Removal of Rule Type 4, 6 and 12 Apportionments and associated Inclusion
Lists15 4 - 1 13 - - 3 - - - 36 5 - - 41 (42) - 1 -
Section 3.16 Removal of Activity Groups - 3 - 1 (3) - - - - - - 1 (1) - (1) (1) 1 - - -
Section 3.17 Working Capital - - - - - - - - - - - - - - - - - - - -
Section 3.18 Internal Trades Removal and TSO Re-organisation - - - - - - - - - - - - 65 - - 65 (65) - - -
Section 3.19 Wholesale Residual Capitalisation - - - - - - - - - - - - - - - - - - - -
Section 3.20 LRIC Simplification and CVR review - - - - - - - - - - - - - - - - - - - -
Section 3.21 Service Level Guarantees - - - - - - - - - - - - - - - - - - - -
Section 3.22 Openreach CCTV - - - - - - - - - - - - - - - - - - - -
Section 3.23 BDUK - - - - - - - - - - - - - - - - - - - -
Section 3.24 WBA accuracy - - - - - - - - - - 20 20 37 - - 57 (58) - 1 -
Section 3.25 Wholesale Calls Volume and Price Review - - - - - - - 6 (6) - - - (83) - - (83) 83 - - -
Section 3.26 Cost allocations to Residual Services - - - - - - - - - - (1) (1) 3 - - 2 (2) - - -
Section 3.27 Apportionment Model Optimisation - - - - - - - - - - - - - - - - - - - -
Section 3.28 Transfer Charge and Retail Residual Simplification - - - - - - - - - - - - (1) - - (1) - - 1 -
Total effect of methodology changes 31 (65) 1 1 70 (2) 6 10 (5) (5) 18 60 35 - - 95 (112) - 4 (13)
2016/17 RFS market figures reflecting all methodology changes 785 232 15 57 694 55 111 62 (73) (1) 224 2,161 (83) - (1) 2,077 1,075 - 2 3,154
Business Connectivity Narrowband
2016/17 Published RFS figures

Section 3 – Explanation of methodology changes
Page 13
Section 3
Explanation of methodology changes
Section 3 – Explanation of methodology changes
Page 14
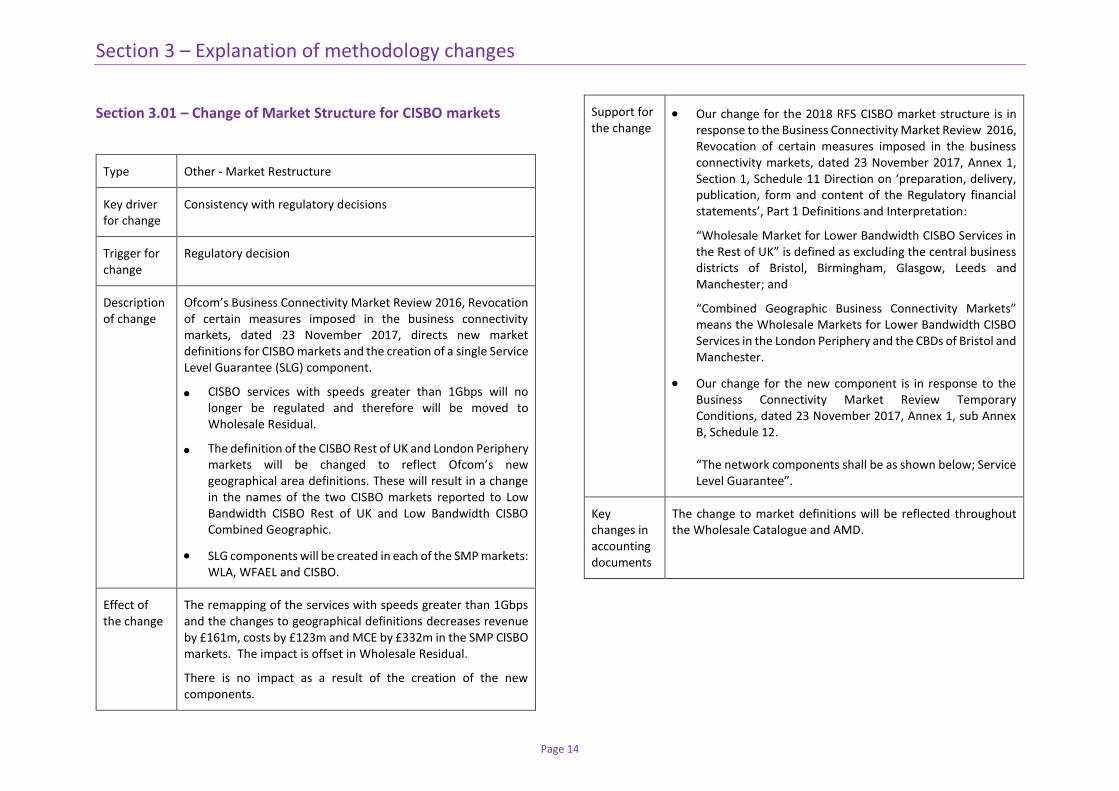
Section 3.01 – Change of Market Structure for CISBO markets
Type Other - Market Restructure
Key driver for change
Consistency with regulatory decisions
Trigger for change
Regulatory decision
Description of change
Ofcom’s Business Connectivity Market Review 2016, Revocation of certain measures imposed in the business connectivity markets, dated 23 November 2017, directs new market definitions for CISBO markets and the creation of a single Service Level Guarantee (SLG) component.
CISBO services with speeds greater than 1Gbps will no longer be regulated and therefore will be moved to Wholesale Residual.
The definition of the CISBO Rest of UK and London Periphery markets will be changed to reflect Ofcom’s new geographical area definitions. These will result in a change in the names of the two CISBO markets reported to Low Bandwidth CISBO Rest of UK and Low Bandwidth CISBO Combined Geographic.
SLG components will be created in each of the SMP markets: WLA, WFAEL and CISBO.
Effect of the change
The remapping of the services with speeds greater than 1Gbps and the changes to geographical definitions decreases revenue by £161m, costs by £123m and MCE by £332m in the SMP CISBO markets. The impact is offset in Wholesale Residual.
There is no impact as a result of the creation of the new components.
Support for the change
Our change for the 2018 RFS CISBO market structure is in response to the Business Connectivity Market Review 2016, Revocation of certain measures imposed in the business connectivity markets, dated 23 November 2017, Annex 1, Section 1, Schedule 11 Direction on ‘preparation, delivery, publication, form and content of the Regulatory financial statements’, Part 1 Definitions and Interpretation:
“Wholesale Market for Lower Bandwidth CISBO Services in the Rest of UK” is defined as excluding the central business districts of Bristol, Birmingham, Glasgow, Leeds and Manchester; and
“Combined Geographic Business Connectivity Markets” means the Wholesale Markets for Lower Bandwidth CISBO Services in the London Periphery and the CBDs of Bristol and Manchester.
Our change for the new component is in response to the Business Connectivity Market Review Temporary Conditions, dated 23 November 2017, Annex 1, sub Annex B, Schedule 12. “The network components shall be as shown below; Service Level Guarantee”.
Key changes in accounting documents
The change to market definitions will be reflected throughout the Wholesale Catalogue and AMD.
Section 3 – Explanation of methodology changes
Page 15
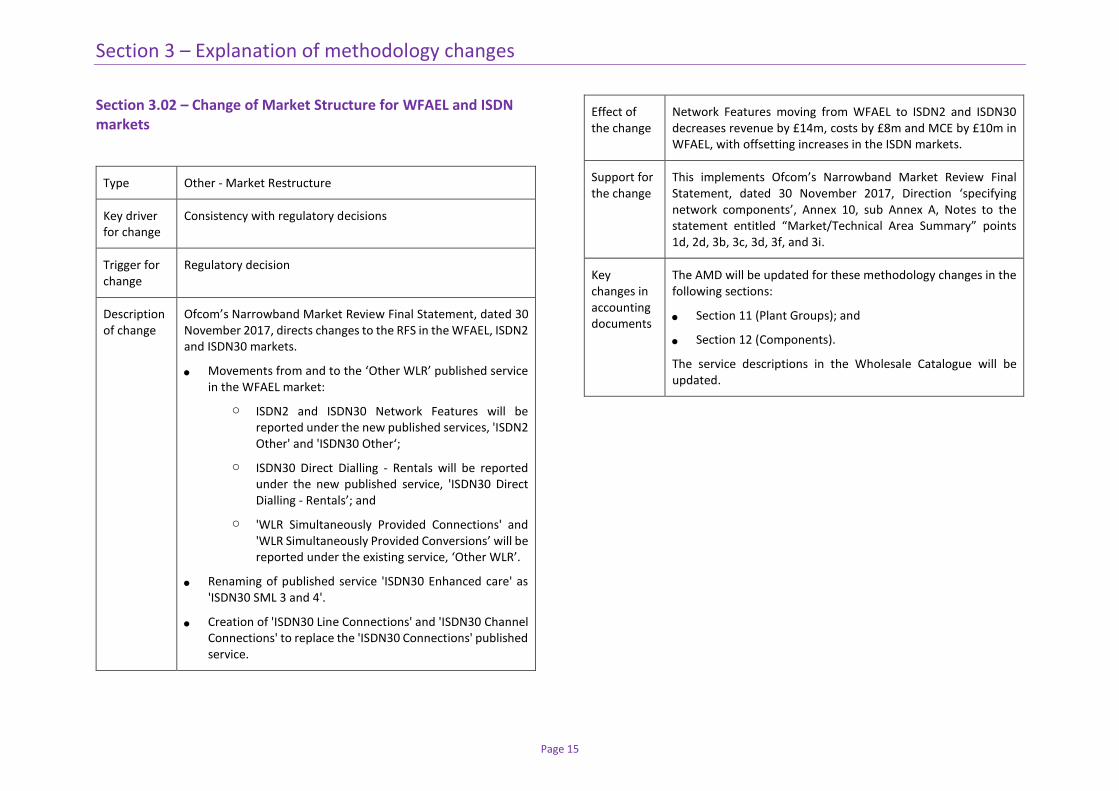
Section 3.02 – Change of Market Structure for WFAEL and ISDN markets
Type Other - Market Restructure
Key driver for change
Consistency with regulatory decisions
Trigger for change
Regulatory decision
Description of change
Ofcom’s Narrowband Market Review Final Statement, dated 30 November 2017, directs changes to the RFS in the WFAEL, ISDN2 and ISDN30 markets.
Movements from and to the ‘Other WLR’ published service in the WFAEL market:
o ISDN2 and ISDN30 Network Features will be reported under the new published services, 'ISDN2 Other' and 'ISDN30 Other‘;
o ISDN30 Direct Dialling - Rentals will be reported under the new published service, 'ISDN30 Direct Dialling - Rentals’; and
o 'WLR Simultaneously Provided Connections' and 'WLR Simultaneously Provided Conversions’ will be reported under the existing service, ‘Other WLR’.
Renaming of published service 'ISDN30 Enhanced care' as 'ISDN30 SML 3 and 4'.
Creation of 'ISDN30 Line Connections' and 'ISDN30 Channel Connections' to replace the 'ISDN30 Connections' published service.
Effect of the change
Network Features moving from WFAEL to ISDN2 and ISDN30 decreases revenue by £14m, costs by £8m and MCE by £10m in WFAEL, with offsetting increases in the ISDN markets.
Support for the change
This implements Ofcom’s Narrowband Market Review Final Statement, dated 30 November 2017, Direction ‘specifying network components’, Annex 10, sub Annex A, Notes to the statement entitled “Market/Technical Area Summary” points 1d, 2d, 3b, 3c, 3d, 3f, and 3i.
Key changes in accounting documents
The AMD will be updated for these methodology changes in the following sections:
Section 11 (Plant Groups); and
Section 12 (Components).
The service descriptions in the Wholesale Catalogue will be updated.
Section 3 – Explanation of methodology changes
Page 16
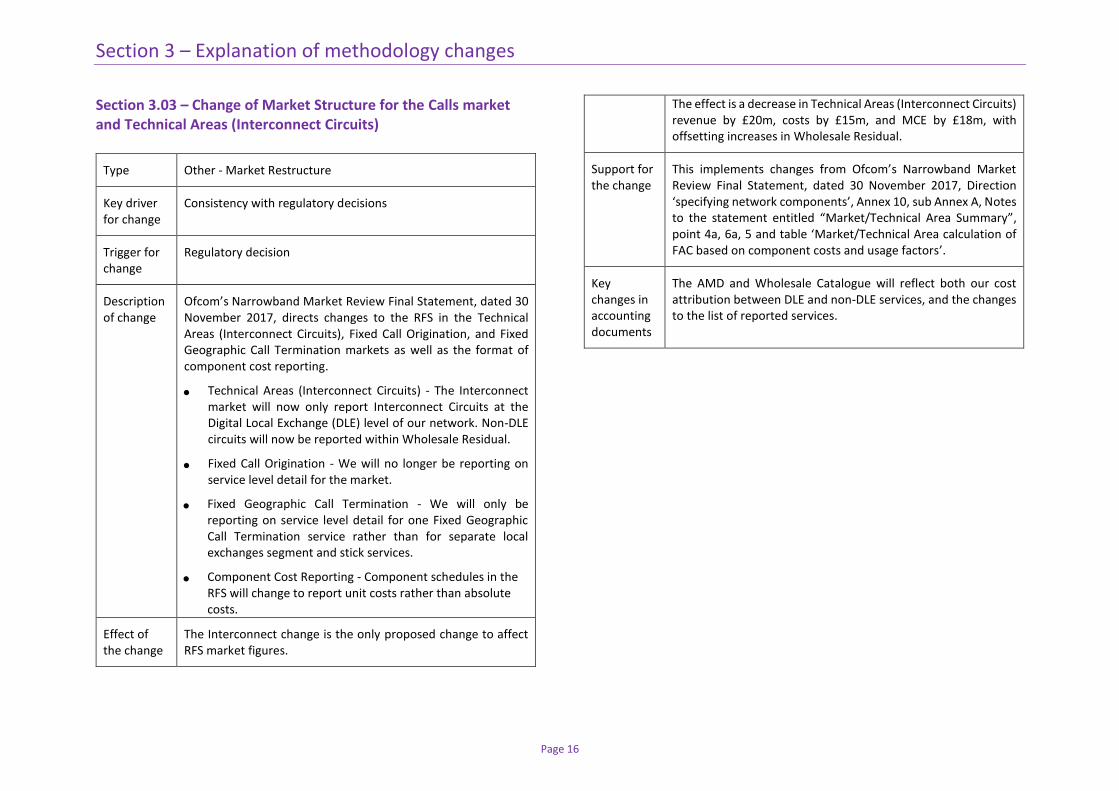
Section 3.03 – Change of Market Structure for the Calls market and Technical Areas (Interconnect Circuits)
Type Other - Market Restructure
Key driver for change
Consistency with regulatory decisions
Trigger for change
Regulatory decision
Description of change
Ofcom’s Narrowband Market Review Final Statement, dated 30 November 2017, directs changes to the RFS in the Technical Areas (Interconnect Circuits), Fixed Call Origination, and Fixed Geographic Call Termination markets as well as the format of component cost reporting.
Technical Areas (Interconnect Circuits) - The Interconnect market will now only report Interconnect Circuits at the Digital Local Exchange (DLE) level of our network. Non-DLE circuits will now be reported within Wholesale Residual.
Fixed Call Origination - We will no longer be reporting on service level detail for the market.
Fixed Geographic Call Termination - We will only be reporting on service level detail for one Fixed Geographic Call Termination service rather than for separate local exchanges segment and stick services.
Component Cost Reporting - Component schedules in the RFS will change to report unit costs rather than absolute costs.
Effect of the change
The Interconnect change is the only proposed change to affect RFS market figures.
The effect is a decrease in Technical Areas (Interconnect Circuits) revenue by £20m, costs by £15m, and MCE by £18m, with offsetting increases in Wholesale Residual.
Support for the change
This implements changes from Ofcom’s Narrowband Market Review Final Statement, dated 30 November 2017, Direction ‘specifying network components’, Annex 10, sub Annex A, Notes to the statement entitled “Market/Technical Area Summary”, point 4a, 6a, 5 and table ‘Market/Technical Area calculation of FAC based on component costs and usage factors’.
Key changes in accounting documents
The AMD and Wholesale Catalogue will reflect both our cost attribution between DLE and non-DLE services, and the changes to the list of reported services.
Section 3 – Explanation of methodology changes
Page 17
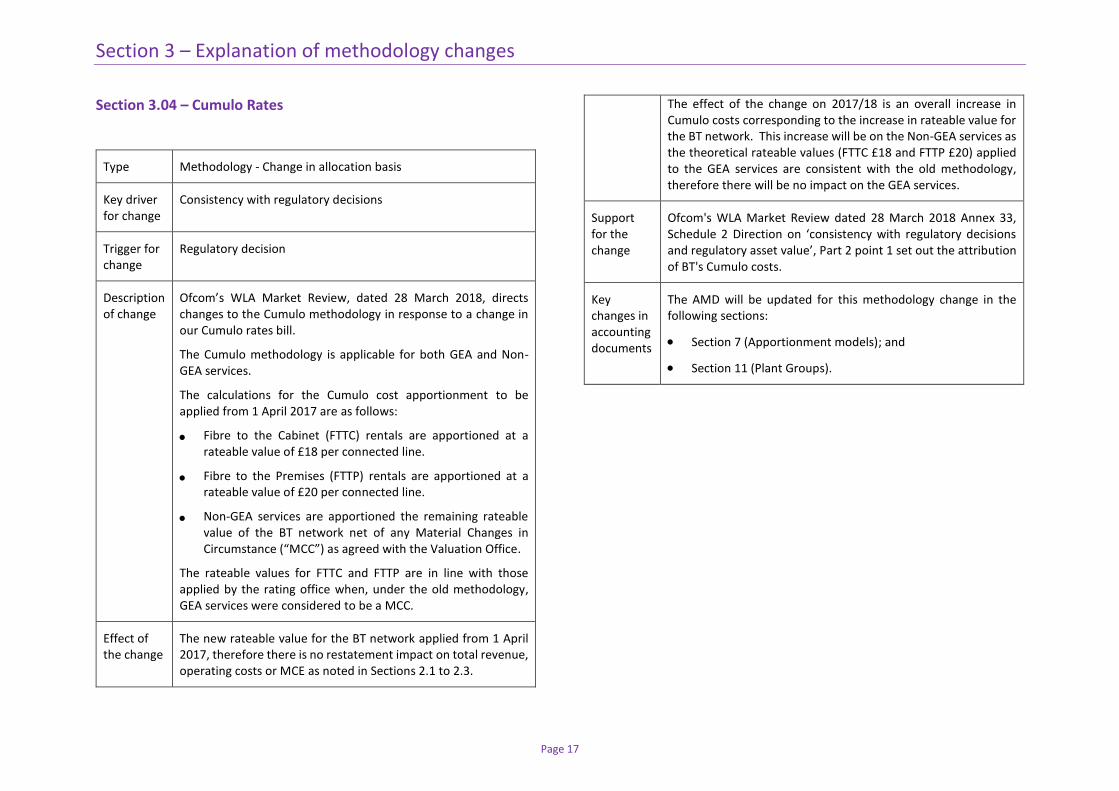
Section 3.04 – Cumulo Rates
Type Methodology - Change in allocation basis
Key driver for change
Consistency with regulatory decisions
Trigger for change
Regulatory decision
Description of change
Ofcom’s WLA Market Review, dated 28 March 2018, directs changes to the Cumulo methodology in response to a change in our Cumulo rates bill.
The Cumulo methodology is applicable for both GEA and Non-GEA services.
The calculations for the Cumulo cost apportionment to be applied from 1 April 2017 are as follows:
Fibre to the Cabinet (FTTC) rentals are apportioned at a rateable value of £18 per connected line.
Fibre to the Premises (FTTP) rentals are apportioned at a rateable value of £20 per connected line.
Non-GEA services are apportioned the remaining rateable value of the BT network net of any Material Changes in Circumstance (“MCC”) as agreed with the Valuation Office.
The rateable values for FTTC and FTTP are in line with those applied by the rating office when, under the old methodology, GEA services were considered to be a MCC.
Effect of the change
The new rateable value for the BT network applied from 1 April 2017, therefore there is no restatement impact on total revenue, operating costs or MCE as noted in Sections 2.1 to 2.3.
The effect of the change on 2017/18 is an overall increase in Cumulo costs corresponding to the increase in rateable value for the BT network. This increase will be on the Non-GEA services as the theoretical rateable values (FTTC £18 and FTTP £20) applied to the GEA services are consistent with the old methodology, therefore there will be no impact on the GEA services.
Support for the change
Ofcom's WLA Market Review dated 28 March 2018 Annex 33, Schedule 2 Direction on ‘consistency with regulatory decisions and regulatory asset value’, Part 2 point 1 set out the attribution of BT's Cumulo costs.
Key changes in accounting documents
The AMD will be updated for this methodology change in the following sections:
Section 7 (Apportionment models); and
Section 11 (Plant Groups).
Section 3 – Explanation of methodology changes
Page 18
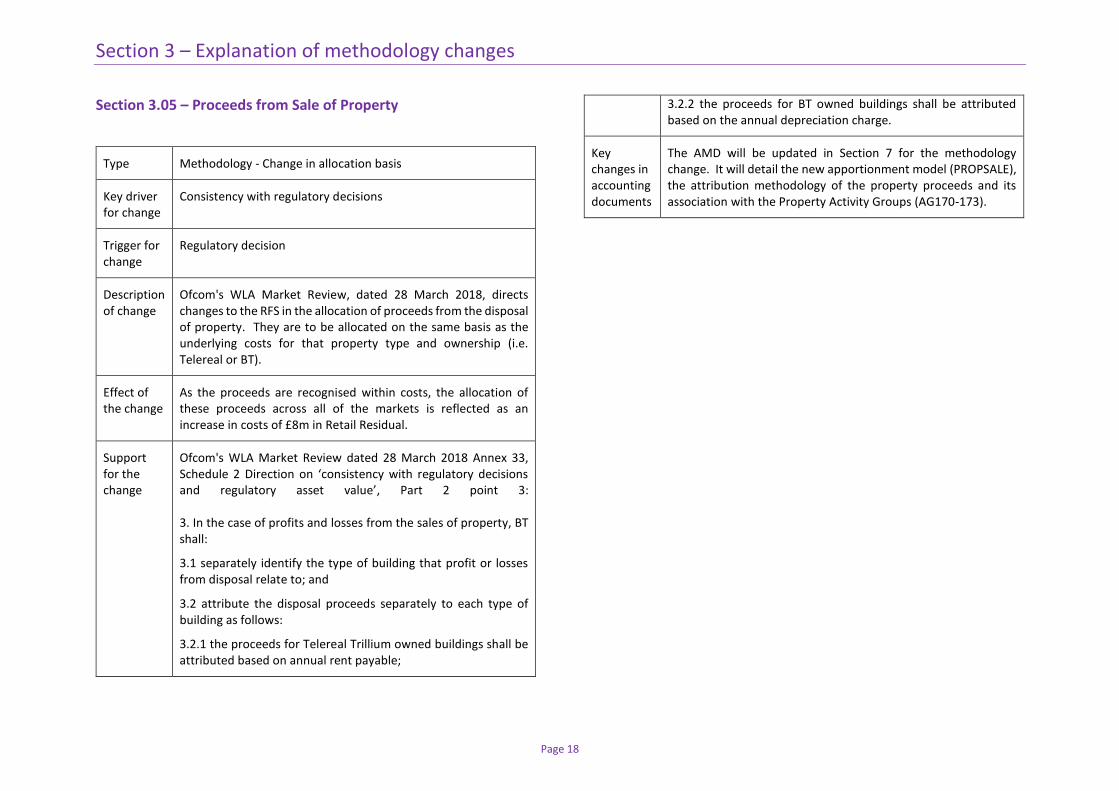
Section 3.05 – Proceeds from Sale of Property
Type Methodology - Change in allocation basis
Key driver for change
Consistency with regulatory decisions
Trigger for change
Regulatory decision
Description of change
Ofcom's WLA Market Review, dated 28 March 2018, directs changes to the RFS in the allocation of proceeds from the disposal of property. They are to be allocated on the same basis as the underlying costs for that property type and ownership (i.e. Telereal or BT).
Effect of the change
As the proceeds are recognised within costs, the allocation of these proceeds across all of the markets is reflected as an increase in costs of £8m in Retail Residual.
Support for the change
Ofcom's WLA Market Review dated 28 March 2018 Annex 33, Schedule 2 Direction on ‘consistency with regulatory decisions and regulatory asset value’, Part 2 point 3: 3. In the case of profits and losses from the sales of property, BT shall:
3.1 separately identify the type of building that profit or losses from disposal relate to; and
3.2 attribute the disposal proceeds separately to each type of building as follows:
3.2.1 the proceeds for Telereal Trillium owned buildings shall be attributed based on annual rent payable;
3.2.2 the proceeds for BT owned buildings shall be attributed based on the annual depreciation charge.
Key changes in accounting documents
The AMD will be updated in Section 7 for the methodology change. It will detail the new apportionment model (PROPSALE), the attribution methodology of the property proceeds and its association with the Property Activity Groups (AG170-173).
Section 3 – Explanation of methodology changes
Page 19
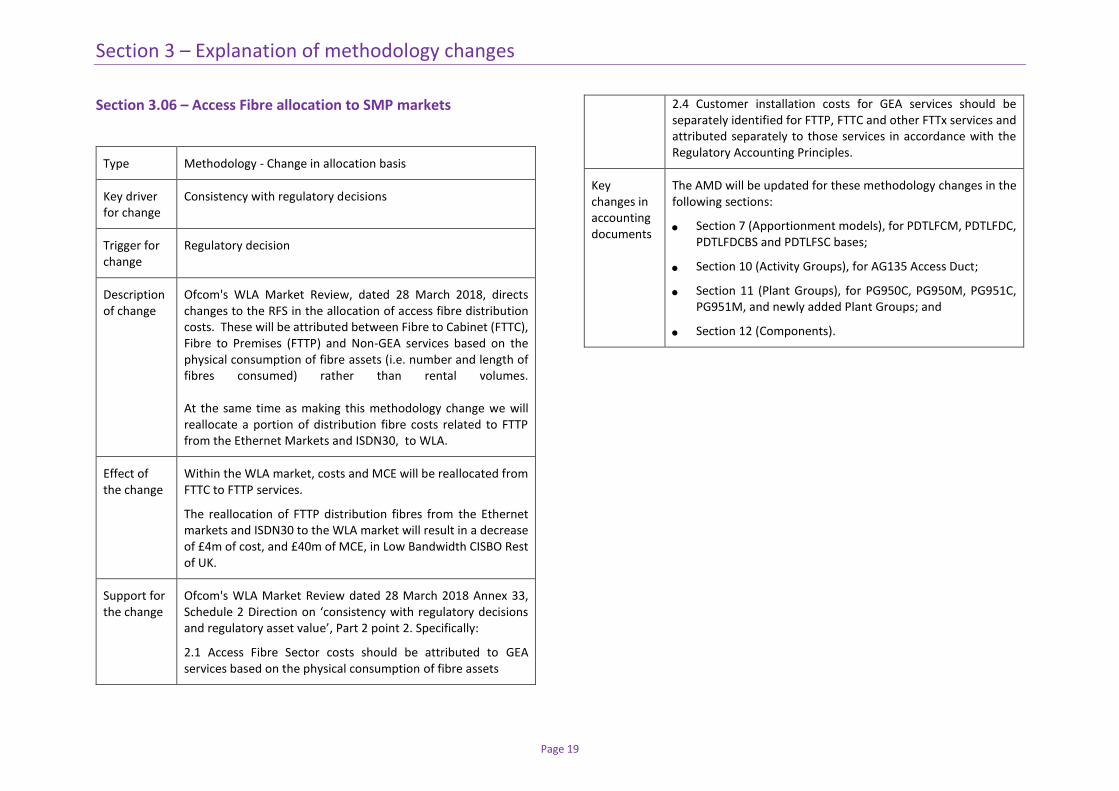
Section 3.06 – Access Fibre allocation to SMP markets
Type Methodology - Change in allocation basis
Key driver for change
Consistency with regulatory decisions
Trigger for change
Regulatory decision
Description of change
Ofcom's WLA Market Review, dated 28 March 2018, directs changes to the RFS in the allocation of access fibre distribution costs. These will be attributed between Fibre to Cabinet (FTTC), Fibre to Premises (FTTP) and Non-GEA services based on the physical consumption of fibre assets (i.e. number and length of fibres consumed) rather than rental volumes. At the same time as making this methodology change we will reallocate a portion of distribution fibre costs related to FTTP from the Ethernet Markets and ISDN30, to WLA.
Effect of the change
Within the WLA market, costs and MCE will be reallocated from FTTC to FTTP services.
The reallocation of FTTP distribution fibres from the Ethernet markets and ISDN30 to the WLA market will result in a decrease of £4m of cost, and £40m of MCE, in Low Bandwidth CISBO Rest of UK.
Support for the change
Ofcom's WLA Market Review dated 28 March 2018 Annex 33, Schedule 2 Direction on ‘consistency with regulatory decisions and regulatory asset value’, Part 2 point 2. Specifically:
2.1 Access Fibre Sector costs should be attributed to GEA services based on the physical consumption of fibre assets
2.4 Customer installation costs for GEA services should be separately identified for FTTP, FTTC and other FTTx services and attributed separately to those services in accordance with the Regulatory Accounting Principles.
Key changes in accounting documents
The AMD will be updated for these methodology changes in the following sections:
Section 7 (Apportionment models), for PDTLFCM, PDTLFDC, PDTLFDCBS and PDTLFSC bases;
Section 10 (Activity Groups), for AG135 Access Duct;
Section 11 (Plant Groups), for PG950C, PG950M, PG951C, PG951M, and newly added Plant Groups; and
Section 12 (Components).
Section 3 – Explanation of methodology changes
Page 20
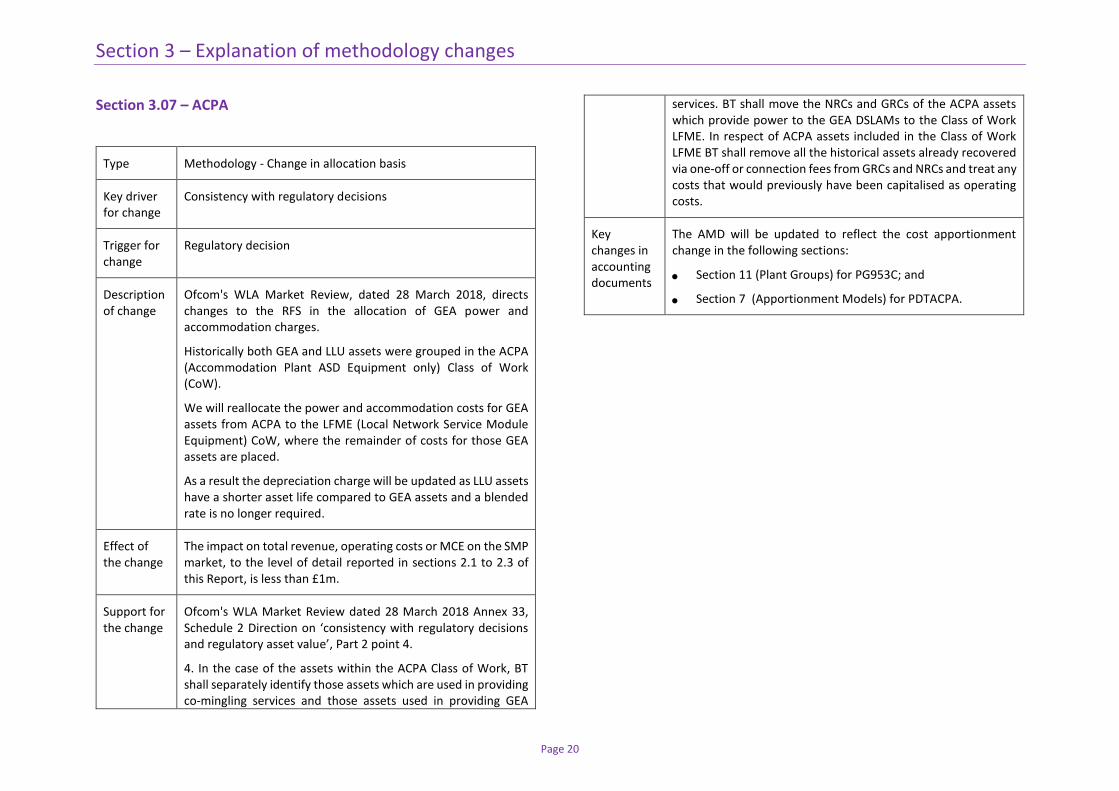
Section 3.07 – ACPA
Type Methodology - Change in allocation basis
Key driver for change
Consistency with regulatory decisions
Trigger for change
Regulatory decision
Description of change
Ofcom's WLA Market Review, dated 28 March 2018, directs changes to the RFS in the allocation of GEA power and accommodation charges.
Historically both GEA and LLU assets were grouped in the ACPA (Accommodation Plant ASD Equipment only) Class of Work (CoW).
We will reallocate the power and accommodation costs for GEA assets from ACPA to the LFME (Local Network Service Module Equipment) CoW, where the remainder of costs for those GEA assets are placed.
As a result the depreciation charge will be updated as LLU assets have a shorter asset life compared to GEA assets and a blended rate is no longer required.
Effect of the change
The impact on total revenue, operating costs or MCE on the SMP market, to the level of detail reported in sections 2.1 to 2.3 of this Report, is less than £1m.
Support for the change
Ofcom's WLA Market Review dated 28 March 2018 Annex 33, Schedule 2 Direction on ‘consistency with regulatory decisions and regulatory asset value’, Part 2 point 4.
4. In the case of the assets within the ACPA Class of Work, BT shall separately identify those assets which are used in providing co-mingling services and those assets used in providing GEA
services. BT shall move the NRCs and GRCs of the ACPA assets which provide power to the GEA DSLAMs to the Class of Work LFME. In respect of ACPA assets included in the Class of Work LFME BT shall remove all the historical assets already recovered via one-off or connection fees from GRCs and NRCs and treat any costs that would previously have been capitalised as operating costs.
Key changes in accounting documents
The AMD will be updated to reflect the cost apportionment change in the following sections:
Section 11 (Plant Groups) for PG953C; and
Section 7 (Apportionment Models) for PDTACPA.
Section 3 – Explanation of methodology changes
Page 21
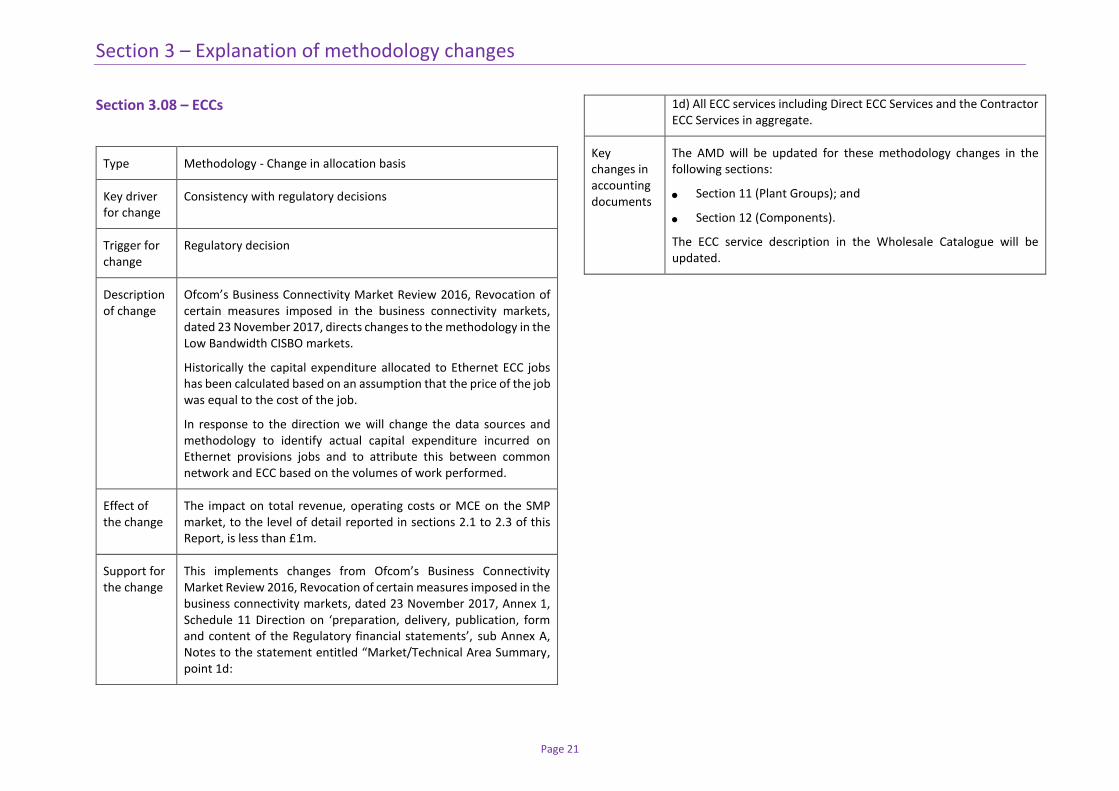
Section 3.08 – ECCs
Type Methodology - Change in allocation basis
Key driver for change
Consistency with regulatory decisions
Trigger for change
Regulatory decision
Description of change
Ofcom’s Business Connectivity Market Review 2016, Revocation of certain measures imposed in the business connectivity markets, dated 23 November 2017, directs changes to the methodology in the Low Bandwidth CISBO markets.
Historically the capital expenditure allocated to Ethernet ECC jobs has been calculated based on an assumption that the price of the job was equal to the cost of the job.
In response to the direction we will change the data sources and methodology to identify actual capital expenditure incurred on Ethernet provisions jobs and to attribute this between common network and ECC based on the volumes of work performed.
Effect of the change
The impact on total revenue, operating costs or MCE on the SMP market, to the level of detail reported in sections 2.1 to 2.3 of this Report, is less than £1m.
Support for the change
This implements changes from Ofcom’s Business Connectivity Market Review 2016, Revocation of certain measures imposed in the business connectivity markets, dated 23 November 2017, Annex 1, Schedule 11 Direction on ‘preparation, delivery, publication, form and content of the Regulatory financial statements’, sub Annex A, Notes to the statement entitled “Market/Technical Area Summary, point 1d:
1d) All ECC services including Direct ECC Services and the Contractor ECC Services in aggregate.
Key changes in accounting documents
The AMD will be updated for these methodology changes in the following sections:
Section 11 (Plant Groups); and
Section 12 (Components).
The ECC service description in the Wholesale Catalogue will be updated.
Section 3 – Explanation of methodology changes
Page 22
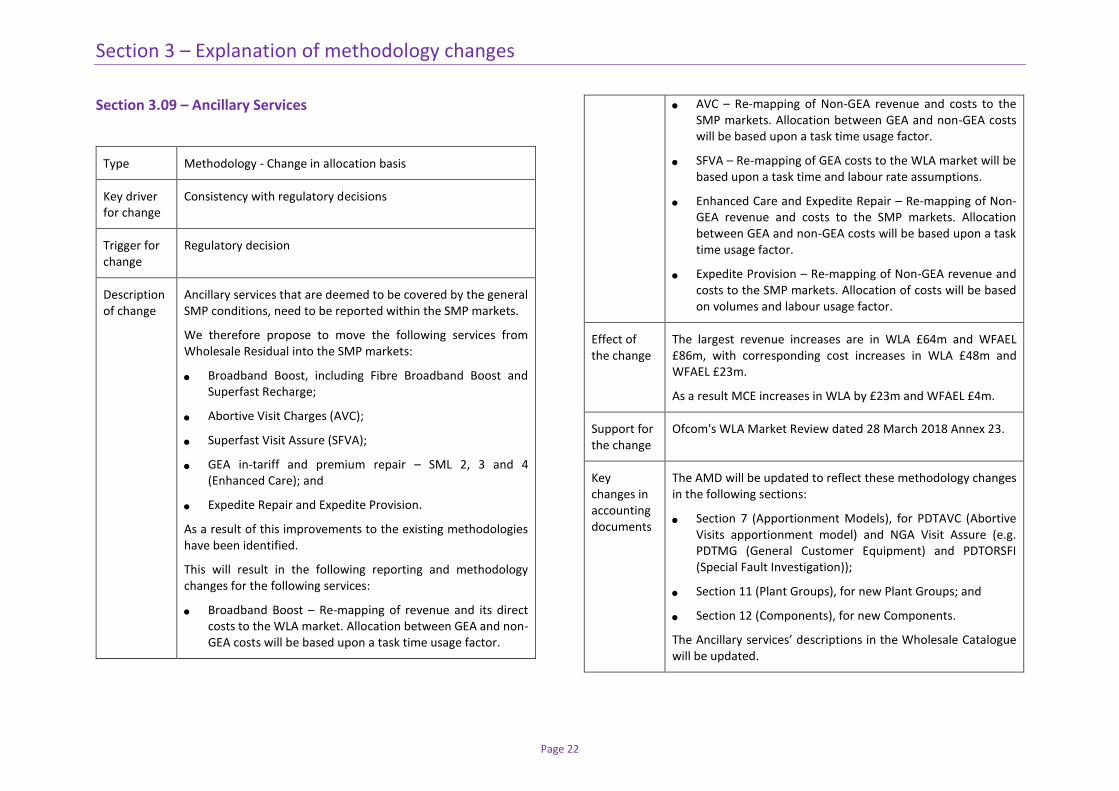
Section 3.09 – Ancillary Services
Type Methodology - Change in allocation basis
Key driver for change
Consistency with regulatory decisions
Trigger for change
Regulatory decision
Description of change
Ancillary services that are deemed to be covered by the general SMP conditions, need to be reported within the SMP markets.
We therefore propose to move the following services from Wholesale Residual into the SMP markets:
Broadband Boost, including Fibre Broadband Boost and Superfast Recharge;
Abortive Visit Charges (AVC);
Superfast Visit Assure (SFVA);
GEA in-tariff and premium repair – SML 2, 3 and 4 (Enhanced Care); and
Expedite Repair and Expedite Provision.
As a result of this improvements to the existing methodologies have been identified.
This will result in the following reporting and methodology changes for the following services:
Broadband Boost – Re-mapping of revenue and its direct costs to the WLA market. Allocation between GEA and non-GEA costs will be based upon a task time usage factor.
AVC – Re-mapping of Non-GEA revenue and costs to the SMP markets. Allocation between GEA and non-GEA costs will be based upon a task time usage factor.
SFVA – Re-mapping of GEA costs to the WLA market will be based upon a task time and labour rate assumptions.
Enhanced Care and Expedite Repair – Re-mapping of Non-GEA revenue and costs to the SMP markets. Allocation between GEA and non-GEA costs will be based upon a task time usage factor.
Expedite Provision – Re-mapping of Non-GEA revenue and costs to the SMP markets. Allocation of costs will be based on volumes and labour usage factor.
Effect of the change
The largest revenue increases are in WLA £64m and WFAEL £86m, with corresponding cost increases in WLA £48m and WFAEL £23m.
As a result MCE increases in WLA by £23m and WFAEL £4m.
Support for the change
Ofcom's WLA Market Review dated 28 March 2018 Annex 23.
Key changes in accounting documents
The AMD will be updated to reflect these methodology changes in the following sections:
Section 7 (Apportionment Models), for PDTAVC (Abortive Visits apportionment model) and NGA Visit Assure (e.g. PDTMG (General Customer Equipment) and PDTORSFI (Special Fault Investigation));
Section 11 (Plant Groups), for new Plant Groups; and
Section 12 (Components), for new Components.
The Ancillary services’ descriptions in the Wholesale Catalogue will be updated.
Section 3 – Explanation of methodology changes
Page 23
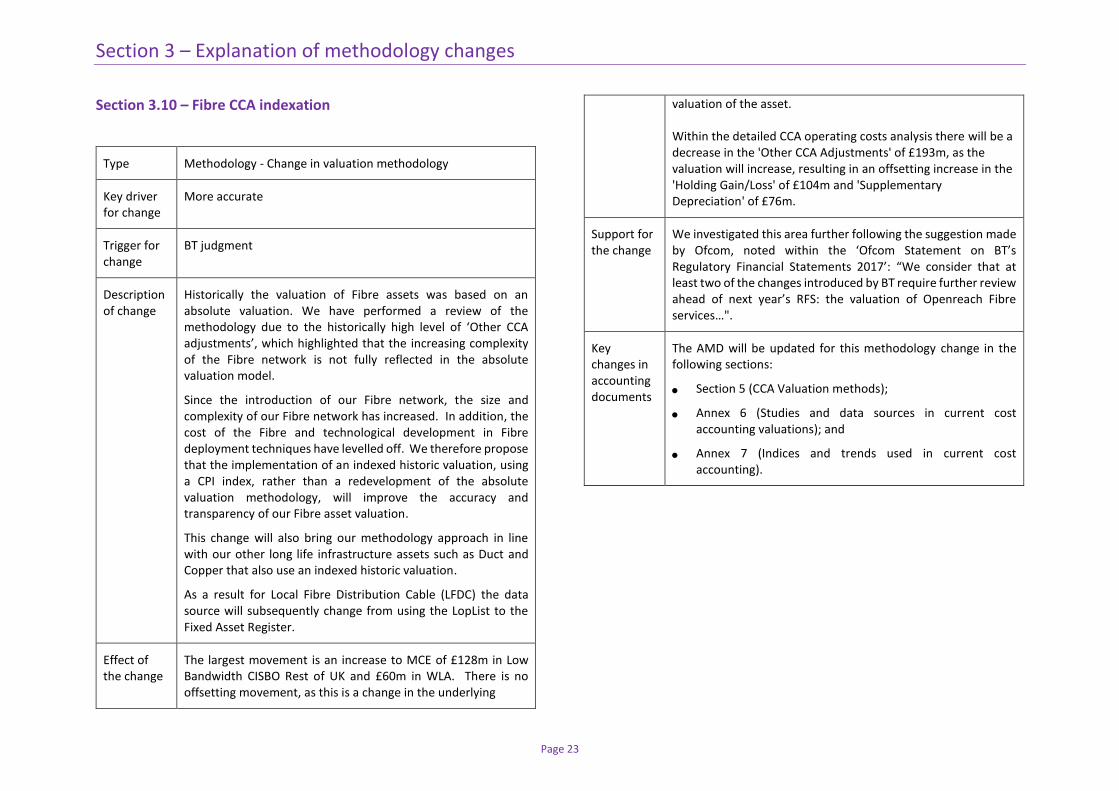
Section 3.10 – Fibre CCA indexation
Type Methodology - Change in valuation methodology
Key driver for change
More accurate
Trigger for change
BT judgment
Description of change
Historically the valuation of Fibre assets was based on an absolute valuation. We have performed a review of the methodology due to the historically high level of ‘Other CCA adjustments’, which highlighted that the increasing complexity of the Fibre network is not fully reflected in the absolute valuation model.
Since the introduction of our Fibre network, the size and complexity of our Fibre network has increased. In addition, the cost of the Fibre and technological development in Fibre deployment techniques have levelled off. We therefore propose that the implementation of an indexed historic valuation, using a CPI index, rather than a redevelopment of the absolute valuation methodology, will improve the accuracy and transparency of our Fibre asset valuation.
This change will also bring our methodology approach in line with our other long life infrastructure assets such as Duct and Copper that also use an indexed historic valuation.
As a result for Local Fibre Distribution Cable (LFDC) the data source will subsequently change from using the LopList to the Fixed Asset Register.
Effect of the change
The largest movement is an increase to MCE of £128m in Low Bandwidth CISBO Rest of UK and £60m in WLA. There is no offsetting movement, as this is a change in the underlying
valuation of the asset. Within the detailed CCA operating costs analysis there will be a decrease in the 'Other CCA Adjustments' of £193m, as the valuation will increase, resulting in an offsetting increase in the 'Holding Gain/Loss' of £104m and 'Supplementary Depreciation' of £76m.
Support for the change
We investigated this area further following the suggestion made by Ofcom, noted within the ‘Ofcom Statement on BT’s Regulatory Financial Statements 2017’: “We consider that at least two of the changes introduced by BT require further review ahead of next year’s RFS: the valuation of Openreach Fibre services…".
Key changes in accounting documents
The AMD will be updated for this methodology change in the following sections:
Section 5 (CCA Valuation methods);
Annex 6 (Studies and data sources in current cost accounting valuations); and
Annex 7 (Indices and trends used in current cost accounting).
Section 3 – Explanation of methodology changes
Page 24
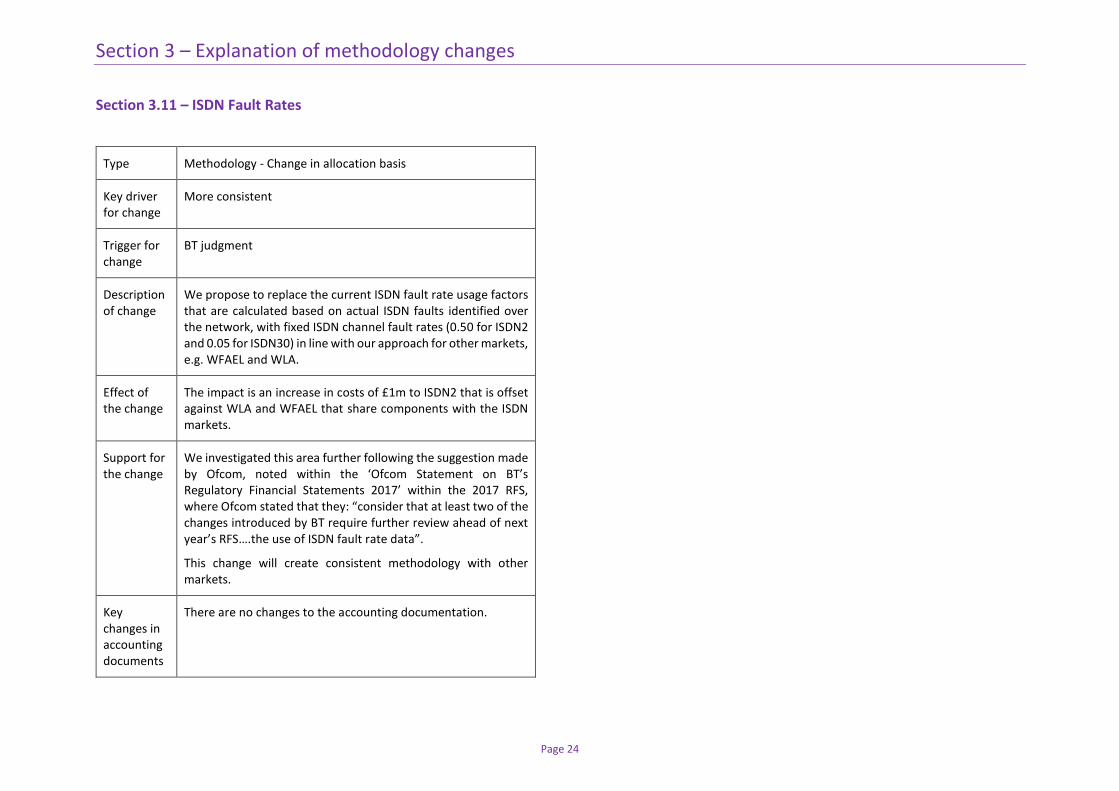
Section 3.11 – ISDN Fault Rates
Type Methodology - Change in allocation basis
Key driver for change
More consistent
Trigger for change
BT judgment
Description of change
We propose to replace the current ISDN fault rate usage factors that are calculated based on actual ISDN faults identified over the network, with fixed ISDN channel fault rates (0.50 for ISDN2 and 0.05 for ISDN30) in line with our approach for other markets, e.g. WFAEL and WLA.
Effect of the change
The impact is an increase in costs of £1m to ISDN2 that is offset against WLA and WFAEL that share components with the ISDN markets.
Support for the change
We investigated this area further following the suggestion made by Ofcom, noted within the ‘Ofcom Statement on BT’s Regulatory Financial Statements 2017’ within the 2017 RFS, where Ofcom stated that they: “consider that at least two of the changes introduced by BT require further review ahead of next year’s RFS….the use of ISDN fault rate data”.
This change will create consistent methodology with other markets.
Key changes in accounting documents
There are no changes to the accounting documentation.
Section 3 – Explanation of methodology changes
Page 25
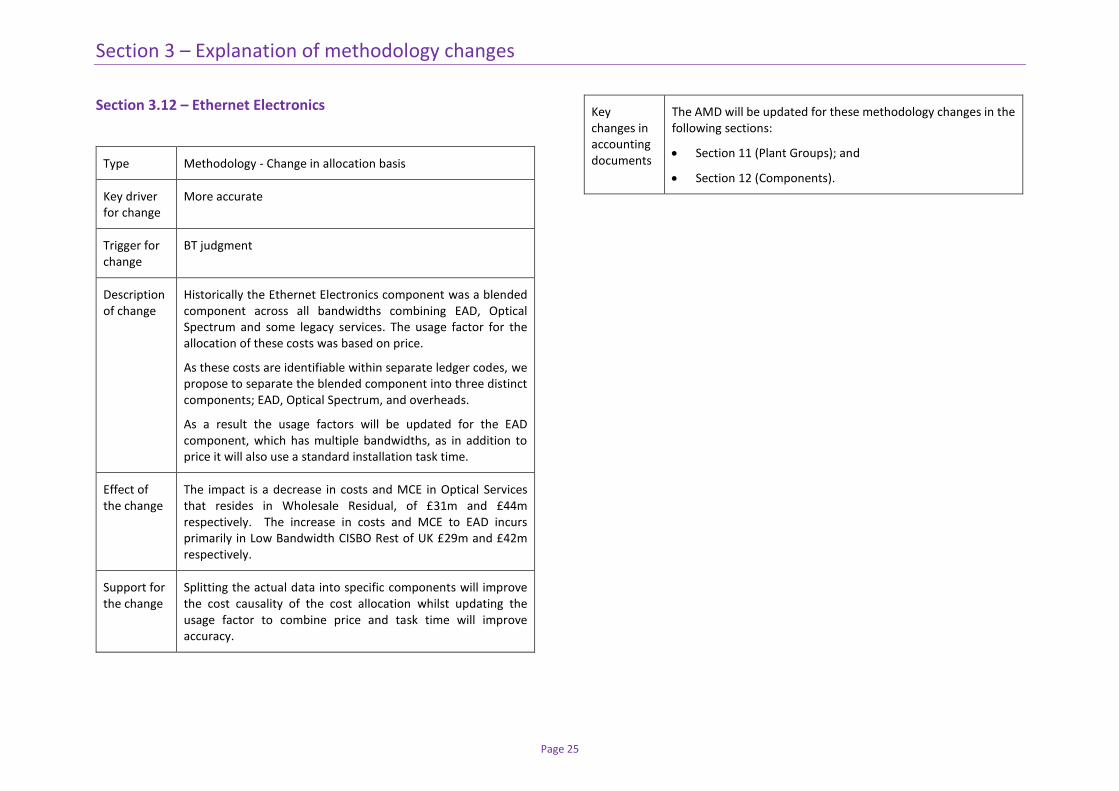
Section 3.12 – Ethernet Electronics
Type Methodology - Change in allocation basis
Key driver for change
More accurate
Trigger for change
BT judgment
Description of change
Historically the Ethernet Electronics component was a blended component across all bandwidths combining EAD, Optical Spectrum and some legacy services. The usage factor for the allocation of these costs was based on price.
As these costs are identifiable within separate ledger codes, we propose to separate the blended component into three distinct components; EAD, Optical Spectrum, and overheads.
As a result the usage factors will be updated for the EAD component, which has multiple bandwidths, as in addition to price it will also use a standard installation task time.
Effect of the change
The impact is a decrease in costs and MCE in Optical Services that resides in Wholesale Residual, of £31m and £44m respectively. The increase in costs and MCE to EAD incurs primarily in Low Bandwidth CISBO Rest of UK £29m and £42m respectively.
Support for the change
Splitting the actual data into specific components will improve the cost causality of the cost allocation whilst updating the usage factor to combine price and task time will improve accuracy.
Key changes in accounting documents
The AMD will be updated for these methodology changes in the following sections:
Section 11 (Plant Groups); and
Section 12 (Components).
Section 3 – Explanation of methodology changes
Page 26
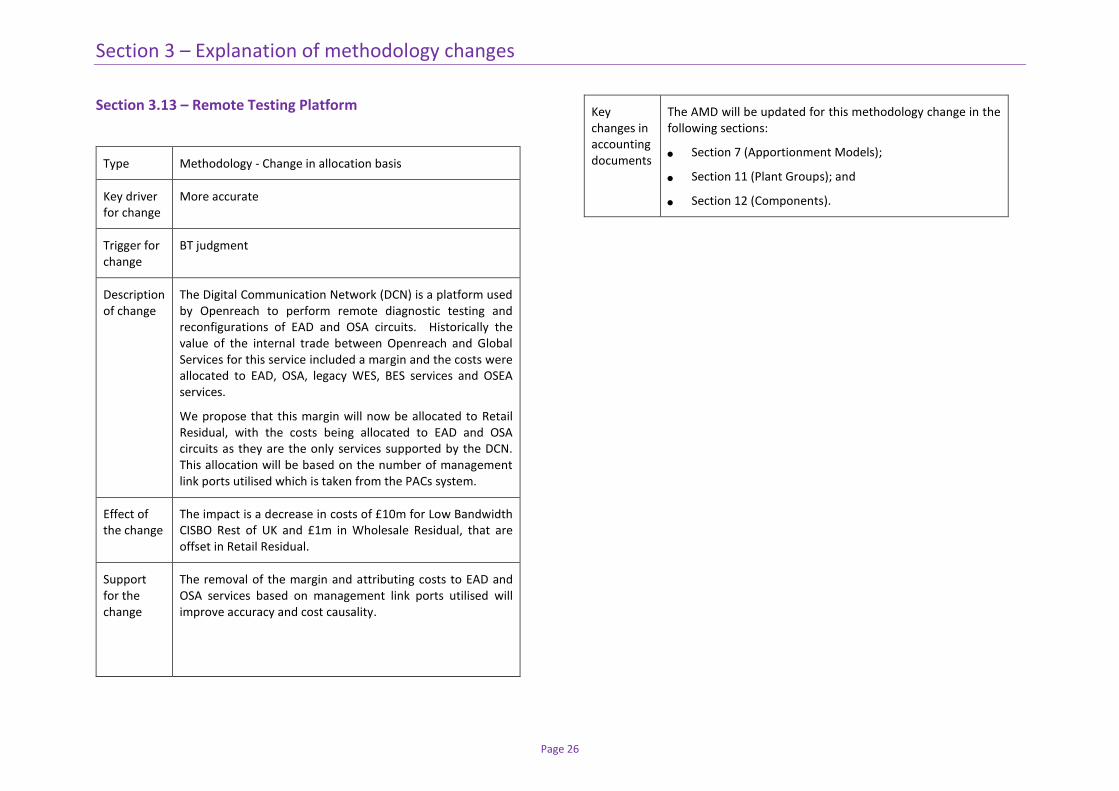
Section 3.13 – Remote Testing Platform
Type Methodology - Change in allocation basis
Key driver for change
More accurate
Trigger for change
BT judgment
Description of change
The Digital Communication Network (DCN) is a platform used by Openreach to perform remote diagnostic testing and reconfigurations of EAD and OSA circuits. Historically the value of the internal trade between Openreach and Global Services for this service included a margin and the costs were allocated to EAD, OSA, legacy WES, BES services and OSEA services.
We propose that this margin will now be allocated to Retail Residual, with the costs being allocated to EAD and OSA circuits as they are the only services supported by the DCN. This allocation will be based on the number of management link ports utilised which is taken from the PACs system.
Effect of the change
The impact is a decrease in costs of £10m for Low Bandwidth CISBO Rest of UK and £1m in Wholesale Residual, that are offset in Retail Residual.
Support for the change
The removal of the margin and attributing costs to EAD and OSA services based on management link ports utilised will improve accuracy and cost causality.
Key changes in accounting documents
The AMD will be updated for this methodology change in the following sections:
Section 7 (Apportionment Models);
Section 11 (Plant Groups); and
Section 12 (Components).
Section 3 – Explanation of methodology changes
Page 27
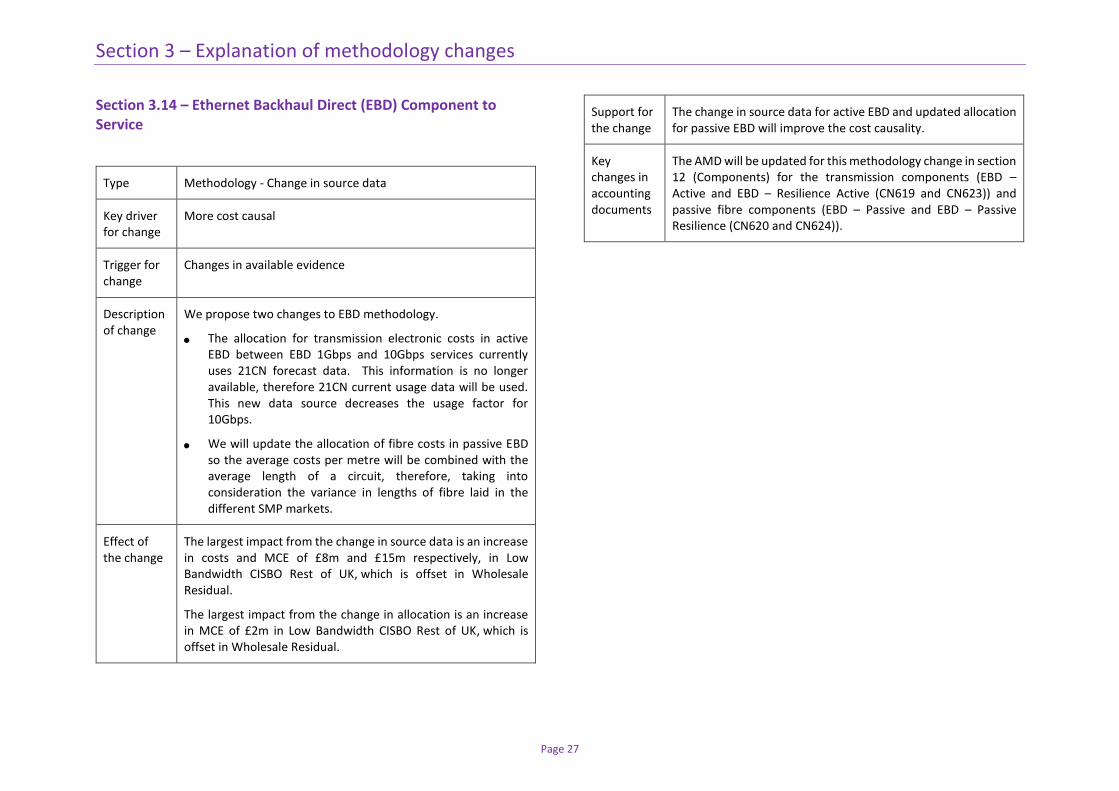
Section 3.14 – Ethernet Backhaul Direct (EBD) Component to Service
Type Methodology - Change in source data
Key driver for change
More cost causal
Trigger for change
Changes in available evidence
Description of change
We propose two changes to EBD methodology.
The allocation for transmission electronic costs in active EBD between EBD 1Gbps and 10Gbps services currently uses 21CN forecast data. This information is no longer available, therefore 21CN current usage data will be used. This new data source decreases the usage factor for 10Gbps.
We will update the allocation of fibre costs in passive EBD so the average costs per metre will be combined with the average length of a circuit, therefore, taking into consideration the variance in lengths of fibre laid in the different SMP markets.
Effect of the change
The largest impact from the change in source data is an increase in costs and MCE of £8m and £15m respectively, in Low Bandwidth CISBO Rest of UK, which is offset in Wholesale Residual.
The largest impact from the change in allocation is an increase in MCE of £2m in Low Bandwidth CISBO Rest of UK, which is offset in Wholesale Residual.
Support for the change
The change in source data for active EBD and updated allocation for passive EBD will improve the cost causality.
Key changes in accounting documents
The AMD will be updated for this methodology change in section 12 (Components) for the transmission components (EBD – Active and EBD – Resilience Active (CN619 and CN623)) and passive fibre components (EBD – Passive and EBD – Passive Resilience (CN620 and CN624)).
Section 3 – Explanation of methodology changes
Page 28
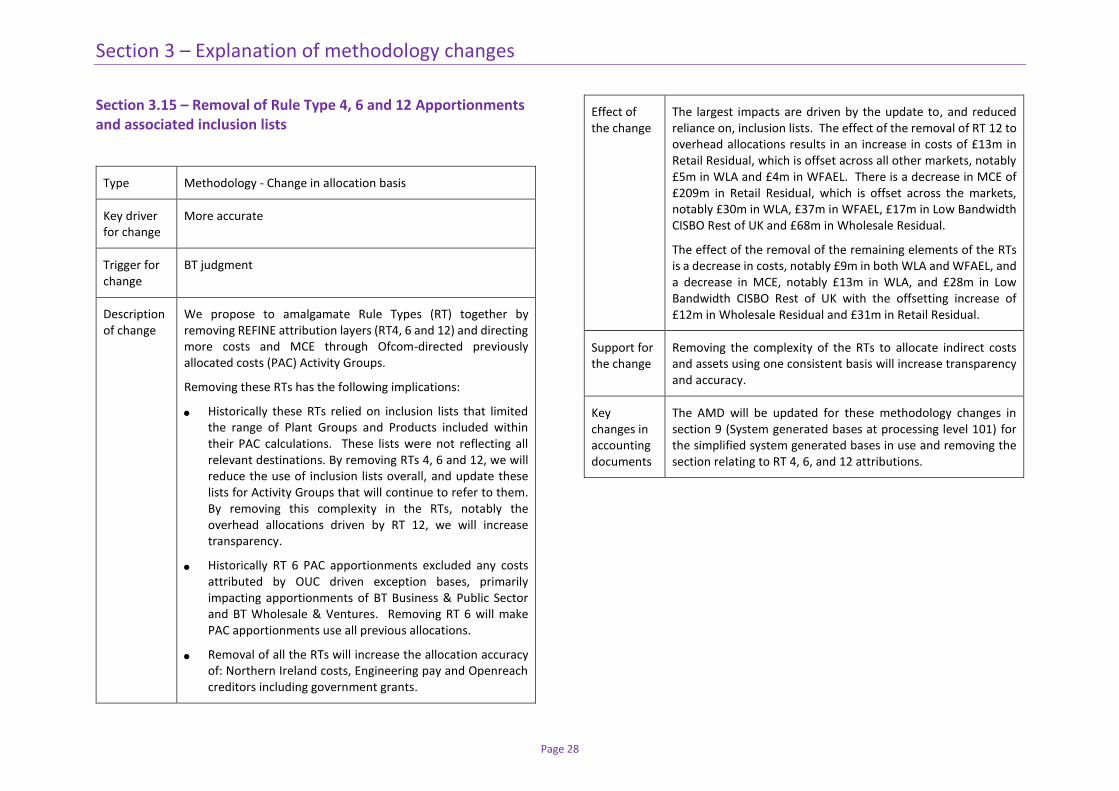
Section 3.15 – Removal of Rule Type 4, 6 and 12 Apportionments and associated inclusion lists
Type Methodology - Change in allocation basis
Key driver for change
More accurate
Trigger for change
BT judgment
Description of change
We propose to amalgamate Rule Types (RT) together by removing REFINE attribution layers (RT4, 6 and 12) and directing more costs and MCE through Ofcom-directed previously allocated costs (PAC) Activity Groups.
Removing these RTs has the following implications:
Historically these RTs relied on inclusion lists that limited the range of Plant Groups and Products included within their PAC calculations. These lists were not reflecting all relevant destinations. By removing RTs 4, 6 and 12, we will reduce the use of inclusion lists overall, and update these lists for Activity Groups that will continue to refer to them. By removing this complexity in the RTs, notably the overhead allocations driven by RT 12, we will increase transparency.
Historically RT 6 PAC apportionments excluded any costs attributed by OUC driven exception bases, primarily impacting apportionments of BT Business & Public Sector and BT Wholesale & Ventures. Removing RT 6 will make PAC apportionments use all previous allocations.
Removal of all the RTs will increase the allocation accuracy of: Northern Ireland costs, Engineering pay and Openreach creditors including government grants.
Effect of the change
The largest impacts are driven by the update to, and reduced reliance on, inclusion lists. The effect of the removal of RT 12 to overhead allocations results in an increase in costs of £13m in Retail Residual, which is offset across all other markets, notably £5m in WLA and £4m in WFAEL. There is a decrease in MCE of £209m in Retail Residual, which is offset across the markets, notably £30m in WLA, £37m in WFAEL, £17m in Low Bandwidth CISBO Rest of UK and £68m in Wholesale Residual.
The effect of the removal of the remaining elements of the RTs is a decrease in costs, notably £9m in both WLA and WFAEL, and a decrease in MCE, notably £13m in WLA, and £28m in Low Bandwidth CISBO Rest of UK with the offsetting increase of £12m in Wholesale Residual and £31m in Retail Residual.
Support for the change
Removing the complexity of the RTs to allocate indirect costs and assets using one consistent basis will increase transparency and accuracy.
Key changes in accounting documents
The AMD will be updated for these methodology changes in section 9 (System generated bases at processing level 101) for the simplified system generated bases in use and removing the section relating to RT 4, 6, and 12 attributions.
Section 3 – Explanation of methodology changes
Page 29
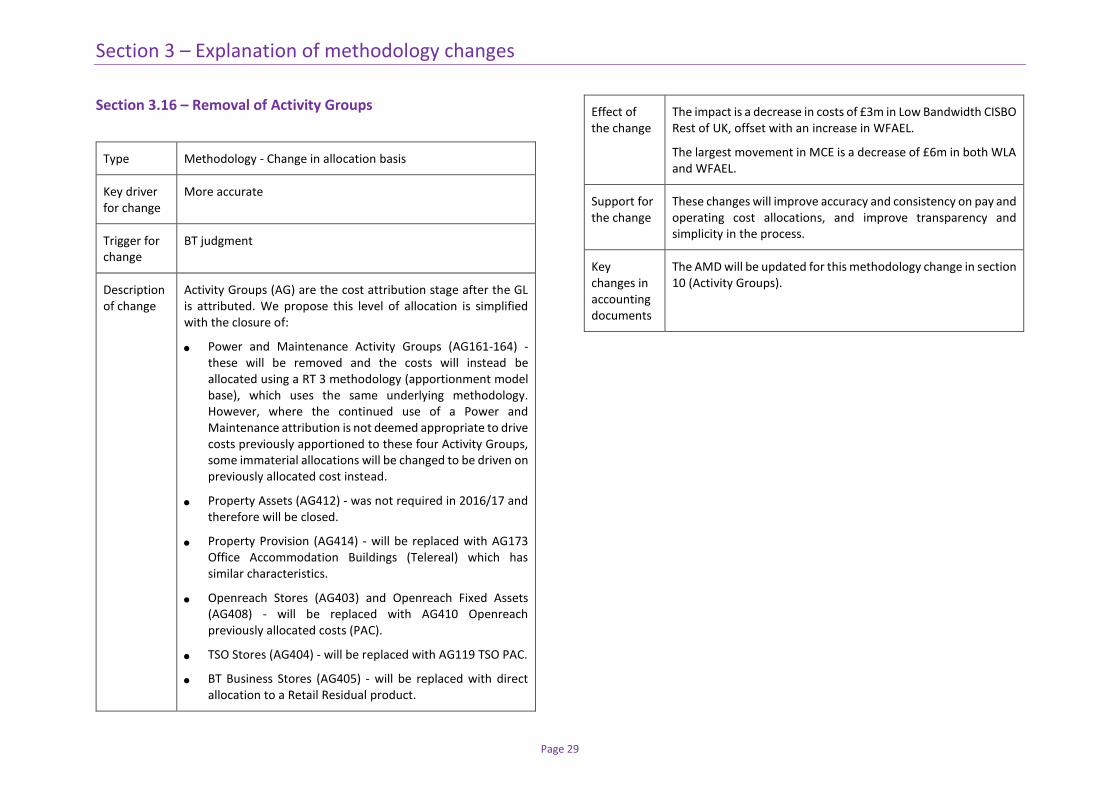
Section 3.16 – Removal of Activity Groups
Type Methodology - Change in allocation basis
Key driver for change
More accurate
Trigger for change
BT judgment
Description of change
Activity Groups (AG) are the cost attribution stage after the GL is attributed. We propose this level of allocation is simplified with the closure of:
Power and Maintenance Activity Groups (AG161-164) - these will be removed and the costs will instead be allocated using a RT 3 methodology (apportionment model base), which uses the same underlying methodology. However, where the continued use of a Power and Maintenance attribution is not deemed appropriate to drive costs previously apportioned to these four Activity Groups, some immaterial allocations will be changed to be driven on previously allocated cost instead.
Property Assets (AG412) - was not required in 2016/17 and therefore will be closed.
Property Provision (AG414) - will be replaced with AG173 Office Accommodation Buildings (Telereal) which has similar characteristics.
Openreach Stores (AG403) and Openreach Fixed Assets (AG408) - will be replaced with AG410 Openreach previously allocated costs (PAC).
TSO Stores (AG404) - will be replaced with AG119 TSO PAC.
BT Business Stores (AG405) - will be replaced with direct allocation to a Retail Residual product.
Effect of the change
The impact is a decrease in costs of £3m in Low Bandwidth CISBO Rest of UK, offset with an increase in WFAEL.
The largest movement in MCE is a decrease of £6m in both WLA and WFAEL.
Support for the change
These changes will improve accuracy and consistency on pay and operating cost allocations, and improve transparency and simplicity in the process.
Key changes in accounting documents
The AMD will be updated for this methodology change in section 10 (Activity Groups).
Section 3 – Explanation of methodology changes
Page 30
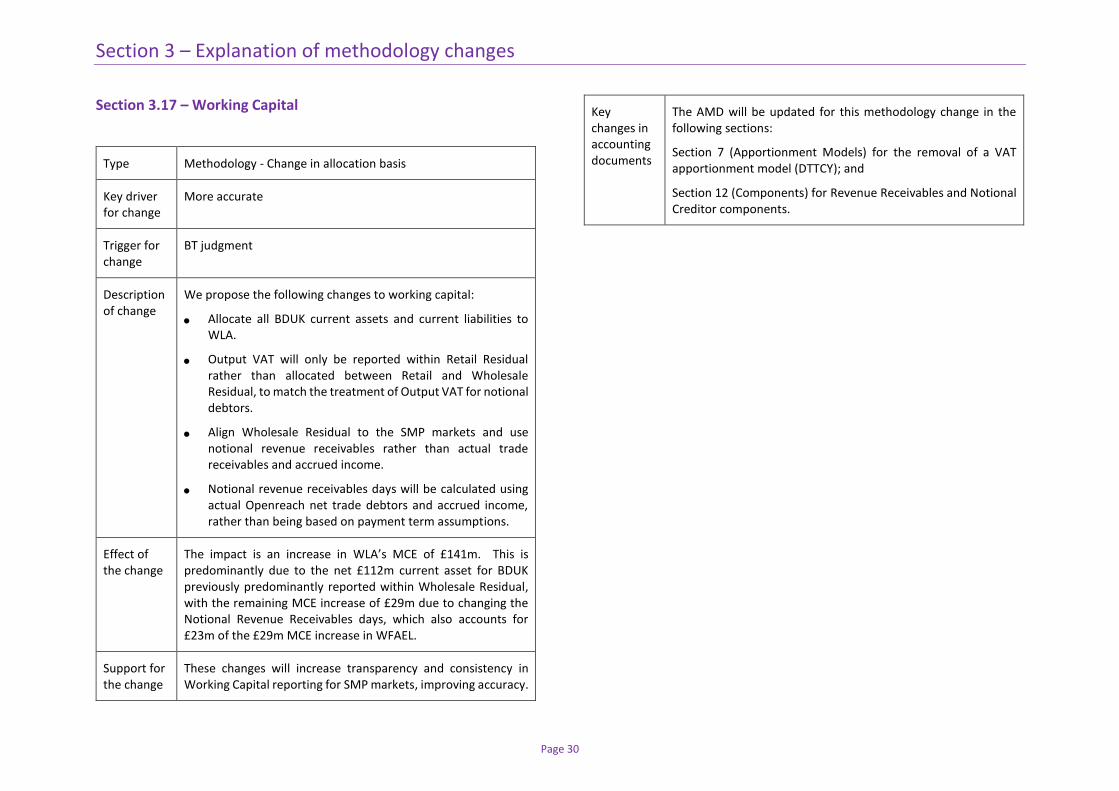
Section 3.17 – Working Capital
Type Methodology - Change in allocation basis
Key driver for change
More accurate
Trigger for change
BT judgment
Description of change
We propose the following changes to working capital:
Allocate all BDUK current assets and current liabilities to WLA.
Output VAT will only be reported within Retail Residual rather than allocated between Retail and Wholesale Residual, to match the treatment of Output VAT for notional debtors.
Align Wholesale Residual to the SMP markets and use notional revenue receivables rather than actual trade receivables and accrued income.
Notional revenue receivables days will be calculated using actual Openreach net trade debtors and accrued income, rather than being based on payment term assumptions.
Effect of the change
The impact is an increase in WLA’s MCE of £141m. This is predominantly due to the net £112m current asset for BDUK previously predominantly reported within Wholesale Residual, with the remaining MCE increase of £29m due to changing the Notional Revenue Receivables days, which also accounts for £23m of the £29m MCE increase in WFAEL.
Support for the change
These changes will increase transparency and consistency in Working Capital reporting for SMP markets, improving accuracy.
Key changes in accounting documents
The AMD will be updated for this methodology change in the following sections:
Section 7 (Apportionment Models) for the removal of a VAT apportionment model (DTTCY); and
Section 12 (Components) for Revenue Receivables and Notional Creditor components.
Section 3 – Explanation of methodology changes
Page 31
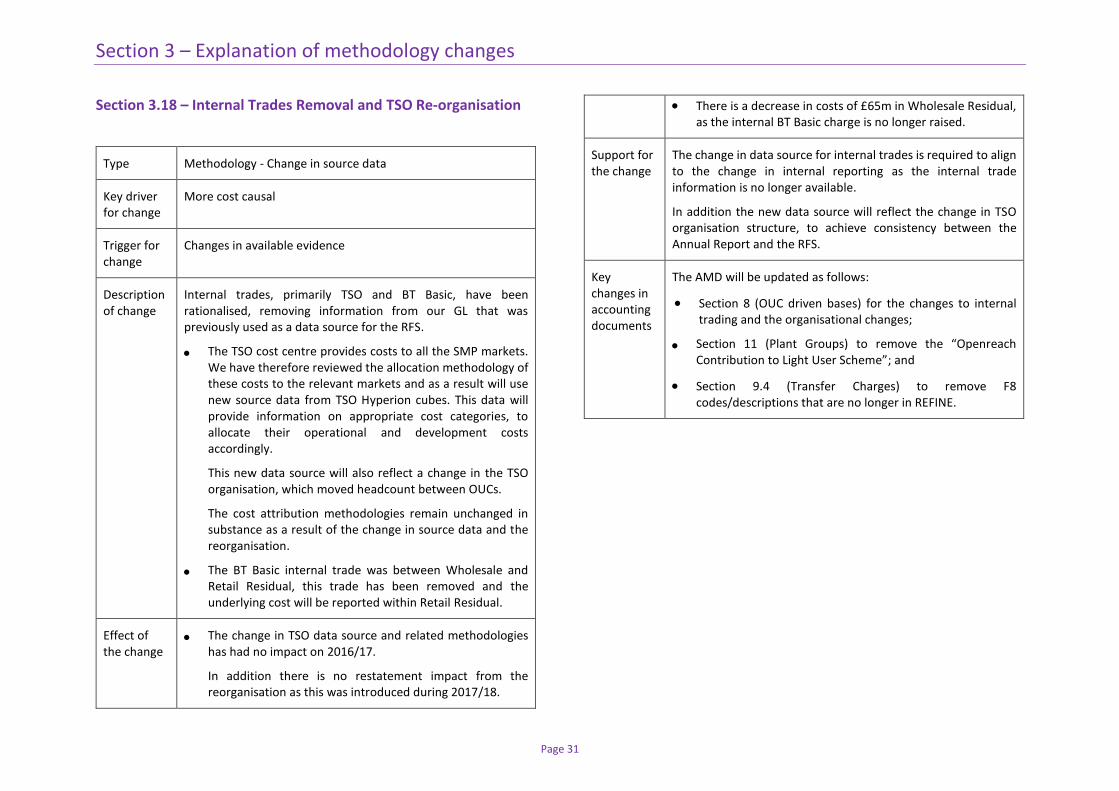
Section 3.18 – Internal Trades Removal and TSO Re-organisation
Type Methodology - Change in source data
Key driver for change
More cost causal
Trigger for change
Changes in available evidence
Description of change
Internal trades, primarily TSO and BT Basic, have been rationalised, removing information from our GL that was previously used as a data source for the RFS.
The TSO cost centre provides costs to all the SMP markets. We have therefore reviewed the allocation methodology of these costs to the relevant markets and as a result will use new source data from TSO Hyperion cubes. This data will provide information on appropriate cost categories, to allocate their operational and development costs accordingly.
This new data source will also reflect a change in the TSO organisation, which moved headcount between OUCs.
The cost attribution methodologies remain unchanged in substance as a result of the change in source data and the reorganisation.
The BT Basic internal trade was between Wholesale and Retail Residual, this trade has been removed and the underlying cost will be reported within Retail Residual.
Effect of the change
The change in TSO data source and related methodologies has had no impact on 2016/17.
In addition there is no restatement impact from the reorganisation as this was introduced during 2017/18.
There is a decrease in costs of £65m in Wholesale Residual, as the internal BT Basic charge is no longer raised.
Support for the change
The change in data source for internal trades is required to align to the change in internal reporting as the internal trade information is no longer available.
In addition the new data source will reflect the change in TSO organisation structure, to achieve consistency between the Annual Report and the RFS.
Key changes in accounting documents
The AMD will be updated as follows:
Section 8 (OUC driven bases) for the changes to internal trading and the organisational changes;
Section 11 (Plant Groups) to remove the “Openreach Contribution to Light User Scheme”; and
Section 9.4 (Transfer Charges) to remove F8 codes/descriptions that are no longer in REFINE.
Section 3 – Explanation of methodology changes
Page 32
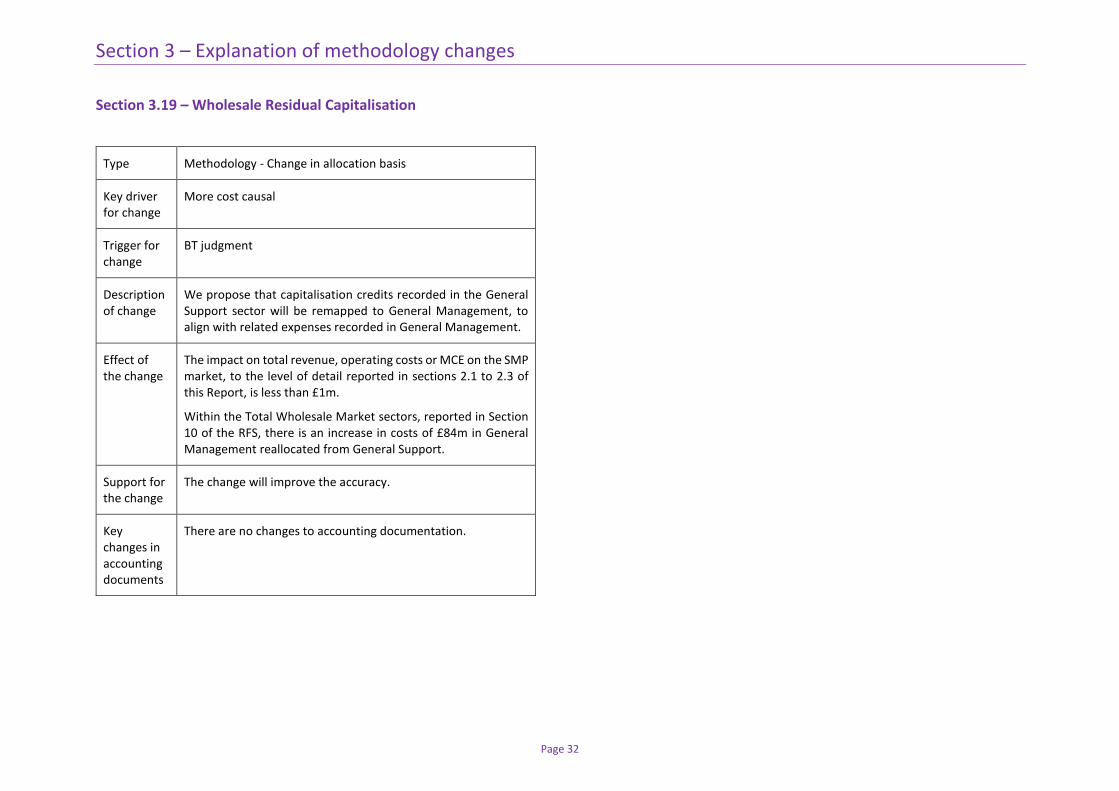
Section 3.19 – Wholesale Residual Capitalisation
Type Methodology - Change in allocation basis
Key driver for change
More cost causal
Trigger for change
BT judgment
Description of change
We propose that capitalisation credits recorded in the General Support sector will be remapped to General Management, to align with related expenses recorded in General Management.
Effect of the change
The impact on total revenue, operating costs or MCE on the SMP market, to the level of detail reported in sections 2.1 to 2.3 of this Report, is less than £1m.
Within the Total Wholesale Market sectors, reported in Section 10 of the RFS, there is an increase in costs of £84m in General Management reallocated from General Support.
Support for the change
The change will improve the accuracy.
Key changes in accounting documents
There are no changes to accounting documentation.
Section 3 – Explanation of methodology changes
Page 33
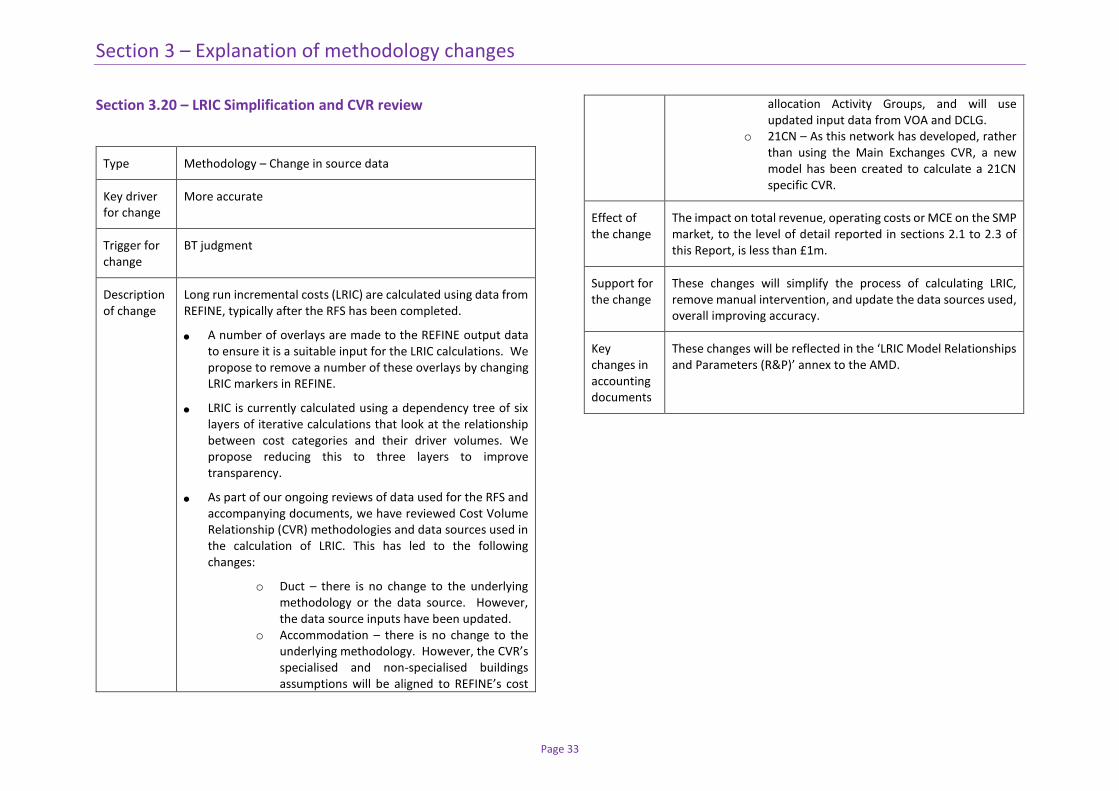
Section 3.20 – LRIC Simplification and CVR review
Type Methodology – Change in source data
Key driver for change
More accurate
Trigger for change
BT judgment
Description of change
Long run incremental costs (LRIC) are calculated using data from REFINE, typically after the RFS has been completed.
A number of overlays are made to the REFINE output data to ensure it is a suitable input for the LRIC calculations. We propose to remove a number of these overlays by changing LRIC markers in REFINE.
LRIC is currently calculated using a dependency tree of six layers of iterative calculations that look at the relationship between cost categories and their driver volumes. We propose reducing this to three layers to improve transparency.
As part of our ongoing reviews of data used for the RFS and accompanying documents, we have reviewed Cost Volume Relationship (CVR) methodologies and data sources used in the calculation of LRIC. This has led to the following changes:
o Duct – there is no change to the underlying methodology or the data source. However, the data source inputs have been updated.
o Accommodation – there is no change to the underlying methodology. However, the CVR’s specialised and non-specialised buildings assumptions will be aligned to REFINE’s cost
allocation Activity Groups, and will use updated input data from VOA and DCLG.
o 21CN – As this network has developed, rather than using the Main Exchanges CVR, a new model has been created to calculate a 21CN specific CVR.
Effect of the change
The impact on total revenue, operating costs or MCE on the SMP market, to the level of detail reported in sections 2.1 to 2.3 of this Report, is less than £1m.
Support for the change
These changes will simplify the process of calculating LRIC, remove manual intervention, and update the data sources used, overall improving accuracy.
Key changes in accounting documents
These changes will be reflected in the ‘LRIC Model Relationships and Parameters (R&P)’ annex to the AMD.
Section 3 – Explanation of methodology changes
Page 34
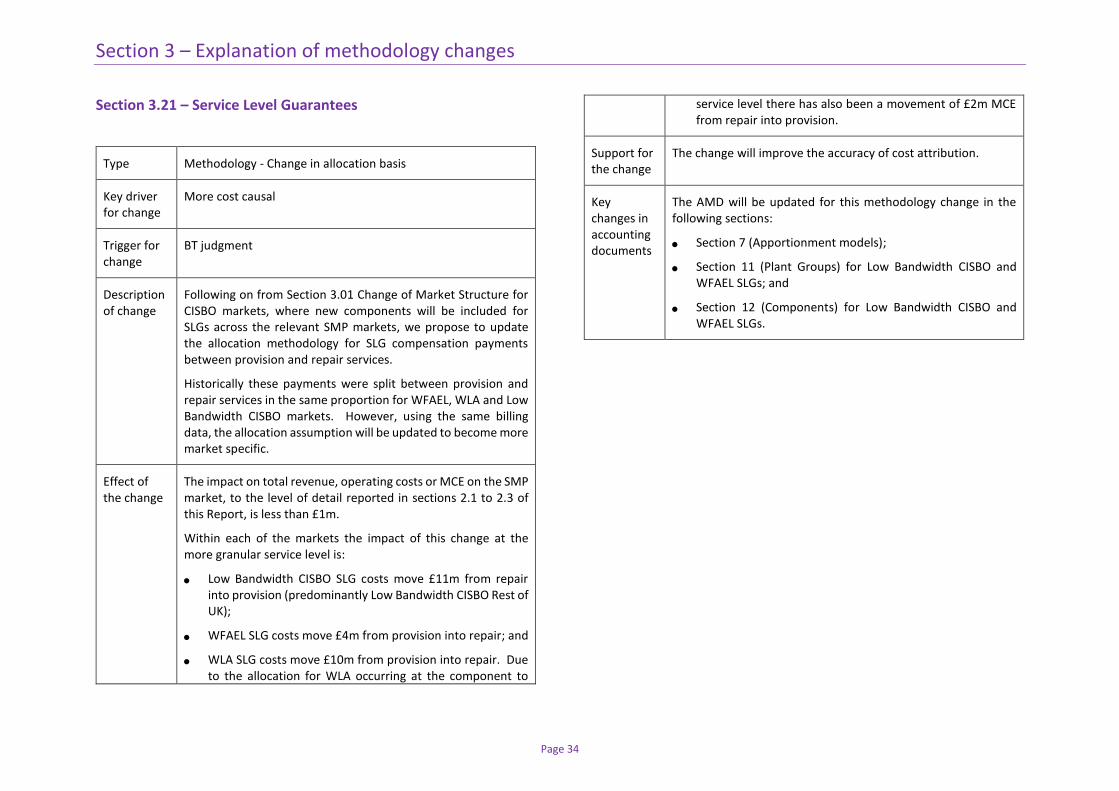
Section 3.21 – Service Level Guarantees
Type Methodology - Change in allocation basis
Key driver for change
More cost causal
Trigger for change
BT judgment
Description of change
Following on from Section 3.01 Change of Market Structure for CISBO markets, where new components will be included for SLGs across the relevant SMP markets, we propose to update the allocation methodology for SLG compensation payments between provision and repair services.
Historically these payments were split between provision and repair services in the same proportion for WFAEL, WLA and Low Bandwidth CISBO markets. However, using the same billing data, the allocation assumption will be updated to become more market specific.
Effect of the change
The impact on total revenue, operating costs or MCE on the SMP market, to the level of detail reported in sections 2.1 to 2.3 of this Report, is less than £1m.
Within each of the markets the impact of this change at the more granular service level is:
Low Bandwidth CISBO SLG costs move £11m from repair into provision (predominantly Low Bandwidth CISBO Rest of UK);
WFAEL SLG costs move £4m from provision into repair; and
WLA SLG costs move £10m from provision into repair. Due to the allocation for WLA occurring at the component to
service level there has also been a movement of £2m MCE from repair into provision.
Support for the change
The change will improve the accuracy of cost attribution.
Key changes in accounting documents
The AMD will be updated for this methodology change in the following sections:
Section 7 (Apportionment models);
Section 11 (Plant Groups) for Low Bandwidth CISBO and WFAEL SLGs; and
Section 12 (Components) for Low Bandwidth CISBO and WFAEL SLGs.
Section 3 – Explanation of methodology changes
Page 35
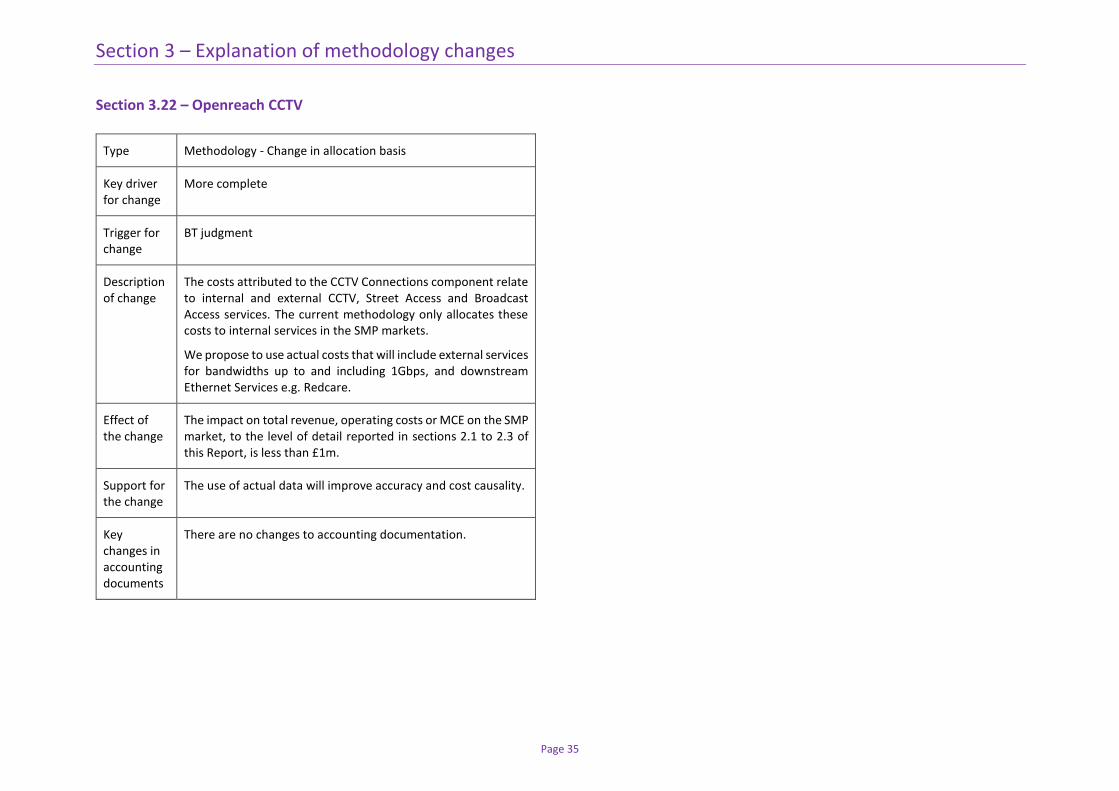
Section 3.22 – Openreach CCTV
Type Methodology - Change in allocation basis
Key driver for change
More complete
Trigger for change
BT judgment
Description of change
The costs attributed to the CCTV Connections component relate to internal and external CCTV, Street Access and Broadcast Access services. The current methodology only allocates these costs to internal services in the SMP markets.
We propose to use actual costs that will include external services for bandwidths up to and including 1Gbps, and downstream Ethernet Services e.g. Redcare.
Effect of the change
The impact on total revenue, operating costs or MCE on the SMP market, to the level of detail reported in sections 2.1 to 2.3 of this Report, is less than £1m.
Support for the change
The use of actual data will improve accuracy and cost causality.
Key changes in accounting documents
There are no changes to accounting documentation.
Section 3 – Explanation of methodology changes
Page 36
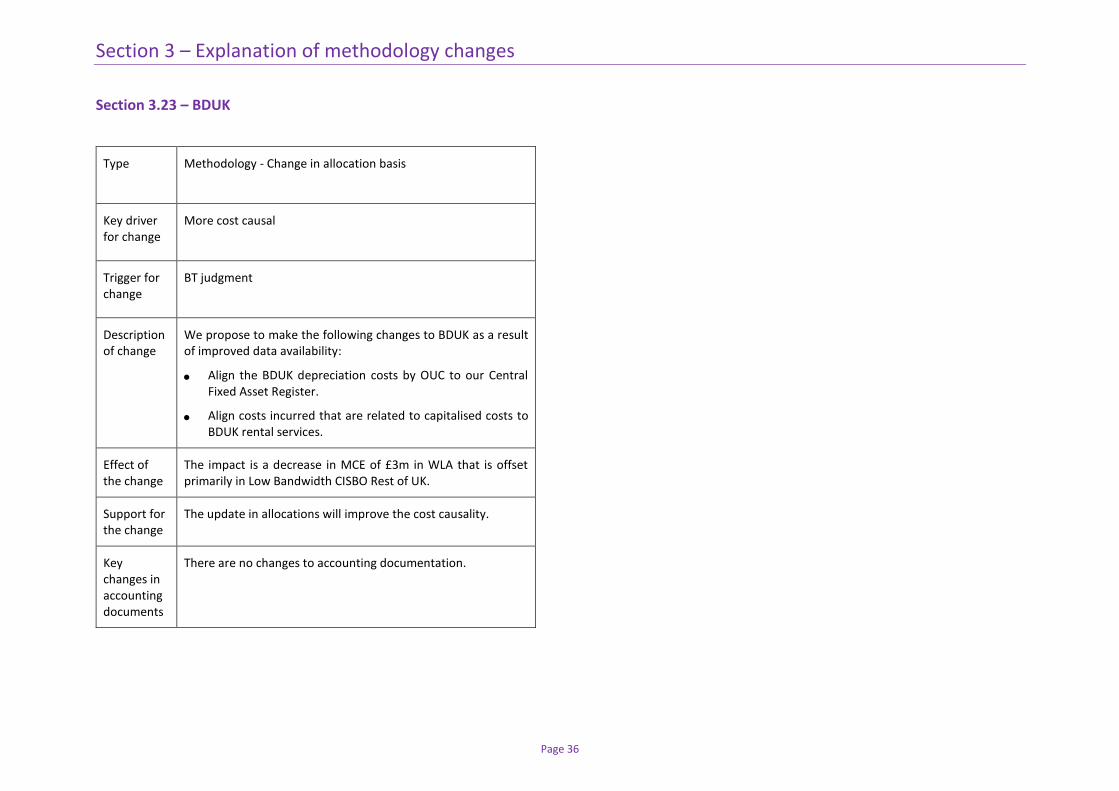
Section 3.23 – BDUK
Type Methodology - Change in allocation basis
Key driver for change
More cost causal
Trigger for change
BT judgment
Description of change
We propose to make the following changes to BDUK as a result of improved data availability:
Align the BDUK depreciation costs by OUC to our Central Fixed Asset Register.
Align costs incurred that are related to capitalised costs to BDUK rental services.
Effect of the change
The impact is a decrease in MCE of £3m in WLA that is offset primarily in Low Bandwidth CISBO Rest of UK.
Support for the change
The update in allocations will improve the cost causality.
Key changes in accounting documents
There are no changes to accounting documentation.
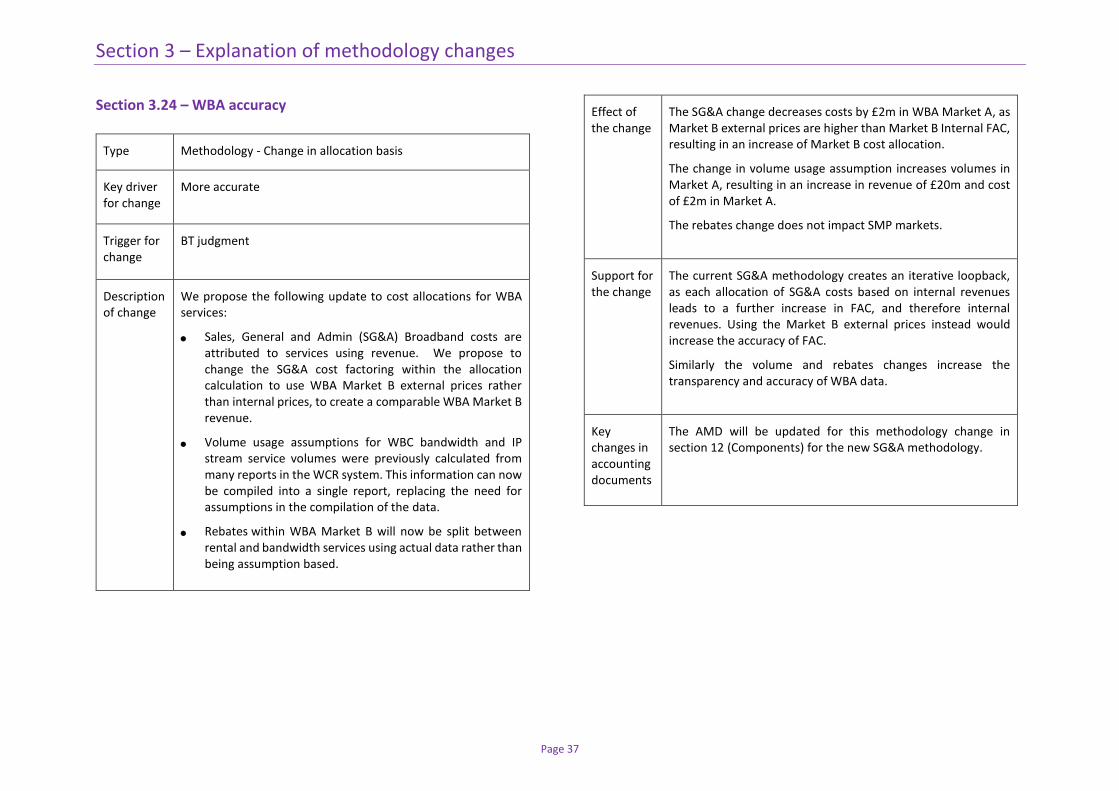
Section 3 – Explanation of methodology changes
Page 37
Section 3.24 – WBA accuracy
Type Methodology - Change in allocation basis
Key driver for change
More accurate
Trigger for change
BT judgment
Description of change
We propose the following update to cost allocations for WBA services:
Sales, General and Admin (SG&A) Broadband costs are attributed to services using revenue. We propose to change the SG&A cost factoring within the allocation calculation to use WBA Market B external prices rather than internal prices, to create a comparable WBA Market B revenue.
Volume usage assumptions for WBC bandwidth and IP stream service volumes were previously calculated from many reports in the WCR system. This information can now be compiled into a single report, replacing the need for assumptions in the compilation of the data.
Rebates within WBA Market B will now be split between rental and bandwidth services using actual data rather than being assumption based.
Effect of the change
The SG&A change decreases costs by £2m in WBA Market A, as Market B external prices are higher than Market B Internal FAC, resulting in an increase of Market B cost allocation.
The change in volume usage assumption increases volumes in Market A, resulting in an increase in revenue of £20m and cost of £2m in Market A.
The rebates change does not impact SMP markets.
Support for the change
The current SG&A methodology creates an iterative loopback, as each allocation of SG&A costs based on internal revenues leads to a further increase in FAC, and therefore internal revenues. Using the Market B external prices instead would increase the accuracy of FAC.
Similarly the volume and rebates changes increase the transparency and accuracy of WBA data.
Key changes in accounting documents
The AMD will be updated for this methodology change in section 12 (Components) for the new SG&A methodology.
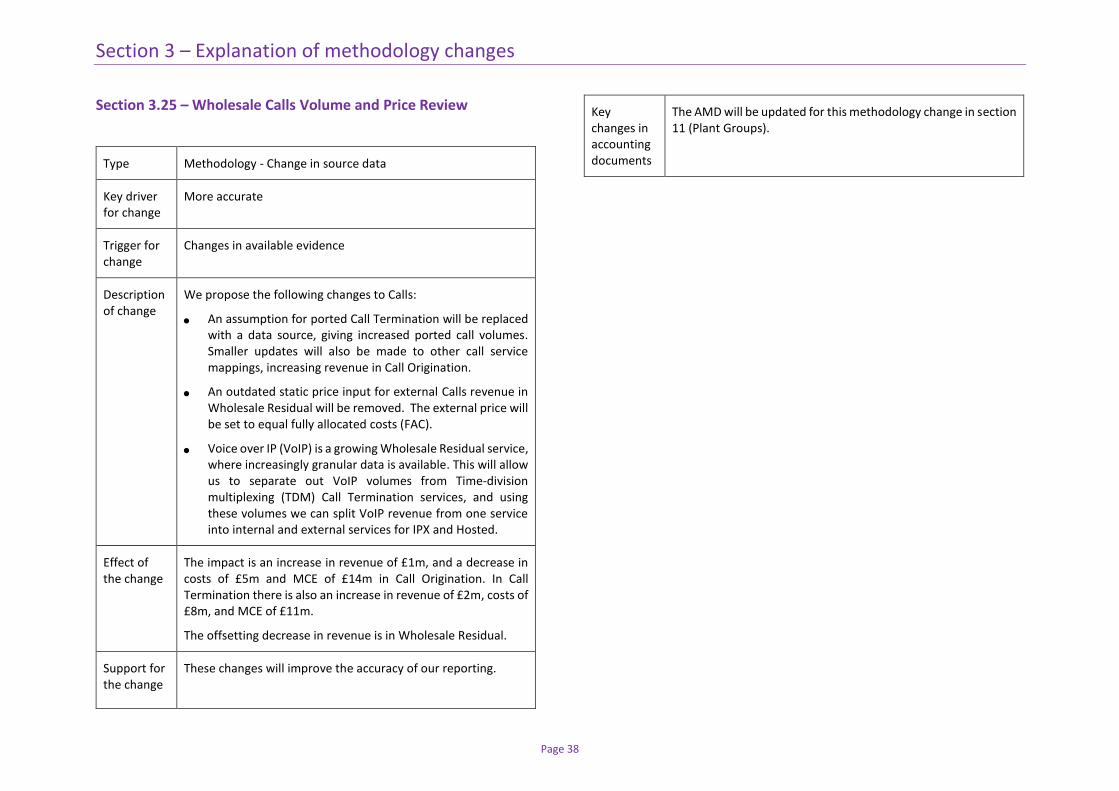
Section 3 – Explanation of methodology changes
Page 38
Section 3.25 – Wholesale Calls Volume and Price Review
Type Methodology - Change in source data
Key driver for change
More accurate
Trigger for change
Changes in available evidence
Description of change
We propose the following changes to Calls:
An assumption for ported Call Termination will be replaced with a data source, giving increased ported call volumes. Smaller updates will also be made to other call service mappings, increasing revenue in Call Origination.
An outdated static price input for external Calls revenue in Wholesale Residual will be removed. The external price will be set to equal fully allocated costs (FAC).
Voice over IP (VoIP) is a growing Wholesale Residual service, where increasingly granular data is available. This will allow us to separate out VoIP volumes from Time-division multiplexing (TDM) Call Termination services, and using these volumes we can split VoIP revenue from one service into internal and external services for IPX and Hosted.
Effect of the change
The impact is an increase in revenue of £1m, and a decrease in costs of £5m and MCE of £14m in Call Origination. In Call Termination there is also an increase in revenue of £2m, costs of £8m, and MCE of £11m.
The offsetting decrease in revenue is in Wholesale Residual.
Support for the change
These changes will improve the accuracy of our reporting.
Key changes in accounting documents
The AMD will be updated for this methodology change in section 11 (Plant Groups).
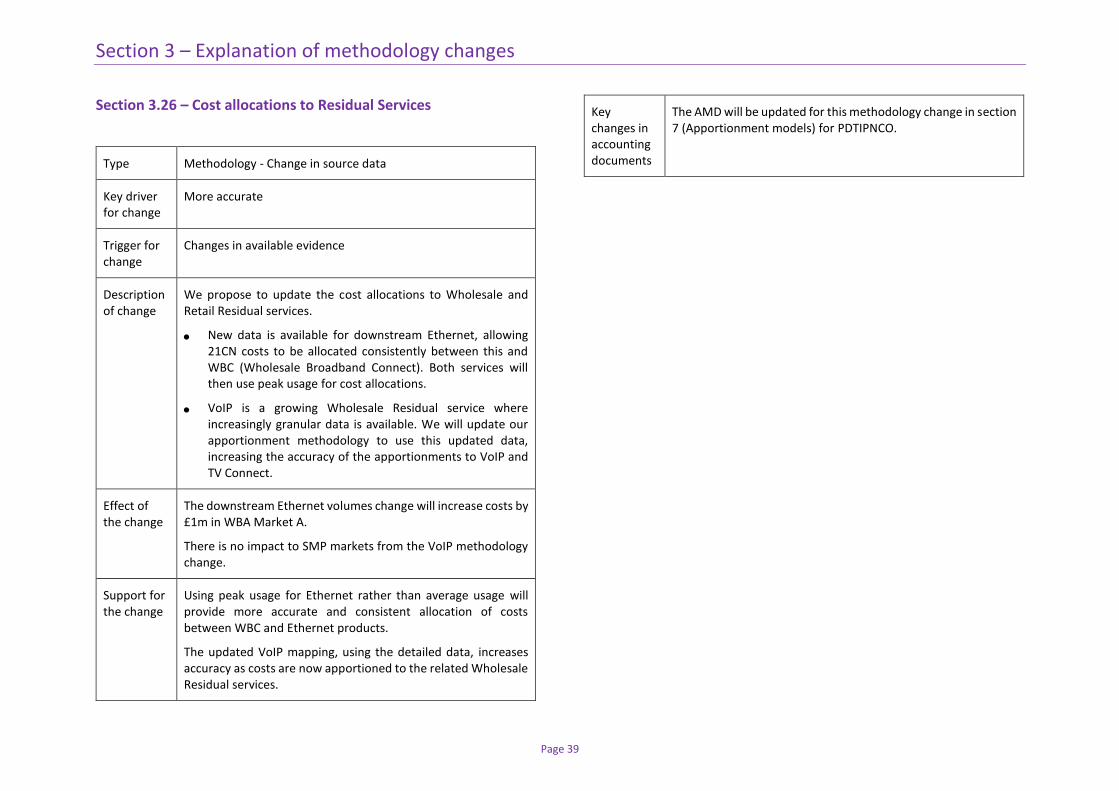
Section 3 – Explanation of methodology changes
Page 39
Section 3.26 – Cost allocations to Residual Services
Type Methodology - Change in source data
Key driver for change
More accurate
Trigger for change
Changes in available evidence
Description of change
We propose to update the cost allocations to Wholesale and Retail Residual services.
New data is available for downstream Ethernet, allowing 21CN costs to be allocated consistently between this and WBC (Wholesale Broadband Connect). Both services will then use peak usage for cost allocations.
VoIP is a growing Wholesale Residual service where increasingly granular data is available. We will update our apportionment methodology to use this updated data, increasing the accuracy of the apportionments to VoIP and TV Connect.
Effect of the change
The downstream Ethernet volumes change will increase costs by £1m in WBA Market A.
There is no impact to SMP markets from the VoIP methodology change.
Support for the change
Using peak usage for Ethernet rather than average usage will provide more accurate and consistent allocation of costs between WBC and Ethernet products.
The updated VoIP mapping, using the detailed data, increases accuracy as costs are now apportioned to the related Wholesale Residual services.
Key changes in accounting documents
The AMD will be updated for this methodology change in section 7 (Apportionment models) for PDTIPNCO.
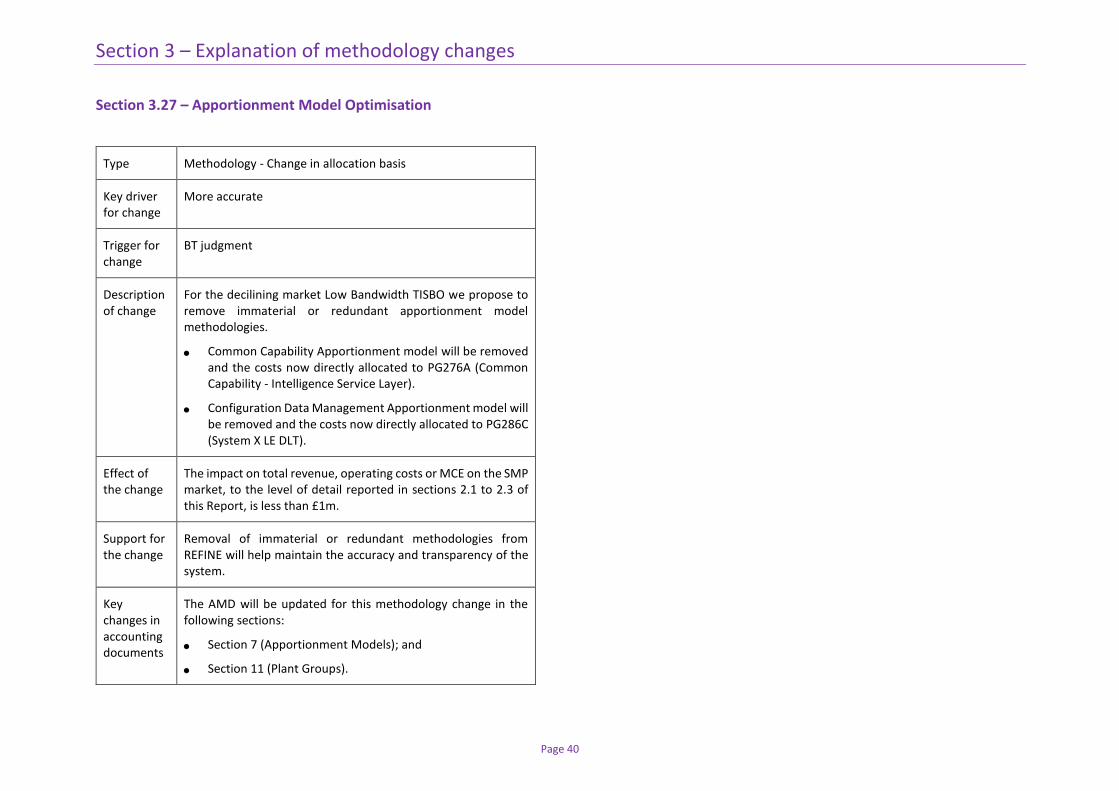
Section 3 – Explanation of methodology changes
Page 40
Section 3.27 – Apportionment Model Optimisation
Type Methodology - Change in allocation basis
Key driver for change
More accurate
Trigger for change
BT judgment
Description of change
For the decilining market Low Bandwidth TISBO we propose to remove immaterial or redundant apportionment model methodologies.
Common Capability Apportionment model will be removed and the costs now directly allocated to PG276A (Common Capability - Intelligence Service Layer).
Configuration Data Management Apportionment model will be removed and the costs now directly allocated to PG286C (System X LE DLT).
Effect of the change
The impact on total revenue, operating costs or MCE on the SMP market, to the level of detail reported in sections 2.1 to 2.3 of this Report, is less than £1m.
Support for the change
Removal of immaterial or redundant methodologies from REFINE will help maintain the accuracy and transparency of the system.
Key changes in accounting documents
The AMD will be updated for this methodology change in the following sections:
Section 7 (Apportionment Models); and
Section 11 (Plant Groups).
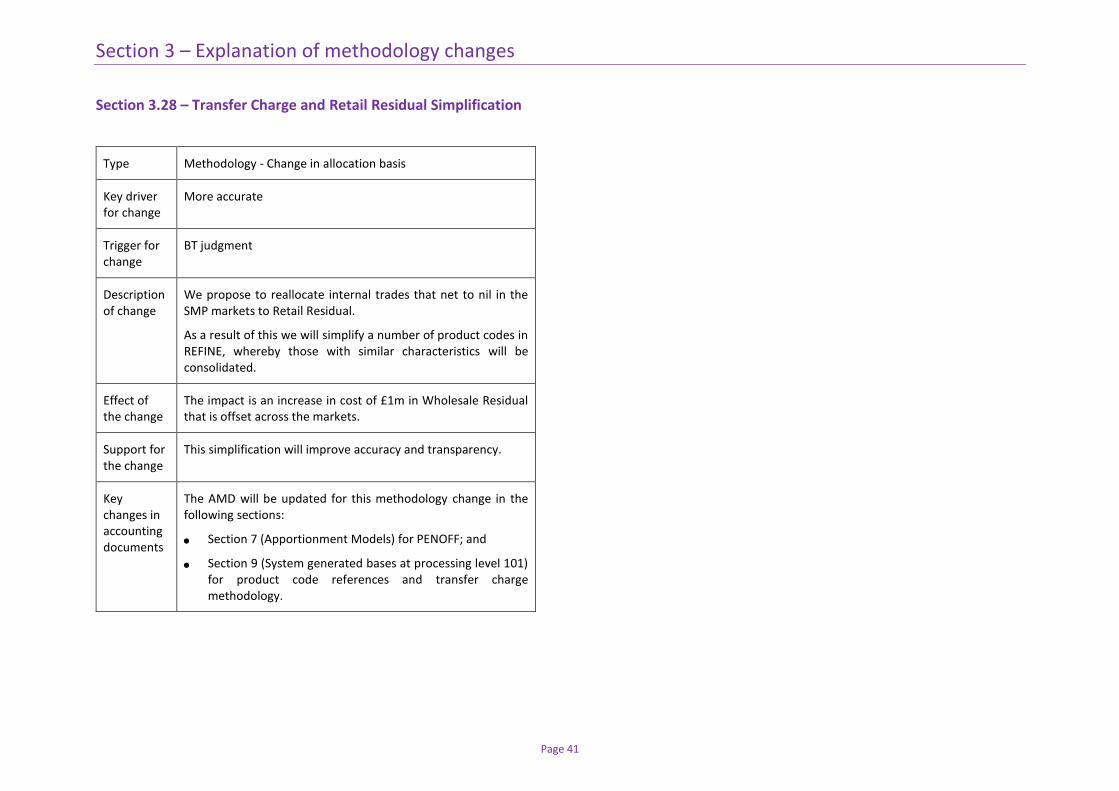
Section 3 – Explanation of methodology changes
Page 41
Section 3.28 – Transfer Charge and Retail Residual Simplification
Type Methodology - Change in allocation basis
Key driver for change
More accurate
Trigger for change
BT judgment
Description of change
We propose to reallocate internal trades that net to nil in the SMP markets to Retail Residual.
As a result of this we will simplify a number of product codes in REFINE, whereby those with similar characteristics will be consolidated.
Effect of the change
The impact is an increase in cost of £1m in Wholesale Residual that is offset across the markets.
Support for the change
This simplification will improve accuracy and transparency.
Key changes in accounting documents
The AMD will be updated for this methodology change in the following sections:
Section 7 (Apportionment Models) for PENOFF; and
Section 9 (System generated bases at processing level 101) for product code references and transfer charge methodology.

Appendix
Page 42
Appendix

Appendix
Page 43
Appendix 1 - Template for change control provided in Ofcom’s Regulatory
Financial Reporting Final Statement (May 2014):
Title Short title for each change
Type
Select from 1) Change in allocation basis; 2) change in valuation methodology; 3) change in source data; or 4) other
Key driver for change
State key driver based on Regulatory Accounting Principles Select from: 1) more complete; 2) more accurate; 3) more objective; 4) more consistent with regulatory decisions; 5) more cost causal; 6) more compliant with statutory accounting standards; or 7) more consistent
Trigger for change Select from 1) BT judgment; 2) Regulatory decision; 3) changes in available evidence; or 4) other
Description of change
A short explanation of the new methodology and how it differs from the old methodology
Effect of the change
A description of the impact of the change in terms of the components most affected and the general impact of the change and the markets and services that are most affected by the changes
Support for the change
A detailed justification for the change and the evidence taken into account to support the change
Key changes in accounting documents
Set out key changes to accounting documents