Embed Size (px)
Citation preview
CHANCE News 13.06November 2, 2004 to December 31, 2004
Prepared by J. Laurie Snell, Bill Peterson, Jeanne Albert, and Charles Grinstead with help from Fuxing Hou and Joan Snell. We are now using a listserv to send out notices that a new Chance News has been posted on the Chance Website. You can sign on or off or change your address at This listserv is used only for this posting and not for comments on Chance News. We do appreciate comments and suggestions for new articles. Please send these to [email protected].
here.
The current and previous issues of Chance News and other materials for teaching a Chance course are available from the .
Chance web site
Chance News is distributed under the GNU General Public License (so-called 'copyleft'). See the end of the newsletter for details.
If it moves, it’s biology; if it changes color, it’s chemistry; if it breaks, it’s physics; if it puts you to sleep, it’s statistics.
Bob Hogg, University of Iowa
Contents of Chance News 13.06
.
.
.
.
.
(1) Forsooth
(2) Catastrophe: risk and analysis
(3) Using a risk thermometer to sentence the guilty.
(4) Miracle on probability street.
(5) Who are the nation's 'cheapskates'? Try the blue ones
(6) Misleading numbers in the news
(7) Counting the casualties; the Iraq war
(8) Regression to the mean in the stock market.
(9) Getting statistics out of the hands of politicians.
(10) Lies and statistics.
(11) Measuring productivity.
(12) Deaths from natural causes spike during the holidays.
(13) Holiday death statistics: Bah, humbug!
(14) Using graphics to show election results.
(15) How did the polls do?
(16) Understanding the polls.
(17) How did the political markets do?
(18) Using meta-studies to predict the electoral vote.
1/10/05 11:54 AMChance News 13.06
Page 1 of 19file://localhost/Users/video/Desktop/chance_news/current_news/current.html
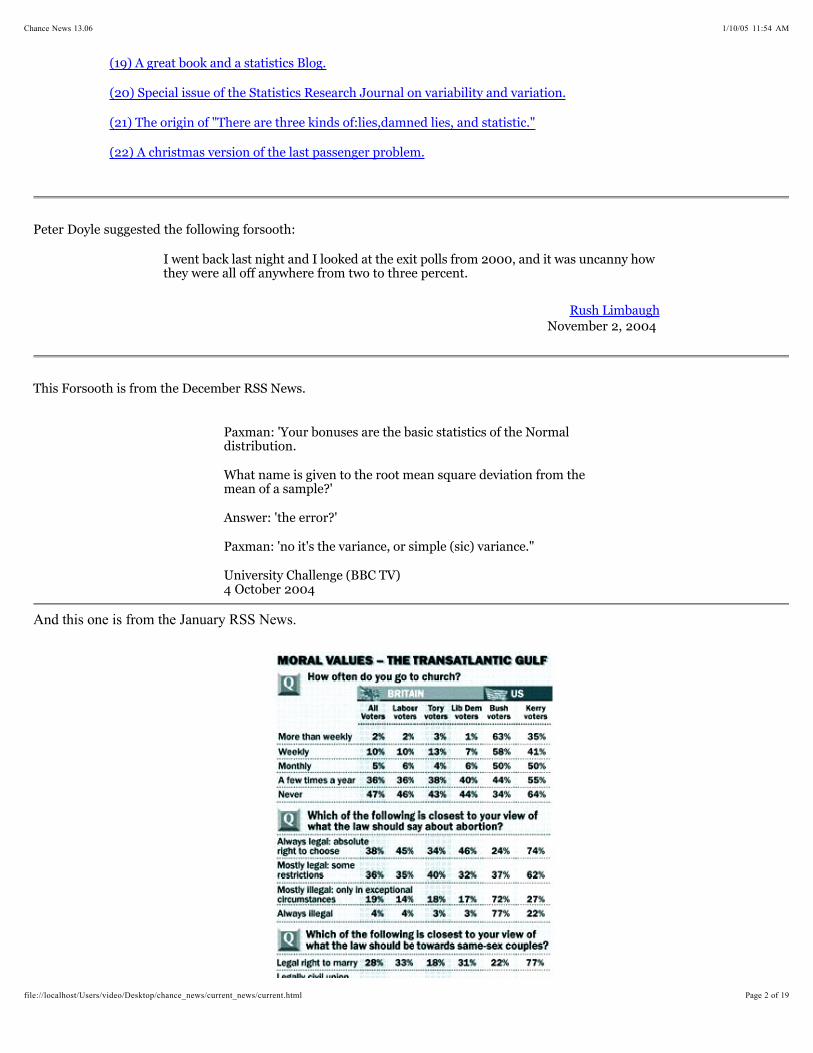
And this one is from the January RSS News.
(19) A great book and a statistics Blog.
(20) Special issue of the Statistics Research Journal on variability and variation.
(21) The origin of "There are three kinds of:lies,damned lies, and statistic."
(22) A christmas version of the last passenger problem.
Peter Doyle suggested the following forsooth:
I went back last night and I looked at the exit polls from 2000, and it was uncanny how they were all off anywhere from two to three percent.
November 2, 2004 Rush Limbaugh
This Forsooth is from the December RSS News.
Paxman: 'Your bonuses are the basic statistics of the Normal distribution.
What name is given to the root mean square deviation from the mean of a sample?'
Answer: 'the error?'
Paxman: 'no it's the variance, or simple (sic) variance."
University Challenge (BBC TV)4 October 2004
1/10/05 11:54 AMChance News 13.06
Page 2 of 19file://localhost/Users/video/Desktop/chance_news/current_news/current.html

. (London), 11 November 2004
Peter Riddell
On God and sex there is a moral divide between Britain and USThe Times
DISCUSSION QUESIONS:
(1) How should this table be interpreted?(2) The article reports "British and American voters have sharply different attitudes to churchgoing and abortion."Once you interpret the table correctly what differences do you see?
Here is a Forsooth from the :New York Times
From the Drudge Report to Wonkette to DailyKos, Web sites were often reporting the survey data in its pure form -- Kerry 50; Bush 49 in Ohio -- without explaining in depth important caveats, such as that the results fell within a margin of error. So in Ohio, for instance, the first report fell with a margin of error of plus or minus five percentage points, meaning a candidate would have to have a lead of more than 10 points to have a statistically significant lead.
Survey experts cite problems with data and interpretation. 4 Nov.,2004, Sec. P p.5
Jim Rutenberg New York Times
And here is another one from the taken from our next item.New York Times
The expected costs of a future event are the costs of that event, if it should happen, divided by the probability that it will happen. Thus if I offer you $1,00o if a tossed coin turns up heads, the expected cost of my offer is $500.
, Book Reviews, 2 Jan, 2005,p. 12New York Times
, 2 Jan 2005, Book reviews, p.12Peter Singer
Risk and response.New York Times
This is a review of a new book: by Richard Posner published by Oxford University Press, November 2004. Richard Posner is a judge on the United States Court of Appeals from the Seventh Circuit, and a senior lecturer at the University of Chicago Law School.
Catastrophe: Risk and Response
Posner feels that we often do not take seriously low probability, high risk, events such as Global Warming, biodiversity, asteroid collisions, and terrorism. He asks us to consider the expected value of the cost of such an event. The reviewer Peter Singer remarks that most of us would asses large risks differently than small risks, remarking:
We may pay a steep price to reduce a risk of one in a thousand to one in ten thousand, but we are not much concerned about reducing a risk of one in a million to one in a billion. Posner... suggests that the value of a human life actually varies in accordance with the degree of risk we are considering -- so that the loss of each human life in a highly improbable catastrophe should be valued only at $50,000 instead of the $5 million that it would be valued at if we were considering a more likely disaster. This is bizarre. The real worth of our lives has nothing to do with the probability of a particular cause of death.
1/10/05 11:54 AMChance News 13.06
Page 3 of 19file://localhost/Users/video/Desktop/chance_news/current_news/current.html

Frank Duckworth, the editor of RSS News, and other members of the Royal Statistical Society attempted to develop a "Richter scale" that might used to indicate the degree of a risk ( ). They proposed that the expected value be used for monetary risks but proposed a more complicated method of evaluating risks involving a change in quality of life or deaths.
See Chance News 7.11
Posner suggests possible practical recommendations for responding to catastrophic risks which the review says "seem calculated to parcel out irritation to everyone." But despite his concerns Singer concludes with:
Still, we would be well advised to set aside such minor discontents and take the message of this book seriously. We ignore it at (a small risk of) our (very great ) peril.
DISCUSSION QUESTION:
Do you think it is reasonable to use only expected value to assess the cost of catastrophic events?
, 2 Jan. 2005, p. 18Emily Bazelon
Sentencing by the numbers.New York Times Magazine
This article describes a risk scale that is actually being used. In 1994 the Virginia state sentencing commission carried out a study to determine which nonviolent offenders could be kept out of prison without posing a risk of committing new crimes. They followed 1,500 nonviolent drug, larceny and fraud offenders for three years after release from prison. They found that men were 55% more likely to be rearrested than women, and offenders in the 20's were a much higher risk than offenders older than 40. Also being unemployed made offenders more likely to carry out another crime. The same was true for being single.
This study led the commission's director, Richard Kern, to design a simple 7-point scale of risk assessment to aid judges in their sentencing. If an offender has a score of 35 or less, probation or house arrest is suggested rather than jail. A score higher than 35 suggests a jail sentence.
This model was tested on prisoners released five years earlier. Of those who scored below 35, 12 percent committed new crimes as compared to 38% for those who scored higher.
These are only suggestions, so Judges are not required to use this risk scale. However, the scale is being used and has solved some of the overcrowded problems Virginia had for its jails.
DISCUSSION QUESTIONS:
(1) The article states that while Virginia is pleased with the results of using this scale, legal experts and others have serious concerns with it. What do you think these concerns are?
(2) How might drug dealers and others try to take advantage of this kind of sentencing?
Pat Philips, a student in Bill Peterson's probability class, suggested the first of these two articles which led to the second article.
The Law of Large Numbers guarantees that one-in-a-million miracles happen 295 times a day in America. , 26 August, 2004.
By Michael Shermer
Miracle on probability street.
Scientific American
The , 25 March, 2004Freeman J. Dyson
One in a million.New York Review of Books
Michael Shermer is publisher of the magazine and Director of the Skeptics Society. He writes a monthly column for the . Freeman Dyson is famous physicist and interpreter of science for the general public. These two articles provide an interesting story with a surprising ending.
SkepticsScientific American
1/10/05 11:54 AMChance News 13.06
Page 4 of 19file://localhost/Users/video/Desktop/chance_news/current_news/current.html

In the first article Shermer provides two probability calculations to show that events that might be considered as supernatural events can be shown to be not at all surprising. The first calculation is from a recent book that Dyson is reviewing in our second article. Sherman writes:
In their delightful book (Johns Hopkins University Press, 2004), CERN physicist Georges Charpak and University of Nice physicist Henri Broch show how the application of probability theory to such events (events of low probability) is enlightening. In the case of death premonitions, suppose that you know of 10 people a year who die and that you think about each of those people once a year. One year contains 105,120 five-minute intervals during which you might think about each of the 10 people, a probability of one out of 10,512--certainly an improbable event. Yet there are 295 million Americans. Assume, for the sake of our calculation, that they think like you. That makes 1/10,512 X 295,000,000 = 28,063 people a year, or 77 people a day for whom this improbable premonition becomes probable. With the well-known cognitive phenomenon of confirmation bias firmly in force (where we notice the hits and ignore the misses in support of our favorite beliefs), if just a couple of these people recount their miraculous tales in a public forum (next on Oprah!), the paranormal seems vindicated. In fact, they are merely demonstrating the laws of probability writ large.
Debunked!
His second example is taken from Dyson's review of Charpak and Broch's book . Dyson writes:Debunked
The book also has a good chapter on "Amazing Coincidences." These are strange events which appear to give evidence of supernatural influences operating in everyday life. They are not the result of deliberate fraud or trickery, but only of the laws of probability. The paradoxical feature of the laws of probability is that they make unlikely events happen unexpectedly often. A simple way to state the paradox is Littlewood's Law of Miracles. Littlewood was a famous mathematician who was teaching at Cambridge University when I was a student. Being a professional mathematician, he defined miracles precisely before stating his law about them. He defined a miracle as an event that has special significance when it occurs, but occurs with a probability of one in a million. This definition agrees with our common-sense understanding of the word "miracle."
Littlewood's Law of Miracles states that in the course of any normal person's life, miracles happen at a rate of roughly one per month. The proof of the law is simple. During the time that we are awake and actively engaged in living our lives, roughly for eight hours each day, we see and hear things happening at a rate of about one per second. So the total number of events that happen to us is about thirty thousand per day, or about a million per month. With few exceptions, these events are not miracles because they are insignificant. The chance of a miracle is about one per million events. Therefore we should expect about one miracle to happen, on the average, every month. Broch tells stories of some amazing coincidences that happened to him and his friends, all of them easily explained as consequences of Littlewood's Law.
While Dysen agrees with Sherman and Chapak and Broch that such calculations and magician's tricks can be used to debunk much of what is called paranormal behavior, he does not believe that it rules out the all of paranormal behavior. After an interesting discussion of the nature of science Dysen writes:
The hypothesis that paranormal phenomena are real but lie outside the limits of science is supported by a great mass of evidence. The evidence has been collected by the Society for Psychical Research in Britain and by similar organizations in other countries. The journal of the London society is full of stories of remarkable events in which ordinary people appear to possess paranormal abilities. The evidence is entirely anecdotal. It has nothing to do with science, since it cannot be reproduced under controlled conditions. But the evidence is there. The members of the society took great trouble to interview first-hand witnesses as soon as possible after the events, and to document the stories carefully. One fact that emerges clearly from the stories is that paranormal events occur, if they occur at all, only when people are under stress and experiencing strong emotion. This fact would immediately explain why paranormal phenomena are not observable under the conditions of a well-controlled scientific experiment. Strong emotion and stress are inherently incompatible with controlled scientific procedures. In a typical card-guessing experiment, the participants may begin the session in a high state of excitement and record a few high scores, but as the hours pass, and boredom replaces excitement, the scores decline to the 20 percent expected from random chance.
Michel Shermer ends his article with:
Freeman Dyson is one of the great minds of our time, and I admire him immensely. But even genius of this magnitude cannot override the cognitive biases that favor anecdotal thinking. The only way to find out if anecdotes represent real phenomena is controlled tests. Either people can read other people's minds (or ESP cards), or they can't. Science has unequivocally demonstrated that they can't--QED.
1/10/05 11:54 AMChance News 13.06
Page 5 of 19file://localhost/Users/video/Desktop/chance_news/current_news/current.html

DISCUSSION QUESTIONS:
(1) How does Shermer get his headline: The Law of Large Numbers guarantees that one-in-a-million miracles happen 295 times a day in America?
(2) Does it surprise you that a famous scientist would support the existence of paranormal behavior?
, 22 December 2004G. Jeffrey MacDonald
Who are the nation's 'cheapskates'? Try the blue ones.Christian Science Monitor
A Massachusetts organization called the uses Internal Revenue Service data to compute an , which compares each state's average itemized charitable deduction to it's average adjusted gross income. Mississippi is
the poorest state in terms of average income, but it ranks first in charitable giving as a proportion of income. By contrast, Connecticut, which has the highest average income, ranks 44th in charitable giving as a proportion of income. This inverse relationship between income and proportion of giving appears to be the general trend.
Catalogue for Philanthropy Index of Generosity
George McCully, president of the organization, sees religion as a key factor in the lower income states. By contrast, in the Northeast, he says that "religion doesn't help our giving. I wouldn't say it hurts, but it doesn't help either." Others see a difference between "old money" and new, noting that during the late 1990s technology boom, when many new fortunes were created, private giving doubled in Massachusetts.
The article provides the following warnings about interpreting the results.
Researchers admit tax return data reveal only so much. Better analysis is needed to account for the fact that high earners tend to itemize deductions more often than low earners, and high-tax states also produce more itemizations than low-tax states - both factors that can skew study results.
DISCUSSION QUESTIONS:
(1) In what direction would the factors noted above skew the results?
(2) The article notes that:
What puzzles some researchers is not just the parsimony of the wealthy states, but also the pattern. The same Northeastern "blue" states - those labeled Democratic at election time - have appeared near the bottom of the list in every year since the index began keeping track in 1997. And the same "red" - or Republican - states are always near the top. Does this mean that Democrats contribute a smaller proportion of their incomes than do Republicans?
Misleading numbers in the news.A look at numbers behind Social Security, illegal immigrants and Iraqi civilians killed.
, 5 December 2004John Allen Paulos ABCNews.com
In this installment of his column, Paulos takes a closer look at some widely quoted statements from current news stories.
Who's Counting
The first concerns the Bush Administration's proposal to partially privatize Social Security. Many news stories have stated that the proposal would redirect 2% of current social security taxes into private accounts, a figure that makes the change sound small. In fact, Paulos explains that American taxpayers now contribute an average of 6.2% of their taxable income to Social Security, which would be reduced to 4.2% under the new proposal. The cut is two percentage points, but it amounts to a 32% reduction in contributions!
magazine reports that 3 million illegal immigrants enter the US annually from Mexico. Paulos cites two problems with this figure. First, it is based on border agents' reports of 1 million arrests each year. But this ignores the facts that the same individuals get multiply counted if they fail on repeated attempts to enter the US. The 1 million is then inflated to 3 million based on agents' guesstimates that three times as many illegal immigrants elude capture as are caught. The softness of the estimates gets left out of the sound bites, and Paulos observes that the 3 million figure has "now attained a life of its own."
Time
1/10/05 11:54 AMChance News 13.06
Page 6 of 19file://localhost/Users/video/Desktop/chance_news/current_news/current.html

Paulos' final example concerns estimates of civilian casualties in Iraq. The journal recently published research estimating that 100,000 Iraqi civilians had lost their lives in the war, with most deaths presumably attributable to the aerial bombing campaign. The figure is based on a cluster sample, involving 33 clusters of 30 households. The clusters were randomly selected from around the country, not including Fallujah, which because of its central role in the insurgency is an obvious outlier. The figure is substantially higher than the 15,000 deaths included in the Iraq Body Count (IBC), a list of names compiled by British researchers from published accounts. While Paulos concedes that the actual number is most likely higher than the IBC, he notes that the margin of sampling error for the cluster sample is plus or minus 93,000, so the interval estimate is 8,000 to 194,000! He cites a number of other potential difficulties with the survey, none of which tend to receive attention in news reports.
Lancet
Lancet
The next five items were suggested by John Gavin. The first one discusses the estimation of the casualties in Iraq mentioned in Paulos' column.
CountingThe , 6 November,2004
the casualties; the Iraq war.Economist
Gavin remarked that this article is unusual in that it includes a detailed account of how the authors of the made their estimate for the number of casualties in the Iraq war.The article also describes possible problems with the estimation, including comments on the study from experts.
Lancet article
There is also an interesting discussion of why the estimate of 100,000 is so much larger than the 15,000 estimate based on the media accounts referred to by Paulos.
Mean question about the stock market returns., Weekend edition Oct. 30/31, 2004Financial Times
SafeHaven, 16 January, 2004,artical-1232Andrew Smithers
Pension funds and forecasts of equity returns.
SafeHaven, 17 September, 2004, article-1972Andrew Smithers
A case of panic now not later.
The article begins with the following remarks:Financial Times
Are stock market returns random or do they revert to the mean?
This is an extremely important question for investors. If the former is the case, then history is irrelevant. But if the latter, then the high returns of the 1980s and 1990s have an inevitable consequence; low returns for the foreseeable future.
Most analysis of the data has found little evidence of any reversion to the mean over the short term.
Smithers says that the best argument for regression to the mean can be found by looking at the longer term. In his 17 September article we find the following graphic:
1/10/05 11:54 AMChance News 13.06
Page 7 of 19file://localhost/Users/video/Desktop/chance_news/current_news/current.html
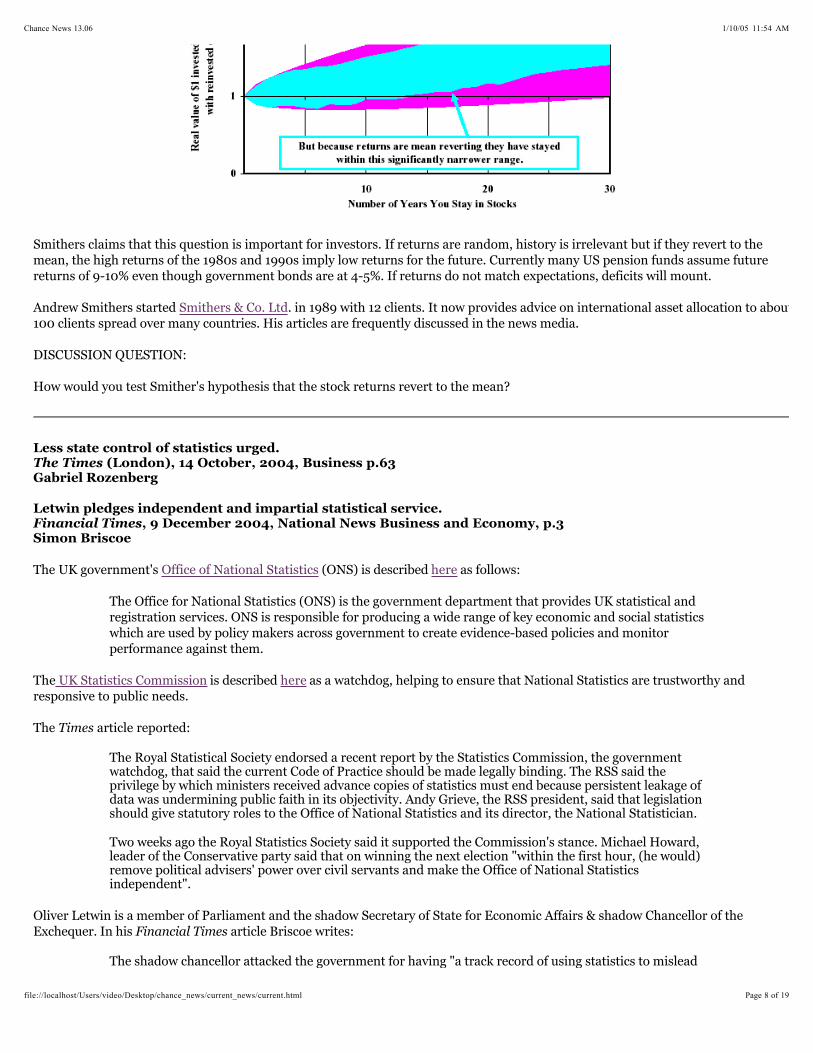
Smithers claims that this question is important for investors. If returns are random, history is irrelevant but if they revert to the mean, the high returns of the 1980s and 1990s imply low returns for the future. Currently many US pension funds assume future returns of 9-10% even though government bonds are at 4-5%. If returns do not match expectations, deficits will mount.
Andrew Smithers started . in 1989 with 12 clients. It now provides advice on international asset allocation to about 100 clients spread over many countries. His articles are frequently discussed in the news media.
Smithers & Co. Ltd
DISCUSSION QUESTION:
How would you test Smither's hypothesis that the stock returns revert to the mean?
Less state control of statistics urged.(London), 14 October, 2004, Business p.63
Gabriel RozenbergThe Times
Letwin pledges independent and impartial statistical service., 9 December 2004, National News Business and Economy, p.3
Simon Briscoe Financial Times
The UK government's (ONS) is described as follows:Office of National Statistics here
The Office for National Statistics (ONS) is the government department that provides UK statistical and registration services. ONS is responsible for producing a wide range of key economic and social statistics which are used by policy makers across government to create evidence-based policies and monitor performance against them.
The is described as a watchdog, helping to ensure that National Statistics are trustworthy and responsive to public needs.
UK Statistics Commission here
The article reported:Times
The Royal Statistical Society endorsed a recent report by the Statistics Commission, the government watchdog, that said the current Code of Practice should be made legally binding. The RSS said the privilege by which ministers received advance copies of statistics must end because persistent leakage of data was undermining public faith in its objectivity. Andy Grieve, the RSS president, said that legislation should give statutory roles to the Office of National Statistics and its director, the National Statistician.
Two weeks ago the Royal Statistics Society said it supported the Commission's stance. Michael Howard, leader of the Conservative party said that on winning the next election "within the first hour, (he would) remove political advisers' power over civil servants and make the Office of National Statistics independent".
Oliver Letwin is a member of Parliament and the shadow Secretary of State for Economic Affairs & shadow Chancellor of the Exchequer. In his article Briscoe writes:Financial Times
The shadow chancellor attacked the government for having "a track record of using statistics to mislead
1/10/05 11:54 AMChance News 13.06
Page 8 of 19file://localhost/Users/video/Desktop/chance_news/current_news/current.html

rather than inform people", and said he wanted the potential for political interference of data removed.
The government's performance should be assessed on the basis of "reliable and impartial statistics", Mr Letwin said. He proposed an independent regulator, charged with ensuring compliance with statistical best practice in all government departments.
Britain would then have "the most independent and transparent statistical framework in the world, putting it at the forefront of professional and international best practice", he said. The reputation of government statisticians has been damaged by a blunders and instances of suspected manipulation by politicians.
The Statistic Commission has this proposal in principle but refers us to its own More information about the position of the RSS can be found .
supported proposal.here
DISCUSSION QUESTIONS:
(1) Do you think the problems addressed could also occur in the U. S.?
(2) Does the U. S. have anything like the UK Statistics Commission? If not should they?
Lies and Statistics., Editorial comment, 23 Dec, 2004 Financial Times
This article discusses a similar problem in the European Union, but first some terminology from the free encyclopedia WikipediA.
The European Union is a supranational organization of 25 European states. The European Commission is the executive of the European Union. Its primary roles are to propose and enact legislation, and to act as 'guardian of the treaties' which provide the legal basis for the EU. The Statistical Office of the European Communities (Eurostat) is the statistical arm of the European Commission,producing data for the European Union and promoting harmonization of statistical methods across the member states. The Eurozone is the subset of European Union member states which have adopted the Euro currency, creating a currency union.
The issue is the same as in the previous UK discussion. According to this article it is believed that the previous Greek government persistently under-reported budget deficits in order to qualify to join the Eurozone in 2001.
The Commission now wants to give Eurostat the the right to check national accounts including having its employees turn up to check data in an attempt to secure the independence of national statistics offices from political interference.
While the editorial supports the idea of independence it is skeptical that Eurostat can act as a statistics police officer while it is still tarnished by charges of its own corruption. In addition Eurostat would need more qualified economists and statisticians it has now.
Productivity growth is probably the single most important indicator of an economy's health. This article compares two methods to measure productivity: labour productivity, output per man-hour in the non-farm business sector, andmulti-factor productivity, which tries to capture the efficiency with which inputs of capital as well as labour are used. The article states:
A productivity ., 6 Nov. 2004, Finance and Economics.primer; economic focus
The Economist
One virtue of multi-factor productivity over labour productivity is that comparisons between countries may be less distorted by national differences in the way real output is measured. For example, many economists suspect that the growth in America's GDP, and hence its labour productivity, is overstated relative to Europe's because American statisticians make a much bigger adjustment for improvements in the quality of goods, notably computers. In addition, American statisticians count firms' spending on software as investment, but in much of Europe it counts as a business expense, and so is excluded from final output.
1/10/05 11:54 AMChance News 13.06
Page 9 of 19file://localhost/Users/video/Desktop/chance_news/current_news/current.html
The article goes into greater details on some the issues involved in having different ways to measure productivity.
You can learn more about these choices in the US from the . You will find Mutifactor Productivity described and about labour productivity described
US Bureau of Labor Statistics websitehere, here.
DISCUSSION QUESTION:
See if you can learn enough , from the references we provided, about how these measures are computed to explain them to your Uncle George.
Here are two holiday news stories. Alas, they are less than cheerful!
. Whether sparked by unhealthy eating or ignoring symptoms, the 'holiday effect' is real, a study says. Best to heed the warning signs.
, 20 December 2004, F5Valerie Reitman
Deaths from natural causes spike during the holidays
Los Angeles Times
The first story comes with a warning. Researchers at Tufts University and the University of California at San Diego have found more evidence for the so-called "holiday effect": the highest risk days for death from heart attack and other natural causes are Christmas, the day after Christmas, and New Years Day. Examining death certificates from 1973-2001, the researchers focused on the two weeks from December 25 to January 7. They identified 53 million deaths from natural causes. Overall the holidays were found to have 12% excess mortality over the other days in the period.
The researchers suggested several possible explanations for the findings. People may postpone needed care until after the holidays, or else have less access to their usual care because they are traveling. Previous research had cited cold weather as a contributor, but this would not explain the specific holiday effect.
The study appeared in the journal , which is published by the American Heart Association. You can find more information on the , including a link to a video news release.
CirculationAssociation's web page
, 22 December 2004Associated Press
Holiday death statistics: Bah, humbug!Los Angeles Times
Research does not support the popular belief that people can postpone their deaths until after holidays, birthdays or other personal milestones. Donn Young of Ohio State University's Comprehensive Cancer Center examined death certificates of patients who died of cancer from 1989-2000, focusing on the pattern around Thanksgiving, Christmas and the patients' birthdays. Young found no significant difference between the proportion of patients dying right before these dates compared with after.
Dr. Daniel Loiterstein, a geriatric psychiatrist, was dismayed by the timing of the publication. He said, "I cant believe they'd put this out just before Christmas. It's like telling people there's no Santa Claus."
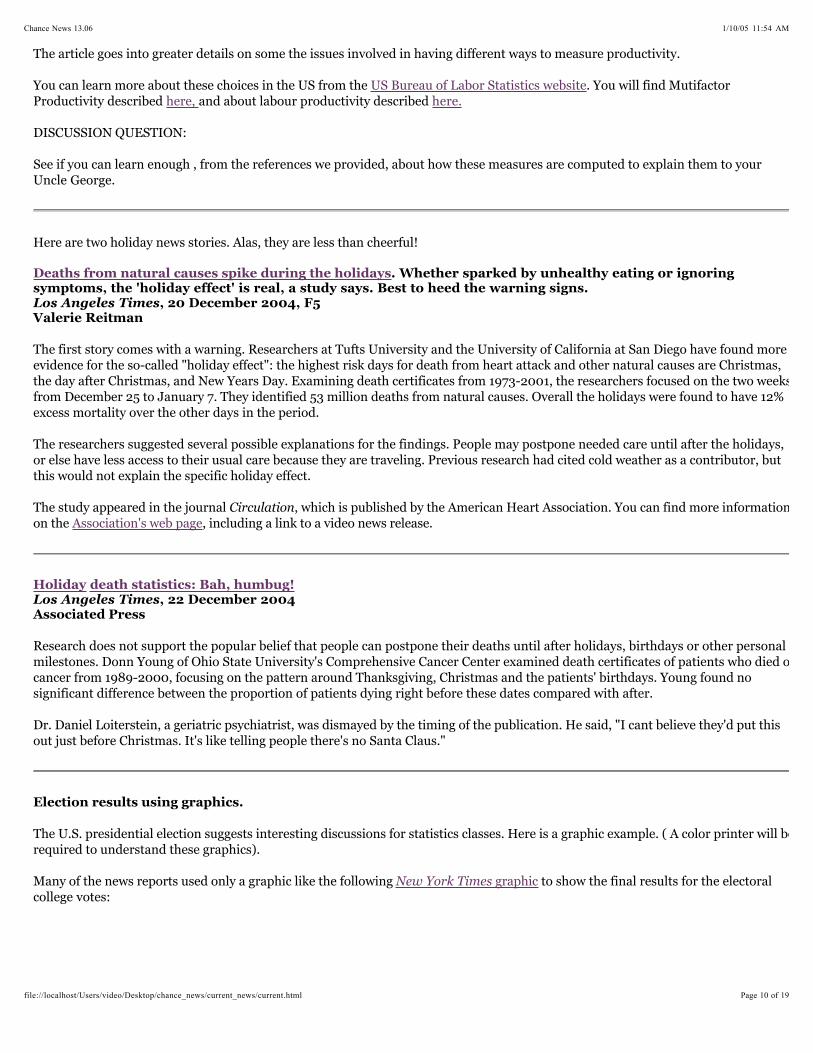
Election results using graphics.
The U.S. presidential election suggests interesting discussions for statistics classes. Here is a graphic example. ( A color printer will be required to understand these graphics).
Many of the news reports used only a graphic like the following to show the final results for the electoral college votes:
graphicNew York Times
1/10/05 11:54 AMChance News 13.06
Page 10 of 19file://localhost/Users/video/Desktop/chance_news/current_news/current.html
This graph suggests a major victory by Bush. However, unlike many other news services, the also provided a graphic with the size of the states scaled by the number of electoral votes that the states provides (in the previous map choose "View map according to Electoral Votes"). This provides a more realistic picture of the relative electoral votes won by Bush and Kerry.
New York Times
1/10/05 11:54 AMChance News 13.06
Page 11 of 19file://localhost/Users/video/Desktop/chance_news/current_news/current.html
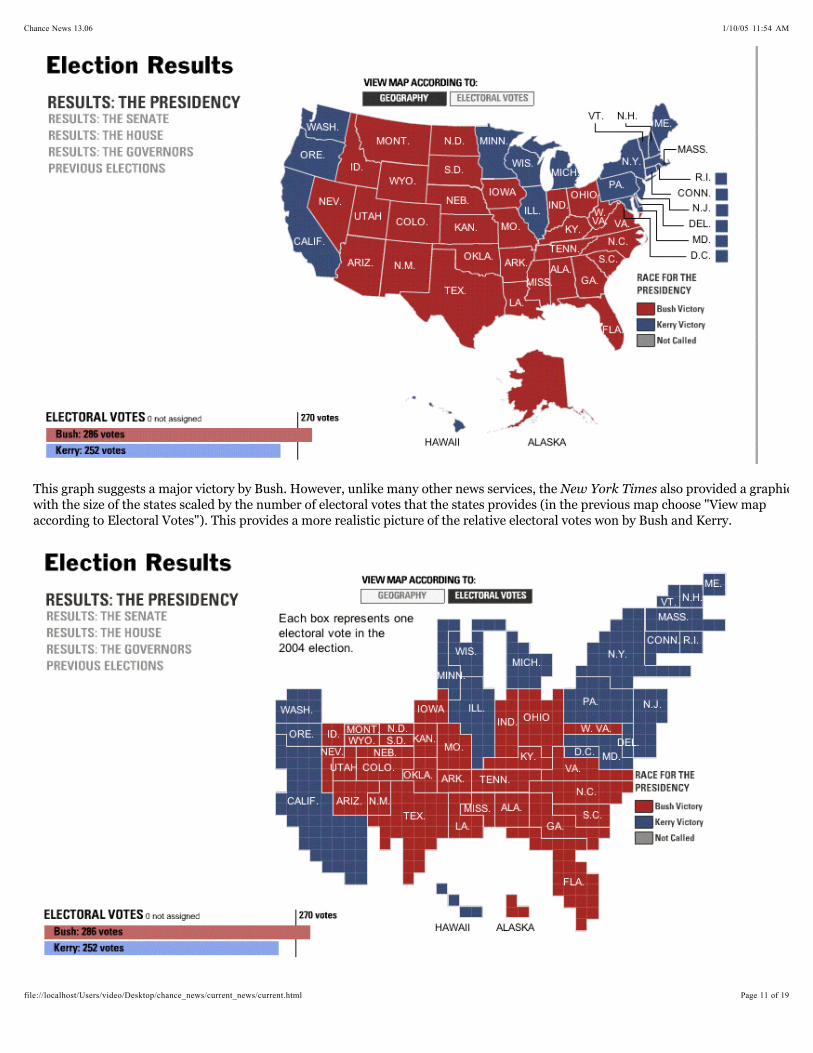
The used its Geographic Information System, worked with CBC to provide demographic maps to help analyze the election on election night. You can see some of the results . Here is our favorite graphic suggested by Bob Drake showing, rather dramatically, the popular vote by county:
ESRIhere
DISCUSSION QUESTION:
What do you think the heights of the bars in the ESRI graphic represent?
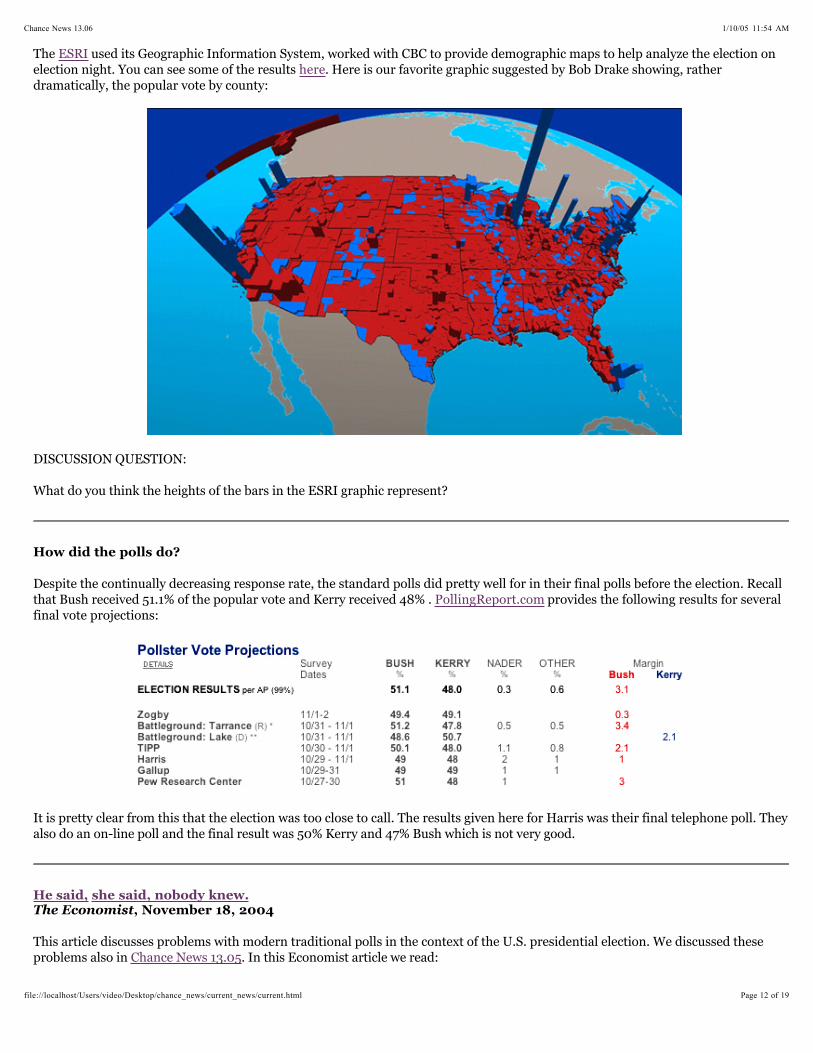
How did the polls do?
Despite the continually decreasing response rate, the standard polls did pretty well for in their final polls before the election. Recall that Bush received 51.1% of the popular vote and Kerry received 48% . provides the following results for several final vote projections:
PollingReport.com
It is pretty clear from this that the election was too close to call. The results given here for Harris was their final telephone poll. They also do an on-line poll and the final result was 50% Kerry and 47% Bush which is not very good.
He said,, November 18, 2004
she said, nobody knew.The Economist
This article discusses problems with modern traditional polls in the context of the U.S. presidential election. We discussed these problems also in . In this Economist article we read:Chance News 13.05
1/10/05 11:54 AMChance News 13.06
Page 12 of 19file://localhost/Users/video/Desktop/chance_news/current_news/current.html

In this election, the biggest polling problem was how to identify likely voters. Because turnout in America is below 60%, pollsters adjust their raw numbers to screen out people deemed unlikely to vote and also to ensure that their sample properly represents ethnic minorities, women, registered Democrats and Republicans, and so on.
The trouble is that, by reducing the size of the sample, screening produced implausible volatility in the middle of the campaign. Frequently, half the polls would show Mr Bush's vote rising while the other half showed it falling. Jon Krosnick of Stanford University also points out that screening produced an illusory “bounce” after each convention. The screen let through a disproportionate number of Democrats after the Democratic convention, and Republicans after the Republican convention. But no one had really changed their mind.
On the other hand, not having a tough enough screen can be worse than having one. And here has to own up to problems of our own. YouGov, a firm that has used internet polling
successfully in Britain and Australia, polled for us in America without sufficiently seeking to gauge respondents' likelihood to vote. Its final poll showed Mr Kerry up by three points among registered voters. Interestingly, YouGov says that if you recalibrate its final poll to reflect the demography of the voters who actually showed up on November 2nd, its panel showed a Bush lead (fewer blacks and poor people actually voted than YouGov researchers expected).
The Economist
In the last chance news we mentioned that The and a leading British pollster, YouGov, had a joint venture to provide an online poll to track the progress of this year's presidential election. At the we read:
EconomistYouGov website
YouGov is a research company using online panels to provide research for public policy, market research, and stakeholder consultation.
YouGov has a track record as the UK's most accurate pollster. In all five of the YouGov polls where data could be compared to actual outcomes (including the UK general election, the Australian election, the Pop Idol contest), we were within 1% of the actual result.
Unfortunately this record was broken by this U.S. presidential election. From YouGov's of The Economist/YouGov poll we read:
analysis
YouGov questioned 2,903 American electors between Friday October 29 and MondayNovember 1. Of these, 2,164 either had already voted (294) or were certain to vote,even if there were “a long line of people waiting to vote” (1,870). Excluding the 20respondents who refused to say who they supported, or were still making up theirminds, support was divided among the main candidates as follows:
John Kerry 50%George Bush 47%Rallph Nader 1%Others 2%
So, together with the poor result for the Harris on-line poll, it would suggest that such polls did not do so well for this presidential election.
This article discusses the fate of the political futures markets as polls.
Political futures markets claim they're more accurate than opinion polls. So, how'd they do yesterday?, Wednesday, Nov. 3, 2004
Daniel Gross
Bettors for Bush.
Slate Magazine
The article states that the two best known political markets are the at the University of Iowa which has been running since 1988 and a three year-old Dublin, Ireland-based exchange. In either of these you could bet on Bush or Kerry to win the presidential election. We discussed these markets in . For TradeSports, those participating in the presidential betting had a choice of offering to buy or sell k units of stock on a candidate at a price they specify. For example on October 24 one bettor offered Kerry shares at 41 cents. If you buy some of these shares and Kerry wins, you are paid $1 per share and if he loses you are paid nothing. Since we thought Kerry had better than a 41% chance of winning, we happily bought 50 Kerry Shares
Iowa Electronic MarketsTradeSports,
Chance News 12.02
1/10/05 11:54 AMChance News 13.06
Page 13 of 19file://localhost/Users/video/Desktop/chance_news/current_news/current.html

for $41 and with Kerry losing the election and trading fees, we lost $41.80.
The Iowa Electronic Market's "winner-take-all" market works in the same way. Here we could have bought Kerry shares on October 24 for 38.8 cents a share and again would have been paid $1 a share if Kerry won and nothing if Bush won. The closing price of a Kerry share on November 1 was 48.5 cents and for Bush 51.2 cents. Thus using this as a poll would give a good prediction for the popular vote which was 48.2% for Kerry and 51.2% for Bush. The following graph shows how the price varied through time. Note that Bush was almost always ahead.
In his article Gross points out that, for both the Iowa Electronic Market and TradeSports, share prices were strongly influenced by the leaking of the exit poll reports the afternoon of election day. These reports showed surprising strength for Kerry. The Iowa Electronic Market Kerry shares rose from below 50 in the morning to above 70 by 4:30 ET. Similarly the TradeSports traders bid the Kerry shares up to 67.
DISCUSSION QUESTIONS:
(1) The Iowa Electronic Market gives the following comparison of a number of market election poll and traditional election polls.
1/10/05 11:54 AMChance News 13.06
Page 14 of 19file://localhost/Users/video/Desktop/chance_news/current_news/current.html
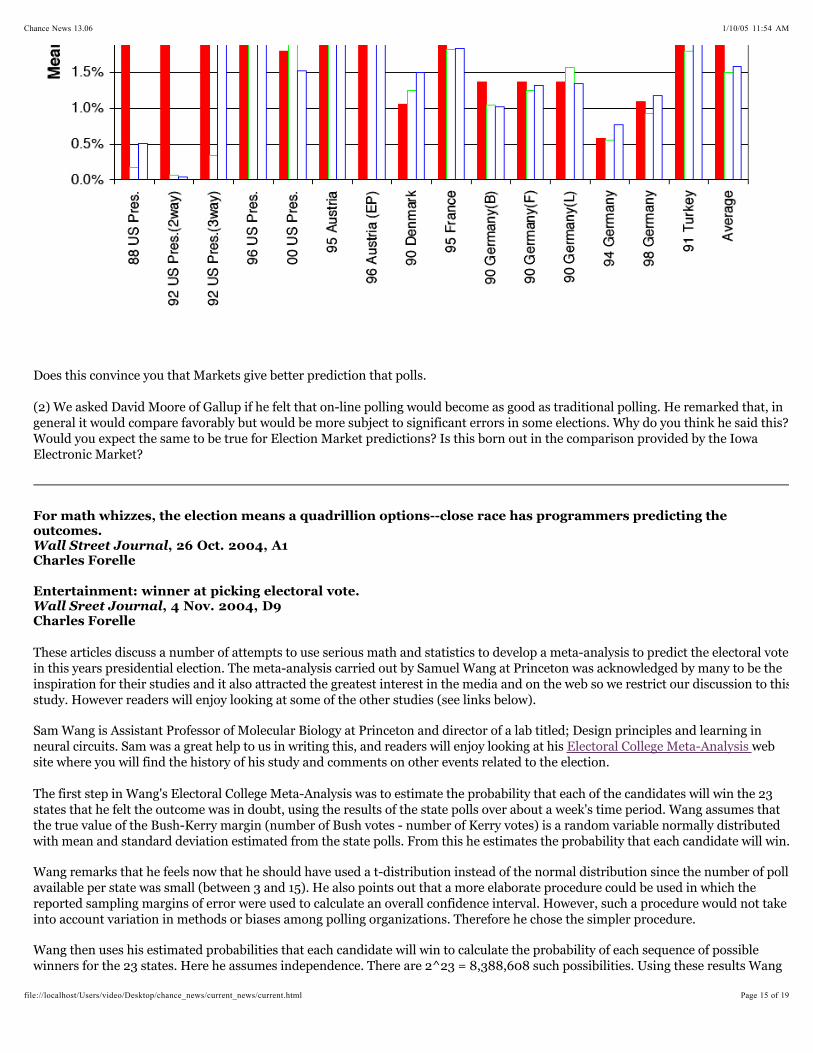
Does this convince you that Markets give better prediction that polls.
(2) We asked David Moore of Gallup if he felt that on-line polling would become as good as traditional polling. He remarked that, in general it would compare favorably but would be more subject to significant errors in some elections. Why do you think he said this? Would you expect the same to be true for Election Market predictions? Is this born out in the comparison provided by the Iowa Electronic Market?
For math whizzes, the election means a quadrillion options--close race has programmers predicting the outcomes.
, 26 Oct. 2004, A1Charles ForelleWall Street Journal
Entertainment: winner at picking electoral vote., 4 Nov. 2004, D9
Charles ForelleWall Sreet Journal
These articles discuss a number of attempts to use serious math and statistics to develop a meta-analysis to predict the electoral vote in this years presidential election. The meta-analysis carried out by Samuel Wang at Princeton was acknowledged by many to be the inspiration for their studies and it also attracted the greatest interest in the media and on the web so we restrict our discussion to this study. However readers will enjoy looking at some of the other studies (see links below).
Sam Wang is Assistant Professor of Molecular Biology at Princeton and director of a lab titled; Design principles and learning in neural circuits. Sam was a great help to us in writing this, and readers will enjoy looking at his web site where you will find the history of his study and comments on other events related to the election.
Electoral College Meta-Analysis
The first step in Wang's Electoral College Meta-Analysis was to estimate the probability that each of the candidates will win the 23 states that he felt the outcome was in doubt, using the results of the state polls over about a week's time period. Wang assumes that the true value of the Bush-Kerry margin (number of Bush votes - number of Kerry votes) is a random variable normally distributed with mean and standard deviation estimated from the state polls. From this he estimates the probability that each candidate will win.
Wang remarks that he feels now that he should have used a t-distribution instead of the normal distribution since the number of polls available per state was small (between 3 and 15). He also points out that a more elaborate procedure could be used in which the reported sampling margins of error were used to calculate an overall confidence interval. However, such a procedure would not take into account variation in methods or biases among polling organizations. Therefore he chose the simpler procedure.
Wang then uses his estimated probabilities that each candidate will win to calculate the probability of each sequence of possible winners for the 23 states. Here he assumes independence. There are 2^23 = 8,388,608 such possibilities. Using these results Wang
1/10/05 11:54 AMChance News 13.06
Page 15 of 19file://localhost/Users/video/Desktop/chance_news/current_news/current.html
calculates the distribution for the number of electoral votes Bush will win. He chooses the median of thisdistribution for his estimate for the number of electoral votes Bush will win. His final estimate, based based on the state polls the week before the election, estimated 286 votes for Bush and hence 252 for Kerry. This turned out to be exactly the numbers the two candidates won. Wang remarks that the margin of error for his prediction was quite large, +/-39 electoral votes for the 95% confidence interval. Averaging over longer time periods would have given a more precise snapshot, and he is now interested in determining what a suitable time period would be.
A snapshot of polls is not the same as a prediction, and Wang attempted to control for biases coming, for example, from the fact that most of the polls were restricted to decided voters (and the undecided voters might vote differently). In an interesting interview the day before the election, on the radio program The , Wang was asked for his prediction. He replied that the race was close enough to make prediction difficult but then went on to give his opinion that Kerry would win based on the historical pattern that undecided voters break for the challenger. You can listen to this interview . However, this pattern appears not to have held this year. Instead, pre-election polls gave margins that closely reflected the final outcomes. Therefore the raw decided-voters calculation, based on polls alone, was the most accurate.
Wang points out that his method provides a tool for reducing the large number of polls reported in the mainstream press to a more easily digestible statistic. Properly applied, he thinks that this can improve the statistical rigor of horserace political reporting. This would reduce confusion, noise reduction in both a statistical and a mass-media sense.
You can see other similar attempts to predict the electoral vote here:
Wall Street Journal this Morning
here
Andrea More
Matthew Hubbard
Larry Allen
Ken Martinian
Srikanta Mishra
Oxford University Press, 2002Andrew Gelman and Deborah Nolan
Teaching statistics: A bag of tricks.
: Statistics Modeling, Causal Inference and Social ScienceAndrew Gelman's BLog
Berkeley study scrutinizes Florida tally for Bush,19 Nov.2004, B3
Wyatt Buchanan San Francisco Chronicle
For some time we have been intending to mention the book written by Andrew Gelman (Columbia University) and Deborah Nolan (University of California, Berkeley). This is a wonderful book that provides many ways to enhance a statistics course with tried and true tricks used by the authors of the book in their classes. You will find excerpts from several reviews at the book's . Here is a comment by George Cobb, the father of the current statistics teaching reform:
Teaching statistics: a bag of tricks
web site
Anyone who cares about teaching statistics should own this book. It is the fruit of years of collecting, inventing, experimenting, and hard thinking by two classroom veterans who are also leading statisticians. Buy it, read it, use it: if your reaction is like mine, you'll find lots of things that you want to try.
George Cobb, Mt Holyoke College
Andrew Gelman has also started a statistics Blog. Surprisingly, this is the first statistics Blog that we have seen. We found it useful in understanding another election discussion reported in the article. This article discusses a study carried out by Michael Hout, Professor of Sociology at Berkeley and three graduate students from the university's Survey Research Center. The authors were interested in seeing if the use of electronic voting machines in Florida had any effect on the Bush vote in the 2004 election. The Chronicle article reports:
San Francisco Chronicle
In the statewide study, researchers used a technique called multiple regression analysis to account for
1/10/05 11:54 AMChance News 13.06
Page 16 of 19file://localhost/Users/video/Desktop/chance_news/current_news/current.html

differences in county size, change in overall voter turnout (not by party), past voting history of residents and demographic factors of income and race.
They also looked at whether a county used an electronic voting machine or another ballot counting system. That distinction was the only one of the six factors that showed a statistically significant relationship with the increase in the Bush vote from the 2000 election, Hout said.
The article reports that the researchers concluded that their study shows that President Bush may have received at least 130,000 extra and unexplained votes in the Florida counties that used electronic voting machines.
In his November 19 Blog posting, Gelman remarks:
Before getting to a discussion of this paper, let me show you a few pictures (adapted from an analysis performed by Bruce Shaw here at Columbia).
First, a scatterplot of the counties in Florida, displaying the change in the Republican vote percentage from 2000 to 2004, plotting vs. the Republican vote percentage in 2000 (in both cases, using the Republican % of the two-party vote). Red circles indicate the counties that used e-voting in 2000, and black circles used optical scans. The radius of each circle is roughly proportional to the log of the #votes in the county.
There are three obvious patterns in the figure:
1. The e-voting counties, especially the largest of them, were more Democrat-leaning.
2. For the optical scan counties, there was a consistent trend that the counties that favored Bush more in 2000, tended to move even more toward Bush in 2004.
3. For the e-voting counties, no such trend is apparent. In particular, the two large red circles on the left of the plot (Broward and Palm Beach) moved strongly toward the Republicans.
Gelman then provides similar graphics for previous elections and concludes (so far):
It would make sense to look further at Broward and Palm Beach counties, where swings happened which look unexpected compared to the other counties and compared to 2000, 1996, and 1992. But lots of unexpected things happen in elections, so we shouldn't jump to the conclusion that e-voting is related to these particular surprises.
Readers will find many other interesting statistical topics discussed on Gelman's Blog.
1/10/05 11:54 AMChance News 13.06
Page 17 of 19file://localhost/Users/video/Desktop/chance_news/current_news/current.html
At a meeting to honor Bobb Hogg that we attended some years ago, Bobb asked each of us to write down the concept they most wanted students in an introductory statistics course to understand. The winner by far was "variation."
The current issue of , published jointly by the International Association for Statistical Education and the International Statistical Institute, is a special issue on reasoning about variability and variation. A PDF version of the entire issue can be freely downloaded from the journal's website. PDF versions of individual papers are available from the following table of contents for this issue.
Statistics Education Research Journal (SERJ)
Editorial
Dani Ben-Zvi and Joan Garfield (Invited). Research on Reasoning about Variability: A Forward
Rob Gould (Invited). Variability: One Statistician's View
James Hammerman and Andee Rubin. Strategies for Managing Statistical Complexity with New Software Tools
Dani Ben-Zvi. Reasoning about Variability in Comparing Distributions
Arthur Bakker. Resoning about Shape as a Pattern in Variability
Chris Reading. Student Description of Variation while Working with Weather Data
Forthcoming IASE Conferences
Other Forthcoming Conferences
SERJ Referees
What is the origin of the famous quotation: There are three kinds of lies: lies,damned lies, and statistics?
In the the November issue of RSS News, in a letter to the editor from Peter M Lee, we read that the mystery of the originator of the famous quotation 'There are three kinds of lies: lies, damned lies, and statistics", often attributed to Mark Twain or to Disraeli has been solved. Lee says that it is "almost certainly due to Leonard Henry Courtney, Lord Courtney (1832-1918)." You can find his case for this on the web page that Lee maintains. here Materials for the History of Statistics
DISCUSSION QUESTION:
Read Lee's explanation for why he believes the mystery is solved and Courtney's (the quotation is on page 4). Are you convinced that Cortney originated the famous quotation?
speech
In we discussed the "Lost boarding pass" problem that appeared on the the Oct. 4 Car Talk program. Jerry Grossman wrote us about the history of this problem:
Chance News 13.05
There is a much richer history to the boarding pass problem than you suggest in CHANCE News 13.05. Please see l, vol 34, no 4, Sept 2003, pages 332-333. The College Math Journa
The"Lost boarding pass problem" is number 735 in the and was proposed by two readers one of whom was Jerry.
College Math Journal
The problem described here is the same as the car talk problem discussed in Chance News 13.05 except that it occurs on a tour bus with n > 1 seats. A large number of people provided solutions and the Problem Editor describes two of the solutions.
The editor remarks that The Con Amore Problem Group pointed out that this problem, with a different setting, appeared in the December 2001, (vol 15, no2) issue of the journal published by the University of Copenhagen. Solutions and a generalization FAMØS
1/10/05 11:54 AMChance News 13.06
Page 18 of 19file://localhost/Users/video/Desktop/chance_news/current_news/current.html

appeared in the March and May, 2002 issues of . These issues are available in pdf format on the They are in Danish but Peter Doyle and Lise Richardson (our Danish member of our Bach Study Group) provided us with a translation of the articles. Here is the version of the problem provided in and appropriate for the Holiday period when this Chance News was written:
FAMØS website.FAMØS
FAMØS
The mermaid lounge
There are n nisses (a type of gnome or elf associated with Danish Christmas) who have their beds in a big common dormitory. Nisses are normally very disciplined, so they go to bed one by one. Last year's Christmas party caused nisse # l to have too much to drink, and as he was going to bed (as the first one) he chose a random bed instead of his own. The rest of the nisses took their own beds, but if the bed had already been taken, they took a random one. What is the probability that nisse # n gets his own bed?
The problem was solved by Henning Makholm in the March 2002 issue of who also proposed as a bonus problem to find the probability that the kth nisse gets his own bed. This problem was solved by Rolf Dyre Svvegstrup who showed that the answer is:
FAMØS
Note that when k = n, the answer is 1/2 in agreement with the original problem. Rolf's proof is very short and as usual we had trouble being convinced without working an example. So here is our example which we convinces us, but is probably more complicated than what Rolf had in mind.
We assume that the nisses beds are number according to the order that they come in. Assume that there are 7 nisses and we want to find the probability that the 5th nisse gets his own bed. The first nisse chooses randomly from all the 7 beds. If he chooses bed 1,5,6, or 7, nisse 5's fate is settled and he gets his own bed with probability 3/4. If not he chooses from 2,3,4. Suppose he chooses bed 3. Then the 3rd nisse must make a random choice from 1,5,6,7 or 4. Again if he chooses from 1,5,6,7, nisse 5's fate is settled and he gets his own bed with probability 3/4. His only other choice is 4, but if he chooses this, nesse 4 has no choice but to choose from 1,5,6,7 and again nesse 5 will get his own bed probability 3/4.
Copyright (c) 2004 Laurie Snell This work is freely redistributable under the terms of the GNU published by the
. This work comes with ABSOLUTELY NO WARRANTY. General Public License Free Software
Foundation
CHANCE News 13.06November 2, 2004 to December 31, 2004
1/10/05 11:54 AMChance News 13.06
Page 19 of 19file://localhost/Users/video/Desktop/chance_news/current_news/current.html