Embed Size (px)
Citation preview

Chance
Is the association
causal?
RR = 7
Detectives in the Classroom – Investigation 3-3: Chance

Hypotheses2
Is there an association?
4What should be done
to prevent the disease?
5Did the prevention
strategy work?
Where are we and where are we going?
Detectives in the Classroom – Investigation 3-3: Chance
1How is this disease
distributed?
What’s my hypothesis?
Did the exposure and the disease turn up
together?3Is the association
causal? Why did the exposure and the disease turn up
together?

What is a cause?
If an exposure causes an outcome, how can people be in cell b of a 2 x 2 table?
If an exposure causes an outcome, how can people be in cell c of a 2 x 2 table?
How does this apply to the “… cigarette smoking causes lung cancer …” label?
Review
Detectives in the Classroom – Investigation 3-3: Chance

1. Cause
2. Chance
3.
4.
5.
Review
Detectives in the Classroom – Investigation 3-3: Chance

Epi Talk
All the people in a particular group.
Population
Review
Detectives in the Classroom – Investigation 3-3: Chance

Epi Talk
A selection of people from a population.
Sample
Epi Talk
Detectives in the Classroom – Investigation 3-3: Chance
Epi Talk
Review
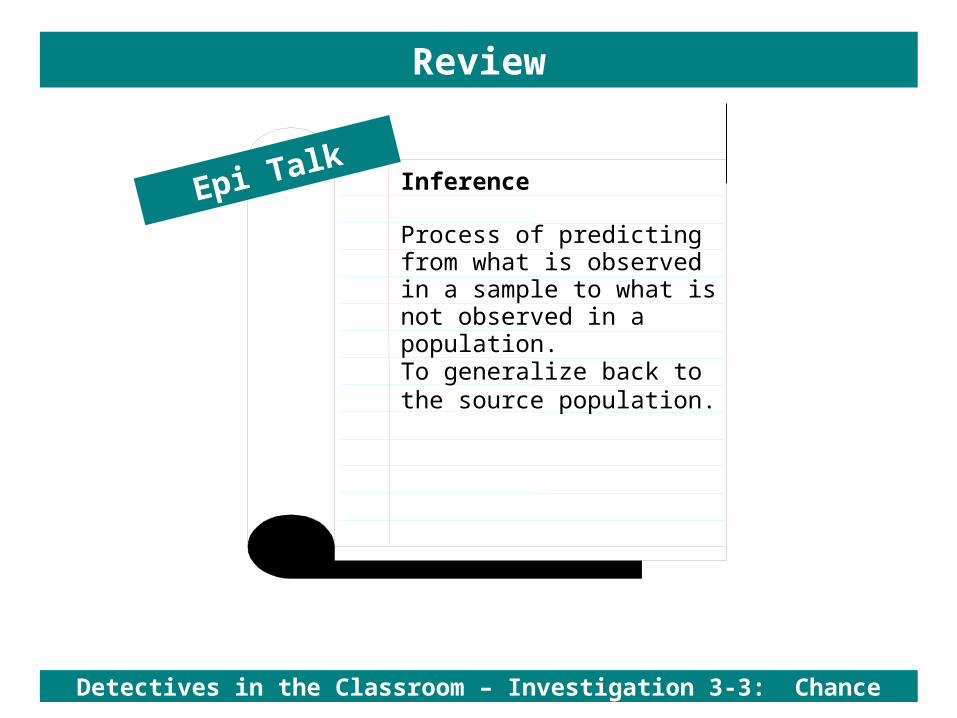
Inference
Process of predicting from what is observed in a sample to what is not observed in a population.
To generalize back to the source population.
Detectives in the Classroom – Investigation 3-3: Chance

Sample
Population
Process of predicting from what is observedto what is not observed.
Observed
Not Observed
Review
Detectives in the Classroom – Investigation 3-3: Chance

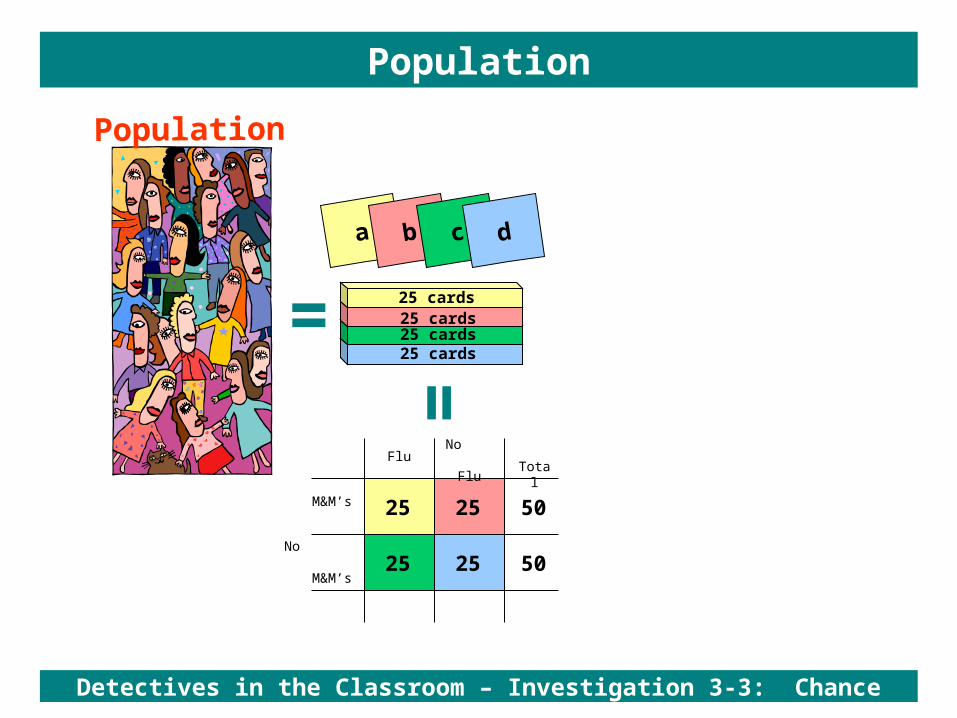
Population
Deck of
100 cards
Detectives in the Classroom – Investigation 3-3: Chance

Population
a
25 cards
b
25 cards
c
25 cards
25 cards
d
Detectives in the Classroom – Investigation 3-3: Chance

Population
=
Population
a
25 cards
b c d
25 cards25 cards25 cards
=a b
c d
M&M’s
No M&M’s
FluNo
Flu
Detectives in the Classroom – Investigation 3-3: Chance

=
Population
a
25 cards
b c d
25 cards25 cards25 cards
=M&M’s
No M&M’s
FluNo
Flu
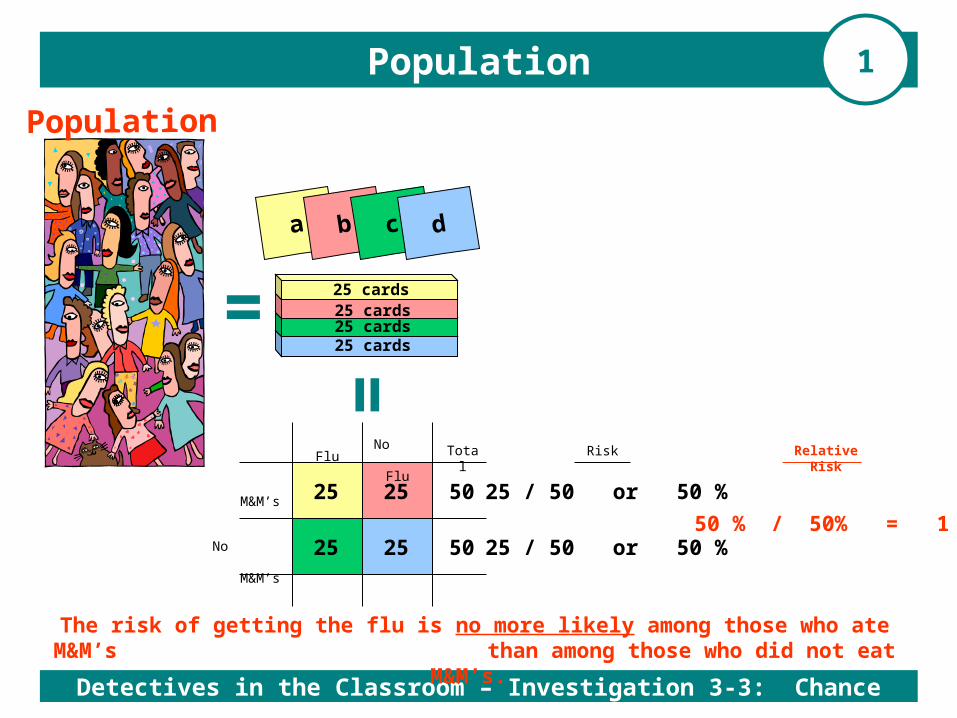
2525
25 25
50
50
Total
Population
Detectives in the Classroom – Investigation 3-3: Chance

RiskEpi Talk
A measure of how often an event occurs in a defined group of people in a defined period of time.
The likelihood of developing a disease.
Review
Detectives in the Classroom – Investigation 3-3: Chance
=
Population
=M&M’s
No M&M’s
FluNo
Flu
2525
25 25
50
50
Total
=
2525
25 25
50
50
Total
M&M’s
No M&M’s
FluNo
Flu
a
25 cards
b c d
25 cards25 cards25 cards
Population
Detectives in the Classroom – Investigation 3-3: Chance

=
Population
=
2525
25 25
50
50
Total
a
25 cards
b c d
25 cards25 cards25 cards
Risk
25 / 50 or 50%
25 / 50 or 50%
M&M’s
No M&M’s
FluNo
Flu
Population
Detectives in the Classroom – Investigation 3-3: Chance

Epi Talk
A way of showing the relationship between two risks.
Calculated by dividing the risk of an outcome in one group by the risk of the outcome in another group.
Tells us the number of times one risk is larger or smallerthan another.
Relative Risk
Review
Detectives in the Classroom – Investigation 3-3: Chance

Sample
Detectives in the Classroom – Investigation 3-3: Chance
1
=
Population
a
25 cards
b c d
25 cards25 cards25 cards
=
2525
25 25
50
50
Total
M&M’s
No M&M’s
FluNo
FluRisk Relative Risk
25 / 50 or 50 %
25 / 50 or 50 %
50 % / 50% = 1
Population
Detectives in the Classroom – Investigation 3-3: Chance
1
The risk of getting the flu is no more likely among those who ate M&M’s than among those who did not eat M&M’s.

Epi Teams
Detectives in the Classroom – Investigation 3-3: Chance

Population
25 cards
25 cards
25 cards
25 cards
Detectives in the Classroom – Investigation 3-3: Chance

Epi Talk
To occur accidentally.
To occur without design.
Chance
Epi Talk
A coincidence.
Detectives in the Classroom – Investigation 3-3: Chance

Chance
Detectives in the Classroom – Investigation 3-3: Chance

Chance
Detectives in the Classroom – Investigation 3-3: Chance
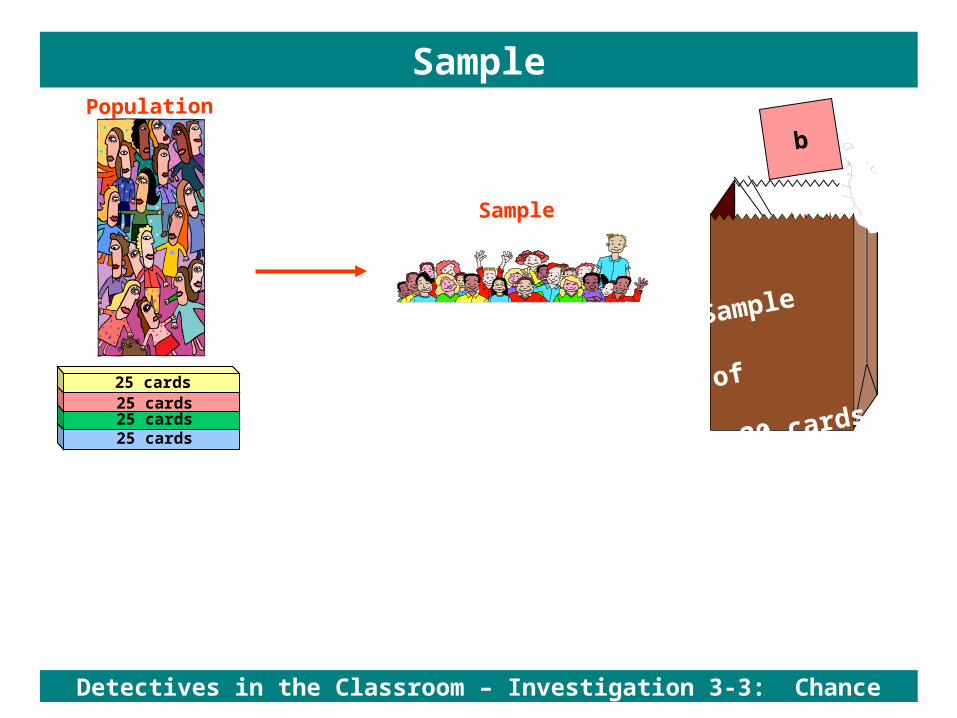
Population
Sample
Sample
b
Sample
of
20 cards25 cards25 cards25 cards25 cards
Detectives in the Classroom – Investigation 3-3: Chance

Population
Sample
b
Sample
of
20 cards25 cards25 cards25 cards25 cards
10
10
Total
M&M’s
No M&M’s
FluNo
Flu
55
5 5
Sample
Detectives in the Classroom – Investigation 3-3: Chance

Population
Sample
b
Sample
of
20 cards25 cards25 cards25 cards25 cards
10
10
Total
M&M’s
No M&M’s
FluNo
Flu
55
5 5
Risk
5 / 10 or 50 %
5 / 10 or 50 %
Sample
Detectives in the Classroom – Investigation 3-3: Chance

Sample
Detectives in the Classroom – Investigation 3-3: Chance
2

Population
Sample
b
Sample
of
20 cards25 cards25 cards25 cards25 cards
10
10
Total
M&M’s
No M&M’s
FluNo
Flu
55
5 5
Risk
5 / 10 or 50 %
5 / 10 or 50 %
50 % / 50% = 1
Relative Risk
Sample 2
Detectives in the Classroom – Investigation 3-3: Chance
The risk of getting the flu is no more likely among those who ate M&Ms than among those who did not eat M&Ms.

b
Sample
of
20 cards
Total
M&M’s
No M&M’s
FluNo
Flu Risk
5 / 10 = 50 %
5 / 10 = 50 %
50 % / 50% = 1
Relative Risk
By Chance CDC
Sample
Detectives in the Classroom – Investigation 3-3: Chance

Sample
Detectives in the Classroom – Investigation 3-3: Chance
3

b
Sample
of
20 cards
Total
M&M’s
No M&M’s
FluNo
Flu Risk
5 / 10 = 50 %
5 / 10 = 50 %
50 % / 50% = 1
Relative Risk
By Chance CDC
By Chance
Sample 3
Detectives in the Classroom – Investigation 3-3: Chance

10
10
Total
M&M’s
No M&M’s
FluNo Flu
55
5 5
Risk
5 / 10 or 50 %
5 / 10 or 50 %
50 % / 50% = 1
Relative Risk
By Chance
How many students picked a sample with 5 people in each cell?
Chance
Detectives in the Classroom – Investigation 3-3: Chance

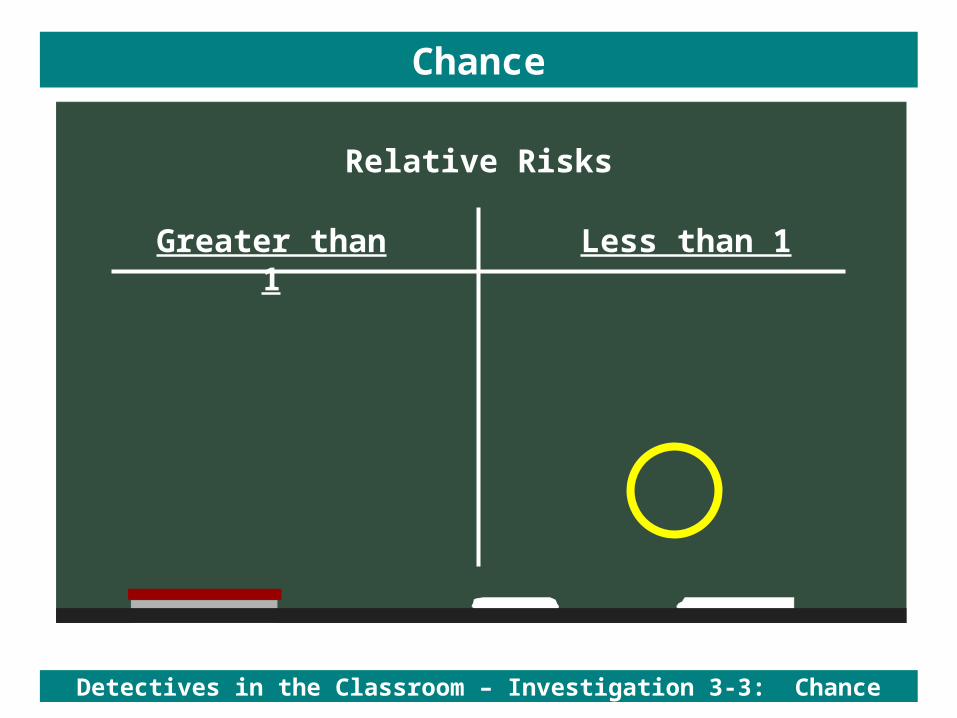
Relative Risks
Greater than 1
Chance
Less than 1
Detectives in the Classroom – Investigation 3-3: Chance

Chance
Study Links Eating M&M’s To Increased Risk of Flu
Detectives in the Classroom – Investigation 3-3: Chance
Relative Risks
Chance
Greater than 1 Less than 1
Detectives in the Classroom – Investigation 3-3: Chance
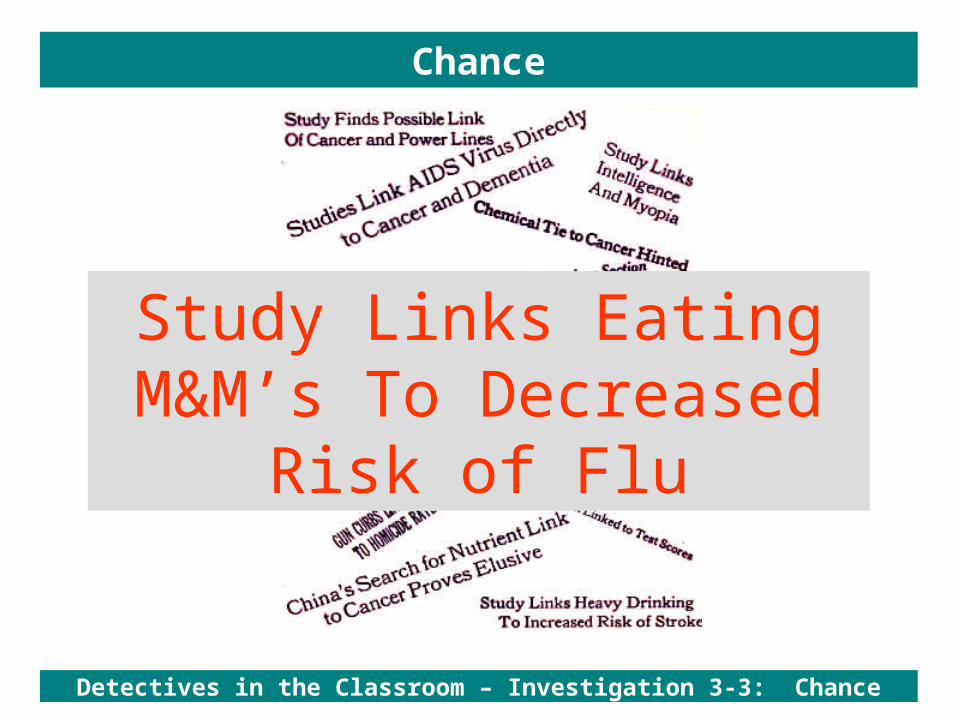
Chance
Study Links Eating M&M’s To Decreased Risk of Flu
Detectives in the Classroom – Investigation 3-3: Chance
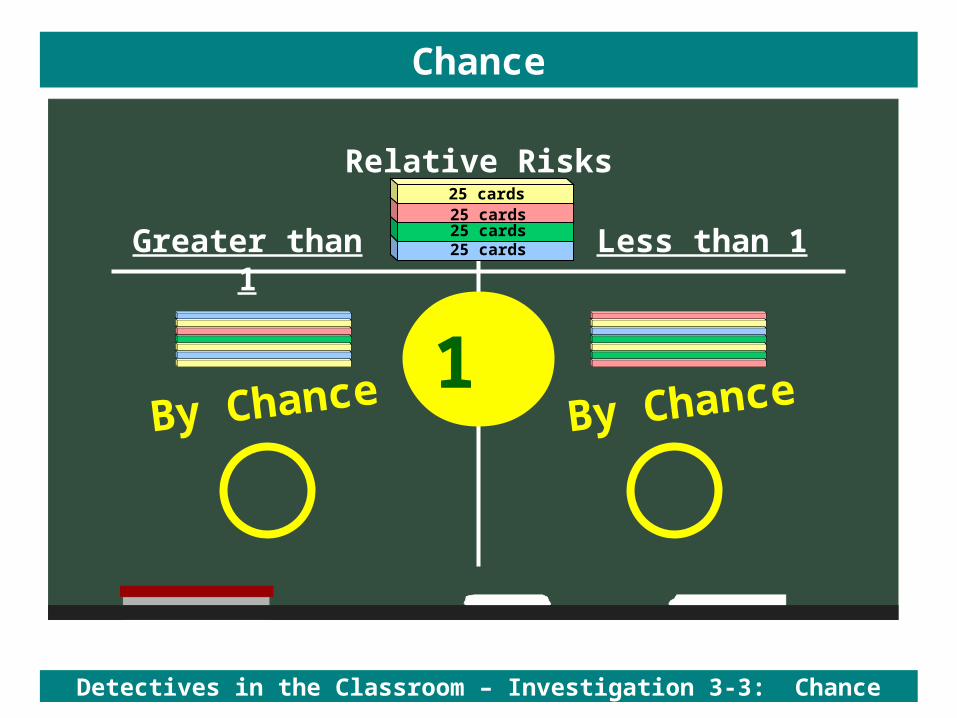
Relative Risks
Chance
Greater than 1 Less than 1
1
By ChanceBy Chance
25 cards25 cards25 cards25 cards
Detectives in the Classroom – Investigation 3-3: Chance

Sample
Detectives in the Classroom – Investigation 3-3: Chance
4
b
Sample
of
20 cards
Total
M&M’s
No M&M’s
FluNo
Flu Risk
5 / 10 = 50 %
5 / 10 = 50 %
50 % / 50% = 1
Relative Risk
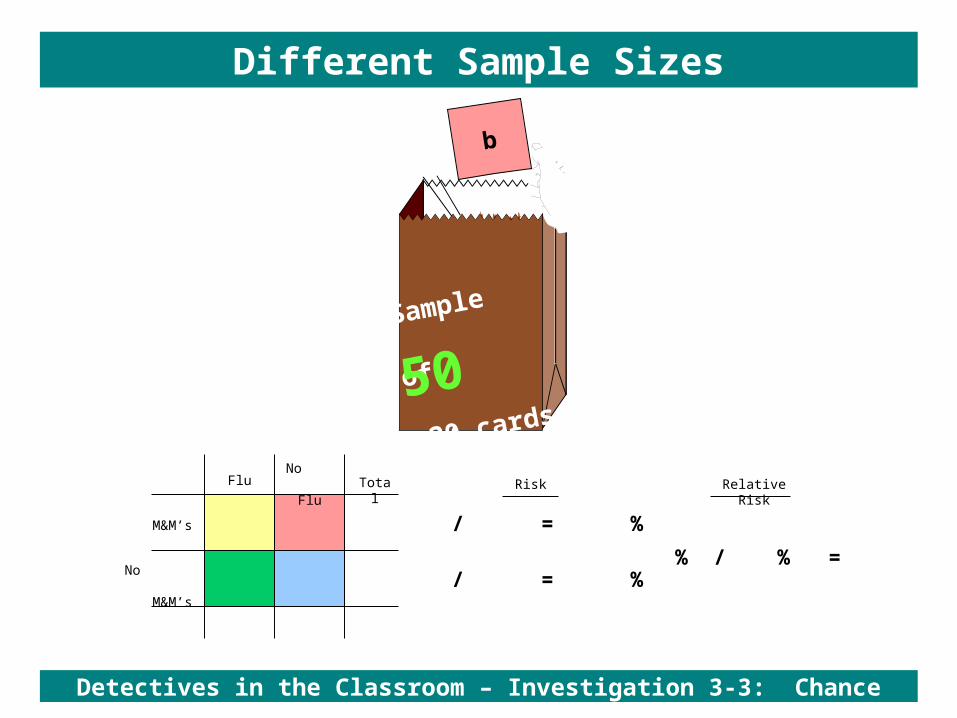
Different Sample Sizes
Detectives in the Classroom – Investigation 3-3: Chance
50

Sample
Detectives in the Classroom – Investigation 3-3: Chance
5

b
Sample
of
20 cards
Total
M&M’s
No M&M’s
FluNo
Flu Risk
5 / 10 = 50 %
5 / 10 = 50 %
50 % / 50% = 1
Relative Risk
Different Sample Sizes
Detectives in the Classroom – Investigation 3-3: Chance
75

Sample
Detectives in the Classroom – Investigation 3-3: Chance
6

b
Sample
of
20 cards
Total
M&M’s
No M&M’s
FluNo
Flu Risk
5 / 10 = 50 %
5 / 10 = 50 %
50 % / 50% = 1
Relative Risk
Different Sample Sizes
Detectives in the Classroom – Investigation 3-3: Chance
99

Sample
Detectives in the Classroom – Investigation 3-3: Chance
7

Explanations for Finding an Association
Why would an exposure and an outcome turn up together?
1. Cause
2. Chance
3.
4.
5.
Study Links Eating M&M’s To Decreased Risk of Flu
Detectives in the Classroom – Investigation 3-3: Chance

Could the
association have occurred
by chance?
Explanations for Finding an Association
RR = 7
Detectives in the Classroom – Investigation 3-3: Chance
CDC
Investigation 3-3 has ended.
Chance
Detectives in the Classroom – Investigation 3-3: Chance