Embed Size (px)
Citation preview

Challenges to validity in single-group interrupted time series analysis
Ariel Linden, DrPH1,2
1 President, Linden Consulting Group, LLC - Ann Arbor, MI [email protected] 2 Research Scientist, Division of General Medicine, Medical School - University of Michigan,
Ann Arbor, Michigan, USA
Corresponding Author Information: Ariel Linden, DrPH Linden Consulting Group, LLC 1301 North Bay Drive Ann Arbor, MI USA 48103 Phone: (971) 409-3505 Email: [email protected]
Key Words: interrupted time series analysis, quasi-experimental, causal inference Running Header: validity of interrupted time series analysis Acknowledgement: I wish to thank Julia Adler-Milstein for reviewing the manuscript and providing many helpful comments.
This article is protected by copyright. All rights reserved.
This is the author manuscript accepted for publication and has undergone full peer review buthas not been through the copyediting, typesetting, pagination and proofreading process, whichmay lead to differences between this version and the Version of Record. Please cite this articleas doi: 10.1111/jep.12638
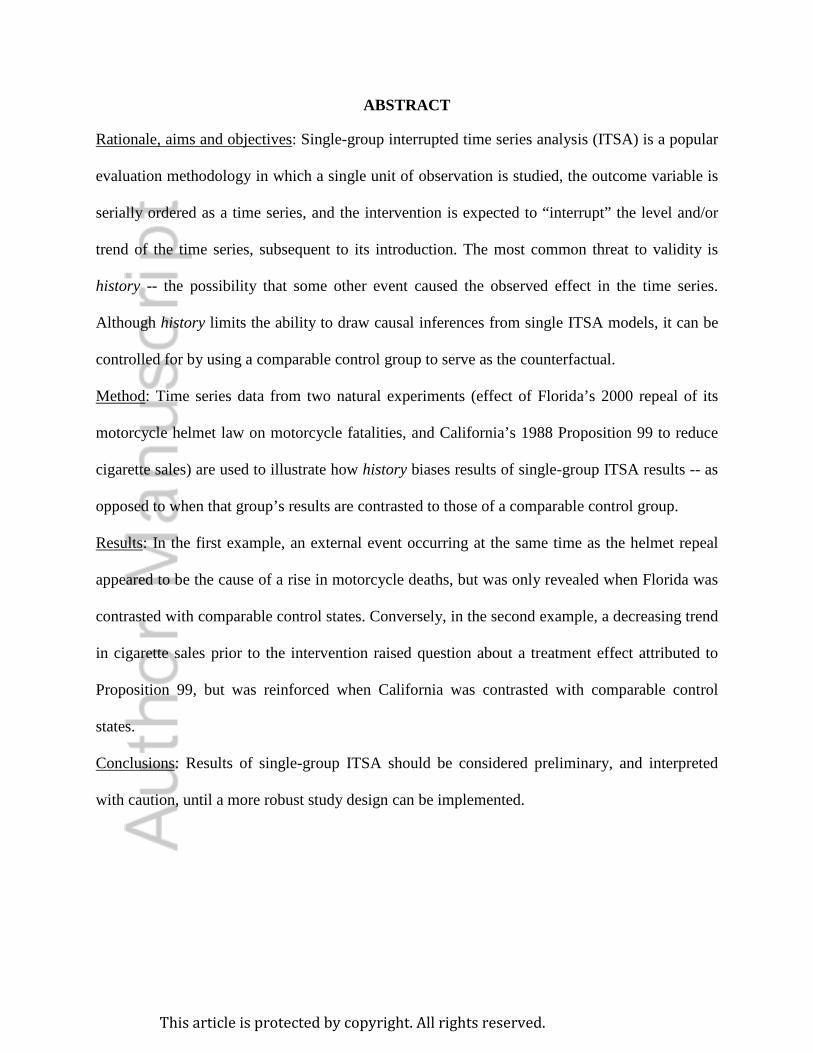
ABSTRACT
Rationale, aims and objectives: Single-group interrupted time series analysis (ITSA) is a popular
evaluation methodology in which a single unit of observation is studied, the outcome variable is
serially ordered as a time series, and the intervention is expected to “interrupt” the level and/or
trend of the time series, subsequent to its introduction. The most common threat to validity is
history -- the possibility that some other event caused the observed effect in the time series.
Although history limits the ability to draw causal inferences from single ITSA models, it can be
controlled for by using a comparable control group to serve as the counterfactual.
Method: Time series data from two natural experiments (effect of Florida’s 2000 repeal of its
motorcycle helmet law on motorcycle fatalities, and California’s 1988 Proposition 99 to reduce
cigarette sales) are used to illustrate how history biases results of single-group ITSA results -- as
opposed to when that group’s results are contrasted to those of a comparable control group.
Results: In the first example, an external event occurring at the same time as the helmet repeal
appeared to be the cause of a rise in motorcycle deaths, but was only revealed when Florida was
contrasted with comparable control states. Conversely, in the second example, a decreasing trend
in cigarette sales prior to the intervention raised question about a treatment effect attributed to
Proposition 99, but was reinforced when California was contrasted with comparable control
states.
Conclusions: Results of single-group ITSA should be considered preliminary, and interpreted
with caution, until a more robust study design can be implemented.
This article is protected by copyright. All rights reserved.

INTRODUCTION
Single-group interrupted time-series analysis (ITSA) is an increasingly popular evaluation
methodology for observational data in which a single unit of observation (e.g., an individual, a
city, or a country) is studied, the dependent variable is a serially ordered time series, and multiple
observations are captured in both the pre- and post-intervention periods. The study design is
called an interrupted time series because the intervention is expected to “interrupt” the level
and/or trend of the time series, subsequent to its introduction [1,2]. ITSA has been argued to
generally have strong internal validity, primarily through its control over regression to the mean
[1,2,3,4], and good external validity, particularly when the unit of measure is at the population
level, or when the results can be generalized to other units, treatments or settings [2,5].
ITSA has been used in many areas of study, such as assessing the effects of community
interventions [6,7], public policy [8], regulatory actions [9], and health technology assessment
[10]. ITSA has also been proposed as a more flexible and rapid design to be considered in health
research before defaulting to the traditional two-arm randomized controlled trial [11]. In
addition, systematic reviews of the literature increasingly include studies using ITSA as the
primary research design [12].
Despite its widespread use, the single-group ITSA design remains a vastly inferior
evaluation approach to those utilizing a comparable control group to serve as the counterfactual -
- a fundamental element of the potential outcomes framework [13,14]. With a comparable
control group, factors other than the intervention that are responsible for shifting the time series
will likely be observed in both groups, and thus not mistaken for a treatment effect. Moreover,
This article is protected by copyright. All rights reserved.

events that affect the time series in the treatment group prior to initiation of the intervention can
be used in the matching process to ensure that the shift in the time series does not confound the
results. Conversely, without a comparable control group, the impact on the time series by an
event outside the intervention may be mistaken for a treatment effect.
Other literature has provided both a comprehensive description of the ITSA design and
methodologic guidance in its implementation (see Box and Tiao [15], Glass et al. [16], and
McDowall et al. [17] for using autoregressive integrated moving-average (ARIMA) models, and
Crosbie [18]; Gottman [19]; Linden & Adams [20]; Linden [21]; McKnight et al. [22]; Simonton
[23]; and Velicer and McDonald [24] for using ordinary least-squares (OLS) regression-based
models). The purpose of the current paper, however, is to offer a non-technical discussion of how
factors that impact the time series outside of the intervention may be mistaken for a treatment
effect when using the single-group ITSA model, but captured when using a comparable control
group to serve as the counterfactual. This problem is illustrated using data from two natural
experiments; the effect of Florida’s 2000 motorcycle helmet law repeal on motorcycle fatality
rates, and the effect of California’s 1988 Proposition 99 anti-smoking initiative on cigarette
sales.
USUAL THREATS TO VALIDITY IN SINGLE-GROUP ITSA DESIGNS
While the single-group ITSA design can control for many threats to validity, the remaining
threats that the design does not control for are crucial (see Campbell & Stanley [1] and Shaddish
This article is protected by copyright. All rights reserved.

et al. [2] for a comprehensive description of the threats to validity in ITSA and many other
evaluation designs).
History is the principal threat to validity -- the possibility that some event, other than the
intervention, caused the observed effect in the time series [2]. There are at least two scenarios
where the effect of history may be misconstrued. First, when the change in the time series is
immediate and drastic, it is easy to ignore the possibility that some other factor may be the cause.
And even if there is an alternative explanation for the effect, information may not always be
available to identify those factors. Thus, the investigator is likely to argue that the effect is
causally related to the intervention without further study. In the second scenario, some factor
may cause a directionally-correct change in the time series prior to the intervention. Thus, any
additional change in the time series subsequent to the introduction of the intervention may be
argued to be a continuation or magnified effect of that prior factor and not a treatment effect
[21,25]. In either of these scenarios, the inclusion of a comparable control group will clarify
these issues.
Instrumentation, or a change in how the time series is measured, is another threat to
validity that may erroneously appear as a treatment effect in a single-group ITSA [2]. While
documentation should be obtained indicating how and when the instrumentation changed, it may
nevertheless be impossible to control for this bias in a single-group ITSA. However, with the
inclusion of a comparable control group, the change in instrumentation should impact both time
series equally, thereby nullifying its effect.
This article is protected by copyright. All rights reserved.

Selection may bias the single-group ITSA if the serial observations are cross-sectional
and the characteristics (or composition) of the group under study are different before and after
the introduction of the intervention (selection is not a factor in a single-group ITSA where the
same group, or individual, undergoes surveillance over the duration of the study). Selection may
be controlled for by finding a control group that is comparable to the treatment group on pre-
intervention characteristics (at the very least, the groups should be comparable on the pre-
intervention level and trend of the outcome under study) [20,21].
Threats to statistical conclusion validity apply as much to ITSA as to any other design,
such as low power, violated test assumptions, and unreliability of measurement [2]. While these
issues are important, their discussion is beyond the scope of this paper (the reader is referred to
references [15-24] for a comprehensive discussion of the relevant statistical issues in ITSA
models).
EXAMPLE 1: THE REPEAL OF FLORIDA’S MOTORCYCLE HELMET LAW
On July 1, 2000, the State of Florida partially repealed its motorcycle helmet law by exempting
adult motorcyclists (aged 21 years and older) and moped riders from wearing a helmet --
provided that they carry motorcycle insurance coverage with a minimum of $10,000 in medical
benefits for injuries sustained in a motorcycle accident. The law continued to require helmets for
riders less than 21 years of age. Several studies have examined the effect of the Florida helmet
repeal on motorcycle fatalities, and have collectively concluded that weakening of the helmet
This article is protected by copyright. All rights reserved.

law led to increased motorcycle fatalities [26,27,28,29]. A major shortcoming common to all
these studies is that no contrasts were made with other comparable states.
For the current analysis, all motor vehicle fatality data for all states were retrieved from
the Fatal Accident Reporting System (FARS) database for the years 1975 to 2014 (which is all
the data available in the system) [30]. Annual issues of Highway Statistics provided motorcycle
registration data for the periods of 1996 to 2001, and years between 1975 and 1996 were
retrieved from the 1995 summary volume [31]. Statistical analyses were conducted using ITSA,
a program written for Stata to conduct single-group and multiple-group interrupted time series
analyses [21].
Figure 1a presents the raw motorcycle fatality counts in Florida annually from 1975 to
2014. As shown, motorcycle deaths were decreasing annually from 1975 until the repeal in 2000,
followed immediately by a sharp jump in deaths that continued to rise annually thereafter until
2014. Figure 1b presents annual motorcycle fatalities as a percent of total motor vehicle deaths.
The overall behavior of this time series is nearly identical to that of raw motorcycle deaths
(Figure 1a). The percentage of motorcycle deaths relative to all motor vehicle fatalities decreased
annually between 1975 and 2000, followed by an immediate (and thereafter increasing) rise.
On the face of it, these two figures (Figures 1a and 1b) lend compelling support for the
hypothesis that Florida’s helmet repeal led to increased motorcycle fatalities -- both in raw
counts and relative to all other motor vehicle deaths. Additionally, based on these figures alone,
most relevant threats to validity [2] could be ruled out. For example, regression to the mean can
This article is protected by copyright. All rights reserved.

be ruled out as a rival explanation because the lengthy pre-intervention time series shows a
consistent decrease in motorcycle deaths over the entire period. Thus, the jump in the level of the
time series immediately following the repeal cannot be viewed as a response to an outlier
observation occurring immediately prior to the repeal. Selection bias may pose a threat to
validity if the characteristics of those who died after the repeal differed systematically from those
who died prior to the repeal, with the most likely case being made for an increased number of
deaths for motorcyclists over 21 years of age. However, neither Muller [27] nor Kyrychenko &
McCartt [29] found differential fatality rates based on the age cutoff. History is a plausible threat
to validity only if another event or action had occurred simultaneously with the repeal, given that
the trend in fatalities was decreasing annually prior to the repeal. However, given such an
immediate and dramatic effect on the time series concomitant with the repeal, it may appear
rather unlikely that any other factor could have caused the effect outside the intervention.
However, Figures 1c and 1d cast doubt on the assertion that the helmet law repeal caused
the increase in motorcycle deaths. As illustrated, motorcycle registrations followed a nearly
identical historic pattern as motorcycle deaths (with a very high correlation between them of
0.95). Most notable in this time series is the sharp increase in motorcycle registrations
commencing in 2000 -- after many years of declining rates. In light of these data, one may revise
the prior hypothesis to now consider that the helmet law repeal is associated with more people
registering motorcycles, which in turn is associated with more deaths.
This article is protected by copyright. All rights reserved.

Figures 1e and 1f offer a complete rebuttal for any causal association between Florida’s
helmet law repeal and the rise in motorcycle fatalities. In Figure 1e, motorcycle fatalities in
Florida are compared to those of all other States (excluding Arkansas, Kentucky, Michigan,
Pennsylvania and Texas – states that repealed their helmet laws during some point in the same
timeframe under study). The time series were ipsatively standardized [32] so that they could be
compared on the same scale. As shown, nationally there was an even sharper downward trend in
motorcycle deaths prior to 2000 than in Florida. However, similar to Florida, there was both an
immediate and prolonged increase in motorcycle deaths after 2000. As one can see from the
intermingled observations between the two time series, the trends are not statistically different
from each other. Although not shown, national motorcycle registrations followed a similar
annual trajectory to that in Florida. Thus, one may now further conclude that there was some
event that caused people to register motorcycles in large numbers throughout the country starting
in 2000, and this in turn was associated with increasing annual motorcycle fatalities.
Finally, one may argue that the comparison between Florida and all other States is biased
because the two are not comparable on either baseline level or trend of the outcome variable
[20,21]. To address this concern, an optimal matching algorithm was implemented to identify
States that matched Florida on both baseline level and trend of standardized motorcycle fatalities.
As illustrated in Figure 1f, Nevada and North Carolina were virtually indistinguishable from
Florida across the entire time series from 1975 to 2014, including, and most importantly, the year
2000, in which the Florida helmet law was repealed.
This article is protected by copyright. All rights reserved.

In summary, this example demonstrates that a seemingly irrefutable treatment effect
detected upon reviewing data from a single time series can be disproven when that time series is
contrasted with that of a comparable control group.
EXAMPLE 2: CALIFORNIA’S PROPOSITION 99 ANTI-SMOKING INITIATIVE
In 1988, California passed the voter-initiative Proposition 99, which was a widespread effort to
reduce smoking rates by raising the cigarette excise tax by 25 cents per pack, and to fund anti-
smoking campaigns and other related activities throughout the state (see Breslow & Johnson [33]
and Siegel [34] for a comprehensive discussion of this initiative). Several studies have shown
that cigarette consumption in California after the passage of Proposition 99 in 1988 was lower
than the average national trend and lower than the linearly extrapolated pre-intervention trend in
California (See Breslow and Johnson [33]; Glantz [35] and Fichtenberg & Glantz [36], among
others).
Per capita cigarette sales (in packs) is the most widely used indicator of smoking
prevalence found in the tobacco research literature [37] and serves here as the aggregate outcome
variable under study, measured annually at the state level from 1970 until 2000 (with 1989
representing the first year of the intervention). The current data were obtained from Abadie et al.
[38], who obtained the data from Orzechowski & Walker [39]. Eleven states were discarded
from the dataset because of their adoption of some other large-scale tobacco control program at
some point during California's intervention period under study between 1989 and 2000, leaving
38 states as potential controls (Abadie et al. [37]).
This article is protected by copyright. All rights reserved.

Figure 2a illustrates the annual time series of cigarette sales per capita in California from
1970 to 2000. As shown, per capita cigarette sales began to decrease in 1976 and continued its
downward trajectory until 2000. There does appear to have been an “interruption” in the time
series coinciding with the initiation of Proposition 99, after which the annual trend decreased
more so than prior to 1999.
Given that the internal validity of the ITSA design rests on the premise that the
interruption in the time series is associated with the introduction of the treatment, treatment
effects may seem less plausible if a shift in the time series appears prior to the actual
intervention. Such a shift would indicate that an external factor was already influencing the time
series, and imply that any additional shifts may simply be a continuation of that factor’s impact.
Using these same cigarette sales data, Linden and Yarnold [25] found that numerous structural
breaks occurred prior to the actual initiation of Proposition 99 in 1989, including perfect
structural breaks in 1983 and 1985. Figure 2b illustrates that the linear trend between 1983 and
1989 is nearly identical to the linear trend following the introduction of Proposition 99, casting
doubt on whether there was an intervention effect associated with Proposition 99, or simply an
additional structural break due to some factor outside of the intervention.
Figure 2c illustrates the comparison of California to all other states that had not yet
implemented any anti-smoking campaign. As shown, the annual linear trend in cigarette sales
after 1989 is decreasing much more so in California than in the other states, pointing to an
intervention effect associated with Proposition 99. However, as in the previous example, one
This article is protected by copyright. All rights reserved.

could argue that the comparison between California and all other States is biased because the two
are not comparable on either baseline level or trend of the outcome variable [20,21]. To address
this concern, an optimal matching algorithm was implemented to identify States that matched
California on both baseline level and trend of pre capita cigarette sales. As illustrated in Figure
2d, Colorado, Idaho and Montana were very comparable to California in both level and trend of
cigarette sales across the entire pre-intervention period spanning 1970 to 1989. However,
California’s cigarette sales declined much more so than these control states after the initiation of
Proposition 99, indicating a treatment effect.
In summary, this example demonstrates that when some factor causes a shift in the time
series prior to the actual introduction of the intervention, it raises the concern that any shift
subsequent to the introduction of the intervention, may be related to this prior factor, rather than
the intervention. To control for this confounder, the treated group’s pre-intervention time-series
is matched to that of a comparable control group. The result here was that Proposition 99
appeared to be effective when contrasted to a comparable control group.
DISCUSSION
The two examples presented in this paper illustrate how the single-group ITSA model can easily
provide misleading results about the effects of an intervention, because the effects of other
competing factors cannot be identified, or controlled for. In the first example, a seemingly
unquestionable treatment effect was reversed when contrasted with a comparable control group.
Conversely, in the second example, a debatable treatment effect (due to a pre-existing
This article is protected by copyright. All rights reserved.

directionally-correct trend in the time series) was reinforced when the treatment group was
contrasted with a comparable control group. In short, even with an extensive number of pre- and
post-intervention observations to control for regression to the mean and other biases, the single-
group ITSA design may be no better than the simple single-group pretest-posttest design for
causal inference. Thus, a more robust ITSA design must be employed if inferences about the
intervention are to be considered valid and casual.
As demonstrated in the present examples, using a comparable control group to serve as
the counterfactual provides a robust approach for assessing treatment effects. Only when
contrasted with a comparable control group can the effect of the intervention (or lack thereof) be
isolated from other rival factors. Moreover, other anomalies observed in the time series (such as
changes in instrumentation, selection bias, etc.) can alert the investigator to other potential
sources of confounding.
When multiple non-treated units are available, investigators can choose from at least
three different matching methods suitable for time-series data. This includes the matching
process implemented in the present examples (i.e, finding those non-treated units that are non-
statistically different from the treated unit on pre-intervention levels and trend of the outcome
variable), a synthetic controls approach [37] or propensity score-based weighting [20] (which
can also be extended to longitudinal data with multiple treated units [40] and for censored data
[41,42]. The ITSA framework with a comparable control group can be further strengthened by
implementing a cross-over design, wherein the groups switch their treatment assignment at a
This article is protected by copyright. All rights reserved.
given time-point (i.e. the treatment group switches to control and the control switches to
treatment), and the outcomes change in accordance with the exposure to the intervention.
When a control group is simply not available, a version of the cross-over design can be
implemented with a single-group as well. Here the intervention is administered and withdrawn,
repeatedly. The results may be considered a causal effect of the intervention if the treatment
effect changes in a similar fashion after each successive administration. A limitation of any
cross-over design, however, is that it requires the ability to control the treatment assignment,
thereby restricting its application from most natural experiments (see Barlow, Hayes, and Nelson
[43] for many other ITSA design alternatives to improve causal inference over the basic single-
group design).
In summary, this paper illustrated two cases in which erroneous conclusions may be
drawn about the effectiveness of an intervention when using the single-group ITSA design for
evaluation. Absent a comparable control group as a contrast, there is no assurance that the effect
of external factors have been identified and controlled for. Thus, the results should be considered
preliminary -- and interpreted with caution -- until a more robust study design can be
implemented. Given the popularity and widespread use of the single-group ITSA design, it is
important for investigators to be cognizant of its limitations, and to strive to add features that
maximize its validity and improve causal inference.
This article is protected by copyright. All rights reserved.

REFERENCES
1. Campbell, D. T., & Stanley, J. C. (1966) Experimental and Quasi-Experimental Designs for
Research. Chicago, IL: Rand McNally.
2. Shadish, W.R., Cook, T.D., & Campbell, D. T. (2002) Experimental and Quasi-Experimental
Designs for Generalized Causal Inference. Boston: Houghton Mifflin.
3. Linden, A., Adams, J., & Roberts, N. (2004) The generalizability of disease management
program results: getting from here to there. Managed Care Interface, 17, 38-45.
4. Biglan, A., Ary, D., & Wagenaar, A.C. (2000) The value of interrupted time-series
experiments for community intervention research. Prevention Science, 1, 31–49.
5. Gillings, D., Makuc, D., & Siegel, E. (1981) Analysis of interrupted time series mortality
trends: An example to evaluate regionalized perinatal care. American Journal of Public
Health, 71, 38–46.
6. Muller, A. (2004) Florida’s motorcycle helmet law repeal and fatality rates. American
Journal of Public Health, 94, 556–558.
7. Briesacher, B. A., Soumerai, S. B., Zhang, F., Toh, S., Andrade, S. E., Wagner, J. L.,
Shoaibi, A., & Gurwitz, J.H. (2013) A critical review of methods to evaluate the impact of
FDA regulatory actions. Pharmacoepidemiology and Drug Safety, 22, 986– 994.
8. Ramsay, C.R., Matowe, L., Grilli, R., Grimshaw, J.M., & Thomas, R.E. (2003) Interrupted
time series designs in health technology assessment: Lessons from two systematic reviews of
This article is protected by copyright. All rights reserved.

behavior change strategies. International Journal of Technology Assessment in Health Care,
19, 613–623.
9. Riley, W.T., Glasgow, R.E., Etheredge, L., & Abernethy, A.P. (2013) Rapid, responsive,
relevant (R3) research: A call for a rapid learning health research enterprise. Clinical and
Translational Medicine, 2, 1–6.
10. Effective Practice and Organisation of Care (EPOC). (2015) Interrupted time series (ITS)
analyses. EPOC Resources for review authors. Oslo: Norwegian Knowledge Centre for the
Health Services. Available at: http://epoc.cochrane.org/epoc-specific-resources-review-
authors
11. Rubin, D.B. (1974) Estimating causal effects of treatments in randomized and
nonrandomized studies. Journal of Educational Psychology, 66, 688–701.
12. Rubin, D.B. (2005) Causal inference using potential outcomes: design, modeling, decisions.
Journal of the American Statistical Association,100, 322–331.
13. Box, G.E.P., & Tiao, G.C. (1975) Intervention analysis with applications to economic and
environmental problems. Journal of the American Statistical Association, 70, 70-79.
14. Glass, G.V., Willson, V.L. & Gottman, J.M. (1975) Design and Analysis of Time-series
Experiments. Boulder: University of Colorado Press.
15. McDowall, D., McCleary, R. Meidinger, E.E. & Hay, R.A. (1980) Interrupted Time Series
Analysis. Newbury Park, CA: Sage Publications, Inc.
This article is protected by copyright. All rights reserved.

16. Crosbie, J. (1993) Interrupted time-series analysis with brief single-subject data. Journal of
Consulting and Clinical Psychology, 61, 966-974.
17. Gottman, J.M. (1981) Time-series analysis. A Comprehensive Introduction for Social
Scientists. New York: Cambridge University Press.
18. Linden, A., & Adams, J.L. (2011) Applying a propensity-score based weighting model to
interrupted time series data: Improving causal inference in program evaluation. Journal of
Evaluation in Clinical Practice, 17, 1231–1238.
19. Linden, A. (2015) Conducting interrupted time-series analysis for single- and multiple-group
comparisons. The Stata Journal, 15, 480–500.
20. McKnight, S., McKean, J.W. & Huitema, B.E. (2000) A double bootstrap method to analyze
linear models with autoregressive error terms. Psychological Methods, 5, 87-101.
21. Simonton, D.K. (1977) Cross-sectional time-series experiments: Some suggested statistical
analyses. Psychological Bulletin, 84, 489-502.
22. Velicer, W.F., & McDonald, R.P. (1991) Cross-sectional time series designs: A general
transformation approach. Multivariate Behavioral Research, 26, 247-254.
23. Hotz, G.A., Cohn, S.M., Popkin, C., Ekeh, P., Duncan, R., Johnson, E.W., Pernas, F., &
Selene J. (2002) The impact of a repealed motorcycle helmet law in Miami-Dade County. J.
Trauma, 52, 469–474.
24. Muller A. (2004) Florida’s motorcycle helmet law repeal and fatality rates. Am. J. Public
Health, 94, 556–558.
This article is protected by copyright. All rights reserved.

25. Turner, P., Hagelin, C., Chu, X., Greenman, M., Read, J., & West, M. (2004). Florida
Motorcycle Helmet Use Observational Survey and Trend Analysis. Center for Urban
Transportation Research, University of South Florida, Tampa, Florida.
26. Kyrychenko, S.Y., & McCartt, A.T. (2006) Florida's weakened motorcycle helmet law:
effects on death rates in motorcycle crashes. Traffic Injury Prevention, 7, 55-60.
27. U.S. Department of Transportation, National Highway Traffic Safety Administration,
National Center for Statistics and Analysis. Fatality Analysis Reporting System (FARS).
Available at: ftp://ftp.nhtsa.dot.gov/fars/ Accessed July 5, 2016.
28. U.S. Department of Transportation, Federal Highway Administration. Highway statistics
(multiple years). Available at http://www.fhwa.dot.gov/policyinformation/statistics.cfm
Accessed on July 5, 2016.
29. Yarnold, P.R., & Linden, A. (2016) Using machine learning to model dose-response
relationships via ODA: eliminating response variable baseline variation by ipsative
standardization. Optimal Data Analysis, 5, 41-52.
30. Linden, A. (2007) Estimating the effect of regression to the mean in health management
programs. Disease Management and Health Outcomes, 15, 7-12.
31. Linden, A. (2013) Assessing regression to the mean effects in health care initiatives. BMC
Medical Research Methodology, 13: 1-7.
32. Breslow, L., & Johnson, M. (1993) California’s Proposition 99 on Tobacco, and Its Impact.
Annual Review of Public Health, 14, 585–604.
This article is protected by copyright. All rights reserved.

33. Siegel, M. (2002) The Effectiveness of State-Level Tobacco Control Interventions: A
Review of Program Implementation and Behavioral Outcomes, Annual Review of Public
Health, 23, 45–71.
34. Glantz, S. (1993) Changes in cigarette consumption, prices, and tobacco industry revenues
associated with California’s Proposition 99. Tobacco Control, 2, 311–314.
35. Fichtenberg, C., & Glantz, S. (2000) Association of the California tobacco control program
with declines in cigarette consumption and mortality from heart disease. New England
Journal of Medicine, 343, 1772– 1777.
36. Abadie, A., Diamond, A., & Hainmueller, J. (2010) Synthetic control methods for
comparative case studies: Estimating the effect of California’s tobacco control program.
Journal of the American Statistical Association, 105, 493–505.
37. Abadie, A., Diamond, A., & Hainmueller, J. (2014) SYNTH: Stata module to implement
synthetic control methods for comparative case studies. Statistical Software Components
S457334, Department of Economics, Boston College.
https://ideas.repec.org/c/boc/bocode/s457334.html
38. Orzechowski, W., & Walker, R.C. (2005) The Tax Burden on Tobacco. Historical
Compilation, vol. 40. Arlington, VA: Orzechowski & Walker.
39. Linden, A., Yarnold, P.R. (In Print) Using machine learning to identify structural breaks in
single-group interrupted time series designs. Journal of Evaluation in Clinical Practice
This article is protected by copyright. All rights reserved.

40. Linden, A., & Adams, J.L. (2010) Evaluating health management programmes over time.
Application of propensity score-based weighting to longitudinal data. Journal of Evaluation
in Clinical Practice, 16, 180-185.
41. Barlow, D.H., Hayes, S. C. & Nelson, R.O. (1984) The Scientist Practitioner: Research and
Accountability in Clinical and Educational Settings. New York: Pergamon Press.
42. Robins, J.M., Hernán, M.A., Brumback, B. (2000) Marginal structural models and causal
inference in epidemiology. Epidemiology, 11, 550–60.
43. Linden, A., Adams, J., & Roberts, N. (2004) Evaluating disease management program
effectiveness: An introduction to survival analysis. Disease Management, 7, 180-190.
This article is protected by copyright. All rights reserved.

100
200
300
400
500
600
Raw
mot
orcy
cle d
eath
s
1975 1985 1995 2005 2015(a)
.05
.1.1
5.2
Mot
orcy
cle d
eath
s as
a p
erce
nt o
f tot
al
1975 1985 1995 2005 2015(b)
3,00
05,
000
7,00
09,
000
Mot
orcy
cle re
gist
rato
ns (i
n th
ousa
nds)
1975 1985 1995 2005 2015(c)
Registrations
Deaths
-2-1
01
2M
otor
cycle
dea
ths
vs re
gist
ratio
ns (s
td)
1975 1985 1995 2005 2015(d)
Controls
Florida
-2-1
01
2M
otor
cycle
dea
ths
- Flo
rida
vs a
ll st
ates
(std
)
1975 1985 1995 2005 2015(e)
Florida
Controls
-2-1
01
2M
otor
cycle
dea
ths
- FL
vs N
V an
d NC
(std
)
1975 1985 1995 2005 2015(f)
This article is protected by copyright. All rights reserved.

Figure 1. Florida motorcycle deaths and registrations from 1975 to 2014, using single-group and multiple-group ITSA designs
This article is protected by copyright. All rights reserved.

4060
8010
012
014
0C
alifo
rnia
cig
aret
te s
ales
per
-cap
ita (i
n pa
cks)
1970 1975 1980 1985 1990 1995 2000(a)
4060
8010
012
0C
igar
ette
sal
es p
er-c
apita
(in
pack
s)
1970 1975 1980 1985 1990 1995 2000(b)
California
All other states
4060
8010
012
014
0C
alifo
rnia
vs
all o
ther
sta
tes
1970 1975 1980 1985 1990 1995 2000(c)
California
Control states
4060
8010
012
014
0C
alifo
rnia
vs
Colo
rado
, Ida
ho a
nd M
onta
na
1970 1975 1980 1985 1990 1995 2000(d)
This article is protected by copyright. All rights reserved.

Figure 2. Cigarette sales in California from 1970 to 2000, using single-group and multiple-group ITSA designs
This article is protected by copyright. All rights reserved.

JEP_12638_F1.tif
This article is protected by copyright. All rights reserved.

JEP_12638_F2.tif
This article is protected by copyright. All rights reserved.