Embed Size (px)
Citation preview


Challenges of the current medicine
Volume VII


Medical University of Białystok
Faculty of Health Sciences
Challenges of the current medicine
Vol. 7
Edited by
Elżbieta Krajewska-Kułak
Wojciech Kułak
Cecylia Łukaszuk
Jolanta Lewko
Emilia Sarnacka

Białystok 2018

Reviewers
Andrei Shpakou PhD, MD, Head of Department of Sport Medicine and Rehabilitation of
Yanka Kupala State University of Grodno
Valerii Kovalevskii Prof. PhD Pedagogical State University W.P. Astafjew in Krasnojarsk
ISBN - 978-83-948644-1-5
The first Edition
Białystok 2018
Graphic Design: Agnieszka Kułak
Printed by:
"Duchno" Teresa Duchnowska, 15–548 Białystok, Zaściańska 6

I believe that the greatest gift you can give your family and the world is a healthy you.
Joyce Meyer


Dear Colleagues
The monograph periodical “Challenges of the Current Medicine - 7 Edition” is
a collection of works written by authors from many different medical centers.
Buddha said: “Health is the greatest gift, contentment the greatest wealth, faithfulness
the best relationship”
The leading theme of the monograph applies patient, mainly the dying patient.
Nowadays very important is also our mental condition. We should remember words of
Vikram Patel who said that:- ‘There is no health without mental health; mental health is too
important to be left to the professionals alone, and mental health is everyone's business.
In the particular chapters are discussed various therapeutic care problems occurring in
modern medicine, selected sociological threads of the dying person, approach to
transplantation, euthanasia, genetic diagnostics of cancer and the role of support groups in
the process of grieving child. We discussed the role of the therapeutic team in improving the
quality of life of patients and problems associated with miscarriage and morbidity.
We hope that the monograph subjects allow demonstrate respect for the patient’s
dignity.
As the authors we believe in the truth from words of Anne Wilson Schaef ‘Good
health is not something we can buy. However, it can be an extremely valuable savings
account..
Prof. Elżbieta Krajewska-Kułak MD, PhD
Prof. Wojciech Kułak MD, PhD
Cecylia Łukaszuk Ass. Prof. PhD
Jolanta Lewko Ass. Prof. PhD
Emilia Sarnacka MSc, PhD


Comparison Validation Polish, Greece, Belarus Version of the Trust in Physician Scale
10
Comparison Validation Polish, Greece, Belarus Version of the Trust in Physician Scale
Krajewska-Kułak Elżbieta1, Hatzopulu Aantigoni
3, Shpakou Andrei
2, Sengupta Pallav
4,
Kułak Wojciech5, Łukaszuk Cecylia
1, Lewko Jolanta
1, Cybulski Mateusz
1, Guzowski
Andrzej1, Kowalczuk Krystyna
1, Jankowiak Barbara
1, Kowalewska Beata
1, Kondzior Dorota
1,
Rolka Hanna1, Baranowska Anna
1, Lankau Agnieszka
1, Klimaszewska Krystyna
1,
Sierakowska Matylda1, Krajewska-Ferishah Katarzyna
1, Szyko-Perłowska Agnieszka
1
1. Department of Integrated Medical Care, Medical University of Bialystok
2. General Hospital of Kavala, Grecja
3. Head of the Department of Sport Medicine and Rehabilitation, Yanka Kupala State
University of Grodno
4. Department of Physiology, Faculty of Medicine, MAHSA University, Saujana Putra,
Jenjarum, Selangor, Malaysia
5. Department of Pediatric Rehabilitation, Medical University of Bialystok
The authors of the paper thank Robert F. Dedrick, Department of Educational and
Psychological Studies, EDU 105, University of South Florida, Tampa, FL 33620, for
agreeing to scale adaptation to Polish conditions.
We thank editorial Progress in Health Sciences, for permission to use the results of
collective work from Greece and Belarus, printed in number 7 (2) of the 2017 years and 8 (1)
of 2018
Introduction
The scientific literature [1-4] describes that in the United States and in Europe, the
bad habits of the staff have been eliminated, the ineffective ways of treatment and care. The
quality of care has been systematically assessed and the recommendations and procedures for
treatment and care of patients have been developed. This phenomenon appeared in Poland in
the context of changes in the health care system [1-4].
In the survey performed between 2011 and 2013 within the International Social
Survey Program (ISSP), conducted in 29 countries by national research and research
institutes. Two parameters were evaluated: the trust of the physician as a professional and the
individual satisfaction of the treatment during the last visit to the doctor. It was found that

Comparison Validation Polish, Greece, Belarus Version of the Trust in Physician Scale
11
physicians trusted citizens in countries such as Switzerland, Netherlands, United Kingdom,
Finland, France and Turkey (confidence level from 83% to 75%). The ratings are closed by
Croatia, United States, Bulgaria, Russia, and Poland with 58-43% confidence. Trusted doctors
were less than half of respondents from Bulgaria, Russia and Poland, which is the country
closing the ranking with the trust of doctors at the level of 43%.
Institutional trust refers to trust in the rules, roles, and norms independent of those who
hold these roles [6-8]. This is a general attitude that results from personal experiences,
previous experiences and contacts with representatives of a particular institution created by
the media, and on the other hand the effect of applicable social norms [6-8]. Trust in the
macro scale - is trust in social institutions or systems, expecting the person to be properly
treated by the system, e.g. health care if needed [7,9]. There is also a high level of knowledge-
based trust - coming from a firm belief in future direction of the partner's behavior based on
past experience, calculus-based trust - down to accept assumptions about the predictability of
partner behavior. Institutional trust - which grows with the degree of professionalism of the
organization, which in the context of health care is important, and the trust of the
identification-based trust - which has a bearing on the alternative path. its sources in the
internalisation of needs and intentions of transaction partners [7,10,11].
All of the aforementioned types of trust exist in relationships between healthcare
providers, with two of them: knowledge-based trust and identification can relate to
interpersonal relationships (for example, physician-patient), while the other two relate to a
greater degree of organizational level [7] .
Cook et al. have shown that trust in a provider and the satisfaction of his services are
related [12].
The aim of the study was to compare validated of the patient’s trust scales between
Polish, Greek, Belarus versions.
Material and methods
The consent of the Bioethics Committee of the Medical University of Bialystok R-I-
002/52/2011 was obtained.
The study used the Anderson and Dedrick Trust in Physician Scale (TIPS),
covering 11 issues [13]:
1. I doubt that my doctor really cares about me as a person.
2. My doctor is usually considerate of my needs and puts them first.

Comparison Validation Polish, Greece, Belarus Version of the Trust in Physician Scale
12
3. I trust my doctor so much I always try to follow his/her advice.
4. If my doctor tells me something is so. then it must be true.
5. I sometimes distrust my doctor’s opinion and would like a second one.
6. I trust my doctor’s judgments about my medical care.
7. I feel my doctor does not do everything he/she should for my medical care
8. I trust my doctor to put my medical needs above all other considerations when treating
my medical problems.
9. My doctor is a real expert in taking care of medical problems like mine.
10. I trust my doctor to tell me if a mistake was made about my treatment.
11. I sometimes worry that my doctor may not keep the information we discuss totally
private.
Reliability and repeatability of the scale were confirmed by independent studies in
which Cronbach alpha coefficient ranged from 0.85 to 0.90.
The respondents reported with a five-point scale [13]:1 – Strongly Disagree, 2 –
Disagree, 3 – The authors of the questionnaire have developed a method for calculating the
degree of trust of patients towards doctors (the scores for each question are calculated and the
mean is calculated) [13]. According to this method, the highest score for each question was 5
points. Exceptions were questions 1, 5, 7, 11, as they had a maximum rating of 1 point. As a
result, these questions were reversed in turn and then added to the answers to the remaining
questions [13].
The adaptation of the scale to the Polish conditions was carried out with the
permission of the author of the Robert F. Dedrick scale, Department of Educational and
Psychological Studies, EDU 105, University of South Florida, Tampa.
The study group included 849 patients from Poland (57.1% men and 42.9% women),
251 patients from Greece (59.7% of women and 40.3% of men) and 251 patients from
Belarus (56.3% men and 43.7% women). Patients were asked to participate in the study
during the staying in the hospital. Patients who agreed to participate completed a consent
form and the Trust in Physician Scale.
Stages of the adaptation process
The validation process consisted of two parts: translation and evaluation of the
psychometric properties of the newly translated instrument, and its purpose was to compare
the obtained results on the intercultural (international) level and to apply the given test in
Poland, Greece, and Belarus [14].

Comparison Validation Polish, Greece, Belarus Version of the Trust in Physician Scale
13
An important factor of validation is cultural adaptation for intercultural comparison
(the ability to compare the results of the questionnaire at an intercultural level) and practical
use of the questionnaire in Poland, Greece and Belarus [15].
Equivalence of adopted tools with the original version is measured in five categories
of equivalence [14]: facade (e.g., test graphic, instruction), psychometric (e.g., correlation
between versions), functional (relevance to the same purpose), translations, degree of
difficulty of words) and reconstruction (e.g., methods of checking reliability and relevancy,
types of norms).
The validation process consisted of the following steps: obtaining permission to use the
scale (contact with the authors of the questionnaire), preparing the Polish language version of
the scale, applying the Polish language version of the scale, assessing the psychometric
properties of the scale. During cultural adaptation, all the principles of equivalence of scale to
original version were tried.
In the first stage of validation ("forward translations"), efforts were made to preserve,
through transcription and translation, the fidelity of the translation of the questionnaire into
Polish, Greece and Belarus [16]. The original version of the research tool was translated by
two independent translators of English, whose mother tongue was Polish, were graduates of
English philology, and were daily involved in the translation and teaching of English in higher
education.
In the next stage a preliminary version of the Polish, Greece and Belarus -language
questionnaire was created based on two translations. The scale was retransmitted, ie the newly
acquired scale was re-translated into the original language by an interpreter whose native
language was English, but has lived in Poland, Greece and Belarus for many years and is
fluent in that language [15,17]. The next stage of the scale validation process According to the
literature recommendation [15], the principle of equivalence of the façade questionnaire
consisted in graphical compliance, quantity and method of question formulation, as well as
the form of answers to the questions asked, the instructions on how to conduct the research
and the selection of the research group. Thanks to such precise rules, it was possible to
achieve a high degree of facade equivalence with the original scale version. During the
preparation of the Polish version of the scale, an identical graphical form of scale was used, as
prepared by the authors of the original version.
The next step of validation, according to literature recommendations [14,15], was to
preserve the faithfulness of the reconstruction, which relates to the different stages of scale
construction, the ways of assessing its relevance and reliability, the similarity of groups and

Comparison Validation Polish, Greece, Belarus Version of the Trust in Physician Scale
14
the type of standards used. Because the Polish, Greece and Belarus version of the scale was
created on the basis of the scale already existing, some elements of this principle were
omitted, and the focus was on the execution of studies similar to those used by the authors of
the original version.
Statistical methods such as Cronbach's alpha coefficient, correlations between
accumulated data on individual questions and the whole scale were used to determine the
relevance and reliability of the scale.
The performance evaluations were made in accordance with the manual developed by
the authors of the questionnaire, by calculating the interest values and the mean scores
obtained from the response to the individual scale questions.
The last element of validation was the evaluation of the psychometric equivalence of
both questionnaires. According to the literature requirements [17], the research process
analyzed elements similar to those in the original version. Internal cohesion was assessed
using the Cronbach alpha coefficient tests and the discriminatory power of the items.
Statistical software Statistica version 10 (Statsoft) was used for statistical analysis.
Cronbach's alpha coefficient correlations between the accumulated data on individual
questions and the whole scale were used to determine the relevance and reliability of the
scale. Kruskal-Wallis test was used to compare results between three countries. A level of
statistical significance of p < 0.05 was used.
Results
In Poland, the highest mean score were items "I trust my doctor very well, therefore I
always adhere to his advice" - 3.86 ± 0.83 and "I trust my doctor as to how to treat my
condition" - 3.8 ± 0.89, And the smallest item "Sometimes I'm afraid my doctor does not keep
a secret" - 2.36 ± 1.26. "If my doctor says something must always be true," 14.85% of the
respondents strongly agreed, and strongly disagreed - 2.2% of the respondents. Definitely not
trusted his doctor at all, 4.7% of the respondents and vice versa declared 12% of them. 18% of
the respondents believed strongly in the decisions and opinions of their physician and did not
trust - 2.6%. About 20% of the respondents were convinced that their doctor was a real expert
in the treatment of diseases. The remaining results are shown in Table I.
In Greece - the highest mean scores were for items „ I trust my doctor so much I
always try to follow his/her advice” 3.63±0.91; „If my doctor tells me something is so.
Then it must be true” 3.55±0.89; „I trust my doctor’s judgments about my medical care”

Comparison Validation Polish, Greece, Belarus Version of the Trust in Physician Scale
15
3.44±0.86 and „ My doctor is usually considerate of my needs and puts them first”
3.41±0.88.
Table I. Respondents' responses to scale issues
Issue number / issue
Average points ± SD
P value Poland
N=849
Greece
N=251
Belarus
N=251
1. I doubt that my doctor really cares
about me as a person
2.51±1.09 2.65±0.97 2.51±0.95
NS
2. My doctor is usually considerate of
my needs and puts them first
3.49±0.94 3.41±0.88 3.33±0.98
NS
3. I trust my doctor so much I always
try to follow his/her advice
3.86±0.83 3.63±0.91 3.64±0.99
NS
4. If my doctor tells me something is so.
then it must be true
3.65±0.91 3.55±0.89 2.52±0.85
<0.001
5. I sometimes distrust my doctor’s
opinion and would like a second one
2.58±1.03 3.29±0.92 2.63±0.86
<0.001
6. I trust my doctor’s judgments about
my medical care
3.67±0.97 3.44±0.86 3.66±0.88
NS
7. I feel my doctor does not do
everything he/she should for my
medical care
2.698±1.1 3.04±0.99 2.92±1.24
<0.001
8. I trust my doctor to put my medical
needs above all other considerations
when treating
my medical problems
3.8±0.89 3.37±0.87 3.83±0.80
NS
9. My doctor is a real expert in taking
care of medical problems like mine
3.76±0.9 3.39±0.84 3.95±0.77
NS
10. I trust my doctor to tell me if a
mistake was made about my
treatment
3.46±0.96 3.35±0.98 3.5±0.83
NS
11. I sometimes worry that my doctor
may not keep the information we
discuss totally private
2.36±1.26 3.08±0.97 2.52±113
<0.001
Total
3.26±1.14
3.29±0.96
3.18 ±1.09
NS

Comparison Validation Polish, Greece, Belarus Version of the Trust in Physician Scale
16
Tab. II. Comprehensive statistics summary scale the trust in physician scale and scale
reliability Issue number / issue
Item-scale correlation Cronbach’s alpha
measured without the question
P
value
Poland Greece Belarus Poland Greece Belarus
1. I doubt that my
doctor really cares
about me as a
person
-0.891 0.911 0.946 -0.981 0.983 0.983 NS
2. My doctor is
usually conside-
rate of my needs
and puts them first
0.909 0.950 0.927 0.980 0.982 0.984 NS
3. I trust my doctor so
much I always try
to follow his/her
advice
0.899 0.938 0.951 0.981 0.982 0.983 NS
4. If my doctor tells
me something is so.
then it must be true
0.950 0.944 0.943 0.979 0.982 0.984 NS
5. I sometimes
distrust my
doctor’s opinion
and would like a
second one
-0.904 0.942 0.946 -0.980 0.982 0.984 NS
6. I trust my doctor’s
judgments about
my medical care
0.941 0.939 0.958 0.979 0.982 0.983
NS
7. I feel my doctor
does not do
everything he/she
should for my
medical care
-0.887 0.931 0.943 -0.981 0.982 0.985
NS
8. I trust my doctor to
put my medical
needs above all other
considerations when
treating my
medical problems
0.930 0.948 0.897 0.980 0.982 0.985
NS
9. My doctor is a real
expert in taking
care of medical
problems like mine
0.945 0.799 0.898 0.979 0.985 0.985 NS
10. I trust my doctor to
tell me if a mistake
was made about my
treatment
0.915 0.866 0.939 0.980 0.984 0.984 NS
11. I sometimes worry
that my doctor may
not keep the
information we
discuss totally
private
-0.875 0.927 0.921 -0.982 0.982 0.985
NS
Total
0.891
0.918
0.933
0.893
0.918
0.984
NS
Comparison Validation Polish, Greece, Belarus Version of the Trust in Physician Scale
17
Discussion
Our findings indicate that patient trust with physician satisfaction in the validated
scales differed between countries in some questions.
We found significant differences in the following questions: If my doctor tells me
something is so. then it must be true; I sometimes distrust my doctor’s opinion and would like
the second one; I feel my doctor does not do everything he/she should for my medical care; I
sometimes worry that my doctor may not keep the information we discuss totally private.
Furthermore, we did not find the significant difference between countries in regard scale
reliability.
We should remember that the patient-doctor relationship is variable and depends on
many independent factors, so it should be based on the professional competence of the staff,
mutual trust, kindness and respect for the dignity, and intimacy of the patient [18].
The above relationship is affected by the level of knowledge and skills of the staff, the
ethical attitude as well as the patient's attitude to his illness.
Miller et al. [19] analyzing the beliefs of 191 patients waiting for a visit
general practitioners in primary care showed that the majority of expectant patients rated the
quality of benefits they received. Only one aspect of primary care patients rated negatively -
less than 50% stated that the general practitioner had taken into account their material
situation [19].
Hean [20] in a study of 1,200 students in the first year of ten medical studies showed
that doctors were viewed by the students as decision makers, having a leader in the medical
team.
Many authors [1,21-24] have attempted to create the most accurate definition of the
relationship between the physician and the patient, and to define their rights and obligations
towards one another, and to design an ethical framework for behavior.
Hollender and Szasz [25], have created a model of three basic types of relationship
between physician and patient, which takes into account their clinical applications: activity -
passivity (e.g., in coma); targeting - cooperation (in infectious diseases) and participation
(most chronic diseases).
Other models in the bioethical literature [1,20,24] also include: legalistic (in which one
side is a physician; the other is the client); consumers (where the doctor is dealing with the
consumer and as a health care professional performs the role of a seller of medical products,
subject to the same free market rules as other services.)
Comparison Validation Polish, Greece, Belarus Version of the Trust in Physician Scale
18
It has the task of providing the patient with professional information covering both
benefits and risks, a particular treatment method, listen to the patient's needs and needs,
present methods that would meet his or her expectations [1,20,24,25].
Negotiation (where the relationship between doctor and patient is limited to
negotiation), discussion (not only about health but also moral values), contractual (where the
contract is concluded) [1,20,24,25].
Patient negotiates with his or her physician specialists in the presence of lawyers,
while some watch over the cost-effectiveness of the system for the patient and others for the
doctor [1,20,24,25].
Emanuel and Emanuel [20] proposed paternalistic model - the doctor decides about the
patient's health; informative - the doctor is a professional and provides the patient with
relevant information. The doctor provides the necessary information. including the risks and
benefits of the treatment. the patient makes a competent decision; joint dialogue - a friendly
atmosphere in which to choose the best treatment.
The results of Reader's Digest survey have shown that Poles have less confidence in
the health care professions, including doctors. The doctors trusted 64% surveyed in Poland,
whereas the European average was 81% [26].
Even less trust doctors were noted in Russia (51%). The best doctors trusted the
Belgians, Finns and Swedes (91%) and Austrians (90%). Dutch and Swiss (89% each) [26].
Benker et al. [27] demonstrated that trust building involves listening, informing,
sometimes spending time together, and the ability to participate in decision-making [27].
Trust can be studied at several different levels that interpenetrate [28].
Baidya et al. [29] explored the concept of patient-physician trust among adults of
rural Tamil Nadu to assess the factors affecting patient-physician trust relationship and patient
satisfaction. Men and women aged above 40 years who have visited a health care service at
least once during the last 5 years were included in the study. Trust influenced patient's self-
reported satisfaction and remained independent of all the other factors assessed in the study
such as, age, gender, education, self-reported health status, time spent with the physician,
physician's gender, and physician's age [29].
Freburger et al. [30] assessed the psychometric properties of the Trust in Physician
Scale and identified variables associated with patients’ trust in their rheumatologist.
Decreased trust was associated with older age. minority status. higher education, diagnosis of
fibromyalgia or osteoarthritis, and poorer health [30].

Comparison Validation Polish, Greece, Belarus Version of the Trust in Physician Scale
19
Conclusion
Anderson and Dedrick in the Polish, Greek and Bealurs version of the patient's
confidence scale fulfill all the criteria of psychometric, faceted and functional psychometric
equivalence, with the original version of The Trust In Physician Scale of 0.981. We found
significant differences in some questions between compared countries. Furthermore, we did
not find significant differences between countries in regard scale reliability. These validated
scales can be valuable sources of information on the quality of health care in the studied
countries.
References
1. Dobska M.. Dobski P.: TQM zarządzanie przez jakość w zakładach opieki medycznej.
Wyd. Zakład Poligraficzny MARS GRAF M.R. Sójka. Poznań. 2007.
2. Ciuruś M.J.: Zapobieganie zakażeniom w gabinetach zabiegowych. Jakość usług
medycznych. Poradnik praktyczny. Wyd. ADI. Łódź. 1998.
3. Domalski J.: Zarządzanie jakością w szpitalu. Antidotum. 1998, 8, 56-57.
4. Dobska M.. Dobski P.: Marketing usług zdrowotnych. Zakamycze, Kraków, 2002.
5. http://www.rynekzdrowia.pl/Polityka-zdrowotna/Polska-na-ostatnim-miejscu-w-ran
kingu-zaufania-do-lekarzy,146018,14.html (04.05.2018)
6. Skytt Ch.B.. Winther L.: Trust and local knowledge production: Interorganisational
collaborations in the Sønderborg region. Denmark. Geografisk Tidsskrift-Danish
Journal of Geography. 2011,111, 1, 27-41.
7. Krot K.: Koncepcja zaufania w relacji lekarz-pacjent w świetle badań jakościowych.
Polityki Europejskie. Finase i Marketing. 2013,10,59,381-393.
8. Smith M.L.: Building institutional trust through e-government trustworthiness cues.
Information Technology & People. 2010, 23, 3, 222-246.
9. van der Schee E.. Groenewegen P.P.. Friele R.D.: Public trust in health care: a
performance indicator? Journal of Health Organization and Management, 2006, 20,5,
468-476.
10. Meijboom B.. de Haan J.. Verheyen P.: Networks for integrated care provision: an
economic approach based on opportunism and trust. Health Policy, 2004, 69, 36.
11. Zucker l.G.: Production of trust: institutional sources of economic structure. Research
in Organizational Behaviour. 1986, 8, 53-111.
Comparison Validation Polish, Greece, Belarus Version of the Trust in Physician Scale
20
12. Cook C.. Kokoso-Lasaki O.. O’Brien R. Satisfaction with and perceived cultural
competency of health care providers: the minority experience. Journal of the National
Medical Association, 2005, 97,8, 1078–1087.
13. Anderson. L.A.. & Dedrick. R.F.:. Development of the trust in physician scale: A
measure to assess interpersonal trust in patient-physician relationships. Psychological
Reports, 1990, 67,1091-1100.
14. Brzyski P. Aspekty metodologiczne użycia skal. jako instrumentów pomiarowych w
badaniach epidemiologicznych. Przewodnik Lekarza. 2012. 69. 12. 1287-1292.
15. Drwal R. Adaptacja kwestionariuszy osobowości. Wydaw. Naukowe PWN.
Warszawa. 1995
16. Drwal R.: Problemy kulturowej adaptacji kwestionariuszy osobowości [w:] Kulturowa
adaptacja testów. Ciechanowicz A. red.. Polskie Towarzystwo Psychologiczne -
Wydział Psychologii Uniwersytetu Warszawskiego - Laboratorium Technik
Diagnostycznych im. Bohdana Zawadzkiego. Warszawa. 1990.115-138..
17. Weitzner MA. Meyers CA. Steinbruecker S. Saleeba AK. Sandifer SD.: Developing a
care giver quality-of-life instrument: preliminary steps. Cancer Practice, 1997, 5, 25-
31.
18. Rudawska I.: Rola profesjonalisty w kształtowaniu relacji z klientem. Przewodnik
Menedzera Zdrowia, 2001, 5, 20–22.
19. Miller M.. Supranowicz P.. Gębska-Kuczerowska A.. Car J.: Ocena poziomu
satysfakcji pacjentów jako element jakości pracy podstawowej opieki zdrowotnej.
Polski Merkuriusz Lekarski, 2007. 23I. 367 -370.
20. Emanuel E.. Emanuel I.: Four models of the physician – patient relationship. JAMA.
1992, 2221-2226.
21. Ishiwata R.. Sakai A.: The physician – patient relationship and medical ethics in
Japan. Cambridge Quarterly of Healthcare Ethics, 1994, 3, 60-66.
22. Teutsch C.: Patient – doctor communication. Medical Clinics of North America, 2003,
87, 1115-1145.
23. Synder L.: Online professionalism: social media. social contracts. trust. and medicine.
The Journal of Clinical Ethics, 2011, 22, 173-175.
24. Thomasma D.: Beyond medical paternalism and patient autonomy: a model of
physician conscience for the physician-patient relationship. Annals of Internal
Medicine,1983,98, 243.

Comparison Validation Polish, Greece, Belarus Version of the Trust in Physician Scale
21
25. Hollender M.H.. Szasz T.S.: A contribution to the philosophy of medicine, Archives
of Internal Medicine, 1956, 97, 585-592.
26. Zaufanie Polaków do lekarzy. pielęgniarek i farmaceutów niższe niż średnia
europejska. http://www.rynekzdrowia.pl/Polityka-zdrowotna/Zaufanie-Polakow-do-
lekarzy-pielegniarek-i-farmaceutow-nizsze-niz-srednia-europejska.119380.14.html
(04.05.2018).
27. Benker R.. Peters R.M.. Clark R.. Keves-Foster K: Effects of perceived racism.
cultural mistrust and trust in provides on satisfaction with care. Journal of the National
Medical Association, 2006, 98, 1532-1540.
28. Gilson L.: Trust and the development of health care as a social institution. Social
Science & Medicine, 2003,56,1453-1568
29. Baidya M. Gopichandran V. Kosalram K.: Patient-physician trust among adults of
rural Tamil Nadu: a community-based survey. The Journal of Postgraduate Medicine,
2014, 60,1, 21-26.
30. Freburger JK. Callahan LF. Currey SS. Anderson LA: Use of the Trust in Physician
Scale in Patients With Rheumatic Disease: Psychometric Properties and Correlates of
Trust in the Rheumatologist. Arthritis & Rheumatism (Arthritis Care & Research).
2003, 49, 1, 15, 51–58.

Comparison Validation Polish, Greece, Belarus Version of the Trust in Physician Scale
22
English version of the scale
Instructions:
Each item below is a statement with which you may agree or disagree. Beside each statement is a scale that ranges from strongly agree to
strongly disagree. For each item please circle the number that represents the extent to which you agree or disagree with the tatement. Please
make sure that you answer every item and that you circle only one number per item. It is important that you answer according to what you
actually believe and not according to how you feel you should believe or how you think we may want you to respond.
1 = Strongly Disagree
2 = Disagree
3 = Neutral (neither disagree or agree)
4 = Agree
5 = Strongly Agree
1. I doubt that my doctor really cares about me as a person. * 1 2 3 4 5
2. My doctor is usually considerate of my needs and puts them first. 1 2 3 4 5
3. I trust my doctor so much I always try to follow his/her advice. 1 2 3 4 5
4. If my doctor tells me something is so. then it must be true. 1 2 3 4 5
5. I sometimes distrust my doctor’s opinion and would like a second one.* 1 2 3 4 5
6. I trust my doctor’s judgments about my medical care. 1 2 3 4 5
7. I feel my doctor does not do everything he/she should for my medical care.* 1 2 3 4 5
8. I trust my doctor to put my medical needs above all other considerations when treating
my medical problems. 1 2 3 4 5
9. My doctor is a real expert in taking care of medical problems like mine. 1 2 3 4 5
10. I trust my doctor to tell me if a mistake was made about my treatment. 1 2 3 4 5
11. I sometimes worry that my doctor may not keep the information we discuss totally private.* 1 2 3 4 5
* NOTE. The TPS is scored by reverse scoring items 1. 5. 7. and 11 and summing all items for the total score. Higher scores reflect more of the
construct (trust).
Comparison Validation Polish, Greece, Belarus Version of the Trust in Physician Scale
23
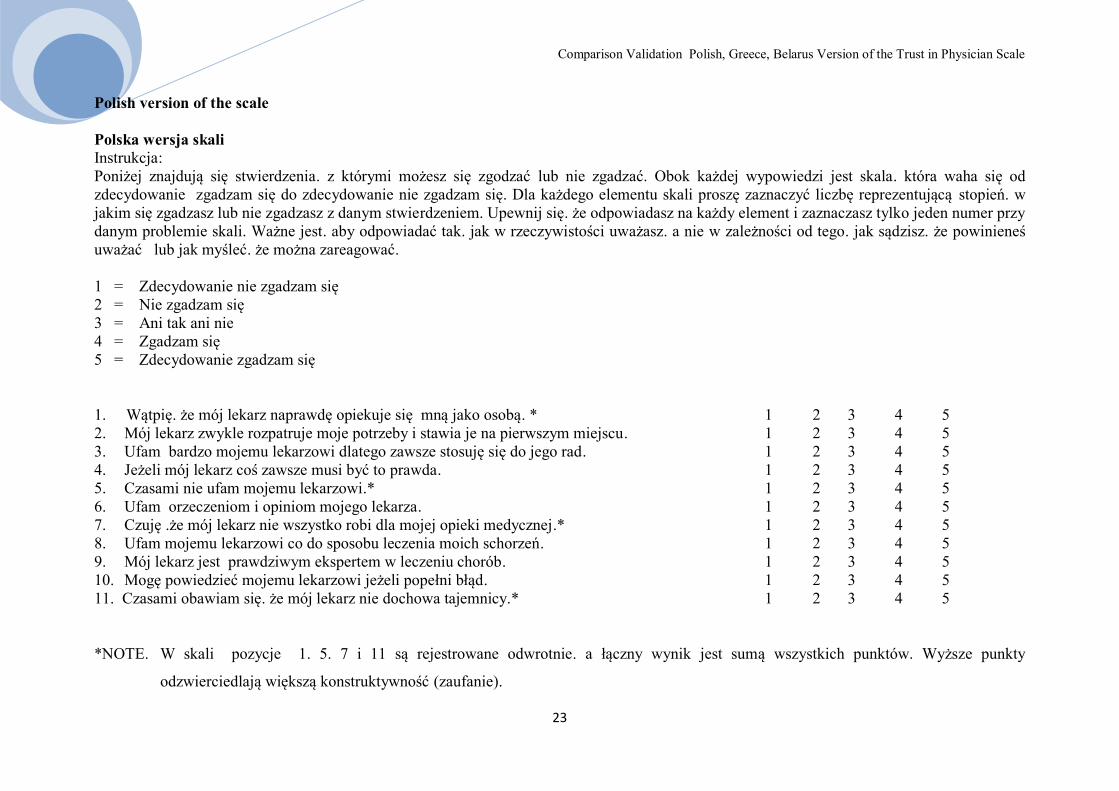
Polish version of the scale
Polska wersja skali
Instrukcja:
Poniżej znajdują się stwierdzenia. z którymi możesz się zgodzać lub nie zgadzać. Obok każdej wypowiedzi jest skala. która waha się od
zdecydowanie zgadzam się do zdecydowanie nie zgadzam się. Dla każdego elementu skali proszę zaznaczyć liczbę reprezentującą stopień. w
jakim się zgadzasz lub nie zgadzasz z danym stwierdzeniem. Upewnij się. że odpowiadasz na każdy element i zaznaczasz tylko jeden numer przy
danym problemie skali. Ważne jest. aby odpowiadać tak. jak w rzeczywistości uważasz. a nie w zależności od tego. jak sądzisz. że powinieneś
uważać lub jak myśleć. że można zareagować.
1 = Zdecydowanie nie zgadzam się
2 = Nie zgadzam się
3 = Ani tak ani nie
4 = Zgadzam się
5 = Zdecydowanie zgadzam się
1. Wątpię. że mój lekarz naprawdę opiekuje się mną jako osobą. * 1 2 3 4 5
2. Mój lekarz zwykle rozpatruje moje potrzeby i stawia je na pierwszym miejscu. 1 2 3 4 5
3. Ufam bardzo mojemu lekarzowi dlatego zawsze stosuję się do jego rad. 1 2 3 4 5
4. Jeżeli mój lekarz coś zawsze musi być to prawda. 1 2 3 4 5
5. Czasami nie ufam mojemu lekarzowi.* 1 2 3 4 5
6. Ufam orzeczeniom i opiniom mojego lekarza. 1 2 3 4 5
7. Czuję .że mój lekarz nie wszystko robi dla mojej opieki medycznej.* 1 2 3 4 5
8. Ufam mojemu lekarzowi co do sposobu leczenia moich schorzeń. 1 2 3 4 5
9. Mój lekarz jest prawdziwym ekspertem w leczeniu chorób. 1 2 3 4 5
10. Mogę powiedzieć mojemu lekarzowi jeżeli popełni błąd. 1 2 3 4 5
11. Czasami obawiam się. że mój lekarz nie dochowa tajemnicy.* 1 2 3 4 5
*NOTE. W skali pozycje 1. 5. 7 i 11 są rejestrowane odwrotnie. a łączny wynik jest sumą wszystkich punktów. Wyższe punkty
odzwierciedlają większą konstruktywność (zaufanie).

Comparison Validation Polish, Greece, Belarus Version of the Trust in Physician Scale
24
Greek version of the scale
Η κλίμακα της εμπιστοσύνης ως βάση της σχέσεις ασθενή- γιατρού του Aderson και Dedrick (1990)
Παρακαλώ απαντήστε στις ερωτήσεις που περιλαμβάνονται στο ερωτηματολόγιο με ένα "X" στα τετραγωνάκια ¨ ¨που βρίσκεται σε κάθε μία
από τις πιθανές απαντήσεις, ή πληκτρολογήστε τη σωστή απάντηση στο διάστικτο χώρο
Τα συνεχόμενα ψηφία σημαίνουν :
1 = διαφωνώ απόλυτα
2 = δεν συμφωνώ
3 = ούτε ναι ούτε όχι
4 = συμφωνώ
5 = συμφωνώ απόλυτα
1. Αμφιβάλλω αν ο γιατρός μου ,πραγματικά με φροντίζει ως άτομο * 1 2 3 4 5
2. Ο γιατρός μου , συνήθως εξετάζει τις ανάγκες μου και τα τοποθετεί στην πρώτη θέση. 1 2 3 4 5
3. Έχω μεγάλη εμπιστοσύνη στο γιατρό μου και πάντα προσαρμόζομαι στις συμβουλές του. 1 2 3 4 5
4. Αν ο γιατρός μου λέει πάντα κάτι θα πρέπει να είναι αλήθεια. 1 2 3 4 5
5. Μερικές φορές δεν εμπιστεύομαι το γιατρό μου* 1 2 3 4 5
6. Έχω εμπιστοσύνη, στην δήλωση και την άποψη του γιατρού μου 1 2 3 4 5
7. Αισθάνομαι ότι ο γιατρός μου δεν κάνει ότι πρέπει για μένα από την άποψη της ιατρικής περίθαλψης* 1 2 3 4 5
8. Εμπιστεύομαι το γιατρό μου για τη θεραπεία της ασθένειας μου 1 2 3 4 5
9. Ο γιατρός μου είναι ένας πραγματικός εμπειρογνώμονας για τις θεραπείες των ασθενειών 1 2 3 4 5
10. Αν ο γιατρός μου θα κάνει ένα λάθος, μπορεί να του το πω ότι το έκανε 1 2 3 4 5
11. Μερικές φορές φοβάμαι ότι ο γιατρός μου δε θα κρατήσει το απόρρητο μου* 1 2 3 4 5
*Σημείωση. Στην κλίμακα ,οι θέσεις 1.5.7 και 11 είναι καταγραμμένες ανάποδα ,μα το τελικό αποτέλεσμα είναι το άθροισμα όλων των
σημείων . Τα υψηλότερα σημεία αντικατοπτρίζουν την μεγαλύτερη εμπιστοσύνη

Comparison Validation Polish, Greece, Belarus Version of the Trust in Physician Scale
25
Russian version of the scale
Шкала доверия «пациент – врач» Аддерсона и Дедрика (1990)
1 = Я категорически не согласен
2 = Я не согласен
3 = ни «за», ни «против»
4 = Согласен
5 = Я полностью согласен
1. Я сомневаюсь, что мой врач действительно заботится обо мне как о человеке и личности * 1 2 3 4 5
2. Мой врач обычно относится к моим потребностям понимающе и ставит их первое место. 1 2 3 4 5
3. Я очень доверяю своему врачу, поэтому всегда придерживаюсь его советов. 1 2 3 4 5
4. Если мой врач что-то говорит, то это всегда правда. 1 2 3 4 5
5. Иногда я не доверяю своему доктору.* 1 2 3 4 5
6. Доверяю суждениям и мнению моего врача. 1 2 3 4 5
7. Я чувствую, что мой врач делает не все необходимое для оказания мне медицинской помощи.* 1 2 3 4 5
8. Я полностью доверяю своему врачу, что касается методики лечения меня. 1 2 3 4 5
9. Мой врач - настоящий специалист в лечении заболеваний. 1 2 3 4 5
10. Я могу подсказать моему врачу, если он допустит ошибку. 1 2 3 4 5
11. Иногда мне кажется, что мой врач что-то от меня скрывает.* 1 2 3 4 5
* Примечание. В шкале пункты 1, 5, 7 и 11 записаны в обратном порядке, а общий балл - это сумма всех пунктов. Более высокие результаты отражают большую конструктивность (доверие).

Burnout syndrome and job satisfaction among the female staff of Regional Hospital in Łomża
26
Burnout syndrome and job satisfaction among the female staff of Regional Hospital in
Łomża
Fiega Ewa1*
, Krajewska-Kułak Elżbieta2, Wysokiński Mariusz
3, Karczewski Jan
4, Chilińska
Joanna Zofia1, Tomaszewska Bożena
1
1. Department of Health Sciences, Łomża State University of Applied Sciences
2. Integrated Healthcare Facility, Medical University in Białystok
3. Basics of Nursing and Medical Didactics, Medical University in Lublin
4. Chair of Health, Public Health Facility, State University after Pope John Paul II in
Biała Podlaska
INTRODUCTION
Burnout syndrome occurs, above all, among professionals in areas that involve strong
engagement and commitment, the ones that are therefore connected with enormous
responsibility, arising from the necessity of taking care of others and having to deal with
complicated people’s problems [1]. It is a result of a long-term and/or repeated strain, which
is a result of intensive work for other people, connected with constant direct contact with
people and expectation of the high level of empathy and sacrifice for others [2]. Such
professionals include doctors, nurses, social workers, therapists, psychologists, teachers,
priests, sports coaches and prison staff [1, 2]. .
Freudenbergerg [cited after 1] believes burnout syndrome to be „exhaustion
syndrome”, that is a „slowly appearing or suddenly revealed state of physical, spiritual or
emotional exhaustion, that occurs in the workplace, in the time off work, in the circle of
friends, in relationship and family life, often linked to aggression and thoughts about an
escape”.
According to Shirom [3] burnout syndrome is „physical exhaustion, emotional fatigue
and cognitive weariness”.
Chermiss [4] however claims it to be a „three-step process of negative changes of
attitudes and behaviours, which appear as an answer to an effort, connected with work”.
According to Pines [cited after 5] burnout syndrome is a „state of physical,
emotional and mental exhaustion appearing by means of chronic fatigue, which is

Burnout syndrome and job satisfaction among the female staff of Regional Hospital in Łomża
27
accompanied by a negative attitude towards work, people and life, a sense of helplessness and
hopelessness of a situation as well as low self-esteem that manifests itself in a feeling of
personal inadequacy, incompetence and discouragement”.
Professional burnout syndrome, according to Tucholska [cited after 6], „develops as a
result of an interaction between the work environment (high demands, little influence, minor
support) and individual personality traits (biological susceptibility to stress combined with
building social relations skills and creation of a supportive environment with tolerance to
frustration and cognitive abilities”.
Maslach [7,8] reduces the symptoms of professional burnout to three key categories:
emotional exhaustion (helplessness, lack of energy, weakening, tiredness, irritation,
conflictuality), depersonalization (objectification of other people, cynicism, indifference,
routine, treating the patient as a yet another case, change of care to supervision, avoiding
contact) and lowered professional satisfaction, leading to perceiving oneself as an ineffective,
incompetent person, feeling lack of achievements and successes, the loss of sense of one’s
work.
The Aim of the research - assessment of life satisfaction and burnout syndrome
occurrence in the group of female staff of Regional Hospital in Łomża.
MATERIAL AND METHODOLOGY
The research was conducted upon receiving the permission of the Bioethics
Committee of the Medical University of Białystok (Resolution No R-I-002/473/2012) and the
Management of the Regional Hospital after Cardinal Stefan Wyszyński in Łomża.
The research concerned five deliberately chosen groups examined: I group – nurses –
350 people, II groups – midwives – 30 people, III group – other workers of medical segment –
80 people (a medical analyst, a pharmacist, a physiotherapy technician, a laboratory assistant,
a laboratory technician, a pharmacy technician, a masseur, an occupational therapy trainer, a
dietician, a speech therapist, an electro radiology technician, a dental hygienist, a
psychologist) and group IV – administration/physical workers - 150 people (a medical
statistician, a medical registrant, medical secretary, a messenger, a social worker, a ward
nurse, a dispenser, a sterilizer, an accountant, inspectors, referees, managers of a technical and
economic segment units, a warehouse operative, a health and safety specialist, an IT

Burnout syndrome and job satisfaction among the female staff of Regional Hospital in Łomża
28
specialist, a receptionist, a counter help and cashier, a cook, a laundress, a kitchen help, a
maintenance worker, a tailor, a needlewoman, an associate director).
The numerical amount in the respective groups depended on the amount of female
hospital employees at the moment of the research.
The same number of questionnaires was handed out and handed in for evaluation. The
number of the questionnaires corresponded to the numerical amount of the examined group.
Before the research itself, a pilot study was conducted in the group of 50 people, which
allowed to verify the clarity of statements in the proprietary questionnaire and its final
formulation.
The diagnostic survey method has been used, involving Standardized life satisfaction
scale (SWLS from Dinner) and Standardized Maslach Burnout Inventory, in the Polish
adaptation by Pasikowski.
SWLS scale includes five statements, which were evaluated by the person being tested
on a scale from 1-7, on how much it refers to his to date life, where 1 meant – strongly
disagree, and 7 – strongly agree [9]. The obtained ratings were summed up and the overall
result described the level of satisfaction with one’s life. The scope of results could be within 5
to 35 points, meaning that the higher the point, the more satisfied with life the person being
testes was: 5 – 9 points – the person definitely dissatisfied with their life, 10 – 14 points – the
person very dissatisfied with their life, 15 – 19 points – the person rather dissatisfied with
their life, 20 points – the person neither dissatisfied nor satisfied with their life, 21 – 25 points
– the person rather satisfied with their life, 26 – 30 points – the person very satisfied with
their life and 31 – 35 points – the person definitely satisfied with their life [9]. In the result
interpretation sten scores were used too and the results in the range of 1 – 4 sten are
considered low, whilst in the range of 7 – 10 sten as high, which corresponds to the area of
about 33% lowest results and the same amount of highest ones on the scale. The results in the
range of 5 and 6 sten are treated as average [9]. Reliability ratio (Cronbach’s alpha) SWLS,
determined in the study of 371 adult people amounts to 0, 81. Scale stability ratio, determined
in the two-time study of a group of 30 people at an interval of six weeks amounted to 0, 86
[9].
MBI - Maslach Burnout Inventory Ch. Maslach [10] consists of 22 statements, which
describe situations and the feelings that accompany them. Women, taking the test assessed, on
a scale from 0 to 6, how often the situations, listed in a particular statement concerned them,
where 0 meant never and 6 – every day. It allowed estimating the level of burnout in three
dimensions: emotional exhaustion (EEX), depersonalization (DEP) and the feeling of lack of
Burnout syndrome and job satisfaction among the female staff of Regional Hospital in Łomża
29
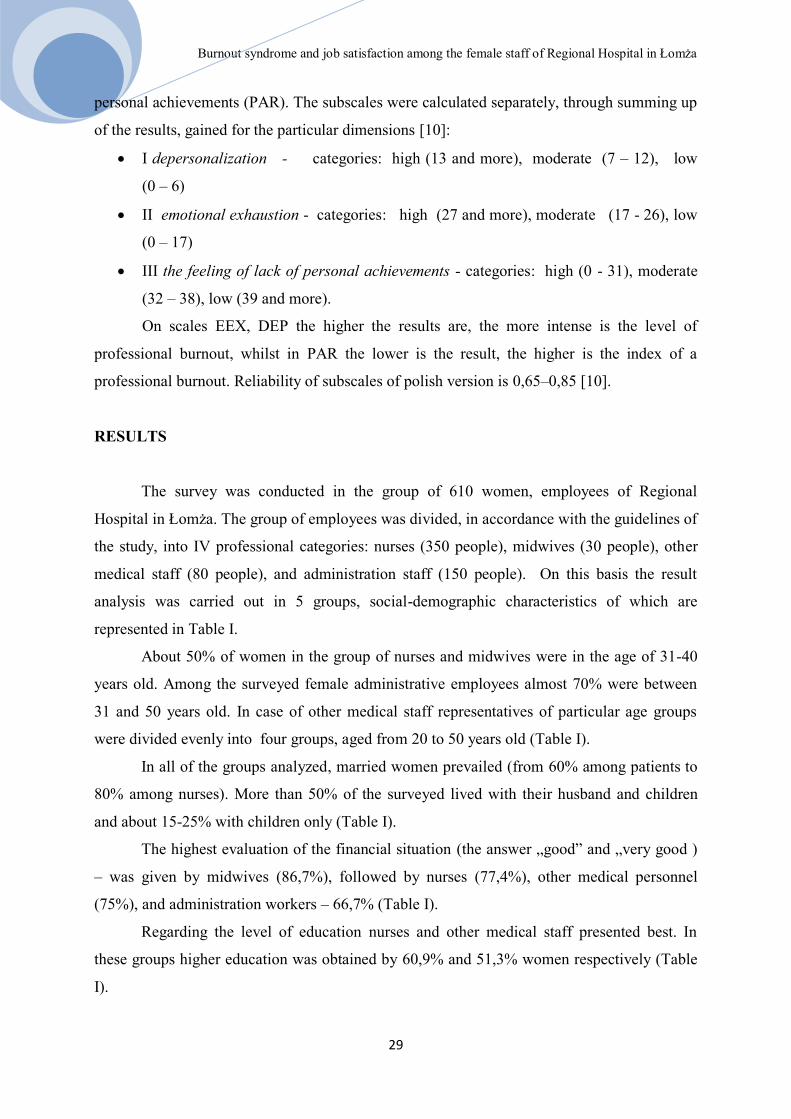
personal achievements (PAR). The subscales were calculated separately, through summing up
of the results, gained for the particular dimensions [10]:
I depersonalization - categories: high (13 and more), moderate (7 – 12), low
(0 – 6)
II emotional exhaustion - categories: high (27 and more), moderate (17 - 26), low
(0 – 17)
III the feeling of lack of personal achievements - categories: high (0 - 31), moderate
(32 – 38), low (39 and more).
On scales EEX, DEP the higher the results are, the more intense is the level of
professional burnout, whilst in PAR the lower is the result, the higher is the index of a
professional burnout. Reliability of subscales of polish version is 0,65–0,85 [10].
RESULTS
The survey was conducted in the group of 610 women, employees of Regional
Hospital in Łomża. The group of employees was divided, in accordance with the guidelines of
the study, into IV professional categories: nurses (350 people), midwives (30 people), other
medical staff (80 people), and administration staff (150 people). On this basis the result
analysis was carried out in 5 groups, social-demographic characteristics of which are
represented in Table I.
About 50% of women in the group of nurses and midwives were in the age of 31-40
years old. Among the surveyed female administrative employees almost 70% were between
31 and 50 years old. In case of other medical staff representatives of particular age groups
were divided evenly into four groups, aged from 20 to 50 years old (Table I).
In all of the groups analyzed, married women prevailed (from 60% among patients to
80% among nurses). More than 50% of the surveyed lived with their husband and children
and about 15-25% with children only (Table I).
The highest evaluation of the financial situation (the answer „good” and „very good )
– was given by midwives (86,7%), followed by nurses (77,4%), other medical personnel
(75%), and administration workers – 66,7% (Table I).
Regarding the level of education nurses and other medical staff presented best. In
these groups higher education was obtained by 60,9% and 51,3% women respectively (Table
I).

Burnout syndrome and job satisfaction among the female staff of Regional Hospital in Łomża
30
Table I. Socio-demographic characteristics of the respondents
Variable Nurses Midwives Other medical staff Administration
N % N % N % N %
TOTAL 350 100 30 100 80 100 150 100
Age
≤20 year 9 2.6 - - 21 26.25 9 6.00
20-30 year 82 23.4 6 20.00 18 22.50 29 19.33
31-40 year 161 46.00 16 53.33 23 28.75 53 35.33
41-50 year 94 26.9 8 26.67 18 22.50 52 34.67
51-60 year 4 1.2 - - - - 7 4.67
61-70 year - - - - - - - -
>70 year - - - - - - - -
Marital status
Single 22 6.3 6 20 23 28.8 23 15.3
Married 286 81.7 21 70 51 63.8 96 64
Widow 19 5.4 3 10 2 2.5 11 7.3
Divorced 20 5.7 - - 4 5 19 12.7
Separated 3 0.9 - - - - 1 0.7
Place of residence
Country 56 16 4 13.3 9 11.3 23 15.3
City 294 84 26 86.7 71 88.8 127 84.7
Who lives with
Alone 20 5.7 7 23.3 15 18.8 19 12.7
Husband only 57 15.3 6 20 10 12.5 22 14.7
Husband and children 224 64 15 50 40 50 76 50.7
Children only 39 11.1 2 6.7 4 5 26 17.3
Other 10 2.9 - - 11 13.8 7 4.7
Financial status
Very low 6 1.7 1 3.33 2 2.5 6 4
Low 12 3.4 - - 3 3.8 10 6.7
Average 61 17.4 3 10 15 18.8 34 22.7
Good 198 56.6 24 80 40 50 65 43.3
Very good 73 20.9 2 6.7 20 25 35 23.3
Education
Vocational 2 0.6 - - 1 1.3 34 22, 7
Middle 135 38,6 20 66,7 38 47,5 83 55,3
bachelor degree 106 30,3 1 3,3 13 16,3 6 40
Higher 107 30,6 9 30 28 35 27 18,00
Professional experience of the staff surveyed was high – only one respondent in four
has been working for less than 15 years. The biggest group constituted women with working
experience of at least 20 years, including 21 – 30 years – 35,24% and more than 30 years –
24,59%, which in total made up 59,83% of the surveyed. In particular professional groups the
longest work experience was stated among midwives and nurses, where more than 15-year
work experience was observed in 90% and 81,43% respectively. In the surveyed group of
female employees the shortest work experience was found among other medical staff, where
46,25% of the surveyed have been working in the given profession for not more than 15
years, whereas among administration workers it amounted to 32% (Table II).

Burnout syndrome and job satisfaction among the female staff of Regional Hospital in Łomża
31
Table II. Professional experience of the respondents
Training
Total
Nurses
Midwives
Other medical staff
Administration
N % N % N % N % N %
1-5 years 42 6.9 14 4 0 0 17 21.3 11 7.3
6-10 years 47 7.7 19 5.4 1 3.3 12 15 15 10
11-15 years 64 10.5 32 9.1 2 6.7 8 10 22 14.7
16-20 years 92 15.1 59 16.9 10 33.3 6 7.5 17 11.3
21-30 years 215 35.3 137 39.1 13 43.3 28 35 37 24.7
> 30 years 150 24.6 89 25.4 4 13.3 9 11.3 48 32
Among the females surveyed, an analysis of life satisfaction level was conducted, using
the standardized SWLS after Dinner scale. The average obtained allowed to classify
respondents to category of people „rather satisfied with their lives” (level V). In case of
females from the group „other medical staff”, none of the surveyed obtained the maximum
amount of points (Table III).
Table III. General results of SWLS scale
Group Average
(±SD)
Minimum Lower
quartile
Median Upper
quartile
Maximum
Nurses 22.1 (±5.3) 5 19 22 25 35
Midwives 22.9 (±6.7) 12 18 21 28 35
Other medical
staff
22.1 (±5.8) 5 19 23 27 32
Administration 22.2 (±6.03) 5 19 23 27 35
Level V of SWLS scale „people rather satisfied with their lives” was obtained by
about 40% of nurses, 30% of midwives, 18,8% of other medical staff and 28,7% of
administration workers. The biggest number of women dissatisfied with their lives to a
varying degree (level 1 to 3) was observed among midwives and other medical staff: 36,7%
and 36,3% respectively. The neutral status – level 4 – “the person neither satisfied nor
dissatisfied with their life” reached from 3,3% in midwives’ group to 9,1% in the group of
nurses. The positive attitude to their lives – level VI and VII concerned 37,5% of the group of
other medical staff, 32% of the group of administration female employees, 30% midwives
and 24% nurses. Figure 1 features the details.
It was stated, that the level of life satisfaction of females surveyed, statistically
significantly depended on their affiliation to one of the analyzed groups - p=0,023; r(X, Y) -
p=0,075; r2 = 0,006; t=2,277.

Burnout syndrome and job satisfaction among the female staff of Regional Hospital in Łomża
32
Figure 1. Levels of SWLS scale
An everyday mental tiredness was felt by 22,5% of other medical staff, 18% of female
administration employees as well as 19,4% of nurses and 16,7% midwives. Sometimes it
concerned 50% of other medical staff, 46,8% of midwives, 44% nurses and 43% of female
administration employees. Couple times a month such feeling had 15,4% of nurses, 13,3% of
midwives and female administration employees as well as 11,3% other medical staff. Once a
week it concerned 10,7% administration employees, 10,6% of nurses, 10% of midwives and
5% of other medical staff. 24% of female administration employees, 13,3% midwives, 11,3%
other medical staff and 10,6% nurses never felt mental tiredness.
Everyday stress was felt by 19,7% nurses, 18,8% other medical staff, 16,7% female
administration workers and 10% of midwives. Sometimes stress concerned 56,3% other
medical staff, 44% nurses, 40% midwives and 38% female administration employees. Couple
times a month it was a problem for 14,3% nurses, 13,3% midwives, 10% female
1,71%
0,00%
2,50%
3,33%
6,86%
6,67%
7,50%
9,33%
18,29%
30,00%
26,25%
20,67%
9,14%
3,33%
7,50%
6,00%
40,00%
30,00%
18,75%
28,67%
19,14%
10,00%
35,00%
27,33%
4,86%
20,00%
2,50%
4,67%
0% 10% 20% 30% 40% 50%
Nu
rses
M
idw
ives
O
ther
med
ical
sta
ff
Ad
min
istr
atio
n
7 level 6 level 5 level 4 level 3 level 2 level 1 level
Burnout syndrome and job satisfaction among the female staff of Regional Hospital in Łomża
33
administration personnel and 7,5% other medical staff, whereas once a week - 13,3%
midwives, 8,3% nurses, 5,3% female administration staff and 2,5% of other medical staff.
According to 30% of female administration employees, 23,3% midwives, 15% other medical
staff and 13,7% nurses, they never felt stressed.
In the research MBI - Maslach Burnout Inventory by Maslach was used as well.
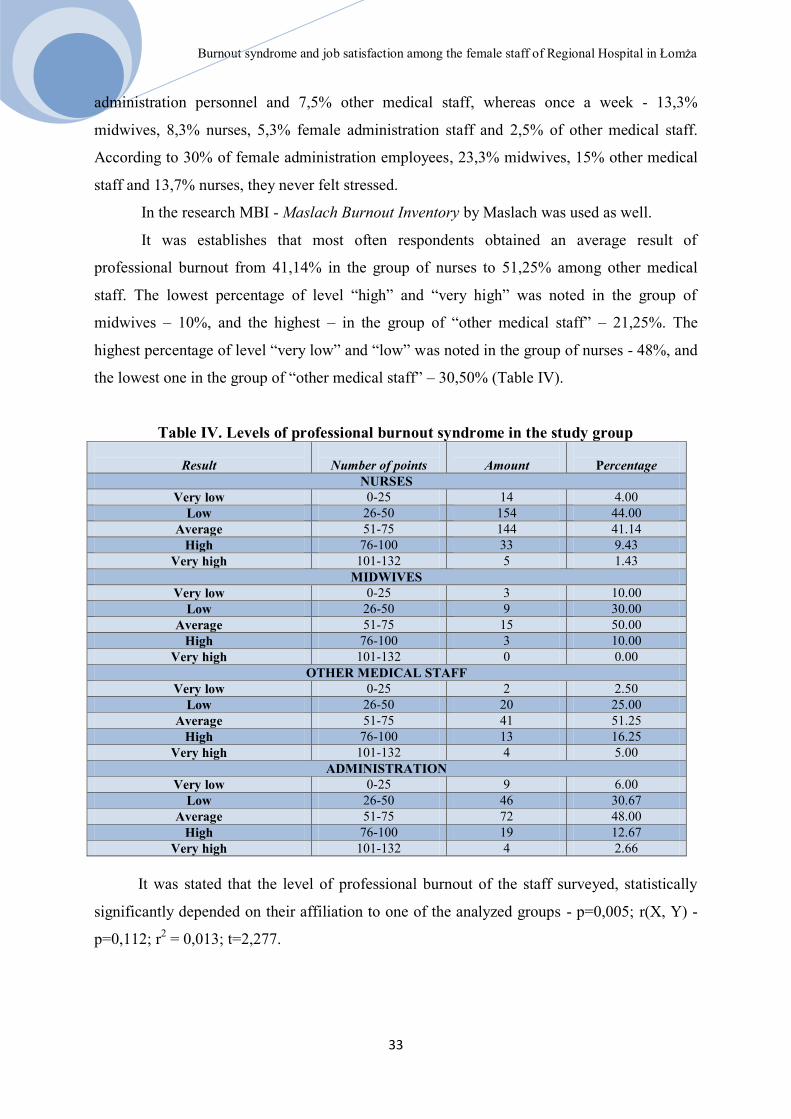
It was establishes that most often respondents obtained an average result of
professional burnout from 41,14% in the group of nurses to 51,25% among other medical
staff. The lowest percentage of level “high” and “very high” was noted in the group of
midwives – 10%, and the highest – in the group of “other medical staff” – 21,25%. The
highest percentage of level “very low” and “low” was noted in the group of nurses - 48%, and
the lowest one in the group of “other medical staff” – 30,50% (Table IV).
Table IV. Levels of professional burnout syndrome in the study group
Result
Number of points
Amount
Percentage
NURSES
Very low 0-25 14 4.00
Low 26-50 154 44.00
Average 51-75 144 41.14
High 76-100 33 9.43
Very high 101-132 5 1.43
MIDWIVES
Very low 0-25 3 10.00
Low 26-50 9 30.00
Average 51-75 15 50.00
High 76-100 3 10.00
Very high 101-132 0 0.00
OTHER MEDICAL STAFF
Very low 0-25 2 2.50
Low 26-50 20 25.00
Average 51-75 41 51.25
High 76-100 13 16.25
Very high 101-132 4 5.00
ADMINISTRATION
Very low 0-25 9 6.00
Low 26-50 46 30.67
Average 51-75 72 48.00
High 76-100 19 12.67
Very high 101-132 4 2.66
It was stated that the level of professional burnout of the staff surveyed, statistically
significantly depended on their affiliation to one of the analyzed groups - p=0,005; r(X, Y) -
p=0,112; r2 = 0,013; t=2,277.

Burnout syndrome and job satisfaction among the female staff of Regional Hospital in Łomża
34
Among the personnel surveyed a high level of emotional exhaustion was received for
about 50% of nurses and midwives, where for the group of other medical staff it was twice
lower – 26, 25% and among administration – 42% (Table V).
Table V. Emotional burnout among the staff Result Number of points Amount Percentage
NURSES
High 27 i więcej 170 48.57
Moderate 17-26 93 26.57
Low 0-16 87 24.86
MIDWIVES
Ligh 27 i więcej 15 50.00
Moderate 17-26 10 33.33
Low 0-16 5 16.67
OTHER MEDICAL STAFF
Ligh 27 i więcej 21 26.25
Moderate 17-26 27 33.75
Low 0-16 32 40.00
ADMINISTRATION
Ligh 27 i więcej 63 42.00
Moderate 17-26 37 24.67
Low 0-16 50 33.33
It was stated that the level of emotional exhaustion of the staff surveyed, statistically
significantly depended on their affiliation to one of the analyzed groups - p=0,007; r(X, Y) -
p=0,110; r2 = 0,012; t=2,716.
Among the female employees surveyed a high level of depersonalization was stated in
70% of midwives; 63,71% nurses; 54% female administration workers and 43,75% for other
medical staff. The highest percentage of low level was found among female administration
employees– 20% and other medical personnel – 22,50% (Table VI).
It was stated that the level of depersonalization of the staff surveyed, statistically
significantly depended on their affiliation to one of the analyzed groups - p=0,002; r(X,Y) -
p=0,126; r2 = 0,016; t=3,134.
In the case of 60-70% of the personnel surveyed, a low level of feeling of lack of
personal achievement was obtained, where high level added up to 13-17% in each of the
groups (Table VII).
No statistically significant relationship was stated between feeling of lack of personal
achievement and affiliation to one of the analyzed groups - p=0,909; r(X, Y) - p=0,005; r2 =
0,000; t=0,114.

Burnout syndrome and job satisfaction among the female staff of Regional Hospital in Łomża
35
Table VI. Depersonalization among the staff Result Number of points Amount Percentage
NURSES
High 13 i więcej 233 63.71
Moderate 7-12 84 24.00
Low 0-6 43 12.29
MIDWIVES
High 13 i więcej 21 70.00
Moderate 7-12 7 23.33
Low 0-6 2 6.67
OTHER MEDICAL STAFF
High 13 i więcej 35 43.75
Moderate 7-12 27 33.75
Low 0-6 18 22.50
ADMINISTRATION
High 13 i więcej 81 54.00
Moderate 7-12 39 26.00
Low 0-6 30 20.00
Table VII. Feeling of lack of personal achievements
Wynik/ Result Zakres punktów/
Number of points
Liczność/
Amount
Procent/
Percentage
NURSES
High 0-31 57 16.29
Moderate 32-38 56 16.00
Low 39 i więcej 237 67.71
MIDWIVES
High 0-31 5 16.67
Moderate 32-38 8 26.67
Low 39 i więcej 17 56.66
OTHER MEDICAL STAFF
High 0-31 13 16.25
Moderate 32-38 16 20.00
Low 39 i więcej 51 63.75
ADMINISTRATION
High 0-31 20 13.33
Moderate 32-38 30 20.00
Low 39 i więcej 100 66.67
Correlations between the level of professional burnout and the level of life satisfaction
were studied as well and no statistically significant relationships were stated (p>0,05) (Table
VIII).
Table VIII. Analysis of a correlation between the level of professional burnout and the
level of life satisfaction according to SWLS scale Group r(X,Y) r
2 t p
Nurses 0.015 0.000 0.276 0.783
Midwives 0.032 0.001 0.168 0.868
Other medical staff -0.199 0.040 -1.79 0.077
Administration -0.101 0.010 -1.23 0.220

Burnout syndrome and job satisfaction among the female staff of Regional Hospital in Łomża
36
Discussion
In the subject literature [11,12,13] the influence of stress on health is emphasized. It is
often defined as strain or pressure, tension. It is a reaction to a stimulus, coming from the
external environment [14]. Functioning of a person in conditions of big tension and stress
exposes them to health loss and often entails unhealthy behaviour such as alcohol or sedatives
abuse. A long-term influence of stress in the workplace can lead to employee’s professional
burnout [11].
Professional burnout in socio-cognitive approach cited after Sęk [15] „is a set of
symptoms, appearing among people, who carry out jobs, where close interpersonal contact,
being committed and having traits of a professional are the key tools of work actions deciding
about the level of job performance, successes and professional failures”.
Burisch, after Fengler [2], singles out several stages of professional burnout
development, which do not necessarily happen one after another: warning symptoms of an
initial phase (reduced engagement towards patients, their families, colleagues, greater claims),
emotional reactions, feeling of guilt (depression, aggression), disintegration, marginalization,
psychosomatic reactions and doubt. A return to an earlier phase from a later stage is also
possible [2].
In a professional work of a nurse, professional burnout syndrome can be evident
through: loss of feelings and interest in patients, indifference to their emotional states,
neglecting work and even excessive reactions to weak stimuli [2].
Cronin-Stubbs et al. [cited after 2] were conducting research in the group of 296
nurses and proved that professional burnout syndrome was correlated with an increased
incidence of taking sedative substances, striving to reduce the number of hours of direct
contact with patients, feeling of lack of social support and adverse organization of the
workplace.
In turn Constable et al. [cited after 2] analyzed the traits of professional burnout
syndrome with 310 nurses and stated correlation with their low professional independence,
time pressure and lack of support from supervisors.
Kurowska and Witkowska [16] in the group of 109 nurses, working in treatment,
pediatric units and medical clinic Oncology Centre in Bydgoszcz stated moderate tendency to
professional burnout, while escalation of this phenomenon was determined by the type of
work performed as well. Clinic nurses, standing out in the highest average age, felt most
professionally burnt out. The smallest number of burnout symptoms was shown by nurses in
Burnout syndrome and job satisfaction among the female staff of Regional Hospital in Łomża
37
pediatric units, whose average age is similar and employment history in the hospital shortest
[16].
Ramuszewicz et al. [17] covered 80 assistant nurses and the same number of
anaesthesiology nurses from Białystok hospitals and stated that in self-assessment the nurses
of both groups claimed not to be „professionally burnt out”, but objectively majority of them
showed numerous physical and mental symptoms, characteristic for the syndrome. Work
experience and family situation didn’t have influence on their level of professional burnout,
whereas work had a big impact on their private life [17].
In the literature treatment and pediatric as well as psychiatric and oncological nurses
are the ones believed to be most exposed to professional burnout. [18,19,20].
Olley [21], in own studies on 104 nurses, 83 doctors, 21 pharmacists, 10 social
workers and 42 nurse assistants, confirmed that burnout syndrome, compared to other
professional spheres, appears among nurses on a largest scale.
Professional burnout is always a body’s answer to a stressful situation. In research by
Uchmanowicz et al. [22] 51 nurses, working in a clinical hospital were examined in order to
define the existance of factors, having impact on professional burnout emergence. Among the
examined ones 56% of nurses reported the excess of responsibilities and insufficient number
of staff members, 64% complained about a too high work speed and 62% were dissatisfied
with the flow of information. Such feelings among the staff indicate growing professional
burnout. Stress felt in the workplace was confirmed by 64% of the surveyed. skarżyło się na
zbyt duże tempo pracy, z przepływu informacji niezadowolonych było 62%. [22].
In the research by Święcka i Starun [23] nurses also complained about high emotional
tension (78%), the need of taking quick decisions (73%), low salaries (38,88%), insufficient
number of staff members (40,7%) and excess of responsibilities (18,20%) [23].
In the research by Lewnadowska and Litwin [24] 39% of the nurses surveyed saw
themselves as professionally burnt out and 35% felt under the threat of that phenomenon.
Among the nurses surveyed, the most frequent symptoms of a professional burnout were
tiredness and exhaustion (79%), back pain (57%), headaches (32%) and persisting emotional
tension (38%) [24].
In own study, evaluating professional burnout of the staff an average rate of such was
obtained. High level of professional exhaustion was observed among nurses and midwives
50%. High level of depersonalization was noted when it comes to midwives 70%, nurses
63,71%. 60-70 % of staff has low level of feeling of lack of personal achievement.
Burnout syndrome and job satisfaction among the female staff of Regional Hospital in Łomża
38
However, in the study by Kurowska and Zaza-Witkowska [16], the nurses examined
obtained a high level of feeling of lack of personal achievement (30,44) and as a whole group
obtained a low level of depersonalization (6,25) and the moderate result of the emotional
exhaustion feeling [16].
Satisfaction from the work performed and the possibility of helping other people has
an impact on professional burnout development [25].
Rasińska and Nowakowska [26] assessing life satisfaction feeling among nurses with
the help of SWLS scale stated, that they have a bit higher level of life satisfaction than the
standardization polish group and lower than American one.
In the current study positive attitude towards own life concerned 37,5% from the
group of other medical staff, 32% from the group of administration workers, 30% midwives
and 24% nurses. The biggest number of women dissatisfied with their life could be found
among midwives (36,7%) and other medical staff (36,3%).
Fengler [2] highlights that nurses, in connection with the type of work performed
(extremely exhausting physically and mentally), as they are exposed to frequent contact with
factors leading to syndrome of chronic fatigue. Moreover, conditions and demands of their
work (high pressure, shift work, lack of job satisfaction, low salaries, and responsibility for
life of a patient) contribute to nurses’ “burnout”. Every day a nurse gets to know intimate
emotional, social and physical problems of those she has to give support to. Constant
experience of illness and death, fast feeling of hope and then helplessness together with
continuous care for others, is an extremely stressful experience. [2].
Abovementioned observations found proof in the current study. Everyday feeling of
mental tiredness concerned 22,5% of other medical staff, 18% of administration workers and
19,4% nurses and 16,7% midwives. Every day stress was felt by 19,7% nurses, 18,8% of
other medical staff, 16,7% female administration workers and 10% of midwives.
Lambert et al. [27], Gillespie and Kermonde [28] as well as Greenglass and Burke [29]
pay attention to these factors.
Conclusions
1. The highest level of life satisfaction was experienced by nurses and the least one by
midwives and other medical staff.
2. Among the staff an average rate of professional burnout was found, whereby
emotional exhaustion was highest among nurses, midwives and administration.
Burnout syndrome and job satisfaction among the female staff of Regional Hospital in Łomża
39
3. The level of life satisfaction, professional burnout, emotional exhaustion,
depersonalization of the staff surveyed significantly statistically depended on
affiliation to one of the groups.
4. No statistically significant correlations were found between the feeling of lack of
personal achievement and affiliation to one of the groups analyzed.
References
1. Kaptacz A.: Syndrom wypalonych sił. Magazyn Pielęgniarki i Położnej, 1999, 4,7-9.
2. Fengler J.: Helfen macht Müde. Pietruszewski K (przeład) Pomaganie męczy
wypalenie w pracy zawodowej. Gdańskie Wydawnictwo Psychologiczne, 2000.
3. Shirom A.: Burnout in Organizations” (w:) Cooper C., Robertson M. (red.)
International Review of Industrial and Organizational Psychology. John Wiley and
Sons, New York, 1989.
4. Cherniss C.: Professional Burn-out in Human Service Organization, Praeger, New
York, 1980.
5. Sapilak B.J, Steciwko A.: Wypalenie zawodowe – predyspozycje, objawy,
przeciwdziałanie. Polska Medycyna Rodzinna, 2002, 4, 337-341.
6. Kowalczuk K., Krajewska – Kułak E., Ostapowicz-Van Damme K.: Narażenie na
czynniki niebezpieczne i szkodliwe w pracy pielęgniarek i położnych, Problemy
Pielęgniarstwa, 2010, 18, 353-357.
7. Maslach C., Schanfeli W.B., Leiter M.P.: Job Burnout. Annual Review of Psychology,
2001, 52, 397-422.
8. Maslach Ch.: Burnout-the Cost of Caring, Englewood Cliffs, Prentice Hall, New York,
1982.
9. Juczyński Z: Narzędzia pomiaru w promocji i psychologii zdrowia. Wyd. Pracownia
Testów Psychologicznych, Warszawa, 2009.
10. Pasikowski T.: Polska adaptacja kwestionariusza Maslach Burnout Inventory. [w:]
Wypalenie zawodowe. Przyczyny. Mechanizmy. Zapobieganie. Sęk H. (red.), Wyd.
PWN, Warszawa, 2000, 13-31, 135-148.
11. Sygit-Kowalska E.: Radzenie sobie ze stresem jako zachowanie zdrowotne człowieka-
perspektywa psychologiczna. Hygeia Public Health, 2014, 49,2, 202-208.
12. Sęk H.: Wypalenie zawodowe. Przyczyny i zapobieganie. Wyd. Naukowe PWN,
2004, 85-103.
13. Wrońska- Polańska H.: Zdrowie i jego psychobiologiczne mechanizmy. [w:]
Burnout syndrome and job satisfaction among the female staff of Regional Hospital in Łomża
40
Wrońska- Polańska H. (red.), Zdrowie – stres – choroba. Impuls, Kraków 2008, 17-36.
14. Moryś J., Jeżowska M.: Problematyka stresu. Hoslistyczne, społeczne i medyczne
aspekty problematyki stresu. [w:] Borys B., Majkowicz M. (red.), Psychologia w
medycynie. Akademia Medyczna, Gdańsk 2006, 67-79.
15. Sęk H.: Wypalenie zawodowe. Przyczyny i zapobieganie. Wyd. Naukowe PWN,
2004,85-103
16. Kurowska K., Witkowska A.Z.: Empatia a wypalenie zawodowe u pielęgniarek
onkologicznych, Nowiny Lekarskie, 2011, 80, 277-282.
17. Ramuszewicz M., Krajewska-Kułak E., Rolka H., Łukaszuk C.: Próba oceny wiedzy
na temat zespołu wypalenia zawodowego wśród pielęgniarek bloku operacyjnego,
Pielęg. XXI w., 2004, 3, 8, 25-30
18. Andruszewicz A., Typy zachowań i przeżyć w pracy w grupie pielęgniarek, Problemy
Pielęgnairstwa, 2007, 15, 157-161.
19. Beltrami E.M., Alvarado-Ramy F., Critchley S.E., Panlilio A.L., Cardo D.M., Bower
W.A., Alter M.J., Kaplan J.E., Lushniak B.: Updated U.S. Public Health Service
Guidelines for the Management of Occupational Exposures to HBV, HCV, and HIV
and Recommendations for Postexposure Prophylaxis. Morbidity and Mortality Weekly
Report (MMWR), 2001, 0,RR-11,1-52.
20. Beisert M.: Przejawy, mechanizmy i przyczyny wypalenia się pielęgniarek [w:]
Wypalenie zawodowe. Przyczyny, mechanizmy, zapobieganie, Sęk H. (red.). Wyd.
Naukowe PWN, Warszawa, 2000, 182–215.
21. Olley BO: A comparative study of burnout syndrome among health professionals in a
Nigerian teaching hospital. African Journal of Medicine and Medical Sciences, 2003,
32, 297-302.
22. Uchmanowicz I., Jankowska – Polańska B., Bronowicka G.: Zjawisko wypalenia
zawodowego wśród pielęgniarek pracujących na oddziałach onkologicznych- badanie
wstępne. Problemy Pielęgniarstwa, 2013, 21,44, 476-783.
23. Święcka M., Starun J.: Stres a zespół wypalenia zawodowego wśród personelu
pielęgniarskiego. Problemy Pielęgniarstwa, 2005, 1-2, 47-55.
24. Lewandowska A., Litwin B.: Wypalenie zawodowe jako zagrożenie w pracy
pielęgniarki. Annales Academiae Medicae Stetinensis, 2009, 55,3,86-89.
25. Braczkowska B., Kowalska M., Beniowski M., Zejda J.E., Mazur W., Witor A.:
Zawodowa ekspozycja pracowników służb medycznych na wirus HIV
w województwie śląskim. Medycyna Pracy, 2010,61,315-322.

Burnout syndrome and job satisfaction among the female staff of Regional Hospital in Łomża
41
26. Rasińska R., Nowakowska I.: Zachowania zdrowotne położnych a poczucie
satysfakcji z życia. Zdrowie i Dobrostan, 2013,1, 179-191.
27. Lambert V.A.: Workplace stressors, ways of coping and dermografhic charakcteristics
as predictors of physical and mental health of Japanese hospital nurses, The
International Journal of Nursing Studies, 2004; 41, 85-97.
28. Gillespie B.M., Kermode S.: How do perioperative nurses cope with stress?
Contemporary Nurse, 2003, 16, 20-29.
29. Greenglass E.R., Burke R.J.: Hospital restructuring and burnout, The Journal of
Health and Human Services Administration, 2002, 25, 89-114.
Results of surgical treatment of aortic coarctation in children: comparison of different materials
42
Results of surgical treatment of aortic coarctation in children: comparison of different
materials
Czerżyńska Magdalena*, Wójcik Elżbieta, Mroczek Tomasz, Skalski Janusz H.
Department of Pediatrics Cardiac Surgery, Collegium Medicum, Jagiellonian University,
Krakow
Central Message
Recurrent recoarctation most often occurs in children operated as an neonates. No
connection was found between the formation of a recoarctation and the type of used surgical
material.
Perspective Statement
Further analysis of biggest group of patients with coarctation of the aorta who was
operated using different types of the material is needed.
Background
Coarctation of the aorta (CoA), also known as aortic isthmus narrowing, accounts for
5-7% of congenital heart defects [1]. CoA may be an isolated defect or it may coexist with
other heart defects, i.e. bicuspid aortic valve, ventricular septal defect, patent ductus
arteriosus, transposition of the great arteries, and hypoplastic left heart syndrome [2].
Currently, the method of choice in the treatment of CoA in neonates and infants is
surgery.
Medical treatment with the use of intervention methods, i.e. balloon angioplasty and/or
implantation of a stent into a narrowed aortic isthmus, can be performed on some of the older
children and in cases of recoarctation (re-CoA). Surgical treatment is also used in patients
with the coarctation syndrome and in cases where CoA is accompanied by comorbid defects
requiring surgical treatment [3, 4].
The type of surgical method used to treat CoA depends on the type, location, and
morphology of the defect. One of these methods is patch angioplasty [5]. Many paediatric

Results of surgical treatment of aortic coarctation in children: comparison of different materials
43
cardiac surgery centres prefer the technique of excision of the narrowed segment with
performance of end-to-end anastomosis. However, this method is not always applicable [5].
Currently, many cardiac surgery procedures (such as reconstruction and angioplasty)
may use different biomaterials, i.e. bovine pericardium patches or a new type of bioscaffold
material [6]. There are few publications evaluating and comparing the effectiveness of cardiac
surgery treatment depending on the used material.
Aim of the study
The aim of this study is to evaluate the results of surgical treatment of aortic
coarctation in neonates and infants depending on the material used for surgical repair (a new
type of bioscaffold, synthetic patch, or human homograft).
We propose the hypothesis that development of re-CoA in children does not depend
on the type of material used for primary surgical repair of the defect.
Material and methods
This study evaluated retrospectively the treatment results of 28 children who were
operated for CoA between September 2015 and January 2017. Three patients were eventually
excluded from the study group (two patients did not report for follow-up evaluations and one
child received hybrid treatment with stent implantation). The mean age of the children
operated for CoA was 314 days (in the range from 4 days of life to 13 years of age), including
17 neonates. Additional heart defects were diagnosed in 12 (48%) of children. The patients
(n=25) were divided into three subgroups according to the material used for surgical repair: a
new type of bioscaffold – the newbio group (n=11–44%), a polytetrafluoroethylene (PTFE)
patch – the PTFE group (n=7–28%), and an autologous pulmonary homograft – the homograft
group (n=7–28%).
All patients underwent echocardiography to assess cardiac anatomy
(exclusion/confirmation of additional defects) and morphology of the aortic arch and isthmus.
All subject examined with Doppler echocardiography were evaluated with respect to the flow
character and peak gradient in the aortic isthmus (the gradient was also assessed in relation to
the arterial blood pressure of the patient from non-invasive measurement). In addition,
assessment of the condition of the patient took into account the clinical status as well as

Results of surgical treatment of aortic coarctation in children: comparison of different materials
44
postoperative course and complications. During follow-up visits, the children were examined
physically and echocardiographically. Subsequent visits took place at 1, 3, 6, 9, and 12
months after surgery. All tests were performed by the same echocardiographer using the same
Philips EPIQ 7 ultrasound machine with an 8 MHz sector transducer.
Recoarctation (re-CoA) was diagnosed when Doppler ultrasound examination showed
a peak gradient in the isthmus of over 60 mmHg; the clinical status of the patient was also
assessed (breathing difficulties, increased fatigability, and feeding difficulties).
Results
In five children (20%), recoarctation developed within four to six months after
surgery. All cases of re-CoA occurred in children undergoing surgery at neonatal age – the
mean age at surgery was 8 days of life, with the mean body weight of 3,000 g (1,900–6,000
g). Three out of five children diagnosed with re-CoA underwent primary surgical repair with
the use of a new type of bioscaffold, while the other two underwent CoA angioplasty with the
use of a PTFE patch. Among five children with re-CoA, two had the comorbid bicuspid aortic
valve, one had aortic stenosis, and one child was born prematurely at 34 weeks with the body
weight of 1,900g. No correlation was found between the used surgical material and the re-
CoA occurrence.
The testing results are presented for of the entire group of studied children (n=25).
Follow-up outcome 25 of patients after CoA operation and for the group of children with re-
CoA (n=5) Re-CoA patients’ characterization.
Doppler echocardiography of patients with re-CoA showed a peak gradient of 60
mmHg (in the range 38–80 mmHg). Assessment of the gradient also included blood pressure
measured non-invasively on the right arm of the patient. In the period of between 6 and 8
months after surgery, all patients with re-CoA underwent balloon angioplasty (in invasive
measurements, peak gradient averaged 34 mmHg, range: 10–43 mmHg). Balloon angioplasty
dilated coarctation with mean gradient reduction of 14 mmHg (range: 3–23 mmHg) in
invasive measurements and up to 30 mmHg (range: 16–45 mmHg) in follow-up Doppler
echocardiography. At six months after balloon angioplasty, there were no signs of recurrent
isthmus stenosis.
In the study group (n=25), among 20 (80%) of the children followed-up for an average
of 13 months there were no observed cases of recurrent coarctation of the aorta. In this group,
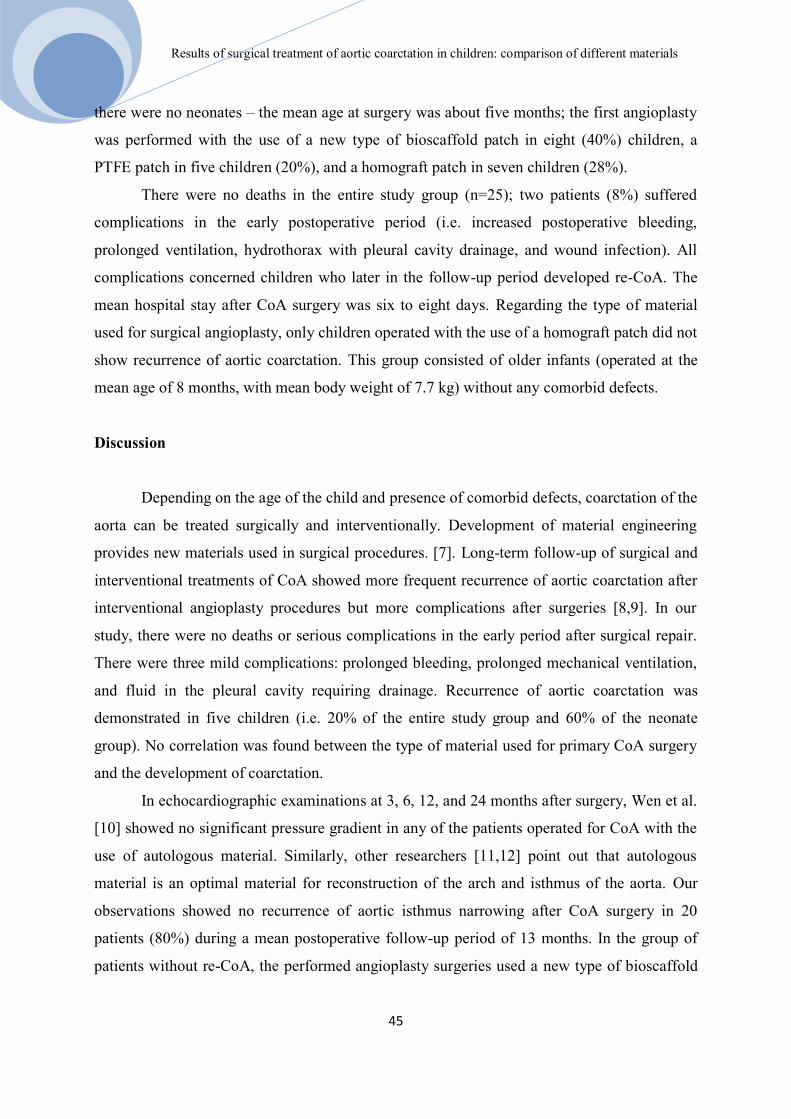
Results of surgical treatment of aortic coarctation in children: comparison of different materials
45
there were no neonates – the mean age at surgery was about five months; the first angioplasty
was performed with the use of a new type of bioscaffold patch in eight (40%) children, a
PTFE patch in five children (20%), and a homograft patch in seven children (28%).
There were no deaths in the entire study group (n=25); two patients (8%) suffered
complications in the early postoperative period (i.e. increased postoperative bleeding,
prolonged ventilation, hydrothorax with pleural cavity drainage, and wound infection). All
complications concerned children who later in the follow-up period developed re-CoA. The
mean hospital stay after CoA surgery was six to eight days. Regarding the type of material
used for surgical angioplasty, only children operated with the use of a homograft patch did not
show recurrence of aortic coarctation. This group consisted of older infants (operated at the
mean age of 8 months, with mean body weight of 7.7 kg) without any comorbid defects.
Discussion
Depending on the age of the child and presence of comorbid defects, coarctation of the
aorta can be treated surgically and interventionally. Development of material engineering
provides new materials used in surgical procedures. [7]. Long-term follow-up of surgical and
interventional treatments of CoA showed more frequent recurrence of aortic coarctation after
interventional angioplasty procedures but more complications after surgeries [8,9]. In our
study, there were no deaths or serious complications in the early period after surgical repair.
There were three mild complications: prolonged bleeding, prolonged mechanical ventilation,
and fluid in the pleural cavity requiring drainage. Recurrence of aortic coarctation was
demonstrated in five children (i.e. 20% of the entire study group and 60% of the neonate
group). No correlation was found between the type of material used for primary CoA surgery
and the development of coarctation.
In echocardiographic examinations at 3, 6, 12, and 24 months after surgery, Wen et al.
[10] showed no significant pressure gradient in any of the patients operated for CoA with the
use of autologous material. Similarly, other researchers [11,12] point out that autologous
material is an optimal material for reconstruction of the arch and isthmus of the aorta. Our
observations showed no recurrence of aortic isthmus narrowing after CoA surgery in 20
patients (80%) during a mean postoperative follow-up period of 13 months. In the group of
patients without re-CoA, the performed angioplasty surgeries used a new type of bioscaffold

Results of surgical treatment of aortic coarctation in children: comparison of different materials
46
in the case of 8 patients, a homograft in the case of 7 patients, and a synthetic PTEE patch in
the case of 5 patients.
Regarding CoA surgeries using PTFE patches, recurrence of aortic coarctation was
reported in 25.42% of cases [13]. At a follow up of 81.6 months, re-CoA was demonstrated in
12.9% of the cases operated with the patch-graft aortoplasty technique [14]. CardioCel bovine
pericardial patch was described in aortoplasty for supravalvular aortic stenosis, reconstruction
of the aortic arch, and angioplasty of pulmonary arteries. In the treated group, there were four
infants with hypoplastic aortic arch (the study did not include neonates) [6]. Early follow-up
results were good (median follow-up period of 58 days, range between 14 and 219 days).
Other sources [15,16] report good initial repair results with the use of new pericardial
materials. These data concern small groups of patients and a short follow-up period.
Researchers [15] report no calcification of the bovine pericardial patch used to repair various
congenital heart diseases and no deaths associated with this material; however, in this groups
there were only two patients with CoA and comorbid ventricular septal defect (VSD). A
review of the literature [16] found three cases of angioplasty of a severe aortic valve defect,
with good early results of surgery using a bovine pericardium patch.
Re-CoA developed in five children within 4 to 6 months (i.e. 20% of the entire study
group and 30% of the neonate group). All cases of re-CoA were related to children operated at
neonatal age; no correlation was found between the occurrence of a recoarctation and the
material used in angioplasty. In the case of children older than one month who were operated
for CoA, neither re-CoA nor significant complications were observed regardless of the
material used in angioplasty.
The group of children examined in our study was relatively small; moreover, it was
evaluated only retrospectively, without randomisation.
Further follow-up is required to analyse long-term results of aortic coarctation
treatment with use of different materials.
Conclusion
In the study group of children with coarctation of the aorta who underwent surgical
patch angioplasty, 20% experienced recoarctations. All recoarctations occurred in neonates.
No correlation was found between the formation of a recoarctation and the used surgical
material.

Results of surgical treatment of aortic coarctation in children: comparison of different materials
47
Acknowledgements
No grants, no funding.
Conflict of interest
None declared
References
1. Pádua L.M., Garcia L.C., Rubira C.J., de Oliveira Carvalho P.E.: Cochrane Database
Systematic Review 2012, 5, 8-24.
2. Becker A.E., Becker M.J., Edwards J.E.: Anomalies associated with coarctation of
aorta: particular reference to infancy, Circulation 1970, 41, 1067–1075.
3. Torok R.D., Campbell M.J., Fleming G.A., Hill K.D.: Coarctation of the aorta:
Management from infancy to adulthood. World Journal of Cardiology, 2015, 7, 11, 765-
775.
4. ACC/AHA 2008 Guidelines for the Management of Adults with Congenital Heart
Disease: a report of the American College of Cardiology/American Heart Association
Task Force on Practice Guidelines (writing committee to develop guidelines on the
management of adults with congenital heart disease): Warnes C.A., Williams R.G.,
Bashore T.M., Child J.S., Connolly H.M., Dearani J.A., del Nido P., Fasules J.W.,
Graham T.P. Jr, Hijazi Z.M., Hunt S.A., King M.E., Landzberg M.J., Miner P.D.,
Radford M.J., Walsh E.P., Webb G.D. Circulation, 2008 , 11, 714-833.
5. Cetrano E., Polito A., Trezzi M., Carotti A.: Neonatal Repair of Persistent Fifth Aortic
Arch Coarctation and Interrupted Fourth Aortic Arch. Annals of Thoracic Surgery
2017, 103, 475 -477.
6. Sobieraj M., Cudak E., Mrówczyński W., Nałęcz T.K., Westerski P., Wojtalik M.:
Application of the CardioCel bovine pericardial patch – a preliminary report. Polish
Journal of Cardio-Thoratic Surgery 2016, 13, 3, 210-212.
7. Galiñanes E.L., Krajcer Z.: Most Coarctations, Recoarctations, and Coarctation-Related
Aneurysms Should Be Treated Endovascularly Based on a Presentation at the 2013
VEITH Symposium, November 19–23, 2013 (New York, NY, USA), AORTA Journal
2015, 3, 136-139.

Results of surgical treatment of aortic coarctation in children: comparison of different materials
48
8. Rodés-Cabau J., Miró J., Dancea A.: Comparison of surgical and transcatheter treatment
for native coarctation of the aorta in patients > or = 1 year old. The Quebec Native
Coarctation of the Aorta study, American Heart Journal, 2007, 154, 186–192.
9. Wong D., Benson L.N., Van Arsdell G.S., Karamlou T., McCrindle B.W.: Balloon
angioplasty is preferred to surgery for aortic coarctation. Cardiology in the Young,
2008, 18, 79–88.
10. Wen S., Cen J., Chen J.: The application of autologous pulmonary artery in surgical
correction of complicated aortic arch anomaly. Journal of Thoractic Disease, 2016, 8,
3301-3306.
11. Danesi T.H., Minniti G., Cresce G.D., Favaro A., Magagna P., Auriemma S.: Redo
After Failure of Aortic Homografts With a Rapid Deployment Valve. Annals of
Thoratic Surgery, 2016, 102, 281-282.
12. Chang Q., Jing H., Sun M., Xu P.: Exploring the role of short-course cyclosporin a
therapy in preventing homograft valve calcification after transplantation, Cell
Immunology, 2014, 287, 36-45.
13. Walhout R.J., Lekkerkerker J.C., Oron G.H., Hitchcock F.J., Meijboom E.J., Bennink
G.B.: Comparison of polytetrafluoroethylene patch aortoplasty and end-to-end
anastomosis for coarctation of the aorta, Journal of Thoratic Cardiovascular Surgery,
2003, 126, 521-528.
14. Dehaki M.G., Ghavidel A.A., Givtaj N., Omrani G., Salehi S.: Recurrence rate of
different techniques for repair of coarctation of aorta: A 10 years experience, Annals of
Pediatric Cardiology, 2010, 3, 123-126.
15. Neethling W.M., Strange G., Firth L., Smit F.E.: Evaluation of a tissue-engineered
bovine pericardial patch in paediatric patients with congenital cardiac anomalies: initial
experience with the ADAPT-treated CardioCel(R) patch, Interactive Cardiovascular
Thoratic Surgery, 2013, 17, 698–702.
16. Mazzitelli D., Nobauer C., Rankin J.S., Vogt M., Lange R., Schreiber C.:Complete
aortic valve Cusp replacement in the pediatric population using tissue-engineered
bovine pericardium. Annals of Thoratic Surgery, 2015, 100, 1923–1925.
Futile therapy in infants - a problem yet to be solved
49
Futile therapy in infants - a problem yet to be solved
Brzychczy Maciej1, Markiewicz Natalia
1, Szymocha Marcin
1, Turniak Michał
1, Kurzelewska-
Sobczak Anna2, Paprocka-Borowicz Małgorzata
1,2, Gnus Jan
1,2
1. Medical University Piastów Śląskich in Wroclaw, Wroclaw
2. Research and Development Center, Provincial Specialist Hospital in Wroclaw,
Wrocław
Introduction
In this day and age, medicine is advancing more than ever. As a result of a today's
unprecedented advancement, new challenges are emerging, ones that physicians have never
seen before. One of the main challenges of the current medicine is to ascertain the cut-off
point of a treatment in terminal patients. Since there is a little research being done on this
subject, we need to be certain that over treating of terminally ill has no place in modern health
service.
It is generally agreed today that futile medical care will not provide a cure for a
terminal patient [1]. A long-lasting situation, where there is nothing but a great anguish, is
condemning hundreds of patients to mental, physical and spiritual harm. It is important to be
clear about the definition of futile therapy and to emphasize that this term refers to people that
are terminally ill. The question, where is the sensible boundary between valid and futile
medical care has been preoccupying experts for some time.
In public eye, physicians are the ones responsible for the abandonment of futile
therapy in terminal patients. It is a good opportunity to do so when a controversial issue is
being mulled in public. Physicians need to remain immune to public opinion and they need to
be quick to react when it comes to making decisions and standing by them.
One of the most notorious examples touching upon the validity of futile care in
paediatric patients is the case of Charlie Gard [2]. It was a long and moving story about
devastated parents and their helplessness in a fight for their son’s life. Charlie was born with
mitochondrial DNA depletion syndrome, genetic disorder that is invariably fatal. They could
not cope with knowledge that their child is going to die and nothing could be done about it.

Futile therapy in infants - a problem yet to be solved
50
The long-lasting case found its resolve in the adjudication of the European Court of
Human Rights. It was a milestone in understanding futile therapy as a concept in
law.Nowadays, the most important goal for medical and ethical clarity is to establish a
functional definition of futile therapy. Guidelines are required, now more than ever, in the
face of modern society, worldwide media and constantly increasing expectations from the
physicians.
The assumptions and the aims of study
The aim of this paper was to find out how do students view change on futile therapy in
infants with passing years of medical school. It is assumed that there is a clear difference
between students who were past anaesthesiology and intensive therapy courses and those who
are yet to complete them. Such assumption stems naturally from a fact that subject of futile
therapy is an integral part of these courses.
Material and methods
The poll has been completed by means of an anonymous survey. The tested group
consists of 106 students of the medical faculty, the reach of survey covers all the semesters.
The group was divided into two. The first group included students of up to third year, which is
before anesthesiology and intensive therapy courses. The second group consisted of the
student who has had these courses completed and was in possession of knowledge related to
the subject of futile therapy. Additionally, results were analyzed with the view of gender,
religion as well as the size of the city/town students came from.
Results
Following completion of anesthesiology course, more students are convinced about
futile therapy is not successful. Every post-course student did not assess the success of the
futile therapy as significant, in pre-course group however only 4.2% of students would
disagree. Those students were less likely to pass decision with regards to continuing therapy
on to parents of the patient, most of them considered the comfort of the patient at the end of
their life rather than supporting it with futile therapy (Fig.1, Fig.2).

Futile therapy in infants - a problem yet to be solved
51
Number of persons who disagree with resuscitation of anencephalopathy child
increases significantly. Number of persons who do not have opinion on this subject is
decreasing (Fig.3, Fig.4).
During the course, understanding of continuing futile therapy until end of life clarifies
and more future physicians believes it to be necessary (Fig.5, Fig.6)
Understanding of futile therapy varies based on where responded came from. In
smaller towns, percentage of questioned students who knew correct definition of terminology
is bigger than in the other group, also gamut of answers is clearly larger.
Fig. 1
Fig. 2
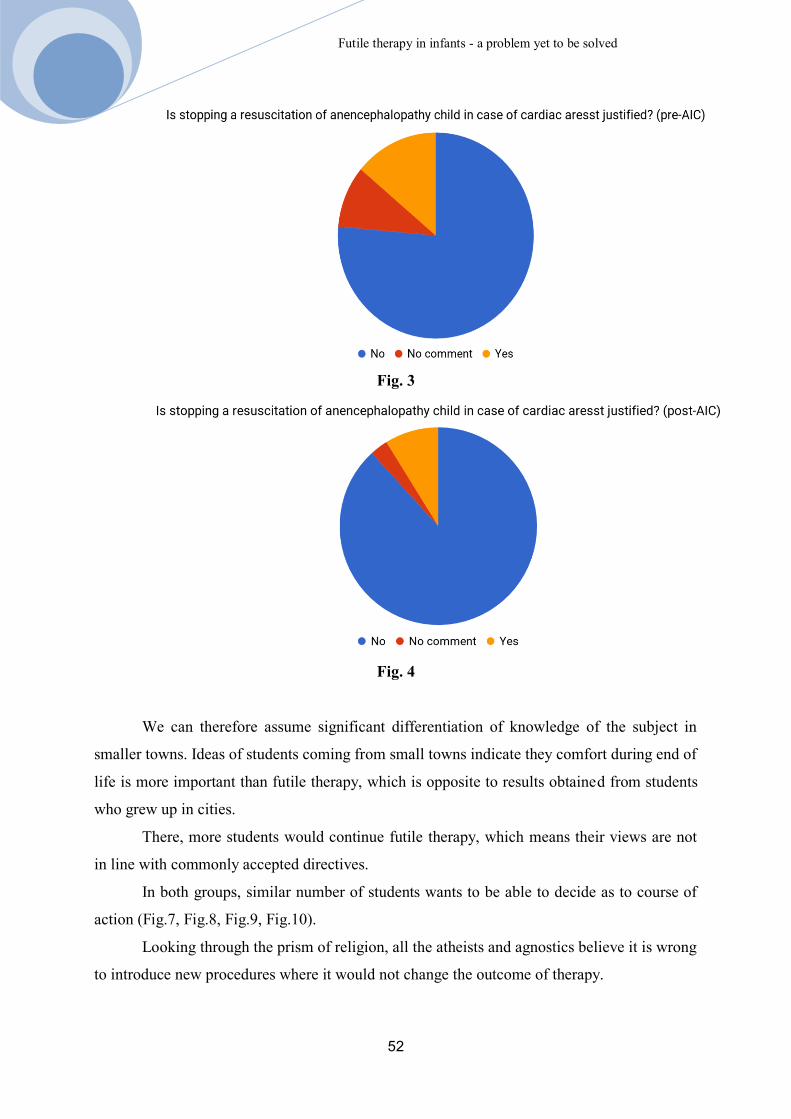
Futile therapy in infants - a problem yet to be solved
52
Fig. 3
Fig. 4
We can therefore assume significant differentiation of knowledge of the subject in
smaller towns. Ideas of students coming from small towns indicate they comfort during end of
life is more important than futile therapy, which is opposite to results obtained from students
who grew up in cities.
There, more students would continue futile therapy, which means their views are not
in line with commonly accepted directives.
In both groups, similar number of students wants to be able to decide as to course of
action (Fig.7, Fig.8, Fig.9, Fig.10).
Looking through the prism of religion, all the atheists and agnostics believe it is wrong
to introduce new procedures where it would not change the outcome of therapy.

Futile therapy in infants - a problem yet to be solved
53
Fig. 5
Fig. 6
Fig. 7

Futile therapy in infants - a problem yet to be solved
54
Fig. 8
Fig. 9
Fig. 10

Futile therapy in infants - a problem yet to be solved
55
Over 75% of those would agree to stopping futile therapy altogether, however none of
them would agree to stopping of the therapy being only available option. In case of catholics,
over 90% believes not commencing new procedures is correct, 55% of them agrees with
stopping of futile therapy. Almost 48% of surveyed agrees to both. In their assessment futile
therapy should continue, this view is opposed to one professed by atheists. Since number of
other religions was too small their resonses were ommited from statistical review (Fig.11,
Fig.12, Fig.13, Fig.14).
With reference to gender, women clearly agree to family of child undergoing futile
therapy having deciding word on stopping such therapy, also women do not have clear view
about physician deciding against parents wishes.
Fig.11
Fig.12
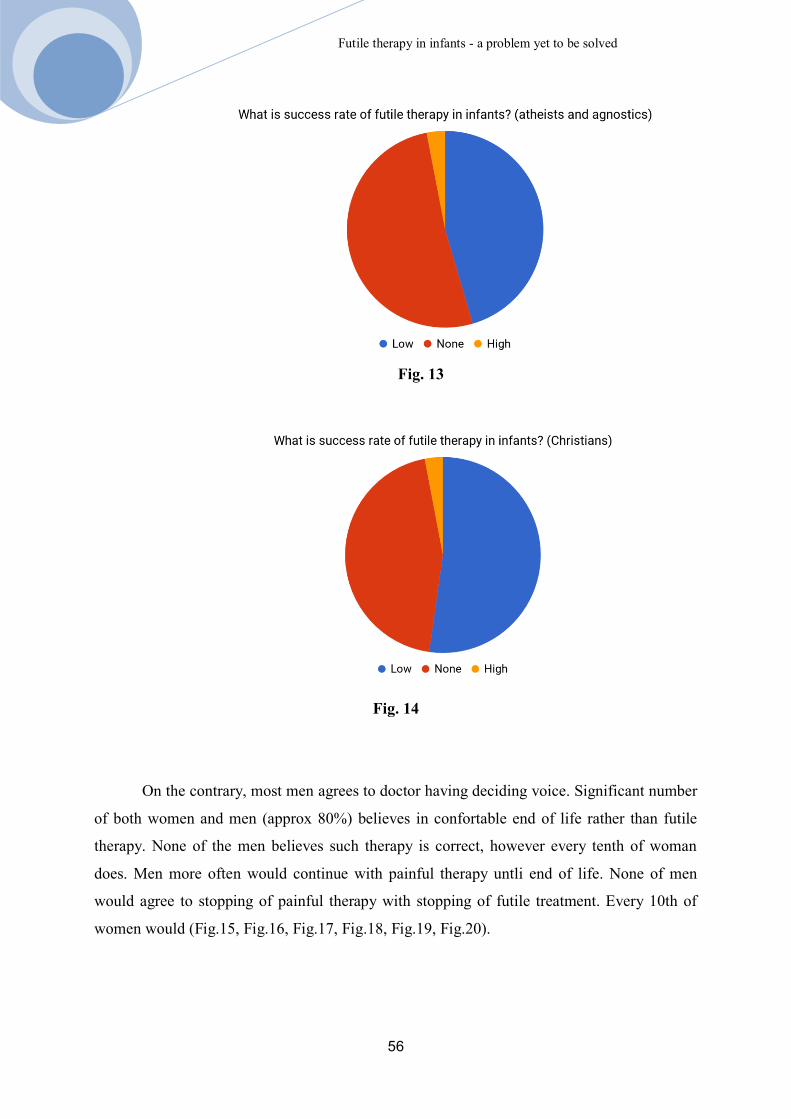
Futile therapy in infants - a problem yet to be solved
56
Fig. 13
Fig. 14
On the contrary, most men agrees to doctor having deciding voice. Significant number
of both women and men (approx 80%) believes in confortable end of life rather than futile
therapy. None of the men believes such therapy is correct, however every tenth of woman
does. Men more often would continue with painful therapy untli end of life. None of men
would agree to stopping of painful therapy with stopping of futile treatment. Every 10th of
women would (Fig.15, Fig.16, Fig.17, Fig.18, Fig.19, Fig.20).
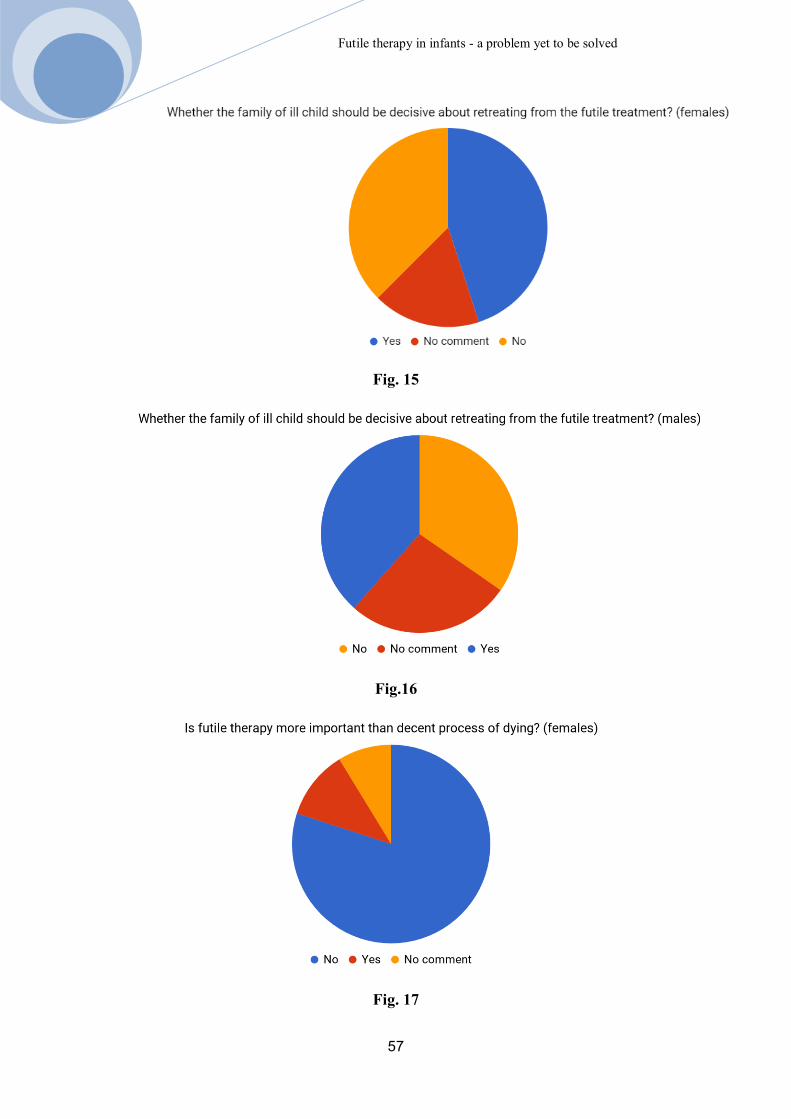
Futile therapy in infants - a problem yet to be solved
57
Fig. 15
Fig.16
Fig. 17

Futile therapy in infants - a problem yet to be solved
58
Fig. 18
Fig. 19
Fig. 20

Futile therapy in infants - a problem yet to be solved
59
Discussion
The progress of the medicine over the centuries allowed for crossing further limits.
For example, the introduction of anesthesia by Horatio Wells in 1846 allowed for complete
removal of pain during operation, pushing now available surgical limits much, much further.
Introduction of carbol by Lister, used as cleaning agent for skin as well as surgical
instruments and Semmelweis fights for cleaner ob/gyn wards are prime examples of
breakthroughs over the years. These small steps which proved to be giant leaps in medicine
allowed for solution to problems which were believed impossible to tackle. Thanks to these
leaps many illnesses which were once a death sentence are now quite curable. Desire to
conquer death came to fruition with many of those illnesses. Certainly, dreams of
revolutionary practitioners of medicine materialised as better drugs, wider spectrum of
medical instruments and lower mortality rate. However, as noted by professor Gibinski, this
chosen path leading to ‘curing the death’ is fatal. He believes caring for patient health and
dignity is more important than extending life at all cost [3].
According to dr.hab. Dangel, physician deciding therapy, should decide whether
illness can be cured and therapy will not bring pain and removes dignity [2]. Such decision is
quite difficult due to internal moral conflict, which is caused by natural need for saving
human life, but also due to incorrect equalizing futile therapy with passive euthanasia – which
are quite different. However commonly agreed legal definition of futile therapy, which would
clearly defined required modus operandi does not exist. Therefore there are no algorithms nor
clear reference point for either continuing or stopping of the futile therapy [4].
Medical environment have large number of publications available (both national and
international) on subject of ethics which attempt defining rules of engagement with regards to
therapy of terminal patients. These are article 32 of Kodeks Etyki Lekarskiej, article 2278 and
2279 of Katechizm Kościoła Katolickiego [10] as well as doctrines laid by Popes Pius XII or
Francis. These sources call for acceptance of of stopping of futile therapy in cases where
outcome is bad, therapy is painful or extraordinary resources are required. Importance should
be put on ensuring comfort and dignity of the patients. It stems from agreeing death being
integral part of the life cycle and medicine however advanced has still a limits that cannot be
reached or crossed. It was first described by Hippocrates in his About of art (of medicine) [9].
Thorough understanding of this subject is important not only in context of physician making
decisions but society as well. According to CBOS [8] poll Stopping futile therapy and
euthanasia, Poles may be understanding futile therapy incorrectly. This poll induced negative

Futile therapy in infants - a problem yet to be solved
60
reactions, since it reminds surveyed group about problems with National Health System.
Social campaigns, education about end of life treatments are necessary. A proof of above is
surveyed Christians are against stopping of the futile therapy, even though Catholic Church
agrees to it. It indicates lack of available moral authority to spread the necessary knowledge.
According to the results of authors studies, students who completed Anesthesiology and
Intensive Care courses, where subjects related to problems of end of life therapy are taught,
are convinced that stopping of futile therapy when there is no chance of cure is correct.
Societal understanding of this subject will allow for doctors deciding on stopping futile
therapy to not be penalised for doing so.
Problem of futile therapy concerns neonatal units as well. This subject is is quite
difficult to discuss in context of pediatric patients. Due to lot of possibilities of supporting life
functions in children born prematurely or with significant congenital defect, the border
between increasing agony and supporting life become quite difficult to define.
Due to parents being legal guardians, the attending doctor should always consider their
views, however final decision should be aimed at ensuring comfort of the patient.
In most difficult cases, such as stopping of futile therapy, the doctor, especially young
and inexperienced one, may face lot of problems – related to decisions as well as ethics.
Expectations and pressure from parents, who are motivated by finding cure for their sick child
may create additional challenges. An example of heroical fight for life of a terminally ill child
is case of Charlie Gard, which ended in litigation at European Tribunal of Human Rights [5].
Subject discussed in this group of patients created set of documents which are used as
reference point for doctors attending terminally ill children [11,12]. Authors of these
publications indicate importance of right of the child to comfortable death. Attitudes of
doctors with regards to palliative care of terminally ill child as discussed above are mirrored
in answers of students that completed AiLT courses.
Conclusions
There is a need for education of physicians and society about problems related to futile
therapy. The aim of such education is to help physicians when making decisions and also to
assist when solving ethical dilemmas, as for society such education will allow for better
understanding of futile therapy.

Futile therapy in infants - a problem yet to be solved
61
Differences in responses from students prior and after the AiLT course proves that
education on the subject of futile therapy is effective and helps with the decision-making
process.
References
1. Brzeziński, T. Granice walki o życie. [w:] Etyka lekarska. Brzeziński T. PZWL,
Warszawa, 2015, 208- 215
2. Wyrok Europejskiego Trybunału Praw Człowieka w sprawie Charls Gard.,
http://hudoc.echr.coe. int/eng?i=001-175359, data pobrania 9.04.2018.
3. Kortko, D., Bochenek, K. Lekarze leczą śmierć. [w:] Ludzie czy Bogowie. Kortko, D.,
Bochenek, K. Agora, Warszawa, 2015, 25- 33.
4. Kortko, D., Bochenek, K. Szpital to nie jest dobre miejsce dla dzieci. [w:] Ludzie czy
Bogowie. Kortko, D., Bochenek, K. Agora, Warszawa, 2015, 311- 321.
5. Wróbel W.: Rezygnacja z uporczywej terapii w świetle polskiego prawa.
https://www.mp.pl/etyka/kres_zycia/46416,rezygnacja-z-uporczywej-terapii-w-swietle
polskiego-prawa, data pobrania 9.04.2018.
6. Sienkiewicz W. (red.), Krajnik M. (red.), Grabowski R. (red.).: Dylematy etyczne
końca życia-problem uporczywej terapii. https://www.bil.org.pl/images/ Komisje/
Komisja.Bioetyczna/2014_01_09_Dylematy_etyczne_internet_m.pdf,data pobrania
9.04.2018.
7. Katechizm Kościoła Katolickiego, art. 2278, art. 2279. http://www.archidiecezja.
pl/include/user_file/kkk.pdf, data pobrania 16.04.2018.
8. Bartoszek A.: Uporczywa terapia przeciwnowotworowa- aspekty etyczne. Chirurgia
Polska 2011, 13, 1, 42–47
9. Hipokrates. O sztuce (lekarskiej). [w:] Wybór pism. Wesoły M. (tłum. i red.).
Prószyński i Ska, Warszawa, 2008, 1, 106.
10. Komunikat Badań CBOS, Zaniechanie uporczywej terapii a eutanazja. https://www.
cbos. pl/SPISKOM.POL/2013/K_003_13.PDF, data pobrania 9.04.2018.
11. Dangel T. (red.).: Zaniechanie i wycofanie się z uporczywego leczenia
podtrzymującego życie u dzieci. Wytyczne dla lekarzy. http://www.hospicjum.
waw.pl/phocadownload/Etyka/ZaniechanieIWycofanieZLeczeniaPodtrzymujacegoZyc
ieUDzieci-WytycznePTP_2011.pdf,data pobrania 16.04.2018.
12. http://www.hospicjum.waw.pl/phocadownload/Etyka/ZaniechanieIWycofanieZLeczen
iaPodtrzymujacegoZycieUDzieci-WytycznePTP_2011.pdf ,data pobrania 15.04.2018.

Futile therapy in infants - a problem yet to be solved
62
13. Rutkowska M. (red.).: Rekomendacje dotyczące postępowania z matką oraz
noworodkiem urodzonym na granicy możliwości przeżycia z uwzględnieniem
aspektów etycznych. Perinatologia, Neonatologia i Ginekologia, 2012,5, 1, 5-13.
14. http://perinatalne.pl/pliki/Artykul/1007_rekomendacje-neonatologow.pdf, data pobra-
nia 15.04.2018

Review of methods for breaking bad news
63
Review of methods for breaking bad news
Fedorowicz Sebastian1, Szpytko Szymon
1, Augustynek Paweł
1, Kurzelewska-Sobczak
Anna 2, Ferenc Stanisław
1,2, Paprocka-Borowicz Małgorzata
1,2, Gnus Jan
1,2
1. Uniwersytet Medyczny im. Piastów Śląskich we Wrocławiu, Wrocław
2. Ośrodek Badawczo-Rozwojowy, Wojewódzki Szpital Specjalistyczny we Wrocławiu,
Wrocław
Introduction
Unfavorable diagnosis always was a gloomy part of medicine, especially all the things
concerned with conveying a grievous message to a patient. Luckily nowadays the topic of
breaking bad news had been investigated thoroughly using scientific methods and many
protocols had been created that facilitates effective patient-doctor communication through
specific skills and knowledge described below. The aim of following article is a review of a
few of these methods.
Notification a patient is a physician’s duty through both law and ethics [1]. Basically,
doctors are professionally obliged to break bad news, a huge chunk of their work is about
that!
With this in mind, are there any situations when clinicians are legally able to conceal
some crucial medical information?
Code of medical ethics stated that it is acceptable to withhold information if a doctor
is deeply convinced that its disclosure will cause very serious suffering of the sick or other
adverse health consequences. Although on the explicit request of the patient a physician is
obliged to provide all the information [1].
Unfortunately, breaking bad news is a skill that is typically learned through two
fundamental methods: observation of senior colleagues and trial and error [2].
The lack of student education in this topic is blamed for the insufficient knowledge of
young doctors how it should be done properly [3].
Breaking bad news is neglected in curriculum of the medical studies, although a huge
chunk of doctor’s work concerning communication is connected with noticing the patient
about the diagnosis which is not always optimistic.

Review of methods for breaking bad news
64
What is a bad news in medicine?
The first question that needs to be asked is what exactly is a bad news? According to
Buckman, any information which adversely and drastically alters the patient’s view of the
future could be deemed as a bad news. Its consequences may affect an individual or her or his
family [4]. Another definition is “any information that produces a negative change to a
person’s expectations about their present and future” [5]. Therefore being diagnosed with a
terminal illness, information about serious abdominal trauma injuries or hearing a need for
putting a cast on for at least 4 weeks are perfect examples of bad news.
Although the last one may seem to be least severe, there is always a necessity to take
into account patient’s whole life and it is easy to imagine that a whole month of immobility
for the only family provider can be related with the negative change of person’s expectations
for the future. Nevertheless, there is a wide range of seriousness of bad news, which should
not be forgotten.
The Difficulty of Transmitting Unfavourable Medical Information
It is obvious that having a burden of telling somebody about his or her terminal illness
is not pleasant. Especially when people are hoping for the best and are rarely prepared for
hearing dreadful diagnosis.
What is the most daunting in breaking bad news is the complexity of the task. A
doctor has to: first and foremost disclosure the diagnosis. Besides that: while doing so deal
with patient’s and his or her family emotions, make decision about future treatment together
with the sick, think whether family members would like to participate in the conversation,
stay calm and professional, be optimistic but not overoptimistic and moreover do it all in the
time constraints imposed by the healthcare system.
On the top of that the syndrome of “shooting the messenger of bad tidings” can
intimidate doctors, especially young doctors. This phenomenon describes the act of blaming
the messenger of bad news and therefore taking out anger on him. Also a clinicist can feel that
he is taking away patient’s hope.
To omit the process some physicians use cryptoinformation - they skip some
information during the visit but write it in the documentation that the patient receives.
Based on the survey from 2000 in the USA less than ⅓ of doctors could regularly
observe senior colleagues during breaking bad news and fewer than 10% had training in the

Review of methods for breaking bad news
65
matter [3]. Although most clinicians admit that the skill of breaking bad news has a great
importance, unfortunately it is seldomly taught.
Benefits Of Protocols For Breaking Bad News
The efficient communication increases trust in the doctor and the treatment itself [6].
Consequently the patient is not only more involved but also more likely to follow medical
recommendations!
A structured method for transmitting unfavourable information has the same benefit as
every checklist, for instance those used in the airplane by the pilots [7]. It enables to organize
set of actions into a methodic process which dramatically boosts its effectiveness. First of all,
meticulous realisation of the protocol ensures that nothing from the procedure has been
omitted. It gives the physician a sense of calm which will undoubtedly influence the patient.
Another key point is that having a plan of disclosure of the unfavorable medical information
increases level of doctors confidence [8]. This also helps to discuss the difficult and
important topics because when doctors feel uncomfortable they may tend to shorten the time
speaking about miserable prognosis [9].
There is also a direct benefit for medical staff: “physicians who are comfortable in
breaking bad news may be subject to less stress and burnout” and nowadays it is a serious
problem in health care [10].
The manner in which doctor and patient discuss about bad news also influence the
level of understanding the diagnosis, satisfaction with medical care and amount of hope they
have [11,12]. Moreover, doing it appropriately can lessen the feeling of social isolation and
being alone with the problem, diminish anxiety and uncertainty, minimize the discomfort or
even pain. Additionally it prevents from being overoptimistic about the success of the
treatment.
The SPIKES Method
The most known and therefore probably the most often cited protocol for breaking bad
news is SPIKES [3]. What is notable that it was published in The Oncologist in 2000 and
based on the survey that had been conducted in 1998 at Annual Meeting of the American
Society of Clinical Oncology, therefore it was developed after invention of the microscope,
the first coronarography or understanding the structure of DNA. That does not diminish the

Review of methods for breaking bad news
66
importance of doctor-patient communication. Of course noticing the patients was important to
medicine before but nobody explored the process scientifically with such a deliberation.
SPIKES is specialized in transmitting information to oncological patients about their
illness. It consists of six steps and is focused on gathering information, disclosure of
unfavorable medical diagnosis, supporting the sick and planning future treatment. What is
equally important that an increase of confidence in breaking bad news has been reported by
the physicians who had been taught the protocol.
Step 1: S-SETTING UP the Interview
The main goal of this step is preparation and its foundation of future smooth
communication. The physician has to know what he or she is about to say. The awareness of
diversity of emotional reactions can prepare for embracing them, as well as the fact that
messenger of unfavorable diagnose should expect to have negative feelings and be prepared to
deal with anger, frustration and feeling responsible for the diagnosis.
Privacy in terms of both place and enough time is undoubtedly essential. If an
interview room is not available it is a good practice to at least draw the curtains. The sick
should be asked whether his or her significant other would like to participate in the
conversation. Position of the patient and doctor should be comfortable. An eye contact is a
fundamental communication tool that enables to build the connection. Another part of
nonverbal communication is a touch. It does not always have to be holding hands but even
touching the arm can make the patient feel the support. Not to mention that it is a good idea to
turn off a mobile phone.
Step 2: P-Assessment of the patient’s PERCEPTION
In this phase the objective is getting to know what is the patient’s perspective of the
situation and its gravity. Using open-ended questions, the doctor obtains the information
about the patient’s knowledge, for instance using expressions like: “What have you heard
about your current medical condition so far?” [13].
Step 3: I-Obtaining the patient’s INVITATION
Not only there are patients who wish to hear every detail about their illness but also
there are few who refrain from meticulous descriptions of their tumors and knowing is their
right in the same manner as not knowing. It is more likely that ignoring the knowledge will be
manifested while the illness will become more severe. The physician should offer spending
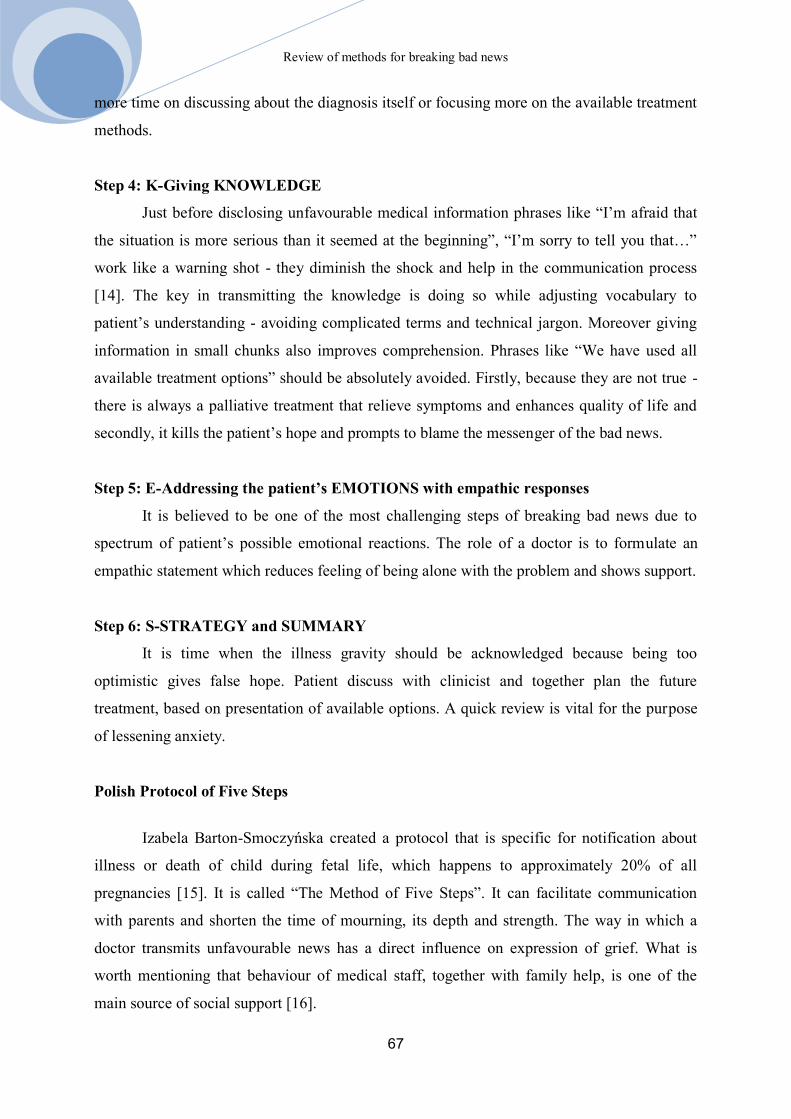
Review of methods for breaking bad news
67
more time on discussing about the diagnosis itself or focusing more on the available treatment
methods.
Step 4: K-Giving KNOWLEDGE
Just before disclosing unfavourable medical information phrases like “I’m afraid that
the situation is more serious than it seemed at the beginning”, “I’m sorry to tell you that…”
work like a warning shot - they diminish the shock and help in the communication process
[14]. The key in transmitting the knowledge is doing so while adjusting vocabulary to
patient’s understanding - avoiding complicated terms and technical jargon. Moreover giving
information in small chunks also improves comprehension. Phrases like “We have used all
available treatment options” should be absolutely avoided. Firstly, because they are not true -
there is always a palliative treatment that relieve symptoms and enhances quality of life and
secondly, it kills the patient’s hope and prompts to blame the messenger of the bad news.
Step 5: E-Addressing the patient’s EMOTIONS with empathic responses
It is believed to be one of the most challenging steps of breaking bad news due to
spectrum of patient’s possible emotional reactions. The role of a doctor is to formulate an
empathic statement which reduces feeling of being alone with the problem and shows support.
Step 6: S-STRATEGY and SUMMARY
It is time when the illness gravity should be acknowledged because being too
optimistic gives false hope. Patient discuss with clinicist and together plan the future
treatment, based on presentation of available options. A quick review is vital for the purpose
of lessening anxiety.
Polish Protocol of Five Steps
Izabela Barton-Smoczyńska created a protocol that is specific for notification about
illness or death of child during fetal life, which happens to approximately 20% of all
pregnancies [15]. It is called “The Method of Five Steps”. It can facilitate communication
with parents and shorten the time of mourning, its depth and strength. The way in which a
doctor transmits unfavourable news has a direct influence on expression of grief. What is
worth mentioning that behaviour of medical staff, together with family help, is one of the
main source of social support [16].
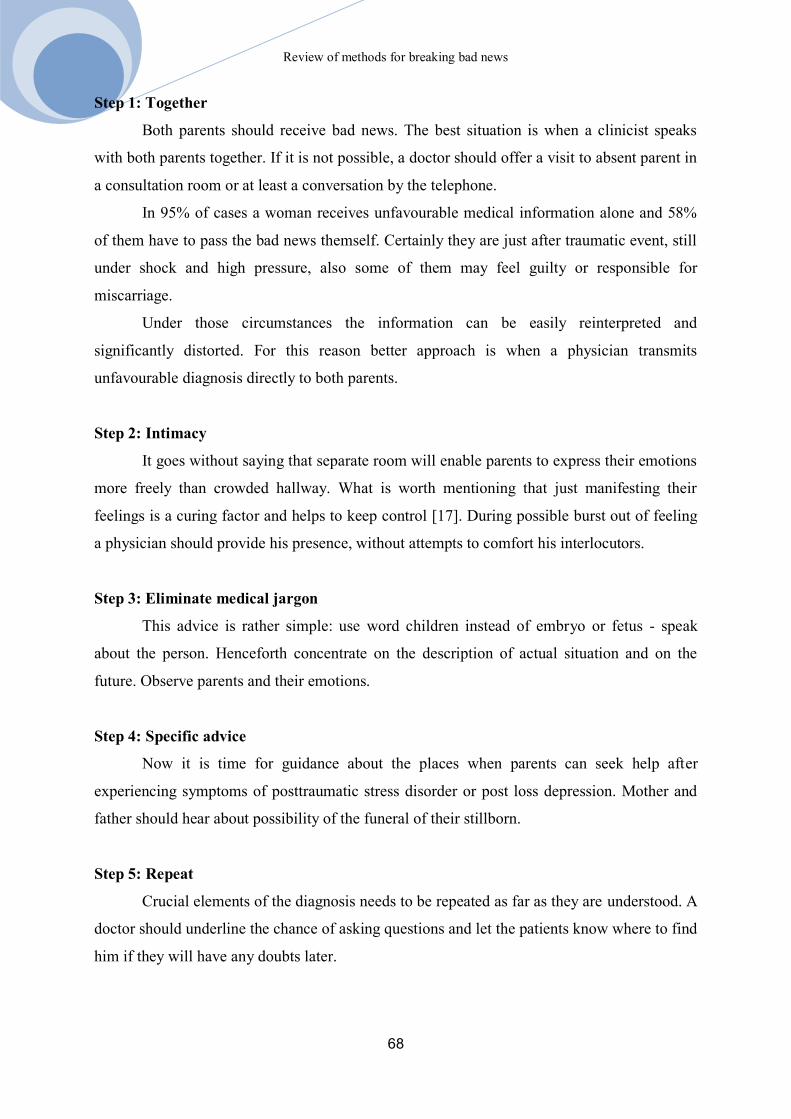
Review of methods for breaking bad news
68
Step 1: Together
Both parents should receive bad news. The best situation is when a clinicist speaks
with both parents together. If it is not possible, a doctor should offer a visit to absent parent in
a consultation room or at least a conversation by the telephone.
In 95% of cases a woman receives unfavourable medical information alone and 58%
of them have to pass the bad news themself. Certainly they are just after traumatic event, still
under shock and high pressure, also some of them may feel guilty or responsible for
miscarriage.
Under those circumstances the information can be easily reinterpreted and
significantly distorted. For this reason better approach is when a physician transmits
unfavourable diagnosis directly to both parents.
Step 2: Intimacy
It goes without saying that separate room will enable parents to express their emotions
more freely than crowded hallway. What is worth mentioning that just manifesting their
feelings is a curing factor and helps to keep control [17]. During possible burst out of feeling
a physician should provide his presence, without attempts to comfort his interlocutors.
Step 3: Eliminate medical jargon
This advice is rather simple: use word children instead of embryo or fetus - speak
about the person. Henceforth concentrate on the description of actual situation and on the
future. Observe parents and their emotions.
Step 4: Specific advice
Now it is time for guidance about the places when parents can seek help after
experiencing symptoms of posttraumatic stress disorder or post loss depression. Mother and
father should hear about possibility of the funeral of their stillborn.
Step 5: Repeat
Crucial elements of the diagnosis needs to be repeated as far as they are understood. A
doctor should underline the chance of asking questions and let the patients know where to find
him if they will have any doubts later.

Review of methods for breaking bad news
69
The BREAKS Method
Another protocol for breaking bad news has its origin in India and is called BREAKS
[18]. It underlines that during noticing the patient physicians are daunted by anger, fear and
being blamed. Conveying bad news is especially intricate while dealing with young patients
and children, when a patient has expressed a great hope and for the positive outcome, when a
doctor has a long lasting relationship with a patient.
Authors of this protocol emphasize that patient-centered communication style is most
preferable, i.e. acceptance, begin non-judgmental and empathy are essential to achieving deep
emotional connection. BREAKS is an acronym which stands for six-phase process:
Background, Rapport, Explore, Announce, Kindling and Summarize.
Step 1: B - Background
The very first step is based on the assumption that effective communication with
patient is based on the comprehensive knowledge of the issue. The doctor must study the case
report thoroughly and formulate answers for all question that may be asked by the patient.
Moreover, all the doubts and objections should be addressed in advance, also taking into
account patient’s relatives. The physician should be aware that nowadays due to
computerization data is relatively easy to obtain through internet search engines, with results
appearing immediately thus probably patient has done his own research in ample scope.
Past history, disease status and future treatment options should be studied in-depth before the
meeting. Also being sensitive to cultural, ethnic and religion differences and respecting them
is absolutely essential. Any physical barriers should be removed to maintain the eye contact
and a sufficient amount of time should be given to eliminate the haste.
Step 2: R - Rapport
In this part of breaking bad news the physician should have appointed a meeting of
adequate length. Now it is time to establish a good, professional relationship with the patient.
An unconditional positive attitude, regard and avoiding patronizing demeanor are
fundamental.
Rapport in psychology is a close and harmonious relationship in which people
understand each other’s emotions and opinions easily and thus can communicate smoothly
[19]. The key is ongoing conversation and avoiding monologue. An ample space is crucial to
open up. Equally important in this step is placement of the physician and patient in a

Review of methods for breaking bad news
70
comfortable position. For the purpose of the medical interview focusing on open-ended
questions will yield significantly better results than closed questions which can be answered
in short “yes” or “no” response [13]. The enquiry should be concerned with the present
condition of the sick.
Step 3: E - Exploring
As mentioned before, nowadays with such a wide access to the Internet and thus to the
knowledge of different quality, patients and their families are already prepared before medical
visit. Therefore the role of a physician is rather to confirm than break bad news. Exploring
means finding out what the sick already knows about his or her disease, current condition and
possible treatment. Any eventual doubts or confusions about the diagnosis should be
explained in details. Family and the significant other are fundamental source of support for
the patient in that situation and with this in mind it is a proper idea to invite them to the
conversation. Of course it has to be done on the condition of sick’s approval.
Step 4: A - Announce
A concept of an announcement is that it works like a warning shot, it precedes the real
one. For this reason it gives the patient time to prepare mentally, physically and spiritually to
receive an unpleasant information. In this situation there are a few useful phrases that doctor
can use, for instance: “Mister John, unfortunately I have got some bad news to tell you…” or
“Mister John, I am sorry to tell you that I have some shocking news about results of your
magnetic resonance imaging…”. The disclosure of the bad news should be done after
receiving a consent of the patient, because it is his right to abstain from being informed by the
same token he has right to know the diagnosis [1]. Narayanan et al. recommends mirroring
body language and emotions of the sick [18]. Also a few things should be eliminated: medical
jargon, elaborate monologues, lengthy explanations and stories of patients in the same plight.
Using short and comprehensive sentences and not giving more than 3 pieces of information at
a time is a valuable advice for effective communication [20].
Step 5: K - Kindling
People respond to diagnosis differently. Some break in tears, some laugh, some can
not believe that it is real and are in the denial phase. Not only negative emotions like anger,
anxiety or frustration can appear but also a black humor or jokes about the situation are
common reactions. Important to realize is that a physician have to make space for them and

Review of methods for breaking bad news
71
accept it. Also he have to make sure of understanding of the diagnosis and its gravity while
being realistic when speaking about the future. In fact being overoptimistic will do definitely
more harm than good and it should be avoided as well as lecturing the patient. It takes place
when the sick receives big chunks of information without getting chance to ask questions or
respond [21].
Step 6: S - Summarize
In summary of the session every concern and main points of future treatment plan
should be repeated. It is a good practice to recap some key takeaway messages on paper as
strong emotional reactions and stress could impair the memory. An encouragement to contact
and visit appointment in case of any further doubts is very appreciable and helpful. Another
good practice is to encourage the patient not to drive to home on his own and call for support
in that matter so his safety will be ensured.
ABCDE
Rabow and McPhee are founders of another breaking bad news protocol called
ABCDE [22], which had been modified and improved by VandeKieft who based his work on
new scientific discoveries [23]. Its main goal is to increase the level of patient satisfaction and
doctor’s comfort through providing an honest and compassionate disclosure of an
unfavourable diagnosis that people expect.
Step 1: A - ADVANCE Preparation
In this step focus on preparing in advance, that is become aware of patient’s previous
history, arrange appropriate length of time for the meeting and review available treatment
methods. A splendid idea is to mentally rehearse what you are about to say or even arrange
your colleagues into a role-play theatre, where they will be the patient.
Step 2: B - BUILD a Therapeutic Environment and Relationship
Introduce yourself and invite members of the family if the sick prefers to be with them
at this moment. Use an announcement of bad news as a warning shot of “I’m sorry but I have
bad news.”. Be acquainted with patient’s desire of how much they want to know. Also tell
about the possibility of future meetings, where you can be found later.

Review of methods for breaking bad news
72
Step 3: C - COMMUNICATE well
Explore patient’s expectations and knowledge. After that, present the diagnosis
without using medical jargon or euphemisms. Be direct and frank but not brusque. Don’t rush
and let the emotions flow. Use repetitions for better comprehension and make a note on paper
of the key points.
Step 4: D - DEAL with Patient and Family Reactions
Familiarity of basic psychological coping mechanism, such as blaming the messenger,
denial, dissociation from the reality or idealization of the future can be helpful during
communication with patients. Observation is vital to realizing them and the next step is to
react correspondingly.
Step 5: E - ENCOURAGE and Validate EMOTIONS
Being unrealistic is unacceptable because it can contribute to creating delusions by the
patient. It is highly demanded to give hope but not false one. Find out what the diagnosis
means for the sick and encourage to discussion about available treatment methods. Also offer
your help in terms of recommending other services such as hospices or professional
psychologists.
Summary
Learning breaking bad news protocols increases clinicians’ confidence in disclosure of
medical information [3], therefore the calmness transfers to the patients. The efficient
communication augments the likelihood of implementing the medical recommendations [6],
which has a direct effect on the treatment. A structured protocol prevents from forgetting
about important tasks like any other checklist used in the realm of medicine [7]. A prepared
doctor is less likely to shorten the time devoted to the explanation of the patient’s current
medical state.
Moreover, physicians who prioritize their skill of breaking bad news and are
comfortable with that, are less susceptible to stress and occupational burnout [10]. The exact
moment of terminal illness disclosure will be probably one of the most important in the sick’s
life and the proper manner of doing it will affect the satisfaction from medical services.

Review of methods for breaking bad news
73
Nowadays doctors are indeed focused on diminishing the physical pain, forgetting
about the psychological one. Breaking bad news tactfully surely lessen the second one, which
is equally important.
With this in mind every physician should know at least one protocol for transmitting
the knowledge about unfavourable diagnosis. Just choosing one acronym which is personally
most convincing and easy to remember the most will be helpful and may significantly
improve communication with patients.
All sources below agree that most common mistakes of breaking bad news are: having
little time and being in rush, avoiding nonverbal communication - an eye contact, touch etc.,
asking only closed questions and therefore not giving a patient amble space to open up, giving
false hope when there’s none, a lack of privacy and using medical jargon. Just having this in
mind can improve communication skills.
Disclosure of medical informations is an important skill to a majority of clinicians and
despite that fact few of them had any academic training in the matter [3]. The curriculum of
studies needs to be adjusted, especially concerning topics of doctor-patient relationship. The
seminars can include methods like role-playing scenarios with video recording which would
be beneficial for students.
A core of every protocol is listening to the patient, encouraging him or her to speak
and ask questions, confirming whether diagnose and its gravity has been understood and
taking care of the private conditions and having enough time. A perfect communication
should include those key elements.
To summarize, although there is the dozen of methods for breaking bad news, they all
have one thing in common. Empathy.
References
1. Kodeks Etyki Lekarskiej z dnia 2 stycznia 2004 r.: tekst jednolity, zawierający zmiany
uchwalone w dniu 20 września 2003 r. przez Nadzwyczajny VII Krajowy Zjazd
Lekarzy. Warszawa, NRL, 2004, http://www.nil.org.pl/__data/assets/pdf_file/0003/
4764/ Kodeks-Etyki-Lekarskiej.pdf (date of access: 14.04.2018).
2. Mayer RJ, Cassel C, Emmanuel E.: Report of the task force on end of life issues.
Presented at the Annual Meeting of the American Society of Clinical Oncology, Los
Angeles California, 1998.
Review of methods for breaking bad news
74
3. Baile WF, Buckman R, Lenzi R, Glober G, Beale EA, Kudelka AP.: SPIKES-A
six-step protocol for delivering bad news: application to the patient with
cancer. Oncologist, 2000., 5,4, 302-11.
4. Buckman R.: Breaking Bad News: A Guide for Health Care Professionals. Baltimore:
Johns Hopkins University Press, 1992, 15.
5. Fallowfield L, Jenkins V.: Communicating sad, bad, and difficult news in
medicine. Lancet. 2004, 363,9405, 312-319.
6. de Walden-Gałuszko K.: Psychoonkologia w praktyce klinicznej. Warszawa, 2011,
192–204.
7. Anne Collins McLaughlin.: What Makes a Good Checklist. Patient Safety Network,
2010.
8. Baile WF, Kudelka AP, Beale EA et al.: Communication skills training in oncology.
Description and preliminary outcomes of workshops in breaking bad news and
managing patient reactions to illness. Cancer. 1999, 86, 887-897.
9. Maguire P.: Barriers to psychological care of the dying. BMJ. 1985., 291, 1711-1713.
10. Ramirez AJ, Graham J, Richards MA et al.: Burnout and psychiatric disorder among
cancer clinicians. British Journal of Cancer, 1995., 71, 1263-1269.
11. Ford S, Fallowfield L, Lewis S.: Doctor-patient interactions in oncology. Social
Science & Medicine, 1996, 42, 1511-1519.
12. Butow PN, Dunn SM, Tattersall MH.: Communication with cancer patients: does it
matter?. Journal of Palliative Care, 1995, 11, 34-38.
13. Ackley B.: Nursing diagnosis handbook: an evidence-based guide to planning care,
Elsevier Health Sciences, Maryland Heights, 2010.
14. Maynard DW.: How to tell patients bad news: the strategy of “forecasting.”. Cleveland
Clinic Journal of Medicine, 1997, 64, 181-182.
15. Barton-Smoczyńska I.: Metoda pięciu kroków. Przekazywanie informacji o śmierci
dziecka lub chorobie dziecka w czasie ciąży — komunikacja z ciężarną pacjentką.
Życie i płodność, 2009, 4, 43-49.
16. Barton-Smoczyńska I.: O dziecku, które odwróciło się na pięcie. Wyd. NAF, Michał
Naftyński, Łomianki, 2006.
17. Pennebaker J. W.: Otwórz się. Uzdrawiająca siła wyrażania emocji, Media Rodzina,
Poznań, 2006.
18. Vijayakumar Narayanan, Bibek Bista and Cheriyan Koshy.: ‘BREAKS’ Protocol for
Breaking Bad News. The Indian Journal of Palliative Care.,2010, 16,2, 61-65.

Review of methods for breaking bad news
75
19. Neil H. Katz, Marcia Koppelman Sweedler, John W. Lawyer,: Communication &
Conflict Resolution Skills. Kendall Hunt Publishing Company, 2010.
20. Back AL, Arnold RM, Baile WF, Tulsky JA, Fryer-Edwards K.: Approaching difficult
communication tasks in oncology. A Cancer Journal for Clinicians Journal, 2005, 55,
3, 164-177.
21. Siminoff LA, Ravdin P, Colabianchi N, Sturm CM.: Doctor-patient communication
patterns in breast cancer adjuvant therapy discussions. Health Expectations, 2000, 3, 1,
26-36.
22. Rabow MW, McPhee SJ.: Beyond breaking bad news: how to help patients who
suffer. The West African Journal of Medicine, 1999, 171,4, 260–263.
23. VandeKieft GK.: Breaking bad news. American Family Physician Journal, 2001,
15,64,12, 1975-1978.
What would your life look like if you could not swallow?
76
What would your life look like if you could not swallow?
Mystkowska Ewelina1, Pipiro Julia Natalia
1, Harasim-Piszczatowska Emilia
2
1. Student Medical Volunteer Science Club, Department of Integrated Medical Care,
Medical University of Bialystok
2. Department of Integrated Medical Care, Medical University of Bialystok, PhD studies
Introduction
Swallowing seems simple, but it is actually quite complicated. It engages the brain,
several nerves and muscles, two muscular valves, and an open, unconstructed esophagus, or
swallowing tube to work just right.
Swallowing, also called deglutition, is one of the first physiological activities
performed by the human and relies on the sequence of motor phenomena caused by muscles
and coordinated by the central nervous system. It results in food intake, the chewing process,
and transport from the mouth through the throat and esophagus to the stomach [1]. In simple
words, swallowing is the act of passing food from the mouth, via pharynx (or throat) and
esophagus, to the stomach [2]. The process of physiological swallowing requires the
coordination of organs included in the respiratory system and digestive system because during
a swallowing act a short break in breathing is necessary. The act of swallowing consists of
three phases: an oral, a pharyngeal and an oesophageal. The first one is an arbitrary phase and
the other two are reflexive phases [3].
The swallowing phases
The oral phase
This phase takes place 0,9-1,5 sec and is divided into the preparation phase (in which
food is geared up to swallow) and the right oral phase (during which the food is moved to the
oral part of the throat) [4]. The motor function of the tongue is the most important role during
the oral preparation phase of swallowing. The movement of the tongue leads to mixing of
mouthful in the oral cavity and sliding them to the oral recesses. At this stage, the soft palate
prevents premature food intake to the throat. Food is crushed by teeth and, then, rubbed on the

What would your life look like if you could not swallow?
77
hard palate by the tongue. Finally, the food is mixed with saliva and obtains the consistency to
forma bite. Also, the tongue movements take place in forming a bite. The bite, which
resembling a stump, is moved backwards, by the tongue, through the throat. This is the final
stage of the right oral phase of swallowing [3,4].
The pharyngeal phase
The pharyngeal phase takes place 1 sec. This stage begins the reflexive part of
swallowing, whose receptors are most likely located in the region of palato-glossal bar and
palato-pharyngeal bar [3].
During this phase of swallowing the tongue, the soft palate, the hyoid bone with
attached muscles, the throat, the oesophagus and the larynx with the trachea create a
synergistic system. In the initial part of the pharyngeal phase, when the bite is possessed
through the isthmus of fauces, the throat is shortened as the result of the activity of directly
acting muscles (dorsal-pharyngeal muscles, palatopharyngeal muscles, pharyngeal levator
muscles, throat sphincter and stylohyoid muscles, digastric muscles, genialhyoid muscles,
thyroid muscles, mandibulohyoid muscles). They lift the hyoid bone and move the larynx up
and forward [5].
This phase is the most crucial during swallowing and is responsible for the transport of
the bite from the throat to the esophagus. At this stage the pressure of the root of the tongue
and throat’s muscles is used to transport the bite. The consequence of this process is the
closure of the larynx entrance as the result of protection against the food aspiration to the
respiratory tract, the relaxation of the upper esophageal sphincter muscle and simultaneous
passage of food into the esophagus [5,6].
There are significant processes during the pharyngeal phase of swallowing which
condition its correct course. It includes [5,7]:
a tongue displacement to the backward part of the throat to move the bite to the
laryngeal part the throat;
closing the nasal part of the throat by lifting the soft palate and contraction of the
backward part of the throat;
moving forward and upward the hyoid bone and the larynx to extend the entrance of
throat, esophagus and to pass the bite lower as the result of the suction force of the
lower throat.

What would your life look like if you could not swallow?
78
In addition, a breath inhibition and a simultaneous protection of the respiratory tract is
observed. It appears at three stages [5]:
a closure of the glottis;
a closure of the larynx (as a result of a close-up of vestibular folds, arytenoid
cartilages and an epiglottic base);
a backward inclination of the epiglottis.
Thanks to the gravity action, the strength of the tongue contraction, the peristalsis of
the throat sphincter, and the mechanism of the upper esophageal sphincter the mouthful
passage took place [4,5].
The oesophageal phase
This part of swallowing takes place from 5 to 20 sec. It is the result of a peristaltic
wave in the throat, which stimulates the receptors located in the mucosa of the mouth, the
throat and the esophagus [3].
The bite is transported from the upper oesophageal sphincter through the shaft, the
lower sphincter to the stomach. The oesophageal phase begins with a temporary pressure drop
in the pharyngoesophageal sphincter, which allows the bite passage from the throat to the
oesophagus. After that, there is a temporary pressure increase in the sphincter to prevent the
air flow from the throat to the oesophagus. Then the peristaltic wave begins, an travels
through the oesophagus - from the area with elevated pressure to the distally located region
with the lower pressure. It causes a characteristic changes in pressure called the swallowing
syndrome. The force of the oesophageal contraction at the wave site is relatively small and
increases as it moves towards the stomach. At the time of the wave passing through the lower
part of the oesophagus, the sphincter relaxes and the pressure drops, but never below the
pressure of the stomach [7].
The swallowing reflex
The prenatal period is not only a stage in which anatomical structures are shaped but
also functions and activities are developed. Swallowing is one of these activities. The child
already in the third month of fetal life opens and closes the mouth and as a result of these
movements gets and displaces the fetal water. These movements require breathing and
speaking after birth. It is worth to add, that through swallowing child gets to know what is the
taste, because amniotic fluid is contingent on mother’s diet. On this basic, we can say that

What would your life look like if you could not swallow?
79
taste is completely new experiences for the unborn baby. Swallowing is inseparably
associated with suction. After 36th
month of fetal life, suction is realized in completely and
coordinated way. Suction and swallow reflexes determined newborn survival [8].
In the context of swallowing, the development of the gastrointestinal tract and the
formation of its innervation in the prenatal period is worth analysing. The digestive tract is
formed around the fourth week of fetal life. During the following weeks, it develops and
grows in layers. Already in the second trimester of pregnancy, a woman can notice peristaltic
movements. At the end of the first month of fetal life, glial and neural cells appear, which
leads to the formation of the nervous system. The enteral nervous system is responsible for
the innervation of the stomach and intestines, and the proper functioning of the digestive
system. An integral part of the autonomic nervous system are the sympathetic nervous system
and the parasympathetic nervous system. They are important for swallowing, because their
fibres innervate the oesophagus. Oesophageal sphincters: upper and lower, are formed in the
eighth month of fetal life and at the moment of birth their sizes reach the size of not more than
1 cm [8].
Healthy newborns already after the birth have a mature mechanism of swallowing.
Newborns and infants during the act of eating have to coordinate sucking, swallowing and
breathing. It is significant mechanism in correct and fully valuable feeding process. It is worth
to remember that the external factors during feeding such as child’s behaviour, the mother’s
attitude or nurse’s attitude and the surrounding conditions should be appropriate [9].
Adults and children have the swallowing consciousness and desirabilit. In the neonatal
period, infants’ swallowing is inherently innate and reflexive. The swallowing reflex depends
partly on the human’s will, and partly is unconditional. In the first phase - the oral phase,
muscles coordinated by the motor region of the cerebral cortex cause preparation of a bite to
swallow, which we are fully aware of and do it on purpose. During swallowing, it is necessary
to stimulate the receptors of the tongue, the throat, the palate, which are associated with
sensory and motor nervous pathways. The next stages, the pharyngeal and the oesophageal
phases are independent of human will and we could not influence on them. The physiological
and normal swallowing reflex occurs in the so-called safe swallowing phase. It is
characterized by a temporary stop of breathing. This occurs after exhaling and before
inhaling. Healthy people, regardless of their age, have affective integration of sensory
feedback with centres responsible for sucking, swallowing and breathing in the brainstem
[3,10].
What would your life look like if you could not swallow?
80
The throat reflex severs an important role in the swallowing process. It is present in
the second phase of swallowing. It is associated with a proprioceptive feeling. The
mechanism of the throat reflex allows moving the food bite to the oesophagus in a precise
manner. It prevents the passage of food into the respiratory tract and nasal cavity [11].
The infantile swallowing
Swallowing is inseparable from the central nervous system, its maturation, and
formation, pattern settings and habits. However, anatomical factors associated with
development also actively participate in the process of swallowing. Therefore, the size and the
volume of the oral cavity is important. Teeth, their quality, and number take an active
participation in the swallowing process. Eating habits, the way of feeding, the food
consistency also affect swallowing [12,13].
The infantile swallowing occurs physiological in children and is transformed into a
mature swallowing up to 3 years of age. If it occurs in later years of life, it is called an
improper or a persistent swallowing. The mechanism that accompanies this type of
swallowing is characterized by the involvement of the muscles of the mouth, cheek and chin,
and also the specific arrangement of the tongue between the gums or teeth. The specificity of
the tongue's position is that the lateral edges of the tongue touch the mucous membrane
covering the cheeks, and the tip of the tongue touches the mucosa of the lower lip [12].
Mature, adult, somatic type of swallowing is formed in stages. It is conditioned by the
growth of the mouth, changes in the quality and the structure of the teeth. The mechanism of
the mature swallowing is characterized by the shortening of the dental arches and raising the
tongue tip to the front of the hard palate. There is also stabilization of the mandible through
the muscles of the masseter. Compared to infantile swallowing, the muscles of the mouth
margin, the buccal and the beard joints do not play a significant role here, and their activity is
insignificant in this case [12].
Mature swallowing is not just an act of transporting the bite to the digestive tract. The
activity of the muscles lifting the mandible and the correct position of the tongue affect the
physiological change in the bite, the proper development of the dental arches and the
assurance of functional and anatomical balance in the stomatognathic system [12,13].
An important role in the formation of the right swallowing pattern is food, its
consistency, form and texture. The child’s diet with overgrown incisors should contain liquid
and semi-liquid foods served with a spoon. Supportively, there is also the method of biting

What would your life look like if you could not swallow?
81
biscuit and bread crust. As more teeth appear, the diet should be expanded and includes
products that should be chewed. It is associated with proper setting of jaws against each other
and supporting the pattern of proper swallowing [12,13].
It is important that the sucking reflex, which the child needs at the beginning of life,
should physiologically disappear by the age of 18th
months. Therefore, it is a diet that forces
sucking, but ending in this developmental period does not disturb the right swallowing
process [13].
The essence of infantile swallowing problems at a later age is the inadequacy and the
disharmony of the muscular and nervous systems in the comparison to anatomical changes
related to the physiological development of the child. In contrast to masseter muscles,
muscles surrounding lips, cheeks, and mentum muscles have a major role in the muscle range.
The tongue position and function is also incorrect because the tongue lies between the dental
arches and it results in a posterior short circuit. The causes of the infantile swallowing are
mostly: the immaturity of the neuromotor system, the way of eating, the food consistency, the
prolongation of natural feeding [12,13].
Dysphagia
Swallowing disorders, or dysphagia (gr. dys - obstruction, phago - swallowing), is an
obstacle in formation of the mouthful and transport from the mouth to the stomach.
Dysphagia refers to a difficulty in swallowing - it takes more effort than normal to move food
from the mouth to the stomach. The disorder is classified under "symptoms and signs"
in ICD-10 as the R13.1 code, but it is sometimes used to describe a condition in its own right
[3].
Subjectively dysphagia manifests itself with a feeling of difficulty in swallowing,
objectively dysphagia is stated as an abnormalities in the mechanism of swallowing. In the
course of dysphagia the speed of swallowing food and the control over the saliva secretion are
disturbed. Also, the saliva leakage from the mouth, choking, a productive cough and returning
fluid from the nose are observed. These symptoms intensify over time and gradually lead to
the malnutrition, to the aspiration of secretions into respiratory tract or to the pneumonia [14].
People with dysphagia are sometimes unaware of having it. Swallowing disorders
usually develop unnoticed and initially mildly. Only the weight loss due to conscious
avoidance of food due to swallowing and choking disorders is the first tangible proof of the
existence this disorder [3,14].

What would your life look like if you could not swallow?
82
Depending on the location of the cause, there are three general types of dysphagia
[3,15]:
oral dysphagia (high dysphagia) - the problem is in the mouth, sometimes caused by
tongue weakness after a stroke, difficulty chewing food, or problems transporting food
from the mouth;
pharyngeal dysphagia - the problem is in the throat. Issues in the throat are often caused
by a neurological problem that affects the nerves (such as Parkinson's disease, stroke, or
amyotrophic lateral sclerosis);
oesophageal dysphagia (low dysphagia) - the problem is in the oesophagus. This is
usually because of a blockage or irritation. Often, a surgical procedure is required.
Patients diagnosed with oropharyngeal dysphagia have difficulties in swallowing
mainly liquids, rarely solid foods. The opposite situation is observed in patients with
mechanical obstruction, which dominates in the case of oesophageal dysphagia. Swallowing
disorders both solid foods and liquids are characteristic of motor disorders, developing slowly
over a period of several months. In turn, the consumption of cold fluids with the coexistence
of oesophageal spasm may lead to an increase in dysphagia [15].
The oropharyngeal dysphagia
It arises from abnormalities of muscles, nerves or structures of the oral cavity,
pharynx, and upper oesophageal sphincter. The patient loses the ability to form a bite, move it
towards the throat and has difficulties with the beginning of the swallowing act, which in
effect leads to the food retention in the oral cavity. These disorders are often accompanied by
cough, choking, feeding back through the nose and retching, which leads to the food
aspiration to the respiratory tract. The consequence of this process may be recurrent lung
inflammation. Sometimes the initial symptom of oropharyngeal dysphagia may be a feeling of
scratching in the throat, tearing, salivation, change of voice and speech, sneezing and a dry
cough [16].
The oropharyngeal dysphagia in 80% of cases is caused by neuromuscular disorders,
while 20% of cases are the structural changes. The neurogenic causes of swallowing disorders
are the result of changes located in different parts of the nervous system. The most common
causes of neurogenic dysphagia are complications of cerebrovascular disease, such as
ischemic stroke, intracerebral haemorrhage or embolism. Other common causes are
demyelinating diseases, brain tumours and changes following craniocerebral injuries [3,16].

What would your life look like if you could not swallow?
83
The oesophageal dysphagia
It is a form of dysphagia where the underlying cause arises from the body of the
oesophagus, lower oesophageal sphincter, or cardia of the stomach, usually due to
mechanical causes or motility problems. Characteristic symptoms are: feeling of a bite
retention when passing through the oesophagus, spreading and creasing behind the sternum
and sometimes chest pain occurring in the area corresponding to the location of the lesion in
the oesophagus [16].
The oesophageal dysphagia in about 85% of cases is associated with structural
disorders (mechanical disorders) such as: the oesophageal stricture (the most common cause
is the oesophageal and cardiac cancer), the oesophageal reflux disease in the form of
ulceration of the mucous membrane, erosions and inflammation leading to oesophagus’
scars, caustic burns (acids, alkalis), drugs (e.g. salicylates, quinidine), radiotherapy used to
treat the cancer located in the immediate vicinity of the oesophagus (the larynx, the thyroid)
[2,6].
Swallowing disorders can also occur as a result of trauma, perforation, and
oesophageal surgery. 15% of cases of oesophageal dysphagia are associated with primary or
secondary motor disorders. The primary motor disorders include: achalasia, characterized by
the increase of resting pressure of the lower oesophageal sphincter, the impairment of its
diastole, the lack of primary peristaltic wave of the oesophagus and the diffuse oesophageal
spasm (cardiospasm), involving the occurrence of strong muscles’ spasms at various levels
of the oesophagus that cause chest pain in the retrosternal area. In turn, secondary motor
disorders result in the connective tissue disease (scleroderma), diabetes, the
gastroesophageal reflux disease, the alcohol abuse and certain medications (e.g.,
phenothiazine and parasympatholytics) [2,14,16].
Causes of dysphagia
All causes of dysphagia are considered as differential diagnoses. Possible causes of
dysphagia include [2,3,15]:
amyotrophic lateral sclerosis - an incurable form of progressive neurodegeneration;
over time, the nerves in the spine and brain progressively lose function.
achalasia - lower oesophageal muscle does not relax enough to allow food into the
stomach.
diffuse spasm - the muscles in the oesophagus contract in an uncoordinated way.
What would your life look like if you could not swallow?
84
Stroke - brain cells die due to lack of oxygen because blood flow is reduced. If the
brain cells that control swallowing are affected, it can cause dysphagia.
oesophageal ring - a small portion of the oesophagus narrows, preventing solid foods
from passing through sometimes.
eosinophilic esophagitis - severely elevated levels of eosinophils (a type of white blood
cell) in the oesophagus. These eosinophils grow in an uncontrolled way and attack the
gastrointestinal system, leading to vomiting and difficulty with swallowing food.
multiple sclerosis - the central nervous system is attacked by the immune system,
destroying myelin, which normally protects the nerves.
myasthenia gravis (Goldflam disease) - the muscles under voluntary control become
easily tired and weak because there is a problem with how the nerves stimulate the
contraction of muscles. This is an autoimmune disorder.
Parkinson's disease and Parkinsonism syndromes - Parkinson's disease is a gradually
progressive, degenerative neurological disorder that impairs the patient's motor skills.
radiation - some patients who received radiation therapy (radiotherapy) to the neck and
head area may have swallowing difficulties.
cleft lip and palate - types of abnormal developments of the face due to incomplete
fusing of bones in the head, resulting in gaps (clefts) in the palate and lip to nose area.
scleroderma - a group of rare autoimmune diseases where the skin and connective
tissues become tighter and harden.
oesophageal cancer - a type of cancer in the oesophagus, usually related to either
alcohol and smoking, or gastroesophageal reflux disease (GERD).
oesophageal stricture - a narrowing of the oesophagus, it is often related to GERD.
xerostomia (dry mouth) - there is not enough saliva to keep the mouth wet.
Diagnosis of dysphagia
Diagnosis of dysphagia is a multi-stage process. It consists of an interview,
laryngological examinations, imaging examinations, sometimes the patient is examined for
neurological reasons [11].The general practitioner should focus on the ways of helping the
patient. This term improves the diagnostic and rehabilitation-therapeutic process [17].
The interview should include questions about feelings of impaired patency, aspiration
of food or fluids into the airways, presence of food in the nasal cavity while eating, feeling of

What would your life look like if you could not swallow?
85
lack of strength during eating, discouragement of food intake, pain during eating, drinking in
larynx, feeling an obstacle in the respiratory tract, discomfort, tightness to the respiratory
tract. The interview should also include questions about additional symptoms such as:
coughing, choking, difficulty in starting to speak, a distinct change in voice quality. Also the
dynamics of the problem, its duration, as well as previous operations, head and neck
treatments, diseases of the respiratory and digestive systems, thyroid and cardiovascular
disorder, and existing neurological problems have significant meaning. An additional element
that gives important information for the doctor are questions whether the patient can
determine the location of the problem [3,17].
The laryngological examination is an important subject. The focus should be on the
skills of the soft palate, the tongue and lips. The laryngologist should determine if the facial
muscle tension is not too big or too small, whether the mandible mobility is optimal and what
is the state of the oral cavity and the throat. During the laryngoscopic examination the
laryngologist pays attention to the condition of the lingual-epiglottic wells, pear-shaped pings
and the larynx vestibule. An ENT physician assesses whether saliva or food default in these
structures. In the glottis area, the back sections of the vocal folds are analysed [17].
After detailed interview specialists used screening questionnaires to clarify the
diagnosis. One of such questionnaires is the Eating Assessment Tool (EAT-10). It is a
questionnaire subject to validation on the population of people suffering from dysphagia
associated with neurological and non-neurological diseases as well as head and neck cancer.
The form of the interview makes it possible to see the severity of the patient's problem as well
as to monitor the symptoms. In practice, there are also swallowing screening tests aimed at
detecting aspiration. The principle of these tests consists of giving the patient a certain
amount of water and observing the patient's response [18].
The scales can be used to describe the magnitude of a patient's problem related to
dysphagia. One of them that the American Speech-Language-Hearing Society recommends is
the Swallowing Rating Test. On this scale, 0 means no testing due to the patient's large
problem of food and liquids aspiration and other accompanying symptoms. However, 7 is the
highest grade and at this level patient has no swallowing problems in any situation. Dysphagia
Severity Rating Scale is another scale for the diagnosis of dysphagia. It is used as an auxiliary
form of describing the diffusion during videofluoroscopy. In it, 0 is described as the normal
swallowing, in which there are no disturbances. However, 6 is defined as an order to abandon
the oral nutrition, because more than 10% of food is aspirated regardless of their consistency
[10].

What would your life look like if you could not swallow?
86
Developing diagnostics of swallowing and speech disorders in dysphagia are also
complemented and conducted by the neurologopedics. By conducting an accurate interview
and applying appropriate questionnaires for assessing patient's problems, a neurologist can
propose therapeutic and rehabilitation methods [19].
One of the diagnostic methods of dysphagia is endoscopy of the upper gastrointestinal
tract, also called gastroscopy or Esophago-Gastro-Duodenoscopy. It is used in the assessment
of the mucosa of the esophagus and the stomach. It allows finding the organic causes of
swallowing problems. Another method of diagnosis is videofluoroscopy, which allows
determining the anatomy and physiology of the mouth and the throat when the patient
swallows fluids and foods of different consistency [20]. Fluids and foods are mixed up with a
countermeasure to illustrate the act of swallowing. During the examination, a film recorded
and analyzed later. The ultrasound examination can assess the function of the tongue,
especially its posterior part, and the hyoid bone that is involved in swallowing, hovering and
shortening of the digestive tract. The manometry is used to examine the pressure in the
esophagus and in the area of its the upper and lower sphincter. The common imaging studies
such as the roentgenography, the computed tomography, the magnetic resonance imaging are
used to diagnose organic changes in the digestive or respiratory tract conducive to dysphagia
[3,8].
Summary
To sum up, the swallowing act is a very complicated process which requires the
coordination of many anatomical structures. It engages the nervous system to right and
mature swallow. This process is independent of human’s will and without it, human’s life will
be very tough. Swallowing disorders may lead to severe complications and that’s the way the
detailed diagnosis is so significant in the treatment and the rehabilitation.
References
1. Stręka P.: Diagnostyka dysfagii ustno-gardłowej. Terapia, 2002, 10,2, 12-15 (Polish).
2. Stępniak A.: Zaburzenia żucia i połykania u osób dorosłych – doniesienia z badań
własnych. Logopaedica Lodziensia, 2017, 1, 127-143 (Polish).
3. Tomik J, Solowska B.: Zaburzenia połykania. Neurolingwistyka Praktyczna, 2015, 1,
27-41 (Polish).
What would your life look like if you could not swallow?
87
4. Ertekin C, Aydogdu I.: Neurophysiology of swallowing. Clinical Neurophysiology,
2003, 114,12, 2226-2244.
5. Paik N.J, Kim S.J, Lee H.J, Jeon JY, Lim JY, Han TR..: Movement of the hyoid bone
and the epiglottis during swallowing in patients with dysphagia from different
etiologies. Journal of Electromyography & Kinesiology, 2008, 18,2, 329-335.
6. Schultheiss C, Nusser-Muller-Busch R, Seidl R.O.: The semisolid bolus swallow test
for clinical diagnosis of oropharyngeal dysphagia: a prospective randomised study.
European Archives of Oto-Rhino-Laryngology, 2011, 268, 12, 1837-1844.
7. Lampart-Busse M.: Połykanie – etiologia i wpływ na artykulację. Logopeda.
Czasopismo Internetowe, 2007, 4, 132-136 http://www.logopeda.org.pl/resources/
pliki/67_logopeda___nr_4.pdf, data pobrania 20.04.2018 (Polish).
8. Więcek S., Woś H., Grzybowska-Chlebowczyk U.: Zaburzenia połykania u niemowląt
i dzieci. [w:] Studia z logopedii i neurologopedii. Nowakowska-Kempna I. (red.).
Wyd. WAM, Kraków, 2012, 13-31 (Polish).
9. Kaczmarek L.: Okresy kształtowania się mowy dziecka. [w:] Nasze dziecko uczy się
mowy. Kruszelnicka Z. (red.). Wyd. Lubelskie, 1977, 49-55 (Polish).
10. Litwin M.: Logopedyczna terapia zaburzeń połykania w chorobach neurologicznych.
Logopeda, 2019, 1,7, 126-138 (Polish).
11. Mielnik-Niedzielska G.: Dysfagia u dzieci. Otorynolaryngologia, 2016, 15,2, 63-67
(Polish).
12. Łuszczuk M.: Czynnościowe uwarunkowania zaburzeń artykulacji. [w:] Interakcyjne
uwarunkowania rozwoju i zaburzeń mowy. Michalik M., Siudak A., Pawłowska-Jaroń
H. (red.). Collegium Columbium, Kraków, 2013, 2019-220. (Polish).
13. Kaszak A., Kaszak M., Peradzyńksa J.: Lekarz dentysta i lekarz pediatra –
współdziałanie w zapobieganiu i wczesnym diagnozowaniu problemów zdrowotnych
narządu żucia. Nowa Pediatria, 2017, 2, 69,73 (Polish).
14. Dobrzyński P, Chęciński P.: Zaburzenia połykania (dysfagia). Terapia, 2001, 1,35-38.
(Polish).
15. Logemann J.A.: Swallowing physiology and pathophysiology. Otolaryngologic
Clinics of North America, 1988, 21,4, 613-623.
16. Spieker M.R.: Evaluating dysphagia. American Family Physician, 2000, 61,12, 3639-
3648.

What would your life look like if you could not swallow?
88
17. Wiskirska-Woźnica B.: Zaburzenia połykania w praktyce lekarza rodzinnego. Nowa
Medycyna, 2000, 3, http://www.czytelniamedyczna.pl/1282,zaburzenia-polykania-w-
praktyce-lekarza-rodzinnego.html, data pobrania 23.04.2018 (Polish)
18. Palmer J.B., Drennan J.C., Baba M.: Evaluation and treatment of swallowing
impairments. American Family Physician, 2000, 61,8, 2453-2462.
19. Czernuszenko A.: Postępowanie w dysfagii neurogennej. Otorynolaryngologia, 2016,
15,2, 68-74
20. Chmielewska J., Jamróz B., Gibiński K., Sielska-Badurek E., Milewska M., Niemczyk
K.: Badanie wideof luoroskopowe – procedura badania z oceną kwestionariuszową.
Polski Przegląd Otorynolaryngologiczny, 2017, 6, 1, 12-20.

Does believ in God heals
89
Does believing in God heals
Lis Adrian1, Rogoziński Tomasz
1, Szewczyk Alina
1, Wijata Klaudia
1, Ferenc Stanisław
1,2,
Dorna Krzysztof3, Paprocka-Borowicz Małgorzata
1,2, Gnus Jan
1,2
1. Uniwersytet Medyczny im. Piastów Śląskich we Wrocławiu, Wrocław
2. Ośrodek Badawczo-Rozwojowy, Wojewódzki Szpital Specjalistyczny we Wrocławiu,
Wrocław
3. Papieski Wydział Teologiczny we Wrocławiu, Wrocław
Introduction
In The Book of Exodus God says: “If you listen carefully to the Lord your God and
do what is right in his eyes, if you pay attention to his commands and keep all his decrees, I
will not bring on you any of the diseases I brought on the Egyptians, for I am the Lord, who
heals you” [1]. There are more such promises and messages in the Old Testament. Also, the
New Testament gives many examples of the healing power of faith. For instance, a woman
who suffered from bleeding for twelve years was healed when she touched the cloak of Jesus.
Words of Jesus were: “Daughter, your faith has healed you. Go in peace and be freed from
your suffering” [2].
Over two thousand years have passed since these events. Today, in the era of
evidence-based medicine, it is not possible to make general conclusions on the basis of
individual cases. Question asked in the title of the article is, of course, too vague and – in case
of scientific research – should be reformulated. But is it possible to scientifically investigate
relations between faith in God and human health? The answer to this question is, at least in
part, affirmative. These associations have been studied since 1897 when Emile Durkheim
pointed that being religious might lower a risk of suicide. [3] Over the years, many magazines
publishing religion and health issues have been created –“Journal of Religion and Health”,
“Journal of Religion, Disability, and Health”; “Spirituality and Aging”; “Mental Health,
Religion, and Culture” among others. The issue of the link between religion and health has
even got its own handbook– created by Koenig, McCullough, and Garson „Handbook of
Religion and Health.” [4] Almost 30 medical schools in the United States of America offer
courses on religion, spirituality, and health [5].

Does believ in God heals
90
The purpose of this article is to present selected scientific publications to answer the
question – whether broadly understood faith in God, religiosity, and spirituality might be
related to human health.
Religious people and psychiatric diseases
The majority of studies dedicated to the relationship between religiosity and health
focus mainly on mental health. In 2001 Mueller et al. [6] provided very valuable metaanalysis
of publications on religiosity and health written between 1970 and 2000. It contained over
1200 studies, that mostly concerned spiritual health, which indicates a particularly strong
relationship between religion and mental component of wellness. Available publications show
that majority of analyzed observational studies find lower rates of depressive disorder and
fewer depressive symptoms among the more religious. [7, 8]. Also longitudinal studies tend to
show that greater religiousness is associated with lower depression severity or faster
remission of symptoms at follow-up. The bulk of the few randomized controlled trials found
that so-called religious-based psychological interventions result in faster symptom
improvement, compared with secular-based therapy or with control subjects. [9] Substantially,
link between being religious and prevalence of depression or coping with depression appears
to be markedly expressed in severely ill subjects. Koenig compared group of 1000 depressed
in-patients suffering from congestive heart failure or chronic pulmonary disease with 428
non-depressed patients. In the first group there were more patients with no religious affiliation
and less subjects that do pray or read religious scriptures. These associations remained
significant after controlling for social and physical health as well as demographic factors.
Moreover, severity of depression was inversely related to religious factors. [10] One of
prospective studies was conducted in Netherlands on 177 persons between 55 and 89 years. It
revealed that self-reported religious salience is associated with less risk of depression and
more effective recovery from depression. [11] These results are consistent with outcomes of
other studies that show significant association between intrinsic religiosity and likelihood of
remission from depression, even after adjustment for potential confounding factors. [12-15]
Interesting thing is, that attendance at religious services itself may be associated with
depression prevalence. Oman and Reed [16] performed a study in which, they divided
subjects on people who attend religious services weekly and those who do it only occasional
or never. It was displayed that in first group prevalence of depression was lower in man (4.7
vs 6.7%; p<0.05) but not in woman. In the context of treatment of depressive disorders, there

Does believ in God heals
91
is an evidence, that therapy of religious patients is more efficient if contains religious content
or even consists of pastoral care alone. [17-18]
There are also studies that display no association between religious involvement and
depression course, although these are in minority. For example in McCullough [19] analysis
only 5 of 29 studies revealed no association, whereas Koenig reported that among 93 studies –
34 found no relationship. [9] In 4 publications authors suggested that religious people are at
higher risk of depression.
Also, other mental disorders seem to be modified by religiosity. As mentioned before,
first research on the suicide and religion was conducted in 1897 by E. Durkheim and it
showed an inverse relationship between them. Of the 68 studies analyzed by Koenig et al. 57
reported lower rates of suicide among the more religious, 9 displayed no connection and 2
showed inconsistent results. [4] Available studies mostly show that self-reported religiosity,
attendance at religious services, religious involvement or belief In God are negatively related
to suicide risk, acceptance or ideation. [6] Prospective studies provide an evidence for
protective effect of religion in this issue. Consistent results are observed in different
populations, including North America [20, 21], Israel [22] and western countries [23]. In
Christianity and many other religions suicide is a severe sin and therefore lower suicide rates
in religious people are expected. Partially because of the value system of believers, but is it
the only reason? So far this question remains unanswered.
Another mental condition worth discussing is anxiety. In a review of nearly 70 cross-
sectional and longitudinal studies Koenig concludes that religious involvement is linked to
less fear and anxiety. [4] However, later he points out that anxiety itself is a strong factor that
motivates to religious activity – when people are scared or anxious, they pray more. That is
the reason why cross-sectional studies should not be interpreted in case of religion and
anxiety connection. It is better to focus on longitudinal studies or randomized controlled trials.
Among 7 of the latter, analyzed by Koenig, 6 studies showed greater efficiency of religious
than secular interventions in religious patients suffering from anxiety. [9]
A separate issue is death anxiety. Interesting study was provided by Wink and Scott in
2005. [24] 155 subjects were followed for nearly 30 years to establish the influence of
religiosity on fear of death. No linear relations between religiousness and fear of death and
dying were found. Interestingly, the moderately religious subjects feared death the most. High
and low score on religiousness were associated with less anxiety. Nevertheless, other studies
displayed that religiosity in terminally ill patients is related to better frame of mind and
greater acceptance of death. [25, 26]

Does believ in God heals
92
Religion itself is a kind of signpost indicating ethical way of living. Therefore, it
probably will not surprise that plenty of studies reported that religious people use alcohol
and/or other drugs less often than others. This association has already been demonstrated in
1976 [27] and then confirmed in other studies in different populations. [4, 28-30] Low
religiousness is more often reported in drug and alcohol addicted people. [31] As in other
mental conditions, also in alcoholism spiritually based therapy brings better results than the
conventional one. [32] These associations seem to be specifically expressed in groups of
younger people. [33, 34]
Psychotic disorders and its relations with religion are of special interest in psychiatric
health care. Religious delusions might be a sign of psychiatric illness, especially
schizophrenia. [35] This raises the question of whether religious beliefs stand in the
etiological basis of schizophrenia and other mental illnesses. There is a lack of data on this
issue and results of available studies are inconsistent. Some display that religious delusions in
schizophrenia are associated with more severe symptoms, longer duration of disorder, more
intensive treatment, worse long-term prognosis and greater functional disability, although
others suggest that in patients with psychotic disorders ordinary religious activity, such as
regular church attendance, improves prognosis. [9] These discrepancies probably result from
differences in classification schemes, a common problem in religiosity studies.
Religiosity and cardiovascular diseases
Hypertension is one of the most common diseases in the modern world. Data have
been accumulated that religious people have lower blood pressures and in this group
hypertension occurs less frequently. [6].
Interestingly, it is probably attending at religious or spiritual practices that lowers
blood pressure. Koenig et al. divided subjects into two groups – frequent attenders of religious
services (at least once a week) and infrequent attenders. After adjustment for confounding
factors, such as sex, age, education, ethnicity and previous blood pressure in the first group
lower values of systolic and diastolic blood pressure were observed. Also prayer and other
individual religious activities were associated with lower rates of diastolic hypertension. [36]
Similar observations were made also by other authors. [37, 38]
Data from many studies indicate that religious activity is associated with lower rates of
cardiovascular diseases. There were few publications concerned Jewish persons which

Does believ in God heals
93
displayed lower risk of fatal coronary heart disease and myocardial infarction in Orthodox
patients after adjustment for confounding factors. [39, 40]
Other diseases
It has been shown that religious activity in people is related to many health-promoting
behaviors. This association was found among others in smoking cessation, proper nutrition,
seat belt use, physical exercise and use of preventive services. [6] Moreover, people with
greater religiosity cope better with illness, suffer and serious impairment than others. [41, 42]
Riley et al. [43] showed that in persons with chronic diseases, religiosity is associated with
higher levels in health-related quality of life index (HRQOL). Population consisted of
inpatients suffering from breast cancer, prostate cancer, spinal cord injury postpolio and
amputation.
Mortality
There are plenty of studies concerning relationship of religiosity and mortality. In a
great majority they present consistent results indicating that religious involvement is
associated with lower mortality, both in the general population and in some particular groups.
In 1997 Strawbridge et al. [44] announced results of large longitudinal study in which
5286 people were observed for 28 years. Study showed that frequent attendance at religious
services (at least once a week) reduced mortality in this group by 23%. Noteworthy, results
were adjusted for confounding factors, such as gender, age, ethnicity, body mass index,
education, religious affiliation, chronic conditions, mobility impairment, perceived health and
depression. One year later Oman and Reed [3] published results of their study based on 5-year
observation of 1931 subjects. The purpose of the study was – once again – to establish
whether attendance at religious services was associated with lower risk of death and whether
potential confounding factors could explain observed differences. Considered factors were
demographics, health habits, social functioning and support, and physiological state. Study
revealed that subjects who attended religious services regularly exhibited lower mortality than
persons who did not (HR=0.64; 95% CI=0.52-0.78). After multivariate adjustment this
relationship abated, however remained substantial (HR=0,76; 95% CI=0.52-0.94). Of the note,
religious attendance appeared to be more protective for people with high social support.

Does believ in God heals
94
Another year later Hummer et al. [45] presented results of their study conducted on
larger population of over 22 thousand subjects followed for nine years. Once again, it
revealed significant correlation between religious involvement - defined as attendance at
church or worship service – and all-cause mortality. After control for demographic, socio-
economic, health, behavioral and social variables subjects who attend services more than once
a week were identified with the lowest risk of death, whereas people who never attend at any
religious service exhibited the highest risk. Finally, after another year large metaanalysis of
42 independent studies on this issue was published [46].
It included a total number of nearly 126 thousand people and concluded that subjects
who scored higher on measures of religious involvement (such as religious attendance,
membership in religious groups, finding strength from religious beliefs or religious
orthodoxy) had 29% higher odds of survival than those who scored lower. Of 18 studies
analyzed by Mueller et al. [1] only 1, did not display significant relationship between
religious involvement and mortality.
Can we trust the studies?
It is essential to remember that research concerning spirituality, religion and related
aspects of human living cannot be interpreted directly. First of all, there is always problem
with definitions. How does one asses if one is religious? How to distinguish spirituality and
religiosity? How to measure religiosity? In most of studies authors give an information about
used definitions and tools, which have to be carefully read before assessing results. In an
article published in prestige New England Journal of Medicine Sloan et al. listed most
frequent methodological objections [47].
As they indicate – most of studies assessing an effect of religion on health were based
on church attendance, disregarding other religious activities. They also point out a little
number of randomized research, although it is obvious that randomized trial in case of
religion would be very difficult to conduct and highly problematic. Another issue is
generalizing results obtained in particular circumstances. For example, studies indicating that
patients would like to have their spirituality and religiosity to be considered in clinical
medicine generally are conducted in family practice, where relationship of patients and
physicians are closer. Therefore these results should not be easily extrapolated to all medical
fields.

Does believ in God heals
95
Should religion be a point of interest for physicians?
The above-mentioned research indicates that religion is important in human morbidity,
disregarding the causes and mechanisms of this association. In the modern world there is an
opinion that the physicians should not consider religious life of their patients. This is probably
due to the prohibition of religious discrimination. However, more than three quarters of
hospitalized patients would like their physicians to consider their spiritual needs and up to
48% of patients wish their doctors to pray with them [48].
Regarding relevant association of religious practices and human health, a question
might be raised – is it possible to enhance conventional therapy with spiritual interventions in
some selected cases? Results of mentioned studies on mental disorders give an affirmative
answer to that question. In opinion of some authors spiritual history of patients should be
considered as a family history, as it can impact course of disease and general condition of
patient. Puchalski et al. proposed special scheme that can be used to remember what should
be asked in a spiritual history of the patients, known by the acronym of FICA (Faith,
Importance, Community, Address) [49].
Anandarajah and Hight introduced another tool, which ought to help doctors to assess
spiritual and religious sphere of patient lives – HOPE questionnaire [50]. H letter stand for
sources of hope, strength, comfort, meaning, peace, love and connection, O for the role of
organized religion for the patient, P for personal spirituality and practices and the E letter for
effects on medical care and end-of-life decisions. On the other hand, there is plenty of factors
associated with better health, like marriage [51, 52] or early childbearing [53, 54], that will
rather not be recommended by physician though. Among American physicians only 6% think
that religion and spirituality often change “hard” medical outcomes, however more ten half of
them believe that these factors have much or very much influence of health. [55] Mueller et al.
claim that doctors should take religiosity and spirituality of their patients into account,
reminding that it enhances good relationship between them, regardless of its impact on health
[1]. On the other hand, Sloan et al. [47] remind that religion should not be trivialized and used
instrumentally by medicine since it exists in a different domain and is qualitatively different.
They also suggest that scientific evidence in this matter is not convincing enough. In a
conclusion – there is a lot of data suggesting that in selected cases religiosity is associated
with better outcome, however a question – is it a causal association and whether physicians
should prescribe religious activities or not – remains unsolved.

Does believ in God heals
96
References
1. Holy Bible, Old Testament, Exodus 15:26
2. Holy Bible, New Testament, Mark 5:34
3. Durkheim E.: On Suicide, Penguin Books, London, 2006.
4. Koenig HG, McCullough ME, Larson DB: Handbook of Religion and Health. Oxford
University Press, New York, 2001.
5. Levin JS, Larson DB, Puchalski CM. Religion and spirituality in medicine: research
and education. JAMA, 1997,278,792-793.
6. Mueller PS, Plevak DJ, Rummans TA. Religious Involvement, Spirituality, and
Medicine: Implications for Clinical Practice. Mayo Clinic Procedeedings, 2001,76,
1225-1235.
7. Koenig H.G., Larson D.B.: Religion and mental health: Evidence for an association.
International Review of Psychiatry, 2001,13,67–78.
8. McCullough ME, Larson DB. Religion and depression: a review of the literature.
Twin Research, 1999, 2,126-136.
9. Koenig HG.: Research on Religion, Spirituality, and Mental Health: A Review. The
Canadian Journal of Psychiatry, 2009,54, 5,283-292.
10. Koenig HG.: Religion and depression in older medical inpatients. The American
Journal of Geriatric Psychiatry, 2007,15,282–291.
11. Braam AW, Beekman AT, Deeg DJ, Smit JH, van Tilburg W.: Religiosity as a
protective or prognostic factor of depression in later life: results from a community
survey in The Netherlands. Acta Psychiatrica Scandinavica. 1997,96,199-205.
12. Koenig HG, George LK, Peterson BL. Religiosity and remission of depression in
medically ill older patients. The American Journal of Psychiatry. 1998,155,536-542.
13. Ronneberg CR, Miller EA, Dugan E, Porell F. The Protective Effects of Religiosity on
Depression: A2-Year Prospective Study. The Gerontologist, 2014, 1–12.
14. Koenig HG.: Religion and remission of depression in medical in patients with heart
failure/pulmonary disease. The Journal of Nervous and Mental Disease,
2007,195,389–395.
15. Koenig HG, Cohen HJ, Blazer DG, et al. Religious coping and depression among
elderly, hospitalized medically ill men. The American Journal of Psychiatry,
1992,149,1693–1700.
Does believ in God heals
97
16. Oman D, Reed D. Religion and mortality among the community-dwelling elderly. The
American Journal of Public Health, 1998, 88, 10, 1469-1475.
17. Propst LR, Ostrom R, Watkins P, Dean T, Mashburn D. Comparative efficacy of
religious and nonreligious cognitive-behavioral therapy for the treatment of clinical
depression in religious individuals. The Journal of Consulting and Clinical Psychology,
1992,60,94-103.
18. Razali SM, Hasanah CI, Aminah K, Subramaniam M. Religious– sociocultural
psychotherapy in patients with anxiety and depres- sion. Journal of The Royal
Australian and New Zealand College of Psychiatrists, 1998, 32, 867-872.
19. McCullough ME, Larson DB. Religion and depression: a review of the literature.
Twin Research, 1999, 2, 126-136.
20. Comstock GW, Tonascia JA. Education and mortality in Wash- ington County,
Maryland. Journal of Health and Social Behavior,1977,18,54-61.
21. Neeleman J, Wessely S, Lewis G: Suicide acceptability in African and white
Americans: the role of religion. The Journal of Nervous and Mental Disease, 1998,
186,12-16.
22. Kark JD, Shemi G, Friedlander Y, Martin O, Manor O, Blondheim SH. Does religious
observance promote health? mortality in secular vs religious kubbutzim in Israel.
American Journal of Public Health, 1996,86,341-346.
23. Neeleman J, Halpern D, Leon D, Lewis G: Tolerance of suicide, religion and suicide
rates: an ecological and individual study in 19 Western countries. Psychological
Medicine, 1997, 27, 1165-1171.
24. Wink P, Scott J. Does religiousness buffer against the fear of death and dying in late
adulthood? Findings from a longitudinal study. The Journals of Gerontology Series B ,
Social Sciences, 2005, 60B, 207–214.
25. Matthews DA, McCullough ME, Larson DB, Koenig HG, Swyers JP, Milano MG:
Religious commitment and health status: a review of the research and implications for
family medicine. Archives of Family Medicine, 1998, 7, 118-124.
26. Alvarado KA, Templer DI, Bresler C, Thomas-Dobson S: The relationship of religious
variables to death depression and death anxiety. Journal of Clinical Psychology, 1995,
51, 202-204.
27. Gorsuch RL, Butler MC: Initial drug abuse: a review of predisposing social
psychological factors. Psychological Bulletin, 1976, 83, 120-137.

Does believ in God heals
98
28. Oleckno WA, Blacconiere MJ. Relationship of religiosity to wellness and other
health-related behaviors and outcomes. Psychological Reports, 1991, 68, 819-826.
29. Wallace JM Jr, Forman TA. Religion’s role in promoting health and reducing risk
among American youth. Health Education & Behavior, 1998,25,721-741.
30. Gartner J, Larson DB, Allen GD: Religious commitment and mental health: a review
of the empirical literature. The Journal of Psychology and Theology, 1991, 19, 6-25.
31. Miller WR: Researching the spiritual dimensions of alcohol and other drug problems.
Addiction, 1998, 93, 979-990.
32. Project MATCH Research Group. Matching Alcoholism Treat- ments to Client
Heterogeneity: project MATCH posttreatment drinking outcomes. Journal of Studies
on Alcohol and Drugs, 1997;58:7-29
33. Sussman S, Skara S, Rodriguez Y, et al. Non drug use- and drug use-specific
spirituality as one-year predictors of drug use among high-risk youth. Substance Use
& Misuse. 2006, 41,1801–1816.
34. White HR, McMorris BJ, Catalano RF, et al. Increases in alcohol and marijuana use
during the transition out of high school into emerging adulthood. Journal of Studies on
Alcohol, 2006,67,810–822.
35. Krzystanek M, Krysta K, Klasik A, Krupka-Matuszczyk I. Religious content of
hallucinations in paranoid schizophrenia.Psychiatr Danub. 2012; 24 Suppl 1:S65-69.
36. Koenig HG, George LK, Hays JC, Larson DB, Cohen HJ, Blazer DG. The relationship
between religious activities and blood pres- sure in older adults. The International
Journal of Psychiatry in Medicine, 1998,28,189-213.
37. Walsh A. Religion and hypertension: testing alternative explanations among
immigrants. The Journal of Behavioral Medicine, 1998,24,122-130.
38. Hixson KA, Gruchow HW, Morgan DW. The relation between religiosity, selected
health behaviors, and blood pressure among adult females. Preventive Medicine
Journal, 1998, 27, 545-552.
39. Friedlander Y, Kark JD, Stein Y. Religious orthodoxy and myocardial infarction in
Jerusalem - a case control study. The International Journal of Cardiology, 1986,10,33-
41.
40. Goldbourt U, Yaari S, Medalie JH. Factors predictive of long- term coronary heart
disease mortality among 10,059 male Israeli civil servants and municipal employees: a
23-year mortality follow-up in the Israeli Ischemic Heart Disease Study. Cardiology,
1993,82,100-121.

Does believ in God heals
99
41. Matthews DA, McCullough ME, Larson DB, et al.: Religious commitment and health
status: a review of the research and implications for family medicine, The Archives of
Family Medicine,1998, 7, 118-124.
42. Idler EL, Kasl SV: Religion among disabled and nondisabled persons, II: attendance at
religious services as a predictor of the course of disability. The Journals of
Gerontology Series B , Social Sciences,1997, 52, 306-316.
43. Riley BB, Perna R, Tate DG, Forchheimer M, Anderson C, Luera G.: Types of
spiritual well-being among persons with chronic illness: their relation to various forms
of quality of life. The Archives of Physical Medicine and Rehabilitation,1998, 79,
258-264.
44. Strawbridge WJ, Cohen RD, Shema SJ, Kaplan GA. Frequent attendance at religious
services and mortality over 28 years. The American Journal of Public Health,
1997,87,6,957-961.
45. Hummer RA, Rogers RG, Nam CB, Ellison CG. Religious Involvement and U . S .
Adult Mortality. Demograpphy, 1999,36,2,273-285.
46. McCullough ME, Hoyt WT, Larson DB, et al.: Religious involvement and mortality: a
meta-analytic review. Journal of Health Psychology, 2000,19, 211-222.
47. Sloan RP, Bagiella E, VandeCreek L, et al.: Should physicians prescribe religious
activities? The New England Journal of Medicine, 2000, 342, 1913-1916.
48. King DE, Bushwick B. Beliefs and attitudes of hospital inpatients about faith healing
and prayer. The Journal of Family Practice, 1994,39,349-352.
49. Puchalski C.M., Romer L.: Taking a Spiritual History Allows Clinicians to
Understand Patients More Fully, Journal of Palliative Medicine, 2000, 3, 129–137,
50. Anandarajah G., Hight E.: „Spirituality and Medical Practice: Using the HOPE
Questions as a Practical Tool for Spiritual Assessment, American Family Physician,
2001, 63, 81–89
51. Ebrahim S, Wannamethee G, McCallum A, Walker M, Shaper AG. Marital status,
change in marital status, and mortality in middle-aged British men. The American
Journal of Epidemiology,1995,142,834-842.
52. Adler NE, Boyce T, Chesney MA, Cohen S, Folkman S, Kahn RL, Syme SL.:
Socioeconomic status and health: the challenge of the gradient. The American
psychologist, 1994,49,15-24.

Does believ in God heals
100
53. Ramon JM, Escriba JM, Casas I, Benet J, Iglesias C, Gavalda L, Torras G, Oromi J.:
Age at first full-term pregnancy, lactation and parity and risk of breast cancer: a case-
control study in Spain. The European Journal of Epidemiology,1996,12,449-453.
54. Lambe M, Thorn M, Sparen P, Bergstrom R, Adami HO. Malignant melanoma:
reduced risk associated with early childbearing and multiparity. Melanoma Research,
1996,6,147-153.
55. Curlin F.A., Sellergren S.A., Lantos J.D., Chin M.H.: „Physicians’ Observations and
Interpretations of the Influence of Religion and Spirituality on Health”, Archives of
Internal Medicine, 2007, 167,7, 649–654.

101
CONTENS
Krajewska-Kułak Elżbieta, Hatzopulu Aantigoni, Shpakou Andrei,
Sengupta Pallav, Kułak Wojciech, Łukaszuk Cecylia, Lewko Jolanta, Cybulski
Mateusz, Guzowski Andrzej, Kowalczuk Krystyna, Jankowiak Barbara,
Kowalewska Beata, Kondzior Dorota,. Rolka Hanna, Baranowska Anna, Lankau
Agnieszka, Klimaszewska Krystyna, Sierakowska Matylda, Krajewska-Ferishah
Katarzyna, Szyko-Perłowska Agnieszka: Comparison Validation Polish, Greece,
Belarus Version of the Trust in Physician Scale……………………………………..
10-25
Fiega Ewa, Krajewska-Kułak Elżbieta, Wysokiński Mariusz,
Karczewski Jan, Chilińska Joanna Zofia, Tomaszewska Bożena: Burnout
syndrome and job satisfaction among the female staff of Regional Hospital in
Łomża…………………………………………………………………………………..
26-41
Czerżyńska Magdalena, Wójcik Elżbieta, Mroczek Tomasz, Skalski
Janusz H: Results of surgical treatment of aortic coarctation in children: comparison
of different materials………………………………………………... ..………………
42-48
Brzychczy Maciej, Markiewicz Natalia, Szymocha Marcin, Turniak
Michał, Kurzelewska-Sobczak Anna, Paprocka-Borowicz Małgorzata, Gnus Jan:
Futile therapy in infants - a problem yet to be solved…………………………………..
49-62
Fedorowicz Sebastian, Szpytko Szymon, Augustynek Paweł,
Kurzelewska-Sobczak Anna, Ferenc Stanisław, Paprocka-Borowicz Małgorzata,
Gnus Jan: Review of methods for breaking bad news………………………………….
63-75
Mystkowska Ewelina, Pipiro Julia Natalia, Harasim-Piszczatowska
Emilia: What would your life look like if you could not swallow?..................................
76-88
Lis Adrian, Rogoziński Tomasz, Szewczyk Alina, Wijata Klaudia,
Ferenc Stanisław, Dorna Krzysztof, Paprocka-Borowicz Małgorzata, Gnus Jan:
Does believ in God hals………………………………………………………………….
89-100