Embed Size (px)
Citation preview

REVIEW
Challenges of molecular nutrition research 6: the nutritionalphenotype database to store, share and evaluate nutritionalsystems biology studies
Ben van Ommen • Jildau Bouwman • Lars O. Dragsted • Christian A. Drevon •
Ruan Elliott • Philip de Groot • Jim Kaput • John C. Mathers • Michael Muller •
Fre Pepping • Jahn Saito • Augustin Scalbert • Marijana Radonjic • Philippe Rocca-Serra •
Anthony Travis • Suzan Wopereis • Chris T. Evelo
Received: 12 October 2009 / Accepted: 3 January 2010 / Published online: 3 February 2010
� The Author(s) 2010. This article is published with open access at Springerlink.com
Abstract The challenge of modern nutrition and health
research is to identify food-based strategies promoting life-
long optimal health and well-being. This research is complex
because it exploits a multitude of bioactive compounds
acting on an extensive network of interacting processes.
Whereas nutrition research can profit enormously from the
revolution in ‘omics’ technologies, it has discipline-specific
requirements for analytical and bioinformatic procedures. In
addition to measurements of the parameters of interest
(measures of health), extensive description of the subjects of
study and foods or diets consumed is central for describing
the nutritional phenotype. We propose and pursue an infra-
structural activity of constructing the ‘‘Nutritional Pheno-
type database’’ (dbNP). When fully developed, dbNP will be
a research and collaboration tool and a publicly available
data and knowledge repository. Creation and implementa-
tion of the dbNP will maximize benefits to the research
community by enabling integration and interrogation of data
B. van Ommen (&) � J. Bouwman � M. Radonjic � S. Wopereis
TNO Quality of Life, PO Box 360, 6700 AJ Zeist,
The Netherlands
e-mail: [email protected]
J. Bouwman
e-mail: [email protected]
M. Radonjic
e-mail: [email protected]
S. Wopereis
e-mail: [email protected]
L. O. Dragsted
Institute of Human Nutrition, University of Copenhagen,
30 Rolighedsvej, 1958 Frederiksberg C, Denmark
e-mail: [email protected]
C. A. Drevon
Department of Nutrition, Institute of Basic Medical Sciences,
Faculty of Medicine, University of Oslo, Oslo, Norway
e-mail: [email protected]
R. Elliott
Institute of Food Research, Norwich Research Park, Norwich,
Norfolk NR4 7UA, UK
P. de Groot � M. Muller
Nutrigenomics Consortium, TI Food and Nutrition,
P.O. Box 557, 6700AN Wageningen, The Netherlands
P. de Groot � M. Muller � F. Pepping
Division of Human Nutrition, Wageningen University,
PO Box 8129, 6700 EV Wageningen, The Netherlands
J. Kaput
Division of Personalized Nutrition and Medicine,
Food and Drug Administration/National Center for
Toxicological Research, Jefferson, AR, USA
e-mail: [email protected]
J. C. Mathers
Human Nutrition Research Centre, Institute for Ageing
and Health, Newcastle University, William Leech Building,
Framlington Place, Newcastle NE44 6HE, UK
e-mail: [email protected]
J. Saito
Department of Bioinformatics (BiGCaT)
and Department of Knowledge Engineering (DKE),
Maastricht University, Maastricht, The Netherlands
e-mail: [email protected]
A. Scalbert
INRA, UMR 1019, Unite de Nutrition Humaine,
Centre de Recherche de Clermont-Ferrand/Theix,
63122 Saint-Genes-Champanelle, France
e-mail: [email protected]
123
Genes Nutr (2010) 5:189–203
DOI 10.1007/s12263-010-0167-9

from multiple studies, from different research groups, dif-
ferent countries and different—omics levels. The dbNP is
designed to facilitate storage of biologically relevant, pre-
processed—omics data, as well as study descriptive and
study participant phenotype data. It is also important to
enable the combination of this information at different levels
(e.g. to facilitate linkage of data describing participant
phenotype, genotype and food intake with information on
study design and—omics measurements, and to combine all
of this with existing knowledge). The biological information
stored in the database (i.e. genetics, transcriptomics, pro-
teomics, biomarkers, metabolomics, functional assays, food
intake and food composition) is tailored to nutrition research
and embedded in an environment of standard procedures and
protocols, annotations, modular data-basing, networking
and integrated bioinformatics. The dbNP is an evolving
enterprise, which is only sustainable if it is accepted and
adopted by the wider nutrition and health research commu-
nity as an open source, pre-competitive and publicly avail-
able resource where many partners both can contribute and
profit from its developments. We introduce the Nutrige-
nomics Organisation (NuGO, http://www.nugo.org) as a
membership association responsible for establishing and
curating the dbNP. Within NuGO, all efforts related to dbNP
(i.e. usage, coordination, integration, facilitation and main-
tenance) will be directed towards a sustainable and federated
infrastructure.
Keywords Nutritional phenotype � Nutrigenomics �Database
Introduction: nutrition is special
A primary goal of nutrition research is to optimize health by
prevention, delay, or reduction in the severity of disease via
dietary means. Determining optimal dietary intakes to main-
tain health require relevant methods for assessing the effects of
the huge range of diverse food-delivered compounds (macro
and micronutrients, and non-nutritional bioactive compounds)
on individual health. There is a good understanding of the
basic nutrient requirements for health maintenance, but the
next steps towards quantification of the relationships between
nutrition and health have proven to be difficult. Although
nutrition researchers have adopted many modern approaches
and technologies, tools for measuring the two major nutrition-
specific ‘‘research axes’’ are far from perfect:
1. The ‘‘input’’ or exposure axis—quantification of
habitual dietary exposure by measurement of food
intake combined with food composition is essential for
investigating the impact of food on health. Particularly
in large studies, the characterization and quantification
of intakes over years or decades of foods, nutrients and
other bioactive molecules with sufficient accuracy and
precision remain a major challenge.
2. The ‘‘output’’ or effect axis—quantification of pheno-
typic effects of dietary exposure relies currently on
disease risk biomarkers, but the biomarkers used so far
are suboptimal. Often ‘‘health’’ has been defined as the
absence of evidence of disease although it is widely
recognized that such a definition is inadequate. Most
experimental nutrition studies have altered markers of
disease risk as their endpoints, but only a few of such
markers have been validated. In addition to biomarkers
of reduced disease risk, we propose that maintaining
and optimizing health requires quantification of
homeostatic robustness i.e. the ability to adapt [10].
Genotypic (genetic and epigenetic) variation further
complicates the picture, because the relation between the in
and output axis depends on the genotype. Also, the time
factor can be considered as a research axis.
Nutrition research needs better biomarkers of both
exposures and outcome. This calls for approaches where
results are automatically combined with knowledge derived
from different sources such as existing protein–protein
interaction databases, miRNA and transcription target
inference data and literature sources. A database system is
required for nutrition research to facilitate such approaches.
The description and quantification of the consequences
for human physiology in response to nutrition are now
commonly called the nutritional phenotype. The concept of
the nutritional phenotype was first introduced by Zeisel
et al. [37] who proposed that this should be defined as an
integrated set of genetic, proteomic, metabolomic, func-
tional and behavioural factors that form the basis for
assessment of human nutritional status. The nutritional
phenotype integrates the effects of diet on disease/wellness
and is the quantitative indication of the paths by which
genes and environment exert their effects on health.
The need to accurately capture subtle changes in a
multitude of variables creates several challenges.
P. Rocca-Serra
Microarray Informatics Team, European Bioinformatics
Institute, Cambridge, UK
e-mail: [email protected]
A. Travis
The Rowett Institute of Nutrition and Health,
University of Aberdeen, Greenburn Road,
Bucksburn Aberdeen, Scotland AB21 9SB, UK
e-mail: [email protected]
C. T. Evelo
Department of Bioinformatics (BiGCaT),
Maastricht University, Maastricht, The Netherlands
e-mail: [email protected]
190 Genes Nutr (2010) 5:189–203
123

Standardized technology, methodology and data formats
are required for meeting these challenges. Elements of
these issues are common to all biological sciences, and
efforts to produce solutions and best practices for tech-
nologies and data handling in these areas are under way
[27, 32]. To benefit from and to align with these devel-
opments, nutrition researchers have to adopt, adapt and
customise the standards. In this paper, we address the
nutrition-specific requirements and propose a strategy for
meeting these challenges.
‘‘The data handling challenges for nutrition research’’
describes the challenges of processing data for nutritional
research. ‘‘A nutrigenomics research infrastructure’’ lists
existing kinds of infrastructure available for nutrigenomics
and describes dbNP as a system integrating such kinds of
infrastructure. ‘‘The nutritional phenotype database’’ gives
a detailed description of the dbNP. ‘‘The Nutrigenomics
Organisation as a sustainable model of the nutritional
phenotype database’’ explains the institutionalized curation
of dbNP by the Nutrigenomics Organisation. ‘‘Conclusion’’
provides an outlook to future work and concludes this
article.
The data handling challenges for nutrition research
Nutrition research has undergone a revolution in the last
decade. To a large extent, this revolution is shared by most
biology-based research and includes 6 areas:
1. Data density—due to new technology for data pro-
duction in genomics and for information storage and
handling. Typically, we no longer do single gene,
protein or metabolite assays. Advanced technology
may allow generation of terabytes of data from single
experiments. Whole genome sequencing, magnetic
resonance imaging (MRI) and multiplex protein anal-
ysis are examples of data dense analyses, which have
often become routine in biological research, including
nutrition research. For example, combined whole
genome genotyping and transcriptome analyses in
large human cohorts are current practice [11].
2. Scale expansion—due to extensive public research
investment. Both the number and size of cohorts have
increased markedly, especially in response to the
complexity introduced by genome-wide geno-/haplo-
typing studies. The value of biobanks is increased by
improved alignment protocols and procedures, provid-
ing larger sample repositories [36].
3. Accessibility—partly due to Web 2.0, standardization,
journal policies and legislation, the practice of data
sharing becomes ever more accepted. The dbGAP
database [20] is a good example (datasharing is
permitted but controlled in order to address privacy
concerns related to genetic information), with the
Framingham study as one of the prominent data
sources [7].
4. Cross-study validation and meta-analysis—combining
data from many studies and the creation and use of
biobanks, play an important role in validating results,
with the potential for major impact on the robustness,
and therefore utility, of research findings [3].
5. Interdisciplinary—recognizing that today’s most sig-
nificant public health problems, e.g. obesity and
diseases in an ageing population have multiple inter-
acting causes, it is now common for research projects
to be interdisciplinary. To ensure effective use of
multiple technologies and input from several scientific
disciplines with high levels of specialization, team-
work, common languages and data elements and inter-
operable IT-infrastructures are required.
6. Personalization—due to the accuracy provided by new
genotyping, phenotyping and diagnostics applications,
we are now able to dissect the ‘‘population’’ into
specific subclasses.
A nutrigenomics research infrastructure
The progress of biomedical research, technological
advances and infrastructure developments is relevant for
nutrition research. Thus, many nutrition research projects
have exploited these developments, by the use of tech-
nologies and conceptual innovations, including the fol-
lowing six:
1. optimizing and extending standard operating
procedures;
2. harmonizing quantitative estimates of food intake and
food composition to improve assessment of dietary
exposure;
3. use of ‘‘omics’’ technologies to quantify multiple
simultaneous changes in molecular physiology. These
methods are much more comprehensive than were
available only a few years ago;
4. connecting to large prospective human cohorts which
are being genotyped and phenotyped;
5. creating or collaborating with several ontologies,
allowing structured storage and sharing of results;
6. structuring existing knowledge in relational concepts
and facilitating their use in pathway and network
analyses.
We propose implementation of an infrastructure for
nutrition research, with an organizational framework that
will facilitate optimal performance, storage, evaluation and
Genes Nutr (2010) 5:189–203 191
123

sharing of information and results. The infrastructure is
applicable to all nutritional studies, including human
intervention studies and experimental studies in (trans-
genic) animals, and will provide necessary mechanistic
insights into gene–nutrient interactions.
The core of this infrastructure rests on two pillars:
1. Establishment of the dbNP as a community-wide
coordinated effort. This database should be designed to
allow collection of all relevant variables in nutrition
and health studies by validated analytical technologies
and related mathematical processing of data, standard-
ization of procedures and data formats.
2. Establishment of an appropriate information technol-
ogy infrastructure to distribute data to the research
networks that respects the full autonomy of individual
research teams, but also allows sharing of any
component of the dbNP with other selected research
teams or communities with mutual consent.
The nutritional phenotype database
The dbNP is designed to facilitate the description along the
two axes needed to perform nutrition studies (the exposure
and the effect of food intake) and to connect them to
information on genetic variation and study design. Cap-
turing of the current major components of these axes
(genetics, transcriptomics, proteomics, biomarkers, meta-
bolomics, functional assays, imaging technologies, food
intake and food composition) should be tailored to nutrition
research. If we are to make maximum use of the collected
information without introducing limitations for new
research approaches or the use of new technologies, the
dbNP requires extensive standard protocols and quality
standards for nutritional data capturing, and nutrition-spe-
cific annotations, modular data-basing, distributed net-
working and integrated bioinformatics.
The dbNP will store and allow retrieval of data from high
quality nutrition studies, regardless of the technology by
which the data were acquired. This is different from most
existing—omics databases, which often store data from one
specific analytical technology only. Thus, dbNP would be
the first complete systems biology study database.
This section describes the dbNP as follows: First, we
introduce the pipeline in the dbNP. Next, we describe the
eight characteristic design principles of the dbNP. This is
followed by an overview of the three levels for accessing
the dbNP. Finally, we give a detailed account of the
modules from which the dbNP is built.
Pipelines: a typical workflow in dbNP
The integration of different data-capturing technologies in
the dbNP can be illustrated by describing a typical workflow.
It includes capturing the study design, (dietary) intervention,
sampling protocol and the quantitative results using a dedi-
cated study capture module. This module can combine the
study description with the actual measurements, which can
be used for storage in data repositories. The loading module
loads the raw experimental data into technology-specific
databases and links to a series of parallel technology-specific
data processing pipelines (see Fig. 1).
The purpose of such pipelines is to produce and deliver
‘‘clean data’’ to several database modules. By ‘‘clean data’’,
we imply that the raw data have been transformed from
their platform-specific format into a quality controlled and
statistically evaluated format providing numerical values
such as activities or concentrations, fold changes and p-
values. The database modules can be queried based on the
study design as well as experimental data and are con-
nected to a series of statistical and bioinformatics packages
facilitating further data processing. The modular, technol-
ogy-specific database structure allows each technology to
provide its dedicated LIMS and data pre-processing pro-
cedures, whereas the study design module, the study query
and the evaluation modules provide integrated views of the
biological research questions. In reality, data derived from
different technologies but providing similar type of infor-
mation (e.g. LC-MS and NMR both providing ‘‘clean’’
metabolomics data, or two types of transcriptomics tech-
nology using different pre-processing pipelines) are all
proceduresprotocols
standardsFormats
Study design
analyticaltechnology
raw data storage
data pre-processing
clean datastorage
data queryand analysis
SOP databaseDevelopmentImplementationDisseminationRecommend.
ISA-TABHMDBOntologies
BioInvestigat.Index (BII)
Human study database
Food intakeGeneticsTranscriptomeMetabolomeProteomeImmagingBiomarkers
MadMaxBase2ArrayTrackMetabolismEtcNuGO datagrid
Technologyspecific
Genepattern
Gene variantsTranscriptsMetabolitesProteinsBiomarkersImagesFood intake
QueryIntegrationStatisitcsVisualisationBioinformaticsLink to study design
proceduresprotocols
standardsFormats
Study design
analyticaltechnology
raw data storage
data pre-processing
clean datastorage
data queryand analysis
proceduresprotocols
standardsFormats
Study design
analyticaltechnology
raw data storage
data pre-processing
clean datastorage
data queryand analysis
SOP databaseDevelopmentImplementationDisseminationRecommend.
ISA-TABHMDBOntologies
BioInvestigat.Index (BII)
Human study database
Food intakeGeneticsTranscriptomeMetabolomeProteomeImmagingBiomarkers
MadMaxBase2ArrayTrackMetabolismEtcNuGO datagrid
Technologyspecific
Genepattern
Gene variantsTranscriptsMetabolitesProteinsBiomarkersImagesFood intake
QueryIntegrationStatisitcsVisualisationBioinformaticsLink to study design
Fig. 1 Basic workflow of the nutritional phenotype database. The Nutritional Phenotype Database (dbNP) is more than a database because it
provides a pipeline for performing systems biology-based nutritional studies
192 Genes Nutr (2010) 5:189–203
123

stored in the same ‘‘clean data’’ database. Thus, a com-
pletely modular, flexible and technology-independent
database structure is created and updated continually as
new datasets are uploaded.
Characteristics of the nutritional phenotype database
The architecture of the dbNP has the following eight design
principles:
1. The dbNP has a modular structure. This allows
replacement, updating or addition of modules without
affecting the integrity of the entire database. This is
essential because the rapid technological development
may soon render an existing module obsolete and will
make the update or addition of new components easier.
Modularity also allows division of the workload,
which is important for distribution of tasks for building
the dbNP and also for collecting data. For example,
certain teams may concentrate on imaging whilst
others deal with metabolomics. The modules of the
dbNP are described in ‘‘The modules of the nutritional
phenotype database’’.
2. The dbNP applies open source software. Use of open
source and free availability software is essential and
guaranteed.
3. The information in the dbNP conforms to standards
enforced by domain-specific ontologies and formats.
Pooling data and comparing results require harmo-
nized protocols or quality standards, data elements and
standardized methods. Thus, all procedures, technolo-
gies, analyses and routines are accompanied by
standard operating procedures (SOPs) or recommen-
dations of best practice and necessary quality stan-
dards. To assist with this, a curated database of
nutrigenomics-related SOPs has been created and is
accessible at http://www.nugo.org/sops.
4. The information in dbNP is in compatible formats and
ontologies required to capture the essential details of
nutrition studies. The dbNP is connected to a series of
controlled vocabularies (ontologies), SOPs and for-
mats, making standardization of studies and methods
easier. This standardization is ‘‘imposed gently’’ to
allow sharing of data and studies in three ways, as
discussed later.
5. The dbNP encourages generation of high quality data.
Data management within the dbNP is the responsibility
of the individual research groups who will be expected
to upload data within a LIMS environment prior to,
during and immediately after performing the studies.
dbNP will contain quality control evaluation proce-
dures and guidelines, which are part of the data
processing from raw to clean data. Quality control is
assured by peer reviewers during publishing and
supported by the data management help desk provided
by the Nutrigenomics Organisation.
6. dbNP is based on ISA-Tab for formatting and exchang-
ing experimental metadata and study designs. By
leveraging tools capable of producing, validating,
parsing and dispatching the information coded using
ISA-Tab format [28], it is possible to rely on one format
to manage complex studies combining different phe-
notyping techniques. As this standard is accepted, data
exchange with public repositories such as ArrayEx-
press [4] for microarray data and PrIDE [22] for mass
spectrometry for protein identification, and also with
other systems, e.g. FDA’s ArrayTrack [33] is possible.
7. The dbNP facilitates integrated analysis and evaluation
of all data from nutrition studies. This is achieved by
providing an integrated suite of bioinformatics tools.
The first toolbox linked to dbNP is the Genepattern
suite developed by the Broad Institute [25]. Many other
software packages are also available and supported.
Furthermore, analysis of multiple studies is facilitated
because all studies are stored in the same formats. This
requires semantic validation and curation. A user-
friendly output next to programmatic access options
will make it possible to query the database extensively.
8. The dbNP is installed on a distributed network of ‘lab-
scale’ NBX (NuGO Black Box) bioinformatics servers
constructed by NuGO (http://www.nugo.org/nbx) [14].
This NBX network combines autonomy and local data
ownership with immediate access to the distributed
bioinformatics infrastructure, and is designed to facil-
itate co-operation in a very practical and cost-effective
way, thus encouraging wider adoption of this approach
by the nutrition research community. Each database
participating in the dbNP federation is stored locally.
Currently, the dbNP is protected by a disaster recovery
strategy including off-site backups to central NuGO
servers, which provides protection against a single disk
failure. Local autonomy is preserved in the case of
remote backups because only NuGO system adminis-
trators have access to the backup files. It is a necessary
part of the NBX strategy that NuGO administrators
have remote access to all NBX’s and that the NBX
network is managed by NuGO. Work is underway to
adopt peer-to-peer (p2p) ‘disruptive’ technology to
provide redundancy between NBX’s and replace the
current centralized backup strategy.
Three modes to use the nutritional phenotype database
The dbNP serves different user needs simultaneously. We
distinguish between three kinds of access allowing
Genes Nutr (2010) 5:189–203 193
123

different modes of using the dbNP: (1) single study mode;
(2) the protected-environment mode; and (3) public-
domain mode.
1. Database and analysis for a single nutrition study
within a local and IP-protected research group. This
can be a study performed in one single laboratory, a
multi-centre study or a study where single parts of a
project (e.g. human intervention study, sample analysis
and bioinformatics) are carried out at different sites.
This is possible due to installation of the dbNP on the
‘‘NuGO Black Box’’ server, at each collaborating
laboratory, with detailed settings of permission levels
to access and share information. The full functionality
of the dbNP is available, both at a laboratory level and
in a multi-centre collaboration, with complete local
control on data access. This first mode of operations is
schematically represented in Fig. 2.
2. Integration and interrogation of multiple nutrition
studies within a protected environment. The dbNP
allows combination of datasets from multiple nutri-
tional studies at the level of single variables for unique
subjects, using any technology, e.g. the omics data are
connected to the study design and classical biomarker
data. Queries can be executed on the transcriptome of
peripheral blood mononuclear cells of multiple studies
and correlated with insulin resistance and BMI. This
type of analysis demonstrates the need to capture study
design, because inclusion criteria such as allergies,
time of year, age, sex, diet, physical activity and
genetic background may influence the results [12].
This mode of dbNP is typical of projects where results
have not been made fully available within public-domain
databases. Permissions to access these datasets would be
limited to collaborating centres. However, other members
of the dbNP community could request access promoting
novel research collaborations within the dbNP community,
which might improve data processing. At this mode, all
data remain fully ‘‘owner controlled’’, stored on the NBX
and thus accessible only to those specifically given per-
mission by the data owner. This mode of multi-study col-
laboration and exchange is depicted in Fig. 3.
3. Public-domain depository of nutrigenomics studies.
Because of the extensive authorization options of the
different local installations of the dbNP, the results
can be easily opened to the public domain. The
dbNP stores nutrition intervention studies in a
standardized way. Thus, a study owner can decide
to share the data with the public domain without
changing format or additional work. Data that is
made available to the public can be accessed from a
central website that will also provide web services
(Fig. 4). Depending on specific needs in study
management and performance optimization, data will
physically reside on the machine that runs the
website, in the original distributed locations on the
NBX network or as published data in the data
repositories at EBI. The user will not have to know
or worry about these locations but will be able to see
the publication status (e.g. are array data published in
Arrayexpress or not). During data evaluation yet
other data sources will become available. Genedata
in pathways are for instance directly connected to
information in ENSEMBL ad thus sources like
UniProt, Omim and dbNP. These can be accessed
by the user using a simple right click, by automated
mining tools that follow the links or as in network
analytical procedures in Cytoscape. Describing the
WikiPathways webservices, we gave examples of a
number of the more advanced ways in which this
kind of data integration is possible [18]. Web service
access is possible via this central dbNP or via the
dedicated database modules provided by dbNP itself.
The full functionality of interrogation and bioinfor-
matics toolbox will be available in this public-
domain version. As an example, Genepattern mod-
ules will be accessible via the web services to allow
evaluation using R/Bioconductor-based tools, Path-
Visio [6] and Cytoscape [19]; plug-ins will do the
same to allow queries based on pathway and network
analysis. A future generation of tools can combine
the extracted information with data derived from
other sources by semantic web technology.
Fig. 2 The use of the nutritional phenotype study within a research
network. All laboratories participating in the intervention study, at the
in vivo execution, the analytical technologies or the data elaboration,
have a local version of dbNP installed on their NBX server, with
permissions to share and store their data. Each partner determines
what part of their database is shared with other partners (visualized by
the x-sign). Data access is transparent; the user does not need to
know, which NBX contains the actual data
194 Genes Nutr (2010) 5:189–203
123

Results can also be uploaded to existing public-domain
databases (such as GEO and ArrayExpress for transcri-
ptomics data and PrIDE for proteomics data), using ISA-
archives created at an early stage of data storage.
During analysis data can also be combined with other
data from the external data repositories. An example of
how such an approach would work is the integration of the
already available dual web service integration of high
quality expression data from ArrayExpress Atlas in path-
ways from WikiPathways [18]. A similar approach could
be extended using dbNP web services allowing evaluation
of published and unpublished studies.
The modules of the nutritional phenotype database
As described in ‘‘Characteristics of the nutritional pheno-
type database’’, the dbNP is organized in modules: (1)
functional modules; and (2) database modules. Functional
modules offer services within the dbNP workflow and
interface with the user. Existing and planned functional
modules are the ISA-web study capture tool, the ISA-cre-
ator and BioInvestigation Index, the bioinformatics and
statistics toolbox. Database modules include data at dif-
ferent levels of processing. These data may be generated by
functional modules. Database modules include the study
database, the genetic variation module, the phenotypic
module and the food intake database. A database module
may consist of one or more physical databases.
The modules of dbNP are organized according to the
workflow and elements presented in the scheme (Fig. 5).
The ISA-web study capture tool module and study
description database
For a consistent entry of study information in the dbNP,
it is essential to have a tool capturing and querying
study metadata, sample characteristics, study design,
Fig. 3 Use of the nutrition
phenotype database in
combining and interrogating
multiple intervention studies
from multiple consortia. Data
access can be arranged to
subsets of the study (e.g. all
PBMC transcriptomes), thus
creating a multi-study PBMC
transcriptome database. It is
essential that all studies are
stored in identical formats
(dbNP) within an owner-
controlled data sharing platform
(the NBX)
Fig. 4 The Nutritional phenotype database can be used as a public-
domain depositary where nutrition studies are available to the public.
All query functionalities will remain the same as in the research
scenarios. This public-domain version of dbNP is optimally integrated
with existing EBI and NCBI databases
Genes Nutr (2010) 5:189–203 195
123

measurements (e.g. transcriptomics, metabolomics, and
biomarkers), SOPs and sample-data relationships. Nutrition
studies may have complex designs like multiple doses,
sampling time points and challenge tests, and all these
should be made available for data analysis.
Consistent reporting of these experimental metadata and
associated data files has a positive and long-lasting impact
on the value of collective scientific outputs. It is critical,
however, to reach a compromise between detail and prac-
tical reporting, and thus have good overall compliance. For
this purpose, the nutritional phenotype database develops
ISA-web and an underlying study description database.
ISA-web is a web-based application designed to struc-
ture and edit experimental metadata in ‘‘ISA-Tab’’ format
(http://isa-tab.sf.net) and package it with corresponding
data files for submission to the study description database.
ISA-web has a dropdown menu to select a certain template
to comply with relevant minimal information for biological
and biomedical investigation (http://mibbi.sf.net). A wizard
is constructed to provide a knowledge driven/assisted cre-
ation mode, which further reduces repetitive tasks. The
direct interface between ISA-web and the study description
database prevents duplication.
The ISA-Tab format has been developed to deposit
multi-assay study datasets at EBI. ISA-web works in con-
cert with the other modules, detailed in the next section.
This ensures data persistence to a relational database
management system.
The study description database includes a description of
experimental information like the aims and hypothesis,
design of the experiment, information detailing stress and
response variables (also known as independent and
dependent variables), as well as sample and data processing
information.
The main goal is to allow navigation from samples and
their characteristics to data files holding information on
molecular measurement for further analysis, irrespective of
the technique used to generate those data files.
ISA-creator and BioInvestigation Index
Two alternative, more generic and more professional
modules, are developed by the European Bioinformatics
Institute: ISA-creator and BioInvestigation Index. These
two modules are not specifically designed to store nutrition
intervention studies, but rather aim at covering all possible
study designs. ISA-creator is a stand-alone study capture
tool. A wizard is constructed to help tailor the data capture
to specific study types, which further reduces repetitive
tasks. It has Excel-like functionalities and look, coupled
with dynamic graphical view. Standardized metadata cap-
turing is facilitated by support for searching and use of
OBO Foundry ontologies (http://www.obofoundry.org)
accessed via the Ontology Lookup Service (http://www.
ebi.ac.uk/ontology-lookup).
The BioInvestigation Index (BII) database is able to
propagate the information coded in ISA-Tab syntax to a
relational database, thus enabling queries to be executed.
Software has been developed to read, parse and persist
ISA-Tab encoded information to BII databases. This soft-
ware may also dispatch data files to technology-specific
data stores and can be configured by local users. The dis-
patcher code is able not only to load data into BII but also
to export data to a variety of public repositories, including
PRIDE [22], ENA [5] and ArrayExpress [4]. It is important
to note that dispatcher component can be configured to
point to local data stores, and submission to public repos-
itories is not mandatory. Finally, an R package, supporting
the ISA-Tab format, is under development. It is meant to
facilitate data and metadata manipulation for analyses.
Clean transcriptomics data module
The purpose of this database module is to store ‘‘clean’’
transcriptomics data only: non-biological noise is removed
from each experiment (microarray or otherwise obtained
transcriptome data) as much as possible. The ‘‘clean’’ data
are obtained by executing a dedicated ‘‘NuGOMake-
CleanData’’ module in GenePattern. Genepattern is created
and maintained by the Broad Institute. This module
requires the original.CEL-files, which belong to a complete
single experiment, as input. The output is ‘‘clean’’ data
stored in a so-called.gct file and a.chip file describing the
probes on the microarray chip and their descriptions. The
file formats are defined by the Broad institute. A recent
publication [8] describes NuGO contributions to Genepat-
tern, and the NuGOMakeCleanData module is a recent new
contribution.
Clean data db
Study metadata
db
Dataanalysissample
analysis
1
2
3
4
5
Study design
Clean data db
Study metadata
db
Dataanalysissample
analysis
1
2
3
4
5
Study design
Fig. 5 The basic elements and workflow of dbNP. The protocols for
nutrition intervention studies are captured on metadata level, which
are then stored (1) in the study metadata database. All analytical
procedures on study samples (2) eventually results in ‘clean data’ (3)
which are stored in clean data databases. By interrogating the study
metadata database, data subsets of multiple studies can be selected
(4), and then analysed by statistical and bioinformatics tools (5)
196 Genes Nutr (2010) 5:189–203
123
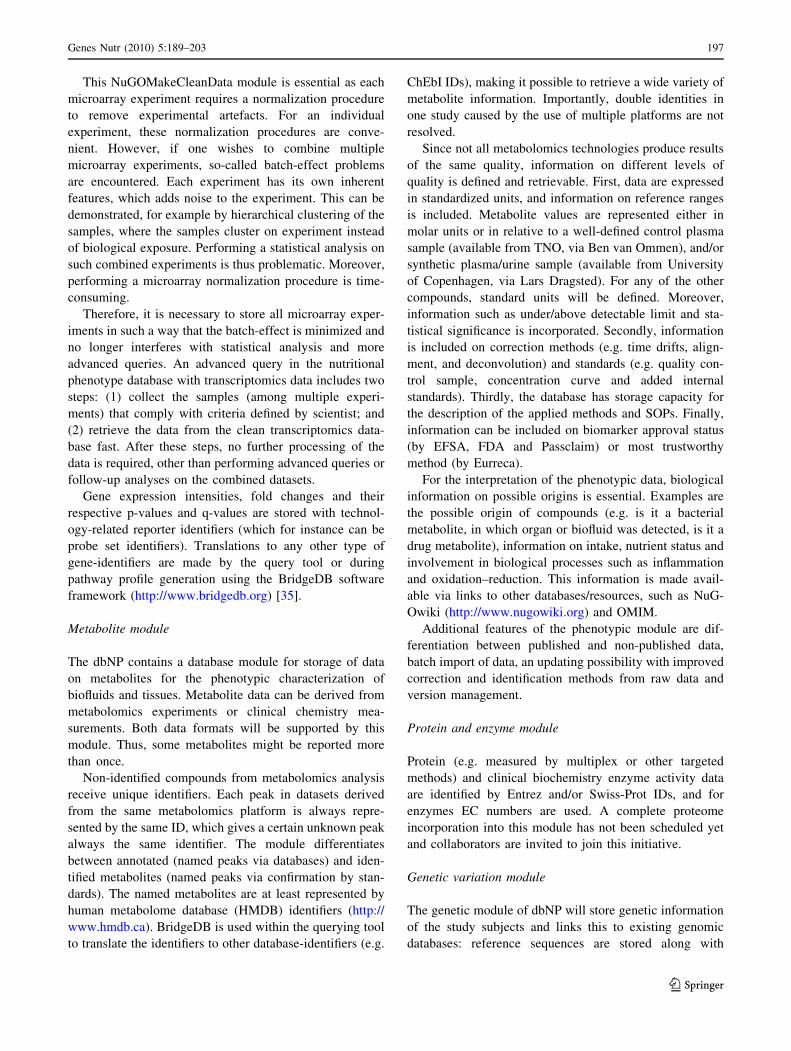
This NuGOMakeCleanData module is essential as each
microarray experiment requires a normalization procedure
to remove experimental artefacts. For an individual
experiment, these normalization procedures are conve-
nient. However, if one wishes to combine multiple
microarray experiments, so-called batch-effect problems
are encountered. Each experiment has its own inherent
features, which adds noise to the experiment. This can be
demonstrated, for example by hierarchical clustering of the
samples, where the samples cluster on experiment instead
of biological exposure. Performing a statistical analysis on
such combined experiments is thus problematic. Moreover,
performing a microarray normalization procedure is time-
consuming.
Therefore, it is necessary to store all microarray exper-
iments in such a way that the batch-effect is minimized and
no longer interferes with statistical analysis and more
advanced queries. An advanced query in the nutritional
phenotype database with transcriptomics data includes two
steps: (1) collect the samples (among multiple experi-
ments) that comply with criteria defined by scientist; and
(2) retrieve the data from the clean transcriptomics data-
base fast. After these steps, no further processing of the
data is required, other than performing advanced queries or
follow-up analyses on the combined datasets.
Gene expression intensities, fold changes and their
respective p-values and q-values are stored with technol-
ogy-related reporter identifiers (which for instance can be
probe set identifiers). Translations to any other type of
gene-identifiers are made by the query tool or during
pathway profile generation using the BridgeDB software
framework (http://www.bridgedb.org) [35].
Metabolite module
The dbNP contains a database module for storage of data
on metabolites for the phenotypic characterization of
biofluids and tissues. Metabolite data can be derived from
metabolomics experiments or clinical chemistry mea-
surements. Both data formats will be supported by this
module. Thus, some metabolites might be reported more
than once.
Non-identified compounds from metabolomics analysis
receive unique identifiers. Each peak in datasets derived
from the same metabolomics platform is always repre-
sented by the same ID, which gives a certain unknown peak
always the same identifier. The module differentiates
between annotated (named peaks via databases) and iden-
tified metabolites (named peaks via confirmation by stan-
dards). The named metabolites are at least represented by
human metabolome database (HMDB) identifiers (http://
www.hmdb.ca). BridgeDB is used within the querying tool
to translate the identifiers to other database-identifiers (e.g.
ChEbI IDs), making it possible to retrieve a wide variety of
metabolite information. Importantly, double identities in
one study caused by the use of multiple platforms are not
resolved.
Since not all metabolomics technologies produce results
of the same quality, information on different levels of
quality is defined and retrievable. First, data are expressed
in standardized units, and information on reference ranges
is included. Metabolite values are represented either in
molar units or in relative to a well-defined control plasma
sample (available from TNO, via Ben van Ommen), and/or
synthetic plasma/urine sample (available from University
of Copenhagen, via Lars Dragsted). For any of the other
compounds, standard units will be defined. Moreover,
information such as under/above detectable limit and sta-
tistical significance is incorporated. Secondly, information
is included on correction methods (e.g. time drifts, align-
ment, and deconvolution) and standards (e.g. quality con-
trol sample, concentration curve and added internal
standards). Thirdly, the database has storage capacity for
the description of the applied methods and SOPs. Finally,
information can be included on biomarker approval status
(by EFSA, FDA and Passclaim) or most trustworthy
method (by Eurreca).
For the interpretation of the phenotypic data, biological
information on possible origins is essential. Examples are
the possible origin of compounds (e.g. is it a bacterial
metabolite, in which organ or biofluid was detected, is it a
drug metabolite), information on intake, nutrient status and
involvement in biological processes such as inflammation
and oxidation–reduction. This information is made avail-
able via links to other databases/resources, such as NuG-
Owiki (http://www.nugowiki.org) and OMIM.
Additional features of the phenotypic module are dif-
ferentiation between published and non-published data,
batch import of data, an updating possibility with improved
correction and identification methods from raw data and
version management.
Protein and enzyme module
Protein (e.g. measured by multiplex or other targeted
methods) and clinical biochemistry enzyme activity data
are identified by Entrez and/or Swiss-Prot IDs, and for
enzymes EC numbers are used. A complete proteome
incorporation into this module has not been scheduled yet
and collaborators are invited to join this initiative.
Genetic variation module
The genetic module of dbNP will store genetic information
of the study subjects and links this to existing genomic
databases: reference sequences are stored along with
Genes Nutr (2010) 5:189–203 197
123

annotations of nucleotide, copy number variations and in-
dels (insertions/deletions).
The goal of many efforts (e.g. the human variome pro-
ject [26] and dbGAP [20]) is to associate a phenotype to
each variant. dbNP does not require to replicate these data
and therefore will link to NCBI, EBI, or other national and
international databases for reference and variant sequences,
allele frequencies, and other genetic variations.
Genetic variations cannot easily be translated into phe-
notypic effects. Individuals differ in response to food
intake and the environment due to their unique genetic
make-up. No population will display the entire range of
phenotypic variation possible for a single genetic variant
(SNP, copy number, deletion, insertion or other) or col-
lection of variants (haplotypes). Epigenetic interactions
(alteration in expression of genetic information not caused
by changes in DNA sequence) may also alter the expres-
sion of the gene(s) variant. DNA methylation, microRNAs
and histone modifications contribute to different extents to
produce epigenetic differences among individuals [13].
The data necessary to decipher the function of genetic
variations or thus requires extensive genotyping. Specifi-
cally, nutrition experiments will require
1. resequencing candidate genes because the range of
human genetic variation has not been analysed [26];
2. some form of whole genome scans (genotyping arrays)
or whole exon sequencing. Such data are needed to
analyse epistatic interactions;
3. characterize DNA methylation in individual genes or
across the genome.
The first version of the database will focus on variants of
interest for nutrient–gene interactions, capture and store
genotyping results from array analyses, the sequence of
multiple candidate genes and DNA methylation from tar-
geted candidate genes. As DNA sequencing technologies
improve and costs decrease, the future versions of dbNP
will store or link to sequence information of each indi-
vidual along with their global DNA methylation patterns
[23].
These high dimensional datasets will be used to even-
tually create a distinct genome attribute for each individual.
The analogy best describing this attribute is how bio-
chemists refer to enzyme activity: units of activity are not
as meaningful as units of activity per milligram protein.
Each SNP or copy number variant could express differently
in one individual (SNP1/genome A) than in another indi-
vidual (SNP1/genome B). No such measure currently
exists. Evidence supporting such concepts has been shown
at the population level where, e.g. haplotype K has a dif-
ferent impact on myocardial infarction and CVD in Euro-
pean-Americans when compared with African-Americans
[15].
The full range of phenotypic effects of a given SNP or
copy number variant will thus require comparison of gene–
nutrient interactions in widely different genetic and cultural
backgrounds [17]. Each genetic variant will be linked to
the nutrients influencing its expression/phenotypic effect,
and those effects will vary depending upon genome attri-
bute (the denominator). Grouping or clustering genome
attributes may reduce the variation from *7 billion unique
possibilities to smaller set of ‘‘metabolic’’ groups. Linear
and non-linear dimensionality reduction algorithms and
more complete genotype data will allow the incorporation
of genomic data into analyses of nutrient phenotypes.
Recent metabolomic research has demonstrated the exis-
tence of metabolic groups [1, 2, 16, 29], and such groups
may ultimately be linked to genotype data.
Food intake database module
The major challenges for the food intake database are (1) to
capture a heterogeneous and complex eating behaviour in a
systematic manner; and (2) to ‘‘translate’’ information on
food intake to intakes of energy, nutrients and other bio-
active compounds. Many tools are in use for assessing food
intake and all struggle to assess habitual food intake
accurately. The tool of choice will depend on the purpose
of the study and the resources available. Food diary and
24 h recall-based methods offer the opportunity to collect
the individual richness of food ingestion behaviour but
generate technical challenges and are resource expensive
when converting food descriptions to intakes of energy,
nutrients and other bioactive compounds. Well-validated
food frequency questionnaires (FFQ) designed to cover the
whole diet are widely used, especially in large epidemio-
logical studies. FFQ have the additional advantage that
they are readily adapted for web-based data versions and
can be linked to food composition databases.
Sharing information between projects in different parts
of the world will require data, which are freed from their
cultural and geographical constraints, by use of harmonized
food composition databases. There are differences among
countries and stakeholders in the way food data are
expressed for e.g. food description, definition of nutrients
and methods used to generate compositional values. A
common European standard to describe food data is cur-
rently developed within the European Committee for
Standardization framework to enable unambiguous identi-
fication and description of food data for dissemination and
interchange. A common food description system needs to
be agreed upon and shared. LanguaL is one such system,
which uses a multilingual thesaurus based on 14 different
facets including product type, food source, part of the plant
or animal from which the food is derived and cooking
method (http://www.langual.org). EuroFIR provides links
198 Genes Nutr (2010) 5:189–203
123

to several food composition data banks in Europe (http://
www.eurofir.org). A growing number of such databanks,
generally specific of a given country, are now accessible
via internet, and EuroFIR offers an eSearch function
allowing retrieval and comparison of food composition
values for macronutrients, vitamins and minerals, in dif-
ferent databases.
Databases for composition of bioactives are not yet well
developed with some notable exception like the USDA
databases for carotenoids or flavonoids [34] and the Phe-
nol-Explorer database for polyphenols (http://www.phenol-
explorer.eu). Different classifications have been proposed
for food components. These are not trivial for bioactive
compounds due to the diversity of their chemical struc-
tures. A unified system adapted to the specific needs of
nutrigenomic studies should be developed.
Estimates of food intake (food name and quantity con-
sumed) can be combined with food composition data to
estimate intake of energy and specific nutrients. For this,
foods or diets in nutrigenomics intervention studies should
be characterized in detail using the standardized food
descriptors. The dbNP should also contain food composi-
tion data, if specific data have been collected as part of the
study, which can eventually be compared to common
composition values as described in food databases.
Alternatively, information on the exposure to some
nutrients or bioactive compounds can be captured by ana-
lysing the food metabolome as all metabolites directly
derived from the digestion of food in urine or plasma [21].
Some components of the food metabolome can also be
derived from some food constituents characteristic of a
given food (i.e. phloretin derived from phlorizin exclu-
sively found in apple). These components can be used as
biomarkers of food intake in cohort studies [24, 30] or as
markers of compliance in dietary intervention studies. This
information on the food metabolome should be part of the
dbNP biomarker module and treated in the same way as
data on the endogenous metabolome. The dbNP database
should include, or be linked to, information of the food
sources containing the precursors of the different constit-
uents of the food metabolome to provide information on
food intake. It should also contain information on their
quality as markers with appropriate references (Fig. 6).
Query concepts, bioinformatics and statistics toolbox
The dbNP provides study data for evaluation by storing,
annotating and pre-processing of multiple layers of data.
Evaluation can thus take place at various levels.
1. metadata
2. a single layer of data of one study
3. a single layer of data across multiple studies
4. multiple layers of data of a single study
5. multiple layers of data across multiple studies
Evaluation usually is performed by statistical packages
and bioinformatics tools. Many of these are available via
the NBX system, especially if available as open source
software. For simple analysis and evaluation (mostly level
2), these tools can read data files in specific formats or
retrieve them directly from a database via web services.
The job of the dbNP is thus twofold: (1) allow selection of
the data of interest; and (2) deliver data to the appropriate
toolboxes either by web services or as data files.
The routine of producing these data files involves
selection of the study parts and studies to be analysed. This
involves metadata query. For example, the dbNP (more
specifically the study description module) should respond
to questions like ‘‘list all studies with PBMC transcriptome
data in men after at least 5 weeks of exposure to fish oil’’.
The study selection query tool will use the same ontology
look up webservices as the study description creation tool
(see: http://www.ebi.ac.uk/ontology-lookup/). This allows
the user to search for instance for ‘‘human’’ studies that
were described as ‘‘homo sapiens’’ during entry of the
study description. This triggers the selection of a subset of
transcriptome data, which after ‘‘manual’’ inspection can
be pre-processed to clean data and presented in the right
format for further statistical and bioinformatics evaluation.
The complexity of the metadata query depends on the
accuracy of capturing the study design in ISA-web.
Nutrition-specific extensions are currently being added to
ISA-Tab using ISA-configurator. ISA-web will be tested
and extended to support these extensions if necessary.
Results from interactive usage can be read directly from the
screen. But in all cases, results will be available and
Clean data db
Study metadata
db
Dataanalysissample
analysis
1
2
3
4
5
Study design
Clean data db
Study metadata
db
Dataanalysissample
analysis
1
2
3
4
5
Study design
Foodanalysis
Foodconsumption
6
7
8
9Clean data
db
Study metadata
db
Dataanalysissample
analysis
1
2
3
4
5
Study design
Clean data db
Study metadata
db
Dataanalysissample
analysis
1
2
3
4
5
Study design
Foodanalysis
Foodconsumption
6
7
8
9
Fig. 6 The food intake module in the dbNP. Detailed information of
food consumption is captured (6) and stored (7) in the clean data
database. Foods are analysed (8), and food composition data are
stored (9) in the clean data database. Both types of data are analysed
(5) and converted into nutrient intake. When no specific food analyses
are carried out, food composition data from external food databases
are used. The food metabolome is analysed in biofluid samples (2)
and the corresponding data stored in the clean data database (3).
Statistical and bioinformatic analyses of the food metabolome data
are used to assess food intake or compliance to the dietary
intervention (5). Other numbers as in Fig. 5
Genes Nutr (2010) 5:189–203 199
123

downloadable as text files that can be interpreted by tools
during next steps of the procedures or pdf files containing
figures. Pathway results in graphical format with annota-
tions can also be exported in html for direct usage and
further interpretation using a webbrowser. Results from
overexpression analysis can be downloaded in standard
(MappFinder, [9]) and used further analysis in tools like
GO_Elite. For the more extensive pipelines sets of data,
text and graphical files can be downloaded in zip archives.
The next version of the study description database will
support SOAP (‘Simple Object Access Protocol’) web ser-
vices, which will allow access to the study description
database by other tools. This is needed for the first type of
querying, directed towards study selection and offers several
advantages. First, it will no longer be necessary to propagate
study description information in the study database to the
different database modules. Each of these modules only
needs to contain a study identifier. Even if researchers only
use a direct graphical user interface to the domain-specific
database, their own database will provide a study selection
interface that directly takes the actual study descriptions
from the study database. If the database modules are devel-
oped using common program environment like Grails/Java,
the development needs to be done only once and not sepa-
rately for all—omics fields. Thus, study descriptions will be
generated only once and can be more extensive than any
domain-specific database. The query interface in any
given—omics database would furthermore be able to show
which other databases contain related results.
The SOAP web services to the study description data-
base will also allow queries from other tools like Gene-
pattern and directly from R/Bioconductor. Furthermore,
they can be used for the development of a more complex
stand-alone query tool. Finally, these web services can be
used for data selection for more knowledge-driven analysis
of, for instance, queries from PathVisio and Cytoscape.
The latter type of analyses thus already combine study
description data, experimental data modules and external
data to understand the experimental outcome of what we
already know, but selects data only based on the study
description.
The second type of querying selects data not only by
study descriptions but also through the data itself, relying on
the use of statistical and bioinformatics tools. Here, ques-
tions like ‘‘which genes in PBMC of men on a high fat diet
are correlated with PPAR-alpha’’ or ‘‘is there a significant
correlation between decrease in CRP and IL-1 in plasma of
women after at least 5 weeks of exposure to fish oil, if the
PPAR-alpha pathway is activated’’. This type of query
needs: (1) selection on metadata; (2) pre-processing of
relevant data (in this case transcriptome and plasma pro-
teins); and (3) preparation of either a data file in the right
format or delivery of the relevant data via a web service.
A query tool that can access both the study metadata
databases and the clean data databases can solve a large part
of this. The tool should be able to invoke R/Bioconductor
procedures to do dedicated study-specific statistics. For
pathway-related questions, several options are possible. The
resulting data can be delivered to pathway analysis, which
can be used for the final pathway statistics [31]. Visualiza-
tions of the query can be made from the pathway analysis tool
itself by for instance a query plug-in in PathVisio. PathVisio
will use the same software library to access the different web
services and API’s that the central query tool uses.
Finally, we will add yet another data level on top of the
clean data databases containing pathway profiles and GO
analysis results. This allows selection of studies that show
changes in the same pathways and clustering approaches
focusing on studies that show comparable results in path-
ways affected or in GO levels where effects occur.
The third type of query uses semantic web-based tech-
nology and will probably become more important in the
future. In this approach, data could be extracted as triples that
define relations between two entities. Each entity would be
stored in a concept store and the relation itself in a triple
store. Both types of data stores can be combined with large
volumes of information collected as part of semantic web
initiatives and used for analyses by tools like Cytoscape
plug-ins, allowing data integration of concepts from differ-
ent data sources (literature, different curated databases and
co-expression databases) with actual correlations in dbNP.
Relationships in dbNP can either be selected directly by
the analytical tool that also accesses concept web-based
knowledge triples, or the dbNP content itself can be trans-
formed into knowledge triples, which can be added to the
concept store and combined with other triple information.
Overlap of triples derived from the two types of sources can
in itself be an interesting target for further evaluation. Co-
expressed genes in dbNP studies that often are mentioned
together in publications about completely different topics or
on protein–protein interaction databases known to have
interacting products might be further evaluated. Because
concept triples allow inclusion of synonymous information,
this kind of combinations can be very powerful. It allows
combining results with much more related knowledge than
is currently done in pathway and network analyses. This
may lead to surprising findings if we allow analyses to
contain information only remotely related domains (dif-
ferent diseases, gene expression, etc.) (Fig. 7).
The Nutrigenomics Organisation as a sustainable model
of the nutritional phenotype database
Although aspects of the planned work could be undertaken
by a local or national approach, providing that the
200 Genes Nutr (2010) 5:189–203
123

necessary broad skill and funding were available, such
approaches would fail to address the major issue of frag-
mentation and lack of:
1. compatibility between methodologies used in different
research centres; and
2. mechanisms to facilitate integrated research maximiz-
ing the benefit of the investment in nutrition research.
The unique feature for the development of the described
dbNP is development of the infrastructure embedded in a
nutrition research network combined with expertise in ana-
lytics and IT. This guarantees that procedures, protocols and
other facilities will be tailored to the specific needs of
researchers on food and health and will ensure acceptance by
the cognate research community. The latter is an essential
aspect, because several previous good initiatives to network
or harmonize methodology in nutrition research have failed
because of poor acceptance and competition between stan-
dards. This is the reason for the explicit choice of an inte-
grated all-encompassing approach with a big network of
associated parties rather than work on a single aspect.
To build this integrated and global dbNP, we have
established the Nutrigenomics Organisation. The objec-
tives of the Nutrigenomics Organisation are to:
1. develop and maintain the nutritional phenotype data-
base using a modular architecture, which can be used
in all types of nutrition and health research studies;
2. develop an integrated toolbox for study evaluation,
replication of study interrogation and meta-analysis,
and determine ‘‘normal’’ values for relevant
parameters;
3. provide standardized protocols, best practice and
codes of practice for procedures that are essential
and specific for nutrition and health research;
4. provide readily usable data formats, standards, ontol-
ogies and controlled vocabularies allowing data stor-
age and sharing;
5. integrate all relevant research via a distributed IT-
infrastructure allowing sharing and exchange of data,
and respect for local ownership;
6. establish a single entrance portal to access data, tools,
technologies and results;
7. Provide a governing body to coordinate facilitate and
integrate the activities.
Box 1 The history of the Nutrigenomics Organisation
NuGO originates from the activities of the European Nutrigenomics
Organisation, a consortium of 23 European universities and research
organisations funded by the European Commission during the
period of 2004–2009 as a ‘‘Network of Excellence.’’ The purpose of
the consortium was to establish a sustainable organisation that
develops and promotes nutrigenomics research, technology,
infrastructure and training. Many of the original consortium
institutes were indeed founding members of the Nutrigenomics
Organisation, a legal entity. Although research collaborations can be
organized on a regional level, a nutrigenomics data infrastructure
only makes sense if organized on a global level. Consequently, the
Nutrigenomics Organisation will grow into a truly global network of
participating research groups.
AnalysisTech X
Studydesign
Technology XClean data db
Technology XRaw data db
Samples
Study metadata
db
Research answer
Queryinterface
Data selection for bioinformatics
Statisticaltoolbox
Bioinformaticstoolbox
Study subset selection
Research question
IdentifiermappingBridgeDB
Technology XPathway & GO
Profiles
Technology XData processing
IdentifiermappingBridgeDB
Fig. 7 Outline of the nutritional phenotype database. (1) An inter-
vention study provides many samples according to its study design,
which is captured and stored in the study metadata database. (2) The
samples undergo a variety of analyses (visualized by ‘‘Technology
X’’, which can be any of the modules on transcriptome, metabolite,
protein, food intake, genetics, etc.), each with its specific and
dedicated raw data storage, raw data pre-processing and storage of
processed ‘‘clean data’’ in a dedicated database per analytical
technology. (3) All ‘‘clean data’’ databases are interrogated based
on study design and connected to a statistical and bioinformatics
toolbox to elucidate the results
Genes Nutr (2010) 5:189–203 201
123
Conclusion
The nutritional phenotype database is a more than a database.
It is a project, which spans three dimensions of nutrition
research: study execution from study design to evaluation,
analysis from food intake to genetics and coordination from a
single laboratory to global collaboration.
The dbNP also is an ongoing project; new analytical
technologies will emerge and better standard operating
procedures will be inserted. Thus, this paper also is a call
for collaboration and invites the molecular nutrition
research community to join this effort supported by the
Nutrigenomics Organisation.
Development of the dbNP is an open source community
effort, with central access at http://www.dbnp.org.
Although many parts are functional, many need to be
completed or initiated. This includes version control,
detailed data management, the genetics module and the
food intake module. Other modules, like imaging and flux
analysis, have not even been designed.
Yet in launching this project, NuGO has high expecta-
tions: dbNP will grow into a global research and collabo-
ration tool, and a publicly available data and knowledge
repository, as an essential basis for a molecular nutrition
research infrastructure. With an increasing number of
nutritional systems biology studies becoming available to
full interrogation in dbNP, this will become a valuable
treasure for new nutrition research.
Box 2 The Nutrigenomics Organisation acts as a non-exclusive
association where partner institutes join on a contractual membership
basis
Associated partners
– Receive a full installation of the Nutrigenomics Organisation
server (NBX) with a local copy of the nutritional phenotype
database and access to the datasharing grid
– Get access to the nutritional phenotype database as research
collaboration tool in contrast to the public-domain version
providing access to all nutritional intervention studies released
into the public domain
– Can access all bioinformatics tools provided by the
Nutrigenomics Organisation, either by shared licences or by
internal development
– Pay a membership fee for maintenance of the infrastructure and
data management, contribute to the progressive development of
the nutritional phenotype database
Acknowledgments Work on dbNP is currently funded primarily
from the following sources: The European Nutrigenomics Organisa-
tion (http://www.nugo.org). The Netherlands Nutrigenomics Con-
sortium (http://www.nutrigenomicsconsortium.nl). The Netherlands
Metabolomics Center (http://www.metabolomicscentre.nl/). The EU
FP6 Network of Excellence Eurreca (http://www.eurreca.org). It is
emphasized that dbNP is an open source project, with many indi-
vidual contributions, not specifically linked to research projects.
Open Access This article is distributed under the terms of the
Creative Commons Attribution Noncommercial License which per-
mits any noncommercial use, distribution, and reproduction in any
medium, provided the original author(s) and source are credited.
References
1. Assfalg M, Bertini I, Colangiuli D, Luchinat C, Schafer H, Schutz
B, Spraul M (2008) Evidence of different metabolic phenotypes
in humans. Proc Natl Acad Sci U S A 105:1420–1424
2. Bernini P, Bertini I, Luchinat C, Nepi S, Saccenti E, Schafer H,
Schutz B, Spraul M, Tenori L (2009) Individual human pheno-
types in metabolic space and time. J Proteome Res 8:4264–4271
3. Bjelakovic G, Nikolova D, Gluud L, Simonetti R, Gluud C (2008)
Antioxidant supplements for prevention of mortality in healthy
participants and patients with various diseases. Cochrane Data-
base Syst Rev CD007176
4. Brazma A, Parkinson H, Sarkans U, Shojatalab M, Vilo J,
Abeygunawardena N, Holloway E, Kapushesky M, Kemmeren P,
Lara GG, Oezcimen A, Rocca-Serra P, Sansone SA (2003) Ar-
rayExpress–a public repository for microarray gene expression
data at the EBI. Nucleic Acids Res 31:68–71
5. Cochrane G, Akhtar R, Bonfield J, Bower L, Demiralp F, Faruque
N, Gibson R, Hoad G, Hubbard T, Hunter C, Jang M, Juhos S,
Leinonen R, Leonard S, Lin Q, Lopez R, Lorenc D, McWilliam
H, Mukherjee G, Plaister S, Radhakrishnan R, Robinson S,
Sobhany S, Hoopen PT, Vaughan R, Zalunin V, Birney E (2009)
Petabyte-scale innovations at the European Nucleotide Archive.
Nucleic Acids Res 37:D19–D25
6. Coort SL, van Iersel MP, van EM, Kooistra T, Kleemann R,
Evelo CT (2008) Bioinformatics for the NuGO proof of principle
study: analysis of gene expression in muscle of ApoE3*Leiden
mice on a high-fat diet using PathVisio. Genes Nutr 3:185–191
7. Cupples LA, Arruda HT, Benjamin EJ, D’Agostino RB Sr, De-
missie S, DeStefano AL, Dupuis J, Falls KM, Fox CS, Gottlieb DJ,
Govindaraju DR, Guo CY, Heard-Costa NL, Hwang SJ, Kathir-
esan S, Kiel DP, Laramie JM, Larson MG, Levy D, Liu CY,
Lunetta KL, Mailman MD, Manning AK, Meigs JB, Murabito JM,
Newton-Cheh C, O’Connor GT, O’Donnell CJ, Pandey M,
Seshadri S, Vasan RS, Wang ZY, Wilk JB, Wolf PA, Yang Q,
Atwood LD (2007) The Framingham Heart Study 100 K SNP
genome-wide association study resource: overview of 17 pheno-
type working group reports. BMC Med Genet 8(Suppl 1):S1
8. de Groot PJ, Reiff C, Mayer C, Muller M (2008) NuGO contri-
butions to GenePattern. Genes Nutr 3:143–146
9. Doniger S, Salomonis N, Dahlquist K, Vranizan K, Lawlor S,
Conklin B (2003) MAPPFinder: using Gene Ontology and Gen-
MAPP to create a global gene-expression profile from microarray
data. Genome Biol 4:R7
10. editorial (2009) What is health? The ability to adapt. Lancet
373:781
11. Emilsson V, Thorleifsson G, Zhang B, Leonardson AS, Zink F,
Zhu J, Carlson S, Helgason A, Walters GB, Gunnarsdottir S,
Mouy M, Steinthorsdottir V, Eiriksdottir GH, Bjornsdottir G,
Reynisdottir I, Gudbjartsson D, Helgadottir A, Jonasdottir A,
Jonasdottir A, Styrkarsdottir U, Gretarsdottir S, Magnusson KP,
Stefansson H, Fossdal R, Kristjansson K, Gislason HG, Stefans-
son T, Leifsson BG, Thorsteinsdottir U, Lamb JR, Gulcher JR,
Reitman ML, Kong A, Schadt EE, Stefansson K (2008) Genetics
of gene expression and its effect on disease. Nature 452:423–428
12. Garosi P, De FC, van EM, Rocca-Serra P, Sansone SA, Elliott R
(2005) Defining best practice for microarray analyses in nutri-
genomic studies. Br J Nutr 93:425–432
202 Genes Nutr (2010) 5:189–203
123

13. Guil S, Esteller M (2009) DNA methylomes, histone codes and
miRNAs: tying it all together. Int J Biochem Cell Biol 41:87–95
14. Harttig U, Travis AJ, Rocca-Serra P, Renkema M, van Ommen B,
Boeing H (2009) Owner controlled data exchange in nutrige-
nomic collaborations: the NuGO information network. Genes
Nutr 4(2):113–122
15. Helgadottir A, Manolescu A, Helgason A, Thorleifsson G,
Thorsteinsdottir U, Gudbjartsson DF, Gretarsdottir S, Magnusson
KP, Gudmundsson G, Hicks A, Jonsson T, Grant SF, Sainz J,
O’Brien SJ, Sveinbjornsdottir S, Valdimarsson EM, Matthiasson
SE, Levey AI, Abramson JL, Reilly MP, Vaccarino V, Wolfe
ML, Gudnason V, Quyyumi AA, Topol EJ, Rader DJ, Thorge-
irsson G, Gulcher JR, Hakonarson H, Kong A, Stefansson K
(2006) A variant of the gene encoding leukotriene A4 hydrolase
confers ethnicity-specific risk of myocardial infarction. Nat Genet
38:68–74
16. Holmes E, Loo RL, Stamler J, Bictash M, Yap IK, Chan Q,
Ebbels T, De IM, Brown IJ, Veselkov KA, Daviglus ML,
Kesteloot H, Ueshima H, Zhao L, Nicholson JK, Elliott P (2008)
Human metabolic phenotype diversity and its association with
diet and blood pressure. Nature 453:396–400
17. Kaput J, Ordovas JM, Ferguson L, van OB, Rodriguez RL, Allen
L, Ames BN, Dawson K, German B, Krauss R, Malyj W, Archer
MC, Barnes S, Bartholomew A, Birk R, van BP, Bradford KJ,
Brown KH, Caetano R, Castle D, Chadwick R, Clarke S, Clement
K, Cooney CA, Corella D, Manica da Cruz I, Daniel H, Duster T,
Ebbesson SO, Elliott R, Fairweather-Tait S, Felton J, Fenech M,
Finley JW, Fogg-Johnson N, Gill-Garrison R, Gibney MJ, Gillies
PJ, Gustafsson JA, Hartman Iv JL, He L, Hwang JK, Jais JP, Jang
Y, Joost H, Junien C, Kanter M, Kibbe WA, Koletzko B, Korf
BR, Kornman K, Krempin DW, Langin D, Lauren DR, Ho LJ,
Leveille GA, Lin SJ, Mathers J, Mayne M, McNabb W, Milner
JA, Morgan P, Muller M, Nikolsky Y, Van der OF, Park T,
Pensel N, Perez-Jimenez F, Poutanen K, Roberts M, Saris WH,
Schuster G, Shelling AN, Simopoulos AP, Southon S, Tai ES,
Towne B, Trayhurn P, Uauy R, Visek WJ, Warden C, Weiss R,
Wiencke J, Winkler J, Wolff GL, Zhao-Wilson X, Zucker JD
(2005) The case for strategic international alliances to harness
nutritional genomics for public and personal health. Br J Nutr
94:623–632
18. Kelder T, Pico AR, Hanspers K, van Iersel MP, Evelo C, Conklin
BR (2009) Mining biological pathways using WikiPathways web
services. PLoS ONE 4:e6447
19. Killcoyne S, Carter GW, Smith J, Boyle J (2009) Cytoscape: a
community-based framework for network modeling. Methods
Mol Biol 563:219–239
20. Mailman MD, Feolo M, Jin Y, Kimura M, Tryka K, Bagoutdinov
R, Hao L, Kiang A, Paschall J, Phan L, Popova N, Pretel S,
Ziyabari L, Lee M, Shao Y, Wang ZY, Sirotkin K, Ward M,
Kholodov M, Zbicz K, Beck J, Kimelman M, Shevelev S, Preuss
D, Yaschenko E, Graeff A, Ostell J, Sherry ST (2007) The NCBI
dbGaP database of genotypes and phenotypes. Nat Genet
39:1181–1186
21. Manach C, Hubert J, Llorach R, Scalbert A (2009) The complex
links between dietary phytochemicals and human health deci-
phered by metabolomics. Mol Nutr Food Res 53:1303–1315
22. Martens L, Hermjakob H, Jones P, Adamski M, Taylor C, States
D, Gevaert K, Vandekerckhove J, Apweiler R (2005) PRIDE: the
proteomics identifications database. Proteomics 5:3537–3545
23. Mathers JC (2008) Personalised nutrition. Epigenomics: a basis
for understanding individual differences? Proc Nutr Soc 67:390–
394
24. Mennen LI, Sapinho D, Ito H, Bertrais S, Galan P, Hercberg S,
Scalbert A (2006) Urinary flavonoids and phenolic acids as
biomarkers of intake for polyphenol-rich foods. Br J Nutr
96:191–198
25. Reich M, Liefeld T, Gould J, Lerner J, Tamayo P, Mesirov JP
(2006) GenePattern 2.0. Nat Genet 38:500–501
26. Ring HZ, Kwok PY, Cotton RG (2006) Human variome project:
an international collaboration to catalogue human genetic varia-
tion. Pharmacogenomics 7:969–972
27. Sansone SA, Fan T, Goodacre R, Griffin JL, Hardy NW,
Kaddurah-Daouk R, Kristal BS, Lindon J, Mendes P, Morrison N,
Nikolau B, Robertson D, Sumner LW, Taylor C, van der WM,
van OB, Fiehn O (2007) The metabolomics standards initiative.
Nat Biotechnol 25:846–848
28. Sansone SA, Rocca-Serra P, Brandizi M, Brazma A, Field D,
Fostel J, Garrow AG, Gilbert J, Goodsaid F, Hardy N, Jones P,
Lister A, Miller M, Morrison N, Rayner T, Sklyar N, Taylor C,
Tong W, Warner G, Wiemann S (2008) The first RSBI (ISA-
TAB) workshop: can a simple format work for complex studies?
OMICS 12:143–149
29. Shaham O, Wei R, Wang TJ, Ricciardi C, Lewis GD, Vasan RS,
Carr SA, Thadhani R, Gerszten RE, Mootha VK (2008) Meta-
bolic profiling of the human response to a glucose challenge
reveals distinct axes of insulin sensitivity. Mol Syst Biol 4:214
30. Stella C, Beckwith-Hall B, Cloarec O, Holmes E, Lindon JC,
Powell J, van der OF, Bingham S, Cross AJ, Nicholson JK (2006)
Susceptibility of human metabolic phenotypes to dietary modu-
lation. J Proteome Res 5:2780–2788
31. Subramanian A, Tamayo P, Mootha VK, Mukherjee S, Ebert BL,
Gillette MA, Paulovich A, Pomeroy SL, Golub TR, Lander ES,
Mesirov JP (2005) Gene set enrichment analysis: a knowledge-
based approach for interpreting genome-wide expression profiles.
Proc Natl Acad Sci U S A 102:15545–15550
32. Taylor CF, Field D, Sansone SA, Aerts J, Apweiler R, Ashburner
M, Ball CA, Binz PA, Bogue M, Booth T, Brazma A, Brinkman
RR, Michael Clark A, Deutsch EW, Fiehn O, Fostel J, Ghazal P,
Gibson F, Gray T, Grimes G, Hancock JM, Hardy NW, Her-
mjakob H, Julian RK, Kane M, Kettner C, Kinsinger C, Kolker E,
Kuiper M, Novere NL, Leebens-Mack J, Lewis SE, Lord P,
Mallon AM, Marthandan N, Masuya H, McNally R, Mehrle A,
Morrison N, Orchard S, Quackenbush J, Reecy JM, Robertson
DG, Rocca-Serra P, Rodriguez H, Rosenfelder H, Santoyo-Lopez
J, Scheuermann RH, Schober D, Smith B, Snape J, Stoeckert CJ,
Tipton K, Sterk P, Untergasser A, Vandesompele J, Wiemann S
(2008) Promoting coherent minimum reporting guidelines for
biological and biomedical investigations: the MIBBI project. Nat
Biotech 26:889–896
33. Tong W, Cao X, Harris S, Sun H, Fang H, Fuscoe J, Harris A,
Hong H, Xie Q, Perkins R, Shi L, Casciano D (2003) Array-
Track–supporting toxicogenomic research at the U.S. Food and
Drug Administration National Center for Toxicological Research.
Environ Health Perspect 111:1819–1826
34. USDA (2009) (2007) USDA Database for the Flavonoid Content
of Selected Foods—Release 2.1
35. van Iersel M, Pico A, Kelder T, Gao J, Ho I, Hanspers K, Conklin
B, Evelo C (2010) The bridgeDb framework: standardized access
to gene, protein and metabolite identifier mapping services. BMC
Bioinform 11:5
36. Yuille M, van Ommen GJ, Brechot C, Cambon-Thomsen A,
Dagher G, Landegren U, Litton JE, Pasterk M, Peltonen L,
Taussig M, Wichmann HE, Zatloukal K (2008) Biobanking for
Europe. Brief Bioinform 9:14–24
37. Zeisel SH, Freake HC, Bauman DE, Bier DM, Burrin DG, Ger-
man JB, Klein S, Marquis GS, Milner JA, Pelto GH, Rasmussen
KM (2005) The nutritional phenotype in the age of metabolo-
mics. J Nutr 135:1613–1616
Genes Nutr (2010) 5:189–203 203
123