Embed Size (px)
Citation preview
Challenges of biological sample preparation for SIMS imaging of elements andmolecules at subcellular resolution
Subhash Chandra
Cornell SIMS Laboratory, Department of Earth and Atmospheric Sciences, Snee Hall, Cornell University, Ithaca, NY 14853, USA
Applied Surface Science 255 (2008) 1273–1284
A R T I C L E I N F O
Article history:
Available online 8 May 2008
Keywords:
SIMS
Freeze-fracture
Imaging 13C15N labeled molecules
Calcium stores
3-D imaging
BNCT
A B S T R A C T
Secondary ion mass spectrometry (SIMS) based imaging techniques capable of subcellular resolution
characterization of elements and molecules are becoming valuable tools in many areas of biology and
medicine. Due to high vacuum requirements of SIMS, the live cells cannot be analyzed directly in the
instrument. The sample preparation, therefore, plays a critical role in preserving the native chemical
composition for SIMS analysis. This work focuses on the evaluation of frozen-hydrated and frozen freeze-
dried sample preparations for SIMS studies of cultured cells with a CAMECA IMS-3f dynamic SIMS ion
microscope instrument capable of producing SIMS images with a spatial resolution of 500 nm. The
sandwich freeze-fracture method was used for fracturing the cells. The complimentary fracture planes in
the plasma membrane were characterized by field-emission secondary electron microscopy (FESEM) in
the frozen-hydrated state. The cells fractured at the dorsal surface were used for SIMS analysis. The
frozen-hydrated SIMS analysis of individual cells under dynamic primary ion beam (O2+) revealed local
secondary ion signal enhancements correlated with the water image signals of 19(H3O)+. A preferential
removal of water from the frozen cell matrix in the Z-axis was also observed. These complications render
the frozen-hydrated sample type less desirable for subcellular dynamic SIMS studies. The freeze-drying
of frozen-hydrated cells, either inside the instrument or externally in a freeze-drier, allowed SIMS
imaging of subcellular chemical composition. Morphological evaluations of fractured freeze-dried cells
with SEM and confocal laser scanning microscopy (CLSM) revealed well-preserved mitochondria, Golgi
apparatus, and stress fibers. SIMS analysis of fractured freeze-dried cells revealed well-preserved
chemical composition of even the most highly diffusible ions like K+ and Na+ in physiologically relevant
concentrations. The high K-low Na signature in individual cells provided a rule-of-thumb criterion for the
validation of sample preparation. The fractured freeze-dried cells allowed 3-D SIMS imaging and
localization of 13C15N labeled molecules and therapeutic drugs containing an elemental tag. Examples are
shown to demonstrate that both diffusible elements and molecules are prone to artifact-induced
relocation at subcellular scale if the sample preparation is compromised. The sample preparation is
problem dependent and may vary widely between the diverse sample types of biological systems and the
type of instrument used for SIMS analysis. The sample preparation, however, must be validated so that
SIMS can be applied with confidence in biology and medicine.
� 2008 Elsevier B.V. All rights reserved.
Contents lists available at ScienceDirect
Applied Surface Science
journal homepage: www.elsevier .com/locate/apsusc
1. Introduction
Secondary ion mass spectrometry (SIMS) imaging techniquesare becoming increasingly valuable tools in many areas ofbiological research due to their capabilities of in situ elementaland molecular analysis at subcellular scale resolution. SIMSimaging with primary ion beams in static regimes are moresuitable to the analysis of molecules [1–5], while SIMS techniques
E-mail address: [email protected].
0169-4332/$ – see front matter � 2008 Elsevier B.V. All rights reserved.
doi:10.1016/j.apsusc.2008.05.073
with dynamic beams are most suitable to studies of elements(isotopes) and isotopically labeled molecules [6–13]. Due to highvacuum requirements of SIMS, the live cells cannot be analyzeddirectly in the instrument. The sample preparation, therefore,plays a critical role in preserving the native chemical compositionfor SIMS analysis. The sample preparation is problem dependentand may vary widely between the diverse sample types ofbiological systems and the type of instrument used for SIMSanalysis. The sample preparation has remained an area of intenseresearch in both organic and inorganic SIMS imaging fields [3,14–21]. This work focuses on the evaluation of the feasibility of frozen-
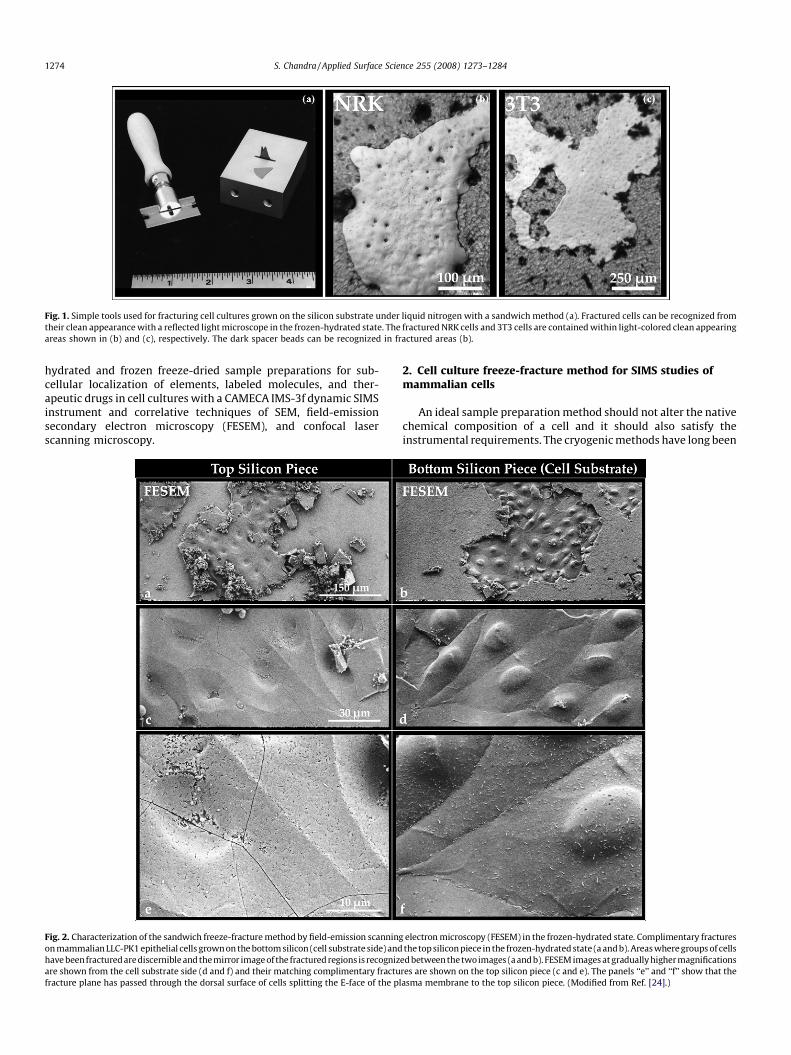
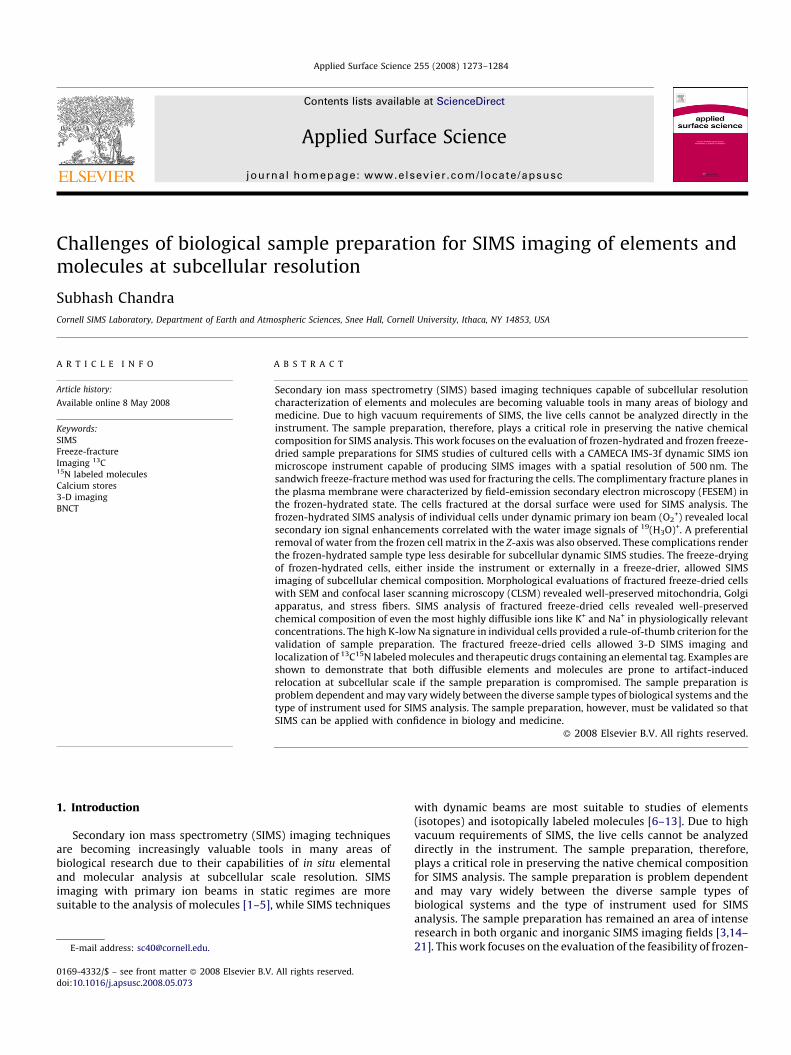
Fig. 1. Simple tools used for fracturing cell cultures grown on the silicon substrate under liquid nitrogen with a sandwich method (a). Fractured cells can be recognized from
their clean appearance with a reflected light microscope in the frozen-hydrated state. The fractured NRK cells and 3T3 cells are contained within light-colored clean appearing
areas shown in (b) and (c), respectively. The dark spacer beads can be recognized in fractured areas (b).
S. Chandra / Applied Surface Science 255 (2008) 1273–12841274
hydrated and frozen freeze-dried sample preparations for sub-cellular localization of elements, labeled molecules, and ther-apeutic drugs in cell cultures with a CAMECA IMS-3f dynamic SIMSinstrument and correlative techniques of SEM, field-emissionsecondary electron microscopy (FESEM), and confocal laserscanning microscopy.
Fig. 2. Characterization of the sandwich freeze-fracture method by field-emission scanning
on mammalian LLC-PK1 epithelial cells grown on the bottom silicon (cell substrate side) and
have been fractured are discernible and the mirror image of the fractured regions is recogniz
are shown from the cell substrate side (d and f) and their matching complimentary fractu
fracture plane has passed through the dorsal surface of cells splitting the E-face of the pl
2. Cell culture freeze-fracture method for SIMS studies ofmammalian cells
An ideal sample preparation method should not alter the nativechemical composition of a cell and it should also satisfy theinstrumental requirements. The cryogenic methods have long been
electron microscopy (FESEM) in the frozen-hydrated state. Complimentary fractures
the top silicon piece in the frozen-hydrated state (a and b). Areas where groups of cells
ed between the twoimages (a and b). FESEM images at gradually higher magnifications
res are shown on the top silicon piece (c and e). The panels ‘‘e’’ and ‘‘f’’ show that the
asma membrane to the top silicon piece. (Modified from Ref. [24].)
S. Chandra / Applied Surface Science 255 (2008) 1273–1284 1275
considered ideal for preserving even the highly diffusible ions andmolecules. The presence of nutrient growth medium complicates adirect analysis of cells in cultures with SIMS. Attempts to wash outthe nutrient medium can perturb the intracellular chemicalcomposition [22]. The cryogenic sample preparation by a simplesandwich freeze-fracture method [23] exposes cell interiors forSIMS analysis without any washing or chemical pretreatments.Fig. 1 shows simple tools needed for this sandwich freeze-fracturemethod. The cells are grown on small pieces of the siliconsubstrates (Fig. 1a). The latex beads are dispersed into the nutrientmedium prior to cryogenic sampling. These beads act as spacers fororienting the fracture plane and they also protect the cells fromsquashing between the two silicon pieces of the sandwich method.After the cells reach the desired confluence on the substrate, theyare sandwiched by another clean silicon piece and the sandwich isfast frozen in a cryogenic fluid and transferred to liquid nitrogen[14,23]. The process of separation of the two surfaces of a sandwichcan be tedious under liquid nitrogen. This process can be simplifiedby using simple tools shown in Fig. 1a. A solid aluminum block isimmersed under liquid nitrogen in a Styrofoam bucket. Thesandwich is then transferred under liquid nitrogen and placed on
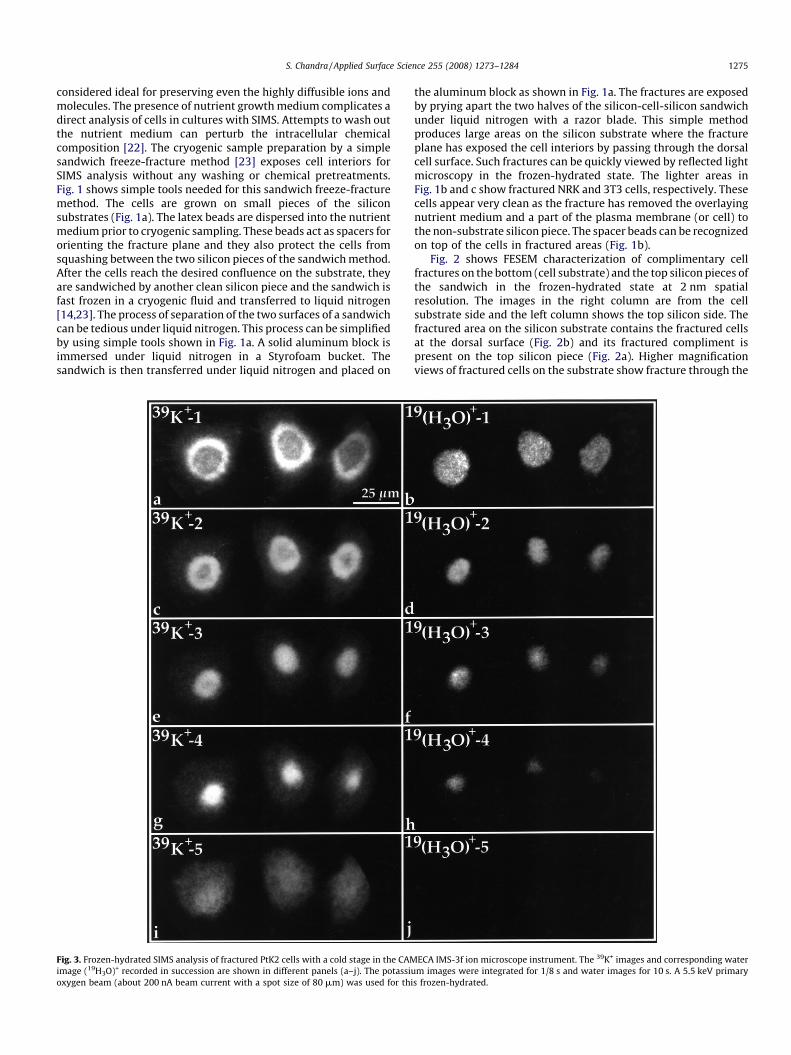
Fig. 3. Frozen-hydrated SIMS analysis of fractured PtK2 cells with a cold stage in the CAM
image (19H3O)+ recorded in succession are shown in different panels (a–j). The potassiu
oxygen beam (about 200 nA beam current with a spot size of 80 mm) was used for thi
the aluminum block as shown in Fig. 1a. The fractures are exposedby prying apart the two halves of the silicon-cell-silicon sandwichunder liquid nitrogen with a razor blade. This simple methodproduces large areas on the silicon substrate where the fractureplane has exposed the cell interiors by passing through the dorsalcell surface. Such fractures can be quickly viewed by reflected lightmicroscopy in the frozen-hydrated state. The lighter areas inFig. 1b and c show fractured NRK and 3T3 cells, respectively. Thesecells appear very clean as the fracture has removed the overlayingnutrient medium and a part of the plasma membrane (or cell) tothe non-substrate silicon piece. The spacer beads can be recognizedon top of the cells in fractured areas (Fig. 1b).
Fig. 2 shows FESEM characterization of complimentary cellfractures on the bottom (cell substrate) and the top silicon pieces ofthe sandwich in the frozen-hydrated state at 2 nm spatialresolution. The images in the right column are from the cellsubstrate side and the left column shows the top silicon side. Thefractured area on the silicon substrate contains the fractured cellsat the dorsal surface (Fig. 2b) and its fractured compliment ispresent on the top silicon piece (Fig. 2a). Higher magnificationviews of fractured cells on the substrate show fracture through the
ECA IMS-3f ion microscope instrument. The 39K+ images and corresponding water
m images were integrated for 1/8 s and water images for 10 s. A 5.5 keV primary
s frozen-hydrated.
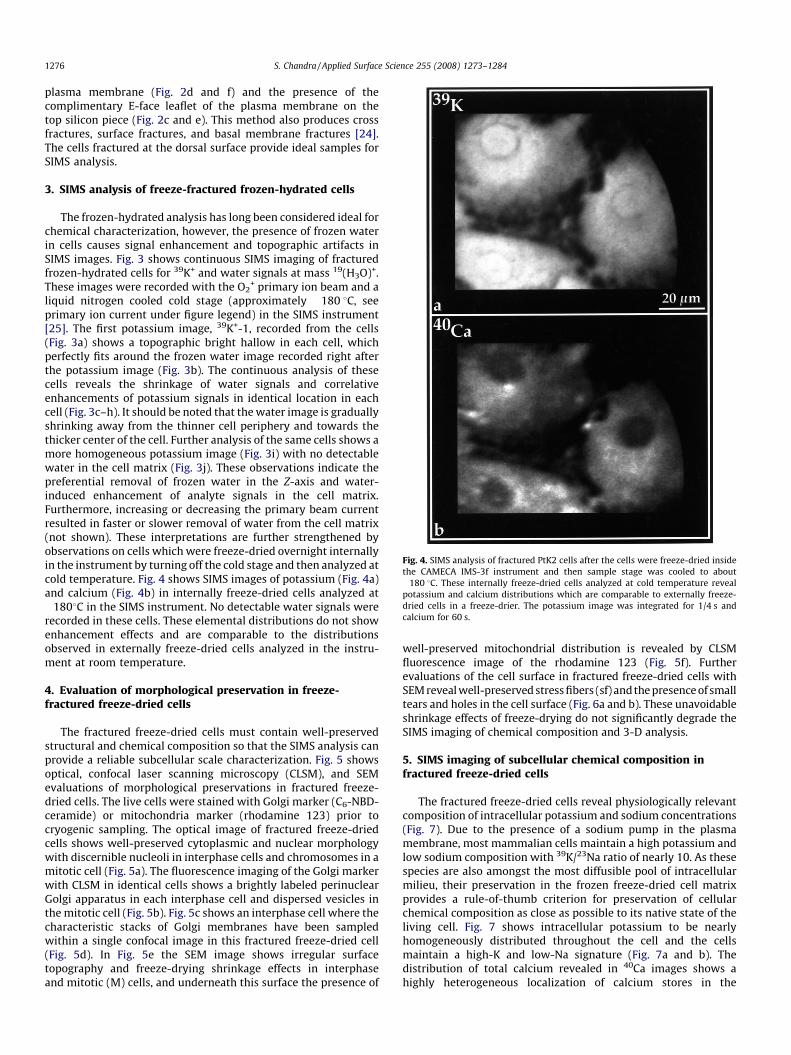
Fig. 4. SIMS analysis of fractured PtK2 cells after the cells were freeze-dried inside
the CAMECA IMS-3f instrument and then sample stage was cooled to about
�180 8C. These internally freeze-dried cells analyzed at cold temperature reveal
potassium and calcium distributions which are comparable to externally freeze-
dried cells in a freeze-drier. The potassium image was integrated for 1/4 s and
calcium for 60 s.
S. Chandra / Applied Surface Science 255 (2008) 1273–12841276
plasma membrane (Fig. 2d and f) and the presence of thecomplimentary E-face leaflet of the plasma membrane on thetop silicon piece (Fig. 2c and e). This method also produces crossfractures, surface fractures, and basal membrane fractures [24].The cells fractured at the dorsal surface provide ideal samples forSIMS analysis.
3. SIMS analysis of freeze-fractured frozen-hydrated cells
The frozen-hydrated analysis has long been considered ideal forchemical characterization, however, the presence of frozen waterin cells causes signal enhancement and topographic artifacts inSIMS images. Fig. 3 shows continuous SIMS imaging of fracturedfrozen-hydrated cells for 39K+ and water signals at mass 19(H3O)+.These images were recorded with the O2
+ primary ion beam and aliquid nitrogen cooled cold stage (approximately �180 8C, seeprimary ion current under figure legend) in the SIMS instrument[25]. The first potassium image, 39K+-1, recorded from the cells(Fig. 3a) shows a topographic bright hallow in each cell, whichperfectly fits around the frozen water image recorded right afterthe potassium image (Fig. 3b). The continuous analysis of thesecells reveals the shrinkage of water signals and correlativeenhancements of potassium signals in identical location in eachcell (Fig. 3c–h). It should be noted that the water image is graduallyshrinking away from the thinner cell periphery and towards thethicker center of the cell. Further analysis of the same cells shows amore homogeneous potassium image (Fig. 3i) with no detectablewater in the cell matrix (Fig. 3j). These observations indicate thepreferential removal of frozen water in the Z-axis and water-induced enhancement of analyte signals in the cell matrix.Furthermore, increasing or decreasing the primary beam currentresulted in faster or slower removal of water from the cell matrix(not shown). These interpretations are further strengthened byobservations on cells which were freeze-dried overnight internallyin the instrument by turning off the cold stage and then analyzed atcold temperature. Fig. 4 shows SIMS images of potassium (Fig. 4a)and calcium (Fig. 4b) in internally freeze-dried cells analyzed at�1808C in the SIMS instrument. No detectable water signals wererecorded in these cells. These elemental distributions do not showenhancement effects and are comparable to the distributionsobserved in externally freeze-dried cells analyzed in the instru-ment at room temperature.
4. Evaluation of morphological preservation in freeze-fractured freeze-dried cells
The fractured freeze-dried cells must contain well-preservedstructural and chemical composition so that the SIMS analysis canprovide a reliable subcellular scale characterization. Fig. 5 showsoptical, confocal laser scanning microscopy (CLSM), and SEMevaluations of morphological preservations in fractured freeze-dried cells. The live cells were stained with Golgi marker (C6-NBD-ceramide) or mitochondria marker (rhodamine 123) prior tocryogenic sampling. The optical image of fractured freeze-driedcells shows well-preserved cytoplasmic and nuclear morphologywith discernible nucleoli in interphase cells and chromosomes in amitotic cell (Fig. 5a). The fluorescence imaging of the Golgi markerwith CLSM in identical cells shows a brightly labeled perinuclearGolgi apparatus in each interphase cell and dispersed vesicles inthe mitotic cell (Fig. 5b). Fig. 5c shows an interphase cell where thecharacteristic stacks of Golgi membranes have been sampledwithin a single confocal image in this fractured freeze-dried cell(Fig. 5d). In Fig. 5e the SEM image shows irregular surfacetopography and freeze-drying shrinkage effects in interphaseand mitotic (M) cells, and underneath this surface the presence of
well-preserved mitochondrial distribution is revealed by CLSMfluorescence image of the rhodamine 123 (Fig. 5f). Furtherevaluations of the cell surface in fractured freeze-dried cells withSEM reveal well-preserved stress fibers (sf) and the presence of smalltears and holes in the cell surface (Fig. 6a and b). These unavoidableshrinkage effects of freeze-drying do not significantly degrade theSIMS imaging of chemical composition and 3-D analysis.
5. SIMS imaging of subcellular chemical composition infractured freeze-dried cells
The fractured freeze-dried cells reveal physiologically relevantcomposition of intracellular potassium and sodium concentrations(Fig. 7). Due to the presence of a sodium pump in the plasmamembrane, most mammalian cells maintain a high potassium andlow sodium composition with 39K/23Na ratio of nearly 10. As thesespecies are also amongst the most diffusible pool of intracellularmilieu, their preservation in the frozen freeze-dried cell matrixprovides a rule-of-thumb criterion for preservation of cellularchemical composition as close as possible to its native state of theliving cell. Fig. 7 shows intracellular potassium to be nearlyhomogeneously distributed throughout the cell and the cellsmaintain a high-K and low-Na signature (Fig. 7a and b). Thedistribution of total calcium revealed in 40Ca images shows ahighly heterogeneous localization of calcium stores in the
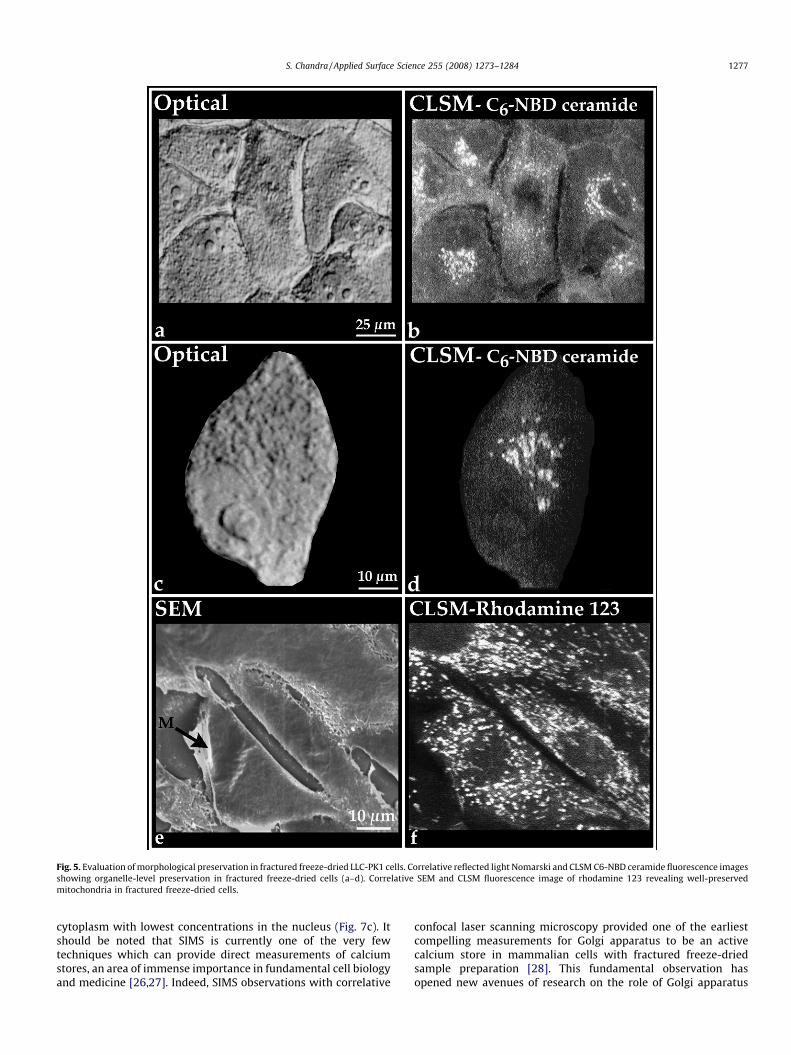
Fig. 5. Evaluation of morphological preservation in fractured freeze-dried LLC-PK1 cells. Correlative reflected light Nomarski and CLSM C6-NBD ceramide fluorescence images
showing organelle-level preservation in fractured freeze-dried cells (a–d). Correlative SEM and CLSM fluorescence image of rhodamine 123 revealing well-preserved
mitochondria in fractured freeze-dried cells.
S. Chandra / Applied Surface Science 255 (2008) 1273–1284 1277
cytoplasm with lowest concentrations in the nucleus (Fig. 7c). Itshould be noted that SIMS is currently one of the very fewtechniques which can provide direct measurements of calciumstores, an area of immense importance in fundamental cell biologyand medicine [26,27]. Indeed, SIMS observations with correlative
confocal laser scanning microscopy provided one of the earliestcompelling measurements for Golgi apparatus to be an activecalcium store in mammalian cells with fractured freeze-driedsample preparation [28]. This fundamental observation hasopened new avenues of research on the role of Golgi apparatus
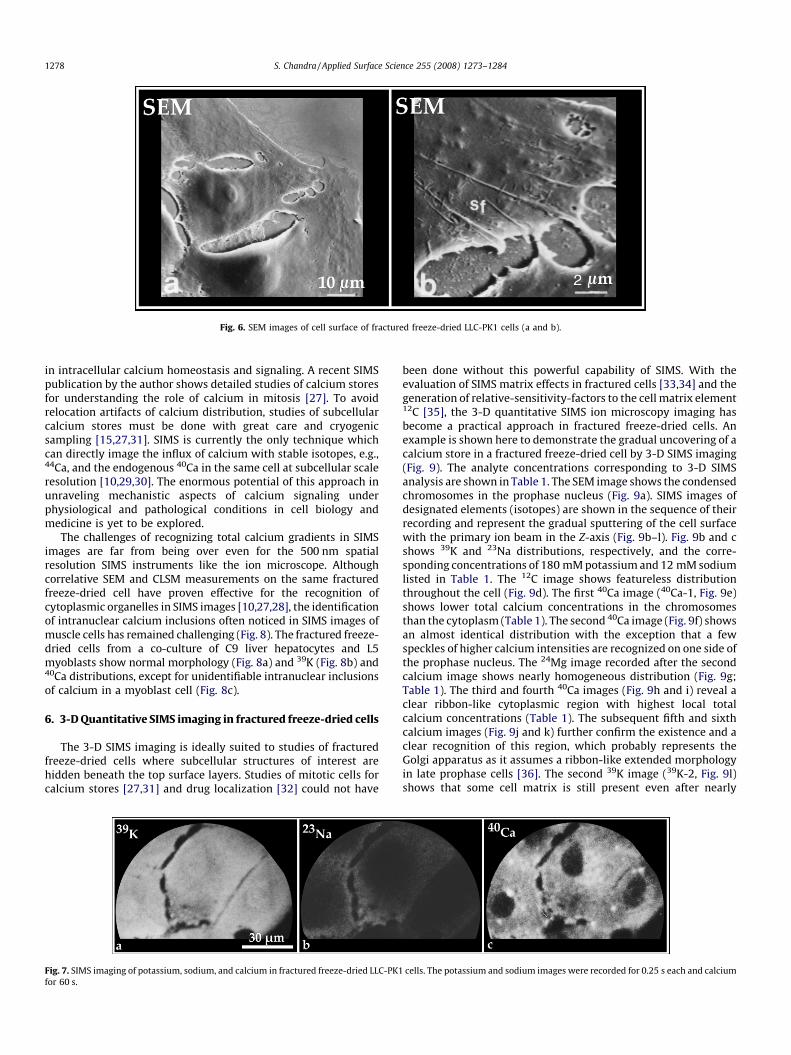
Fig. 6. SEM images of cell surface of fractured freeze-dried LLC-PK1 cells (a and b).
S. Chandra / Applied Surface Science 255 (2008) 1273–12841278
in intracellular calcium homeostasis and signaling. A recent SIMSpublication by the author shows detailed studies of calcium storesfor understanding the role of calcium in mitosis [27]. To avoidrelocation artifacts of calcium distribution, studies of subcellularcalcium stores must be done with great care and cryogenicsampling [15,27,31]. SIMS is currently the only technique whichcan directly image the influx of calcium with stable isotopes, e.g.,44Ca, and the endogenous 40Ca in the same cell at subcellular scaleresolution [10,29,30]. The enormous potential of this approach inunraveling mechanistic aspects of calcium signaling underphysiological and pathological conditions in cell biology andmedicine is yet to be explored.
The challenges of recognizing total calcium gradients in SIMSimages are far from being over even for the 500 nm spatialresolution SIMS instruments like the ion microscope. Althoughcorrelative SEM and CLSM measurements on the same fracturedfreeze-dried cell have proven effective for the recognition ofcytoplasmic organelles in SIMS images [10,27,28], the identificationof intranuclear calcium inclusions often noticed in SIMS images ofmuscle cells has remained challenging (Fig. 8). The fractured freeze-dried cells from a co-culture of C9 liver hepatocytes and L5myoblasts show normal morphology (Fig. 8a) and 39K (Fig. 8b) and40Ca distributions, except for unidentifiable intranuclear inclusionsof calcium in a myoblast cell (Fig. 8c).
6. 3-D Quantitative SIMS imaging in fractured freeze-dried cells
The 3-D SIMS imaging is ideally suited to studies of fracturedfreeze-dried cells where subcellular structures of interest arehidden beneath the top surface layers. Studies of mitotic cells forcalcium stores [27,31] and drug localization [32] could not have
Fig. 7. SIMS imaging of potassium, sodium, and calcium in fractured freeze-dried LLC-PK1
for 60 s.
been done without this powerful capability of SIMS. With theevaluation of SIMS matrix effects in fractured cells [33,34] and thegeneration of relative-sensitivity-factors to the cell matrix element12C [35], the 3-D quantitative SIMS ion microscopy imaging hasbecome a practical approach in fractured freeze-dried cells. Anexample is shown here to demonstrate the gradual uncovering of acalcium store in a fractured freeze-dried cell by 3-D SIMS imaging(Fig. 9). The analyte concentrations corresponding to 3-D SIMSanalysis are shown in Table 1. The SEM image shows the condensedchromosomes in the prophase nucleus (Fig. 9a). SIMS images ofdesignated elements (isotopes) are shown in the sequence of theirrecording and represent the gradual sputtering of the cell surfacewith the primary ion beam in the Z-axis (Fig. 9b–l). Fig. 9b and cshows 39K and 23Na distributions, respectively, and the corre-sponding concentrations of 180 mM potassium and 12 mM sodiumlisted in Table 1. The 12C image shows featureless distributionthroughout the cell (Fig. 9d). The first 40Ca image (40Ca-1, Fig. 9e)shows lower total calcium concentrations in the chromosomesthan the cytoplasm (Table 1). The second 40Ca image (Fig. 9f) showsan almost identical distribution with the exception that a fewspeckles of higher calcium intensities are recognized on one side ofthe prophase nucleus. The 24Mg image recorded after the secondcalcium image shows nearly homogeneous distribution (Fig. 9g;Table 1). The third and fourth 40Ca images (Fig. 9h and i) reveal aclear ribbon-like cytoplasmic region with highest local totalcalcium concentrations (Table 1). The subsequent fifth and sixthcalcium images (Fig. 9j and k) further confirm the existence and aclear recognition of this region, which probably represents theGolgi apparatus as it assumes a ribbon-like extended morphologyin late prophase cells [36]. The second 39K image (39K-2, Fig. 9l)shows that some cell matrix is still present even after nearly
cells. The potassium and sodium images were recorded for 0.25 s each and calcium
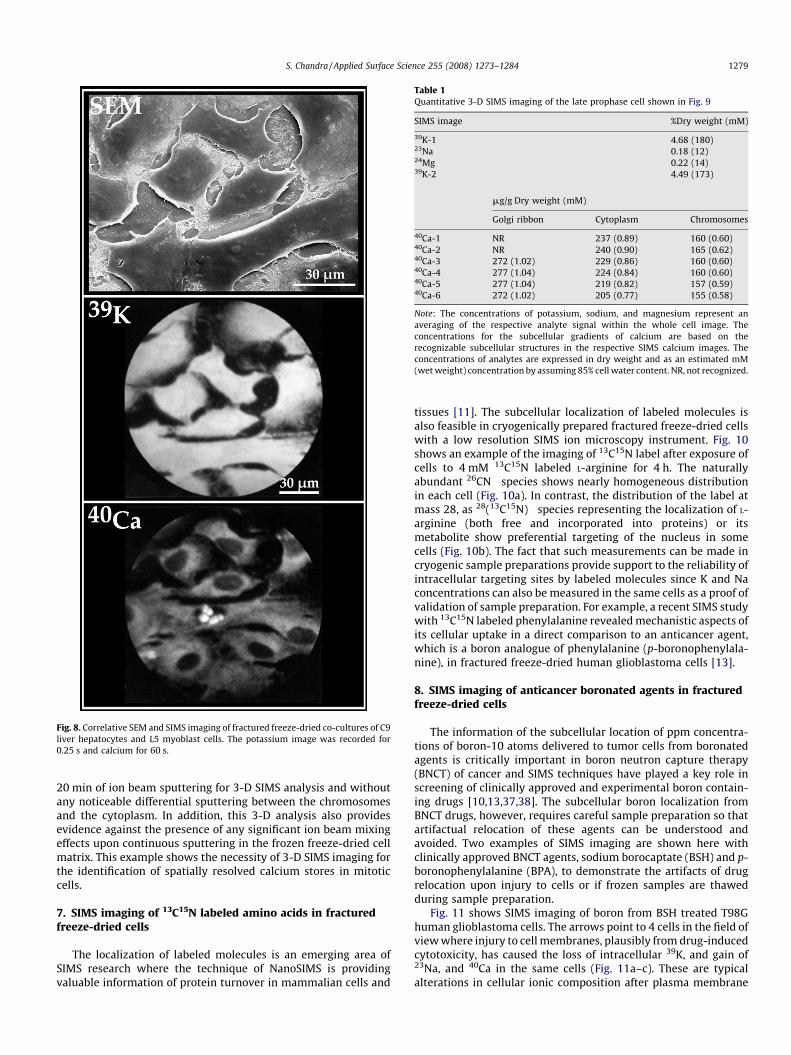
Fig. 8. Correlative SEM and SIMS imaging of fractured freeze-dried co-cultures of C9
liver hepatocytes and L5 myoblast cells. The potassium image was recorded for
0.25 s and calcium for 60 s.
Table 1Quantitative 3-D SIMS imaging of the late prophase cell shown in Fig. 9
SIMS image %Dry weight (mM)
39K-1 4.68 (180)23Na 0.18 (12)24Mg 0.22 (14)39K-2 4.49 (173)
mg/g Dry weight (mM)
Golgi ribbon Cytoplasm Chromosomes
40Ca-1 NR 237 (0.89) 160 (0.60)40Ca-2 NR 240 (0.90) 165 (0.62)40Ca-3 272 (1.02) 229 (0.86) 160 (0.60)40Ca-4 277 (1.04) 224 (0.84) 160 (0.60)40Ca-5 277 (1.04) 219 (0.82) 157 (0.59)40Ca-6 272 (1.02) 205 (0.77) 155 (0.58)
Note: The concentrations of potassium, sodium, and magnesium represent an
averaging of the respective analyte signal within the whole cell image. The
concentrations for the subcellular gradients of calcium are based on the
recognizable subcellular structures in the respective SIMS calcium images. The
concentrations of analytes are expressed in dry weight and as an estimated mM
(wet weight) concentration by assuming 85% cell water content. NR, not recognized.
S. Chandra / Applied Surface Science 255 (2008) 1273–1284 1279
20 min of ion beam sputtering for 3-D SIMS analysis and withoutany noticeable differential sputtering between the chromosomesand the cytoplasm. In addition, this 3-D analysis also providesevidence against the presence of any significant ion beam mixingeffects upon continuous sputtering in the frozen freeze-dried cellmatrix. This example shows the necessity of 3-D SIMS imaging forthe identification of spatially resolved calcium stores in mitoticcells.
7. SIMS imaging of 13C15N labeled amino acids in fracturedfreeze-dried cells
The localization of labeled molecules is an emerging area ofSIMS research where the technique of NanoSIMS is providingvaluable information of protein turnover in mammalian cells and
tissues [11]. The subcellular localization of labeled molecules isalso feasible in cryogenically prepared fractured freeze-dried cellswith a low resolution SIMS ion microscopy instrument. Fig. 10shows an example of the imaging of 13C15N label after exposure ofcells to 4 mM 13C15N labeled L-arginine for 4 h. The naturallyabundant 26CN� species shows nearly homogeneous distributionin each cell (Fig. 10a). In contrast, the distribution of the label atmass 28, as 28(13C15N)� species representing the localization of L-arginine (both free and incorporated into proteins) or itsmetabolite show preferential targeting of the nucleus in somecells (Fig. 10b). The fact that such measurements can be made incryogenic sample preparations provide support to the reliability ofintracellular targeting sites by labeled molecules since K and Naconcentrations can also be measured in the same cells as a proof ofvalidation of sample preparation. For example, a recent SIMS studywith 13C15N labeled phenylalanine revealed mechanistic aspects ofits cellular uptake in a direct comparison to an anticancer agent,which is a boron analogue of phenylalanine (p-boronophenylala-nine), in fractured freeze-dried human glioblastoma cells [13].
8. SIMS imaging of anticancer boronated agents in fracturedfreeze-dried cells
The information of the subcellular location of ppm concentra-tions of boron-10 atoms delivered to tumor cells from boronatedagents is critically important in boron neutron capture therapy(BNCT) of cancer and SIMS techniques have played a key role inscreening of clinically approved and experimental boron contain-ing drugs [10,13,37,38]. The subcellular boron localization fromBNCT drugs, however, requires careful sample preparation so thatartifactual relocation of these agents can be understood andavoided. Two examples of SIMS imaging are shown here withclinically approved BNCT agents, sodium borocaptate (BSH) and p-boronophenylalanine (BPA), to demonstrate the artifacts of drugrelocation upon injury to cells or if frozen samples are thawedduring sample preparation.
Fig. 11 shows SIMS imaging of boron from BSH treated T98Ghuman glioblastoma cells. The arrows point to 4 cells in the field ofview where injury to cell membranes, plausibly from drug-inducedcytotoxicity, has caused the loss of intracellular 39K, and gain of23Na, and 40Ca in the same cells (Fig. 11a–c). These are typicalalterations in cellular ionic composition after plasma membrane
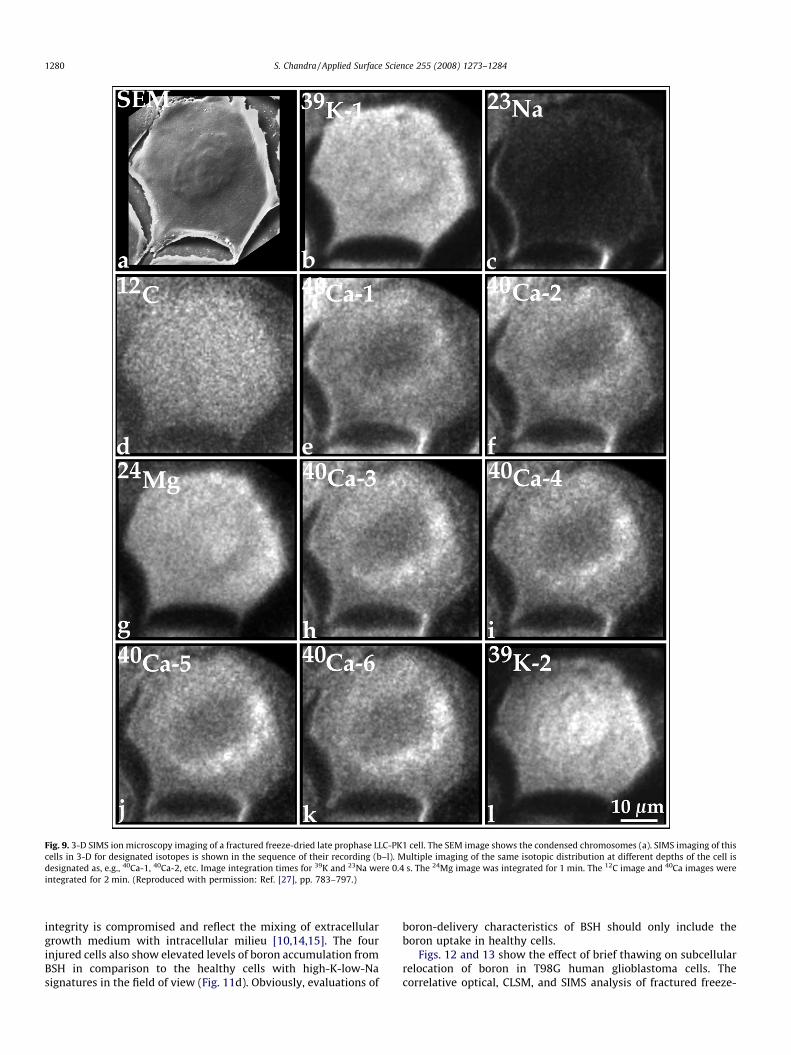
Fig. 9. 3-D SIMS ion microscopy imaging of a fractured freeze-dried late prophase LLC-PK1 cell. The SEM image shows the condensed chromosomes (a). SIMS imaging of this
cells in 3-D for designated isotopes is shown in the sequence of their recording (b–l). Multiple imaging of the same isotopic distribution at different depths of the cell is
designated as, e.g., 40Ca-1, 40Ca-2, etc. Image integration times for 39K and 23Na were 0.4 s. The 24Mg image was integrated for 1 min. The 12C image and 40Ca images were
integrated for 2 min. (Reproduced with permission: Ref. [27], pp. 783–797.)
S. Chandra / Applied Surface Science 255 (2008) 1273–12841280
integrity is compromised and reflect the mixing of extracellulargrowth medium with intracellular milieu [10,14,15]. The fourinjured cells also show elevated levels of boron accumulation fromBSH in comparison to the healthy cells with high-K-low-Nasignatures in the field of view (Fig. 11d). Obviously, evaluations of
boron-delivery characteristics of BSH should only include theboron uptake in healthy cells.
Figs. 12 and 13 show the effect of brief thawing on subcellularrelocation of boron in T98G human glioblastoma cells. Thecorrelative optical, CLSM, and SIMS analysis of fractured freeze-
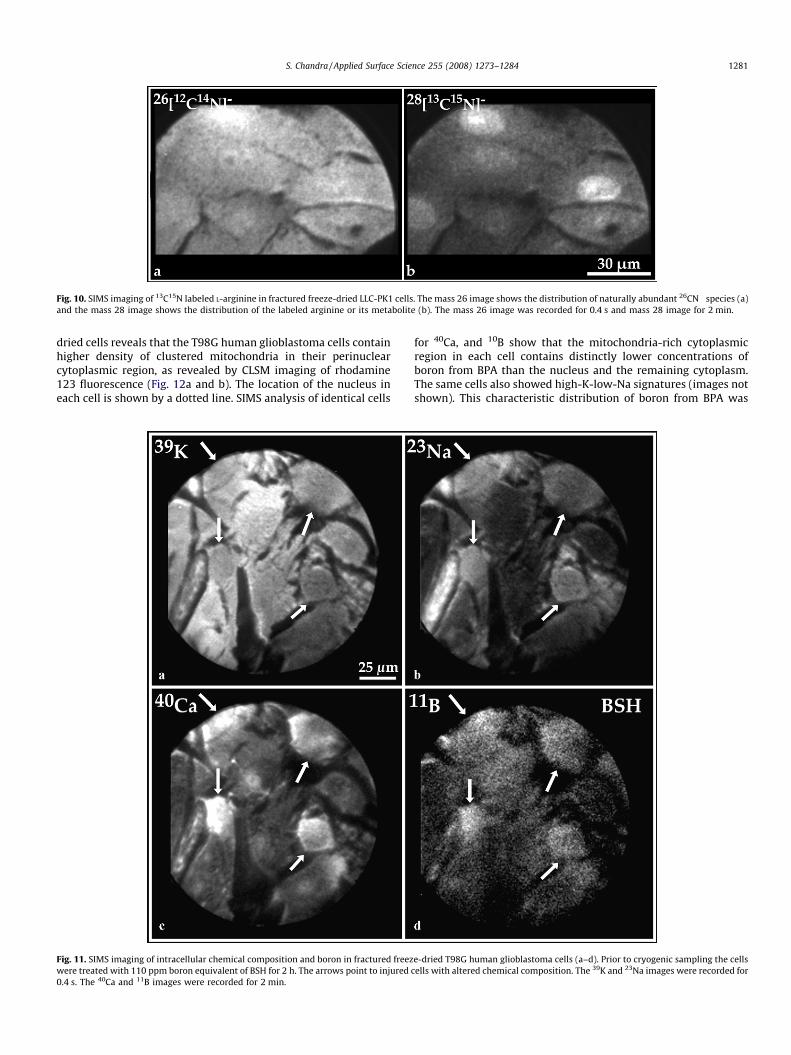
Fig. 10. SIMS imaging of 13C15N labeled L-arginine in fractured freeze-dried LLC-PK1 cells. The mass 26 image shows the distribution of naturally abundant 26CN� species (a)
and the mass 28 image shows the distribution of the labeled arginine or its metabolite (b). The mass 26 image was recorded for 0.4 s and mass 28 image for 2 min.
S. Chandra / Applied Surface Science 255 (2008) 1273–1284 1281
dried cells reveals that the T98G human glioblastoma cells containhigher density of clustered mitochondria in their perinuclearcytoplasmic region, as revealed by CLSM imaging of rhodamine123 fluorescence (Fig. 12a and b). The location of the nucleus ineach cell is shown by a dotted line. SIMS analysis of identical cells
Fig. 11. SIMS imaging of intracellular chemical composition and boron in fractured freez
were treated with 110 ppm boron equivalent of BSH for 2 h. The arrows point to injured c
0.4 s. The 40Ca and 11B images were recorded for 2 min.
for 40Ca, and 10B show that the mitochondria-rich cytoplasmicregion in each cell contains distinctly lower concentrations ofboron from BPA than the nucleus and the remaining cytoplasm.The same cells also showed high-K-low-Na signatures (images notshown). This characteristic distribution of boron from BPA was
e-dried T98G human glioblastoma cells (a–d). Prior to cryogenic sampling the cells
ells with altered chemical composition. The 39K and 23Na images were recorded for
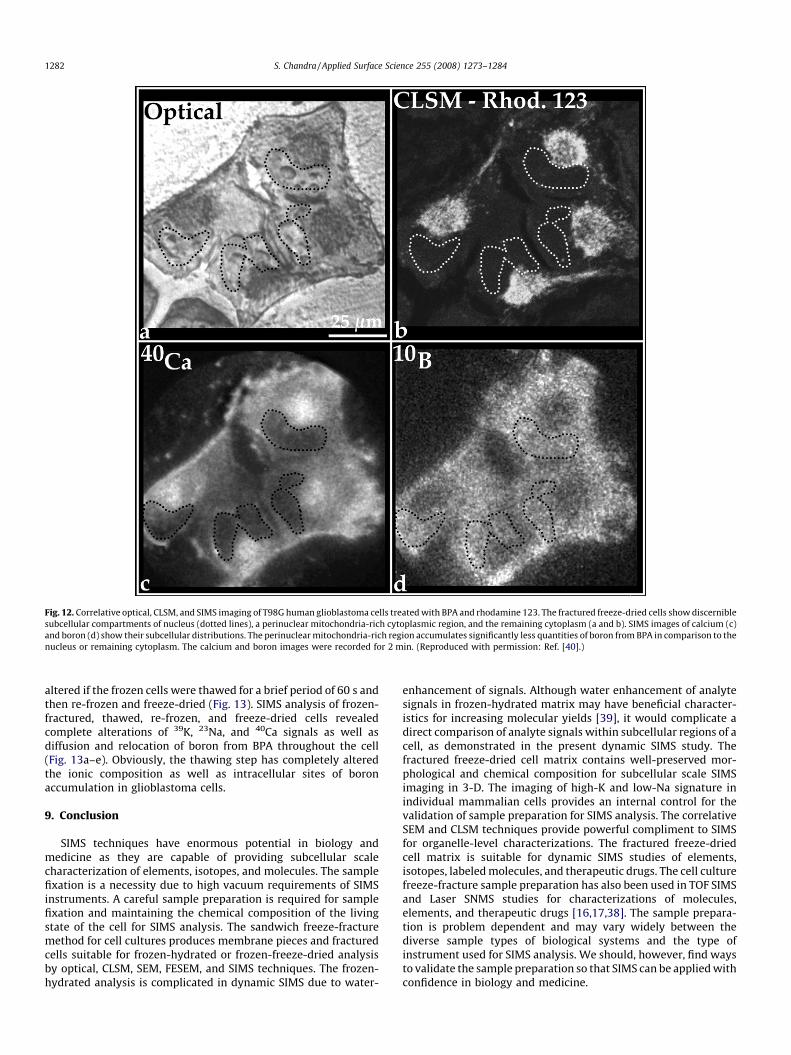
Fig. 12. Correlative optical, CLSM, and SIMS imaging of T98G human glioblastoma cells treated with BPA and rhodamine 123. The fractured freeze-dried cells show discernible
subcellular compartments of nucleus (dotted lines), a perinuclear mitochondria-rich cytoplasmic region, and the remaining cytoplasm (a and b). SIMS images of calcium (c)
and boron (d) show their subcellular distributions. The perinuclear mitochondria-rich region accumulates significantly less quantities of boron from BPA in comparison to the
nucleus or remaining cytoplasm. The calcium and boron images were recorded for 2 min. (Reproduced with permission: Ref. [40].)
S. Chandra / Applied Surface Science 255 (2008) 1273–12841282
altered if the frozen cells were thawed for a brief period of 60 s andthen re-frozen and freeze-dried (Fig. 13). SIMS analysis of frozen-fractured, thawed, re-frozen, and freeze-dried cells revealedcomplete alterations of 39K, 23Na, and 40Ca signals as well asdiffusion and relocation of boron from BPA throughout the cell(Fig. 13a–e). Obviously, the thawing step has completely alteredthe ionic composition as well as intracellular sites of boronaccumulation in glioblastoma cells.
9. Conclusion
SIMS techniques have enormous potential in biology andmedicine as they are capable of providing subcellular scalecharacterization of elements, isotopes, and molecules. The samplefixation is a necessity due to high vacuum requirements of SIMSinstruments. A careful sample preparation is required for samplefixation and maintaining the chemical composition of the livingstate of the cell for SIMS analysis. The sandwich freeze-fracturemethod for cell cultures produces membrane pieces and fracturedcells suitable for frozen-hydrated or frozen-freeze-dried analysisby optical, CLSM, SEM, FESEM, and SIMS techniques. The frozen-hydrated analysis is complicated in dynamic SIMS due to water-
enhancement of signals. Although water enhancement of analytesignals in frozen-hydrated matrix may have beneficial character-istics for increasing molecular yields [39], it would complicate adirect comparison of analyte signals within subcellular regions of acell, as demonstrated in the present dynamic SIMS study. Thefractured freeze-dried cell matrix contains well-preserved mor-phological and chemical composition for subcellular scale SIMSimaging in 3-D. The imaging of high-K and low-Na signature inindividual mammalian cells provides an internal control for thevalidation of sample preparation for SIMS analysis. The correlativeSEM and CLSM techniques provide powerful compliment to SIMSfor organelle-level characterizations. The fractured freeze-driedcell matrix is suitable for dynamic SIMS studies of elements,isotopes, labeled molecules, and therapeutic drugs. The cell culturefreeze-fracture sample preparation has also been used in TOF SIMSand Laser SNMS studies for characterizations of molecules,elements, and therapeutic drugs [16,17,38]. The sample prepara-tion is problem dependent and may vary widely between thediverse sample types of biological systems and the type ofinstrument used for SIMS analysis. We should, however, find waysto validate the sample preparation so that SIMS can be applied withconfidence in biology and medicine.
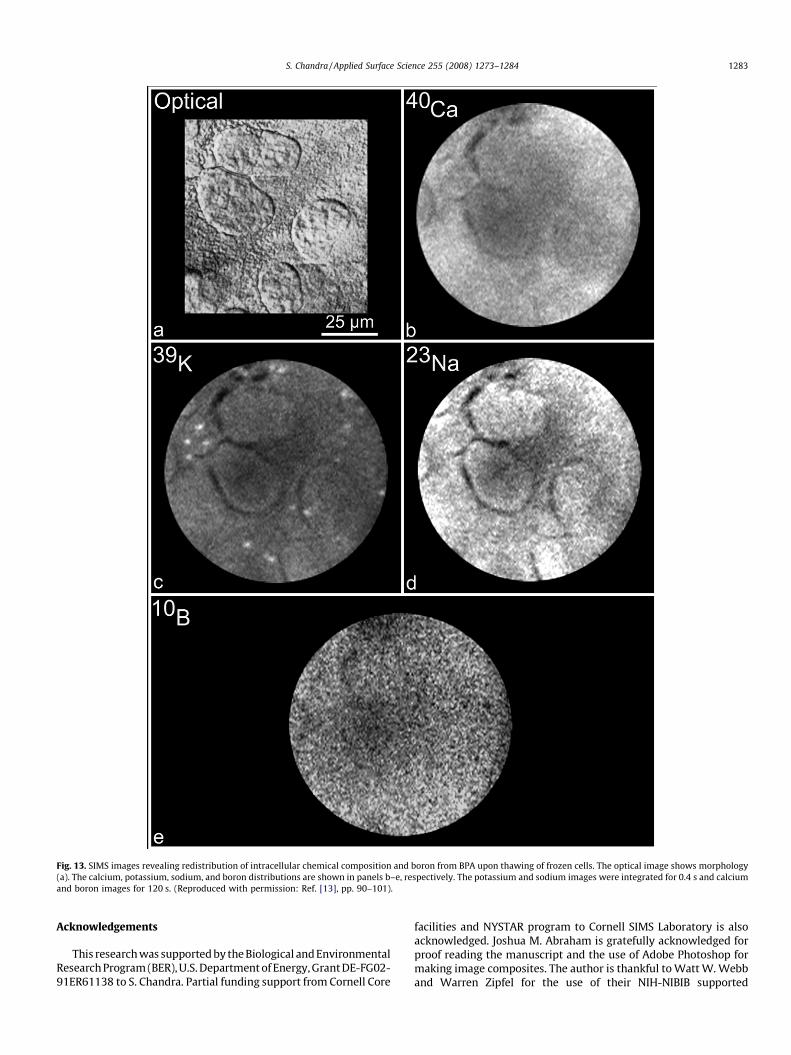
Fig. 13. SIMS images revealing redistribution of intracellular chemical composition and boron from BPA upon thawing of frozen cells. The optical image shows morphology
(a). The calcium, potassium, sodium, and boron distributions are shown in panels b–e, respectively. The potassium and sodium images were integrated for 0.4 s and calcium
and boron images for 120 s. (Reproduced with permission: Ref. [13], pp. 90–101).
S. Chandra / Applied Surface Science 255 (2008) 1273–1284 1283
Acknowledgements
This research was supported by the Biological and EnvironmentalResearch Program (BER), U.S. Department of Energy, Grant DE-FG02-91ER61138 to S. Chandra. Partial funding support from Cornell Core
facilities and NYSTAR program to Cornell SIMS Laboratory is alsoacknowledged. Joshua M. Abraham is gratefully acknowledged forproof reading the manuscript and the use of Adobe Photoshop formaking image composites. The author is thankful to Watt W. Webband Warren Zipfel for the use of their NIH-NIBIB supported
S. Chandra / Applied Surface Science 255 (2008) 1273–12841284
Developmental Resource for Biophysical Imaging Opto-electronics(DRBIO) at Cornell in culturing the cells and fluorescence imagingwith Confocal Laser Scanning Microscopy.
References
[1] K.R. Amaya, E.B. Monroe, et al. Int. J. Mass Spectrom. 260 (2007) 121.[2] N. Winograd, Anal. Chem. 77 (2005) 143A.[3] S. Parry, N. Winograd, Anal. Chem. 77 (2005) 7950.[4] K. Borner, P. Malmberg, et al. Int. J. Mass Spectrom. 260 (2007) 128.[5] E.A. Jones, N.P. Lockyer, J.C. Vickerman, Int. J. Mass Spectrom. 260 (2007) 146.[6] R. Castaing, G. Slodzian, J. Microsc. (Paris) 1 (1962) 395.[7] G. Slodzian, B. Daigne, et al. Biol. Cell 74 (1992) 43.[8] R. Levi-Setti, K.L. Gavrilov, et al. Appl. Surf. Sci. 252 (2006) 6907.[9] E. Hindie, B. Coulomb, et al. Biol. Cell 74 (1992) 81.
[10] S. Chandra, D.R. Smith, et al. Anal. Chem. 72 (2000) 104A.[11] C. Lechene, F. Hillion, et al. J. Biol. 5 (2006) 20.[12] K.E. Smart, M.R. Kilburn, et al. Int. J. Mass Spectrom. 260 (2007) 107.[13] S. Chandra, D.R. Lorey, Int. J. Mass Spectrom. 260 (2007) 90.[14] S. Chandra, G.H. Morrison, Biol. Cell 74 (1992) 31.[15] S. Chandra, G.H. Morrison, Int. J. Mass Spectrom. Ion Proc. 143 (1995) 161.[16] T.P. Roddy, D.M. Cannon, et al. Anal. Chem. 74 (2002) 4011.[17] E. Gazi, J. Dwyer, et al. Faraday Diss. 126 (2003) 126.[18] P. Sjovall, J. Lausmaa, et al. Anal. Chem. 76 (2004) 4271.
[19] H. Nygen, B.R. Johansson, et al. Microsc. Res. Tech. 65 (2004) 282.[20] G. McMahon, B.J. Glassner, et al. Appl. Surf. Sci. 252 (2006) 6895.[21] L. Wu, L. Xiaochen, et al. Int. J. Mass Spectrom. 260 (2007) 137.[22] J. Wroblewski, J.M. Roomans, et al. Scan. Elect. Microsc. 2 (1983) 777.[23] S. Chandra, G.H. Morrison, et al. J. Microsc. (Oxford) 144 (1986) 15.[24] S. Chandra, G.H. Morrison, J. Microsc. (Oxford) 186 (1997) 232.[25] M.T. Bernius, S. Chandra, et al. Rev. Sci. Instrum. 56 (1985) 1347–1351.[26] M.J. Berridge, M.D. Bootman, et al. Nat. Rev. Mol. Cell Biol. 4 (2003) 517.[27] S. Chandra, Eur. J. Cell Biol. 84 (2005) 783.[28] S. Chandra, E.P.W. Kable, et al. J. Cell Sci. 100 (1991) 747.[29] S. Chandra, C.S. Fullmer, et al. Proc. Natl. Acad. Sci. U.S.A. 87 (1989) 1870.[30] S. Chandra, W.A. Ausserer, et al. J. Cell Sci. 102 (1992) 417.[31] S. Chandra, J. Microsc. (Oxford) 204 (2001) 150.[32] S. Chandra, W. Tjarks, et al. J. Microsc. (Oxford) 229 (2008) 92.[33] S. Chandra, W.A. Ausserer, et al. J. Microsc. (Oxford) 148 (1987) 223.[34] W.A. Ausserer, S. Chandra, et al. J. Microsc. (Oxford) 154 (1988) 39.[35] W.A. Ausserer, Y.C. Ling, et al. Anal. Chem. 61 (1989) 2690.[36] E. Jokitalo, N. Cabrera-Poch, et al. J. Cell Biol. 154 (2001) 317.[37] D.R. Smith, S. Chandra, et al. Cancer Res. 61 (2001) 8179.[38] M. Fartmann, S. Dambach, et al. in: W. Sauerwein, R. Moss, A. Wittig (Eds.),
Proceedings of the 10th International Congress on Neutron Capture Therapy,Monduzzi Editore, Bologna, Italy, 2002, pp. 865–870.
[39] X.A. Conlon, N.P. Loclyer, J.C. Vickerman, Rapid Commun. Mass Spectrom. 20(2006) 1327.
[40] S. Chandra, et al. Clin. Cancer Res. 8 (2002) 2675–2683.


![Chemical analysis of surfaces and organic thin films by means of SIMS · 2015-01-09 · Summary SSIMS [ToF-SIMS] SSIMS is a method oriented to detect and analyse molecules on the](https://img.pdfslide.us/doc/110x75/5f7025b9c2e59c51ca4fa346/chemical-analysis-of-surfaces-and-organic-thin-films-by-means-of-2015-01-09-summary.jpg)