Embed Size (px)
Citation preview
Opportunities & Challenges for Engaging Merchants in the
Protection of Retail Assets.
2
Opening Remarks
This unique study, commissioned by the RILA Asset Protection Leaders Council, is the latest in a series of
strategic research projects designed to bring new insights, tools, and techniques to help the industry
better tackle the stubborn problem of inventory loss.
In this study, Nicole DeHoratius and Dragana Pajovic, from the University of Chicago Booth School of
Business, conducted face‐to‐face and phone interviews with 31 retail organizations and surveyed
hundreds of retail buyers. Their findings point to a significant opportunity for greater collaboration
between merchants and asset protection teams for the typical retailer. The study identifies several key
strategies that can enable better collaboration. Importantly, the report shares some examples and
results of effective collaboration already in action.
RILA would like to thank the academics for their thought leadership as well as Checkpoint Systems and
Ernst & Young for their support and continued commitment to helping retailers achieve operational
excellence. And, finally, we thank the many retailers and product manufacturers that participated in the
study.
Lisa LaBruno, Esq.
Senior Vice President, Retail Operations
Retail Industry Leaders Association (RILA)
3
Table of Contents
Section Page #
Executive Summary 4
Research Approach 5
Introduction 6
How Buyers Impact Operational Execution 9
Changing the buyer’s mindset: Education & Training 13
Changing the buyer’s mindset: Enhanced Analytics 20
Current Opportunities 23
Summary of Key Findings 25
Appendix 1: List of Participating Companies 29
Appendix 2: List of Survey Questions 30
Appendix 3: Costco 33
Appendix 4: AutoZone 51
Appendix 5: Best Buy 72
About the Authors 86
Acknowledgements 87
4
Executive Summary
RILA’s Asset Protection Leaders Council is dedicated to identifying strategic initiatives that help retailers
detect and prevent loss in their organization. Preventing loss is non‐trivial. It requires the cooperation
of a variety of retail constituents including store leadership, distribution and transportation teams,
product designers, and the legal department, just to name a few. Merchants, or retail buyers, are also
an important part of the asset protection equation. This research identifies the various levers retail
buyers have to influence retail loss and the obstacles asset protection groups face when seeking buyer
engagement. Specifically, we determine which operational decisions require, or benefit from, buyer
engagement.
Among RILA APLC retail members, we find substantial heterogeneity in the ability of asset protection
teams to obtain the commitment and attention of retail merchants in spite of their importance to the
protection of retail assets. Herein, we describe successful efforts undertaken by various RILA retail
members to engage retail buyers. We identify what factors led to their success and, more importantly,
offer a number of recommendations as to how to improve the coordination between asset protection
teams and merchant groups. We generalize our findings by providing a framework retailers can use to
benchmark their own organization. Specifically, we characterize what industry leading organizations are
doing differently from ones that are moving towards such leadership and from ones who exhibit only
basic competence in their asset protection approaches.
Overall, tremendous opportunity exists to improve merchant engagement in asset protection. Key
findings include a narrow perception of asset protection’s role within the organization among buyers, a
lack of understanding among buyers about their ability to impact loss, ineffective communication
between merchant and asset protection teams, and a general lack of coordination among groups. These
challenges are exacerbated by the fact that retail merchants are often managing multiple product
categories and hundreds if not thousands of stock‐keeping‐units (SKUs). The complexity of the buying
function results in buyers who are already overwhelmed with their existing initiatives.
Our objective is to provide asset protection teams with clear guidance on actions they can take within
their organization to help ensure buyers are educated about their shrink prevention role and be able to
cite a number of firms that have successfully motivated their buyers to think outside the traditional
scope of their buying activities to deliver better results. In so doing, this research supports the central
mission of RILA to have all its members work collectively – in a coordinated fashion – to facilitate growth
through improved operational performance in the retail industry.
5
Research Approach
This research entailed in‐depth interviews with one or more individuals representing 31 retailers that
collectively account for over $1 trillion in US retail sales, or approximately 23% of all US retail sales. The
focus of these interviews was to learn about asset protection strategies and the challenges asset
protection groups face in engaging retail buyers within their organizations. Interviewees were asked to
describe successful approaches as well as approaches that had failed to generate the desired results.
Our primary objective was to develop a clear picture of the current role of buyers in asset protection
and identify the decisions buyers make that influence loss through examples and case stories. See
Appendix 1 for a list of participating organizations.
We also spent time on‐site visiting the asset protection teams, merchandising groups, store operations,
inventory planners, distribution center managers, sourcing professionals, vendor representatives, and
omnichannel strategists of six retailers. Through these interviews we captured first‐hand information
about how other parts of the organization perceive asset protection. We utilized the output of these
site visits to ultimately design a survey that we distributed to 336 buyers among select RILA APLC
retailers. The survey helped us identify what shrink prevention activities buyers currently assist with
and what more can be done. More importantly, it captured the buyer’s perception of asset protection
activities such as the asset protection team’s ability to communicate, to provide analytical solutions, to
influence decision‐making, and to improve retail performance. See Appendix 2 for a list of survey
questions.
6
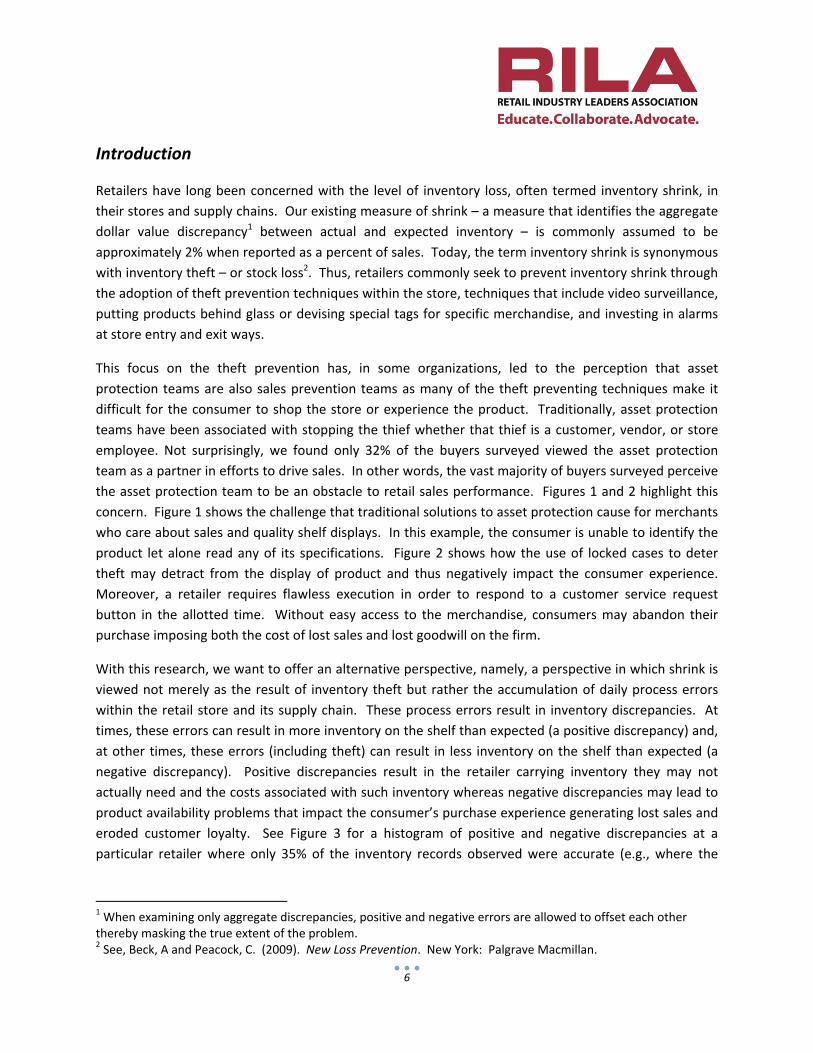
Introduction
Retailers have long been concerned with the level of inventory loss, often termed inventory shrink, in
their stores and supply chains. Our existing measure of shrink – a measure that identifies the aggregate
dollar value discrepancy1 between actual and expected inventory – is commonly assumed to be
approximately 2% when reported as a percent of sales. Today, the term inventory shrink is synonymous
with inventory theft – or stock loss2. Thus, retailers commonly seek to prevent inventory shrink through
the adoption of theft prevention techniques within the store, techniques that include video surveillance,
putting products behind glass or devising special tags for specific merchandise, and investing in alarms
at store entry and exit ways.
This focus on the theft prevention has, in some organizations, led to the perception that asset
protection teams are also sales prevention teams as many of the theft preventing techniques make it
difficult for the consumer to shop the store or experience the product. Traditionally, asset protection
teams have been associated with stopping the thief whether that thief is a customer, vendor, or store
employee. Not surprisingly, we found only 32% of the buyers surveyed viewed the asset protection
team as a partner in efforts to drive sales. In other words, the vast majority of buyers surveyed perceive
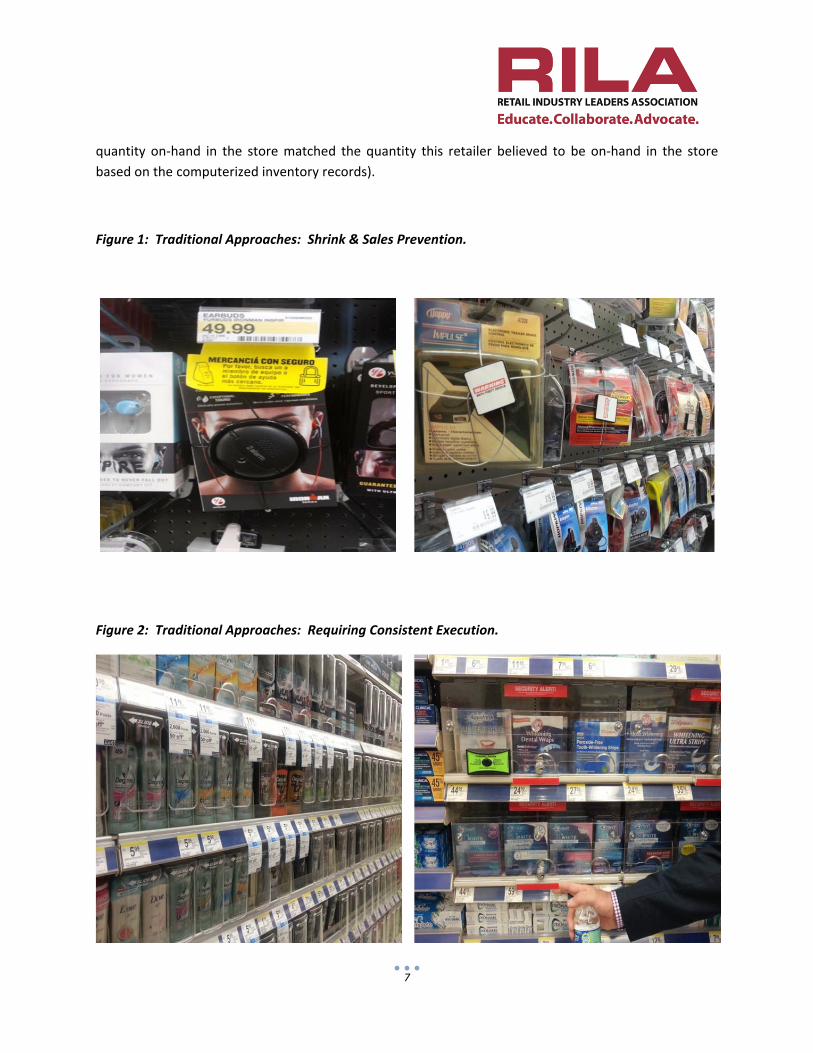
the asset protection team to be an obstacle to retail sales performance. Figures 1 and 2 highlight this
concern. Figure 1 shows the challenge that traditional solutions to asset protection cause for merchants
who care about sales and quality shelf displays. In this example, the consumer is unable to identify the
product let alone read any of its specifications. Figure 2 shows how the use of locked cases to deter
theft may detract from the display of product and thus negatively impact the consumer experience.
Moreover, a retailer requires flawless execution in order to respond to a customer service request
button in the allotted time. Without easy access to the merchandise, consumers may abandon their
purchase imposing both the cost of lost sales and lost goodwill on the firm.
With this research, we want to offer an alternative perspective, namely, a perspective in which shrink is
viewed not merely as the result of inventory theft but rather the accumulation of daily process errors
within the retail store and its supply chain. These process errors result in inventory discrepancies. At
times, these errors can result in more inventory on the shelf than expected (a positive discrepancy) and,
at other times, these errors (including theft) can result in less inventory on the shelf than expected (a
negative discrepancy). Positive discrepancies result in the retailer carrying inventory they may not
actually need and the costs associated with such inventory whereas negative discrepancies may lead to
product availability problems that impact the consumer’s purchase experience generating lost sales and
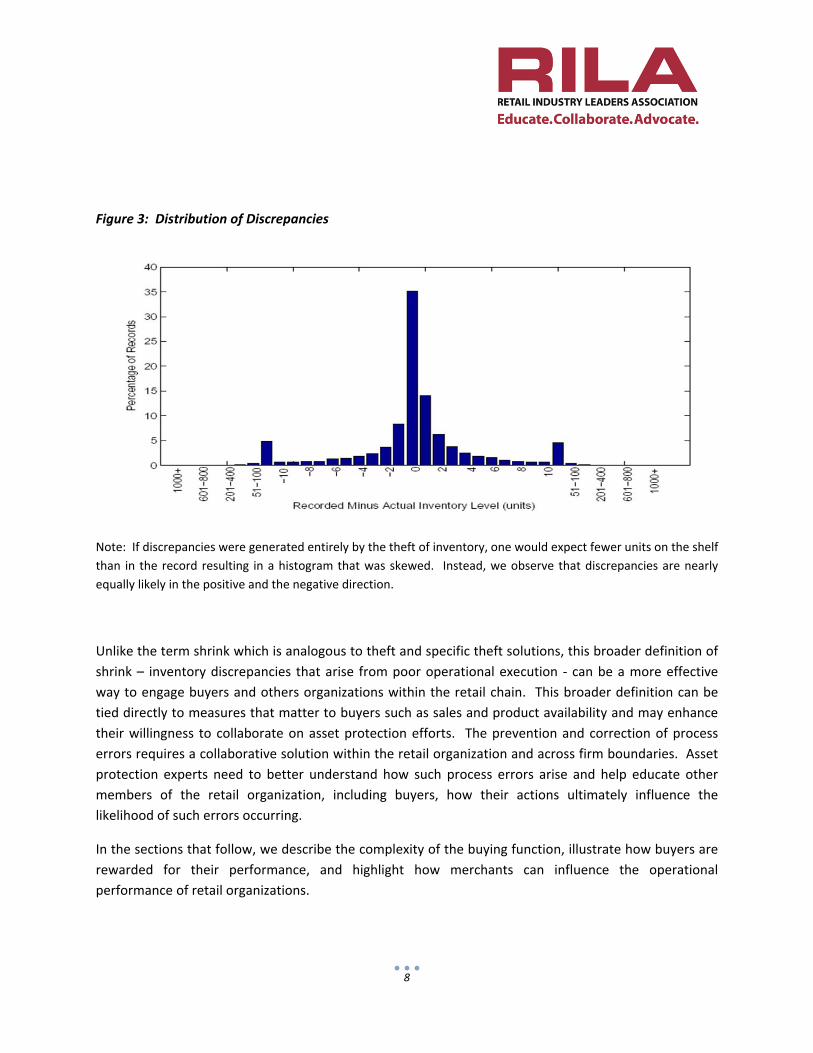
eroded customer loyalty. See Figure 3 for a histogram of positive and negative discrepancies at a
particular retailer where only 35% of the inventory records observed were accurate (e.g., where the
1 When examining only aggregate discrepancies, positive and negative errors are allowed to offset each other thereby masking the true extent of the problem. 2 See, Beck, A and Peacock, C. (2009). New Loss Prevention. New York: Palgrave Macmillan.
7
quantity on‐hand in the store matched the quantity this retailer believed to be on‐hand in the store
based on the computerized inventory records).
Figure 1: Traditional Approaches: Shrink & Sales Prevention.
Figure 2: Traditional Approaches: Requiring Consistent Execution.
8
Figure 3: Distribution of Discrepancies
Note: If discrepancies were generated entirely by the theft of inventory, one would expect fewer units on the shelf
than in the record resulting in a histogram that was skewed. Instead, we observe that discrepancies are nearly
equally likely in the positive and the negative direction.
Unlike the term shrink which is analogous to theft and specific theft solutions, this broader definition of
shrink – inventory discrepancies that arise from poor operational execution ‐ can be a more effective
way to engage buyers and others organizations within the retail chain. This broader definition can be
tied directly to measures that matter to buyers such as sales and product availability and may enhance
their willingness to collaborate on asset protection efforts. The prevention and correction of process
errors requires a collaborative solution within the retail organization and across firm boundaries. Asset
protection experts need to better understand how such process errors arise and help educate other
members of the retail organization, including buyers, how their actions ultimately influence the
likelihood of such errors occurring.
In the sections that follow, we describe the complexity of the buying function, illustrate how buyers are
rewarded for their performance, and highlight how merchants can influence the operational
performance of retail organizations.
9
How Buyers Impact Operational Execution
Retail buyers are often described as the “CEO” of their product category. Historically, merchants
negotiated with vendors, established prices, determined order quantities and replenishment frequency,
designed the planogram and shelf displays, and more. More recently, as the role has become more
complex due to the proliferation of SKUs and vendors, many of the sourcing, inventory planning
(ordering and replenishment) have been delegated to other organizations within the retail firm. While
the retail buyer will advise other groups on their preferences and share their category strategy among
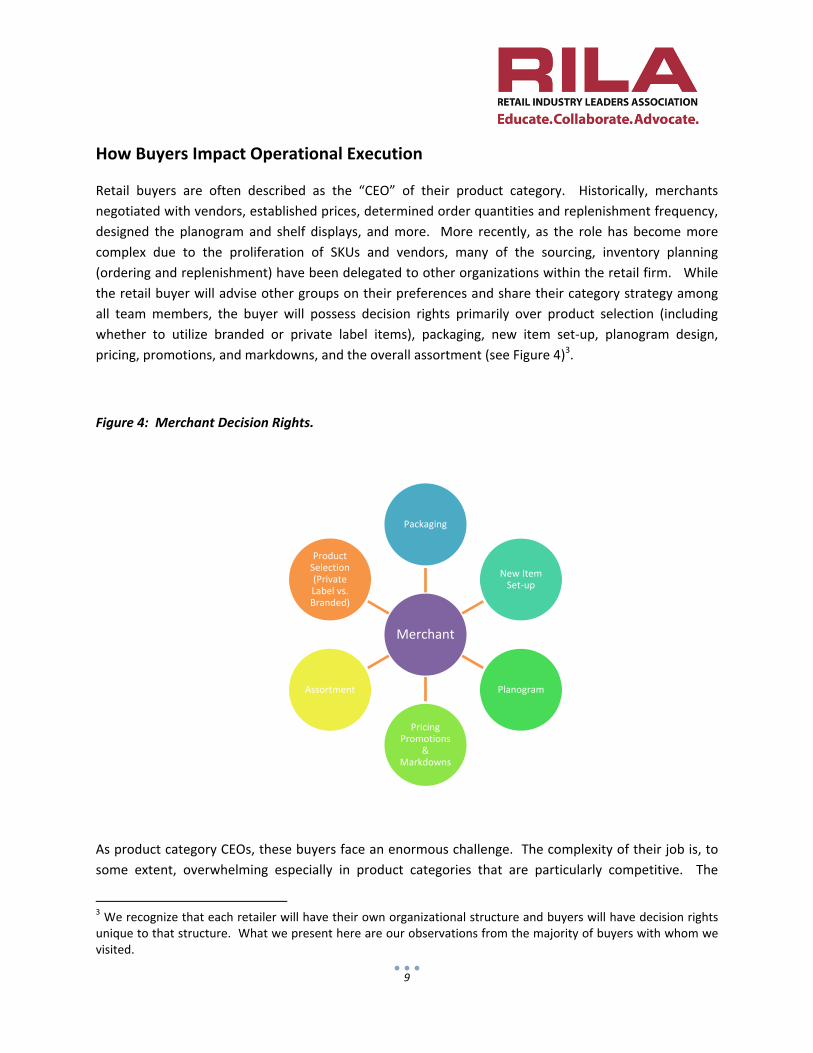
all team members, the buyer will possess decision rights primarily over product selection (including
whether to utilize branded or private label items), packaging, new item set‐up, planogram design,
pricing, promotions, and markdowns, and the overall assortment (see Figure 4)3.
Figure 4: Merchant Decision Rights.
As product category CEOs, these buyers face an enormous challenge. The complexity of their job is, to
some extent, overwhelming especially in product categories that are particularly competitive. The
3 We recognize that each retailer will have their own organizational structure and buyers will have decision rights unique to that structure. What we present here are our observations from the majority of buyers with whom we visited.
Merchant
Packaging
New Item Set‐up
Planogram
Pricing Promotions
& Markdowns
Assortment
Product Selection (Private Label vs. Branded)
10
workload buyers face depends on the number of vendor relationships they are managing, the number of
SKUs they oversee, the number of line reviews they conduct per year, the frequency of new product
entries, the occurrence of planned promotions, the financial importance of their product category, and
more.
Among the buyers we surveyed, the majority of them (43%) managed two to five product categories
representing 6% of the firm’s business. A typical buyer in our survey managed 13,000 SKUs and 34
different vendor relationships. Not surprisingly, our interviews revealed that buyers are essentially
pushed to their limit in just trying to fulfill the requirements of their existing role.
Buyers tend to be focused on the retail consumer. When asked to identify the primary drivers of
customer dissatisfaction, 80% of the respondents listed “out‐of‐stocks” as one of the leading sources of
dissatisfaction followed closely behind by product price and selection. However, our interviews
revealed that few perceived asset protection as having a role in the prevention of out‐of‐stocks.
Instead, buyers tended to point to forecasting, replenishment, and poor store execution (merchandising,
employee assistance, etc.) as the main drivers of out of stocks. An opportunity exists among asset
protection leaders to make the link between out of stocks and asset protection activities explicit across
the retail organization.
When asked whether asset protection was a factor they regularly took into account, few (less than 10%
of those surveyed) identified it as a key driver for their category performance. The categories where
asset protection was mentioned repeatedly included electronics, cosmetics, and fashion accessories.
Most other buyers considered asset protection to be an activity delegated to other parts of their
organization over which they had little control or influence.
Our interviews with asset protection teams, however, revealed that buyers can play an important and
substantive role in helping to prevent stock loss. Buyers can influence shrink prevention in the following
key ways:
Manage Vendor Relationships. Buyers are the key people who interact with vendors.
Therefore, if the asset protection team wants to do something differently (e.g., packaging) the
buyer needs to be involved. Moreover, the buyers, due to their relationships with vendors, are
often the first to hear of industry‐wide problems within a particular product category or with a
particular item that might be important for asset protection teams to know.
Product Selection. Buyers, when selecting product, can help Identify product that may need
additional security tags, keepers, locked pegs, spider wrap, etc. 4 Buyers can work with vendors
to ensure some of these tagging options are executed prior to delivery. Alternatively, buyers
can work with stores teams to set up empty boxes, tear pads, or display product dummies.
4 “KEEPERS” and “SPIDER WRAP” are both registered trademarks of Checkpoint Systems, Inc.
11
Merchandising Decisions. Buyers can limit presentation quantities, offer testers, and determine
product placement on the floor. Moreover, buyers determine the assortment and select items
to minimize the likelihood of discrepancies.
New Product Introduction & Resets. The buying team is responsible for the integrity of the
process and data used for new product introductions and resets. The accuracy of this process
has been directly tied to the prevention of stock loss. For instance, accurate product setup and
resets lead to correct tracking of costs, price, out‐dates as well as correct unit of measures that
yields system inventory accuracy. It also ensures that the signage and promotional materials
seen by consumers accurately reflects the strategy of the product category.
Determine Product Flow. Buyers often make the decision about how the product flows through
the supply chain (e.g., direct store delivery, full case pack shipment, break pack shipment, etc.).
This impacts the complexity of the supply chain and ultimately the likelihood for mistakes and
ultimately loss.
Buyers, on the other hand, did not recognize that so many of their decisions ultimately impact the
quality of operational execution throughout the retail supply chain. Most, 53%, of the buyers surveyed
pointed to organizational silos as a key barrier to improving collaboration between merchandising and
asset protection. These same silos prevent buyers from understanding their larger role in the
organization beyond knowing the retail customer preferences and making appropriate product
selections to match those preferences and grow their category.
Operationally Focused Buyers: The Impact of Corporate Culture
One retailer stood out among the rest in that their buyers, without prodding, identified asset protection
as a key element to their performance during interviews. Buyers at this retailer, Costco, faced
planogram pressures in that their category performance relied on the productivity of the space they
were allocated within the warehouse (see Appendix 3 for the full Costco case study). Even buyers
among retailers whose margin measure included shrink did not identify asset protection as an activity
that was important to their business as often as those Costco buyers.
What we found differed at Costco relative to other retailers was a culture that valued operational
excellence. For instance, buyers consistently take into account the operational costs incurred by
warehouses in the form of labor. They work with vendors to deliver floor‐ready product to warehouses.
This avoids the need for warehouse employees to receive a pallet, unpack it, and shelve individual items
– a process which requires substantial time and labor. Moreover, by having 95% of their goods sold on
12
pallets, Costco avoids additional handling that may increase the likelihood of damages, misplacement, or
loss.
However, it goes beyond the decision to merchandise product on pallets, a decision not appropriate for
many retailers. Costco buyers think hard about the negative impact variety has on operational
execution and ultimately on asset protection. Specifically, to avoid confusion among their members and
their employees, they avoid having product in two different locations and they minimize variety within
product categories. They also work closely with their vendors to ensure they understand what it takes
in terms of product design and packaging design to minimize returns, damages, and other forms of stock
loss.
In addition, merchants think carefully about the workload required for warehouses to execute their
plans. One example of this is how the merchants elected to move away from seasonal resets that
required the majority of new merchandise to enter the warehouse at the same time at the start of a
season. They replaced this with planned resets that differ in timing across product categories. In so
doing, they not only keep the inventory fresh and exciting but also balance the workload required at the
warehouse.
This focus on operational excellence is driven in part by their incentives. Specifically, buyers are
allocated space based on productivity targets. Buyers must meet a minimum threshold of sales per
week per warehouse per item in order to keep a select product in the assortment. Any stock loss due to
damages, theft, or other factors means lower space productivity. As a result, buyers are very selective
about what they put on the warehouse floor. Moreover, Costco tracks not just the price buyers pay for
an item but the net landed cost of getting that item into the hands of their members. Buyers therefore
have an incentive to insure the shipment flows efficiently through the supply chain. In other words,
they work closely with vendors to prevent items from needing rework upon arrival at the distribution
center or warehouse, to verify the packaging prevents stock loss and damages, and to make sure both
pallets and product displays are easy to handle within their distribution network and warehouses.
Moreover, Costco buyers possess a deep understanding of retail built over years of experience in the
same role. While the majority of the retail buyers surveyed (57%) had been in a buying role for 10 years
or less, Costco buyers had substantially more experience in their positions. Moreover, we learned that
buyers at most retailers move roles every two years creating a churn in the buying functions that
impedes operational improvement.
While the Costco incentive design and culture help generate a strong commitment to asset protection
among buyers, another factor we found important among Costco and other retailers is the amount of
store experience buyers had prior to joining the merchant group. Buyers who had in‐store experience
were more likely to take into account store operations and asset protection challenges in their buying
and merchandising decisions.
13
Changing the buyer’s mindset: Education & Training
It is unlikely that the asset protection teams will be able to immediately change the culture of the
organization or singlehandedly alter the incentives faced by buyers or replicate the Costco business
model. Should these asset protection groups therefore forgo trying to change the mindset of the buyer?
The majority of retailers we studied don’t believe so. Our interviews revealed that there are several key
paths to success in trying to change the mindset of the buyer. These include (a) buyer education and
training and (b) enhanced analytics. We discuss each in turn.
What emerged clearly in our interviews was the need for buyers to better understand the flow of
product in the supply chain and all the touches associated with the movement of goods from vendors to
the end consumer. Many buyers saw their role as understanding the consumer’s desires (e.g., product
colors, fabrics, etc.) and the type of assortment needed within a particular category to meet those
consumer preferences.
This mindset is analogous to those of product designers in manufacturing decades ago who believed
that their single goal was to design the most innovative product regardless of any manufacturing or
supply chain constraints. It took many years of research, analysis, education, and frankly learning from
failure before product designers realized that the product development process worked best when it
was integrated not only with consumer preferences but also with the manufacturing and assembly
processes5. The two processes could not happen in isolation.
The same is true with retail execution and merchandise buying. In order to effectively protect the assets
of the retail organization, merchants and asset protection teams need to collaborate. Asset protection
teams should promote a design for execution mindset. This means that they should educate buyers
about how their choice of variety, their planogram design, and their packaging features can help or
hinder asset protection.
The objective should be to help merchants think about how they design their category to prevent loss.
This includes far more than source tagging. It means thinking about how variety may impede sales.
Marketing research has shown that too much variety can actually cause shoppers confusion at the point
of purchase and consumers may actually select no choice than endure having to choose amongst too
many variants6. Too much variety has implications for operational execution as well. Store employees,
warehouse employees, and others tasked with the management of inventory can also become confused
in stocking, counting, or selecting merchandise.
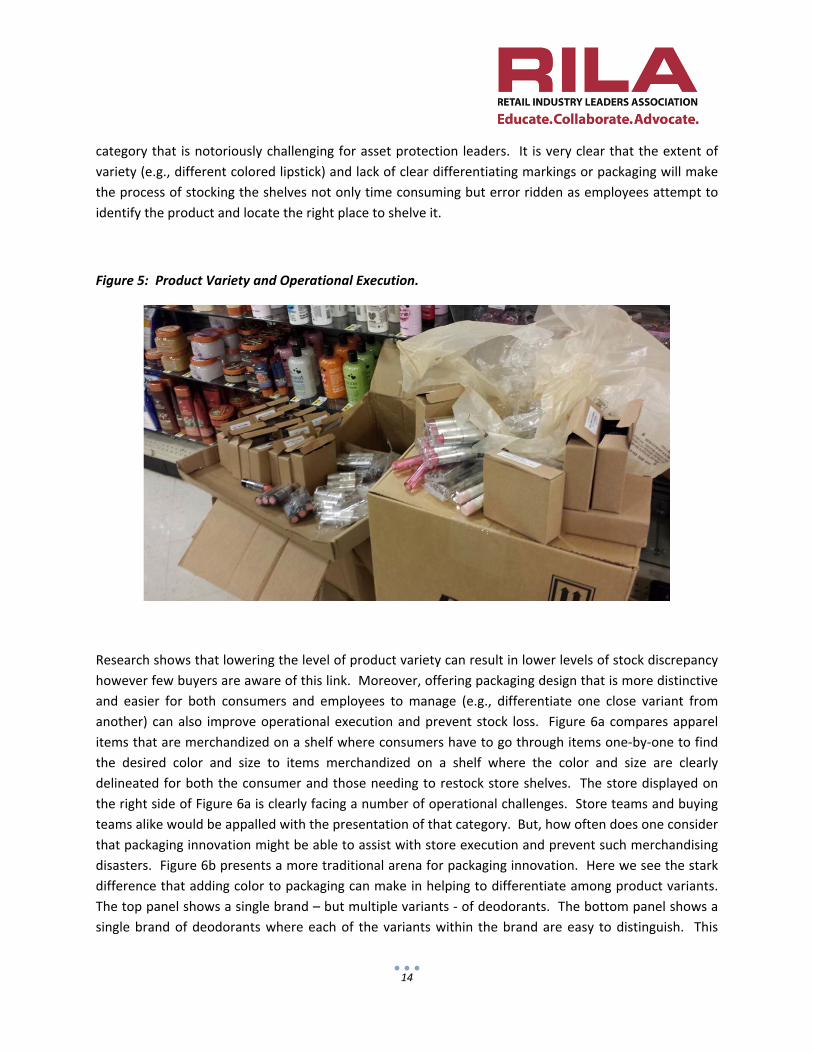
Take, for example, the picture below (Figure 5). This is inventory that has been brought from the
backroom of this retailer to the store floor in order to replenish shelves within the cosmetic category, a
5 For more background on this evolution, please refer to Wheelwright, S. C. and Clark, K. B. (1992). Revolutionizing Product Development. New York: The Free Press. 6 See Schwartz, B. (2004). The Paradox of Choice. New York: Harper Collins.
14
category that is notoriously challenging for asset protection leaders. It is very clear that the extent of
variety (e.g., different colored lipstick) and lack of clear differentiating markings or packaging will make
the process of stocking the shelves not only time consuming but error ridden as employees attempt to
identify the product and locate the right place to shelve it.
Figure 5: Product Variety and Operational Execution.
Research shows that lowering the level of product variety can result in lower levels of stock discrepancy
however few buyers are aware of this link. Moreover, offering packaging design that is more distinctive
and easier for both consumers and employees to manage (e.g., differentiate one close variant from
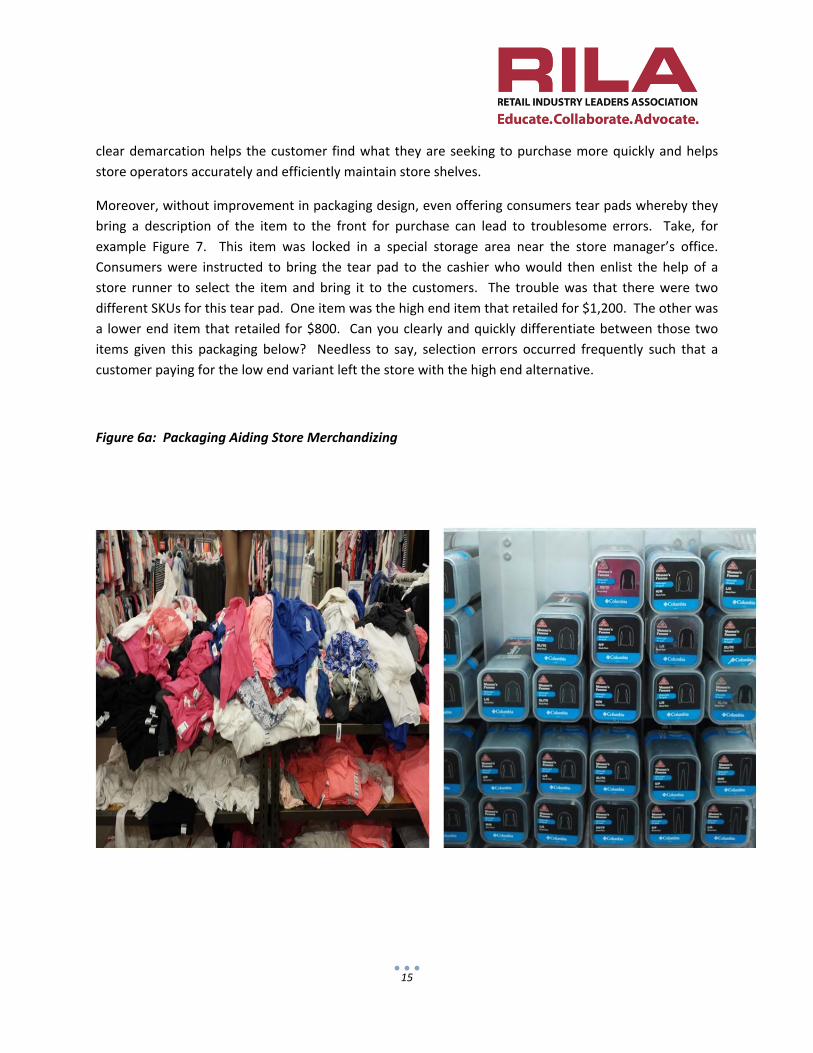
another) can also improve operational execution and prevent stock loss. Figure 6a compares apparel
items that are merchandized on a shelf where consumers have to go through items one‐by‐one to find
the desired color and size to items merchandized on a shelf where the color and size are clearly
delineated for both the consumer and those needing to restock store shelves. The store displayed on
the right side of Figure 6a is clearly facing a number of operational challenges. Store teams and buying
teams alike would be appalled with the presentation of that category. But, how often does one consider
that packaging innovation might be able to assist with store execution and prevent such merchandising
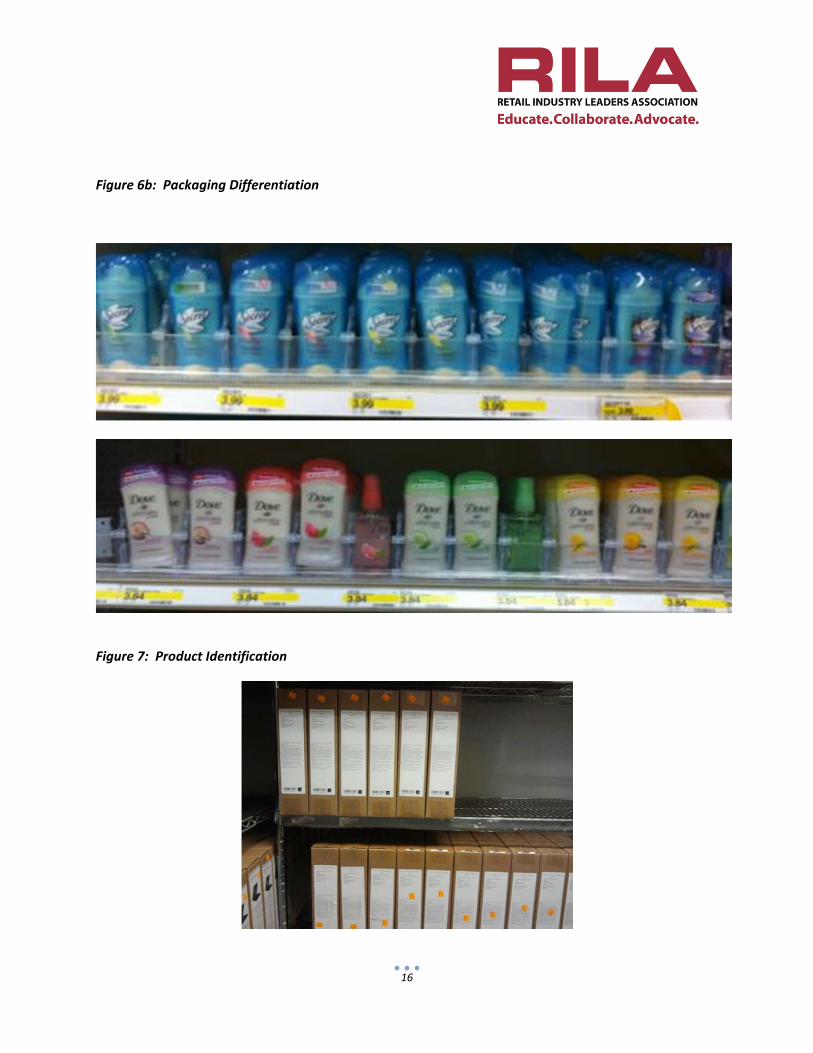
disasters. Figure 6b presents a more traditional arena for packaging innovation. Here we see the stark
difference that adding color to packaging can make in helping to differentiate among product variants.
The top panel shows a single brand – but multiple variants ‐ of deodorants. The bottom panel shows a
single brand of deodorants where each of the variants within the brand are easy to distinguish. This
15
clear demarcation helps the customer find what they are seeking to purchase more quickly and helps
store operators accurately and efficiently maintain store shelves.
Moreover, without improvement in packaging design, even offering consumers tear pads whereby they
bring a description of the item to the front for purchase can lead to troublesome errors. Take, for
example Figure 7. This item was locked in a special storage area near the store manager’s office.
Consumers were instructed to bring the tear pad to the cashier who would then enlist the help of a
store runner to select the item and bring it to the customers. The trouble was that there were two
different SKUs for this tear pad. One item was the high end item that retailed for $1,200. The other was
a lower end item that retailed for $800. Can you clearly and quickly differentiate between those two
items given this packaging below? Needless to say, selection errors occurred frequently such that a
customer paying for the low end variant left the store with the high end alternative.
Figure 6a: Packaging Aiding Store Merchandizing
16
Figure 6b: Packaging Differentiation
Figure 7: Product Identification
17
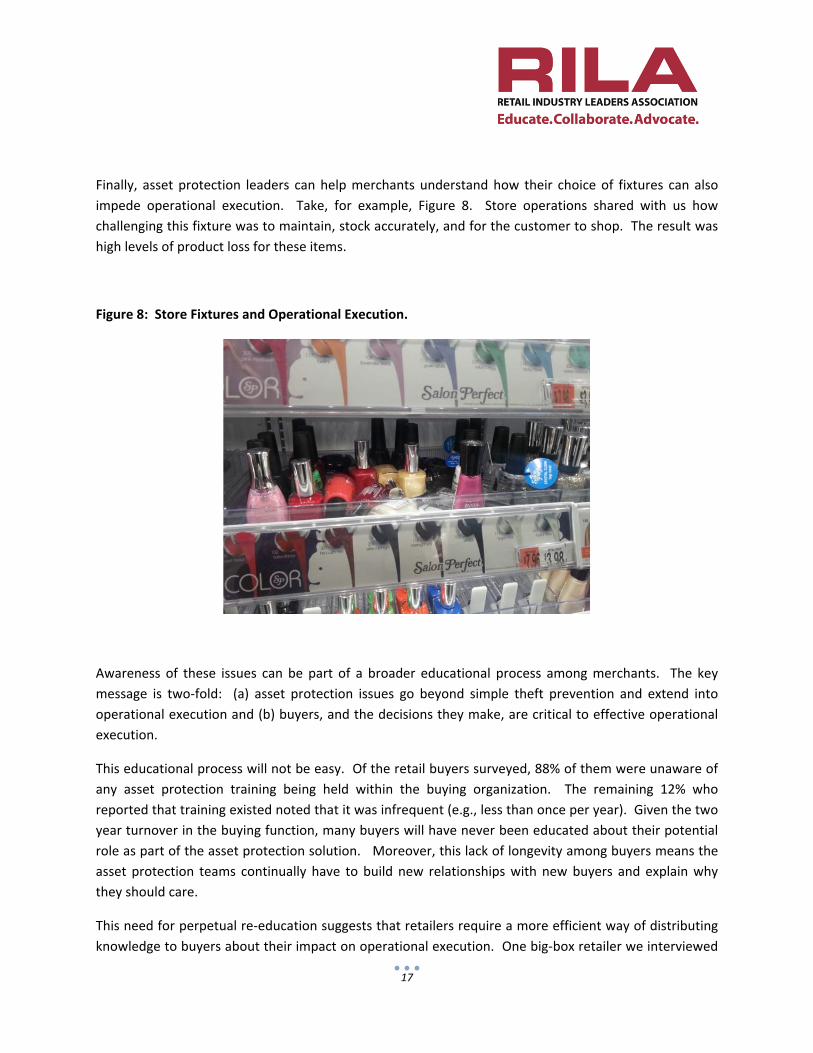
Finally, asset protection leaders can help merchants understand how their choice of fixtures can also
impede operational execution. Take, for example, Figure 8. Store operations shared with us how
challenging this fixture was to maintain, stock accurately, and for the customer to shop. The result was
high levels of product loss for these items.
Figure 8: Store Fixtures and Operational Execution.
Awareness of these issues can be part of a broader educational process among merchants. The key
message is two‐fold: (a) asset protection issues go beyond simple theft prevention and extend into
operational execution and (b) buyers, and the decisions they make, are critical to effective operational
execution.
This educational process will not be easy. Of the retail buyers surveyed, 88% of them were unaware of
any asset protection training being held within the buying organization. The remaining 12% who
reported that training existed noted that it was infrequent (e.g., less than once per year). Given the two
year turnover in the buying function, many buyers will have never been educated about their potential
role as part of the asset protection solution. Moreover, this lack of longevity among buyers means the
asset protection teams continually have to build new relationships with new buyers and explain why
they should care.
This need for perpetual re‐education suggests that retailers require a more efficient way of distributing
knowledge to buyers about their impact on operational execution. One big‐box retailer we interviewed
18
had developed on‐line training tools that could be circulated among buying teams and through a great
deal of effort managed to get their training program incorporated into the buyer’s onboarding process.
Part of their success was due to the asset protection team’s use of broader terminology. Rather than
describing their role as merely controlling shrink, they framed the discussion in terms of protecting the
profit of the firm.
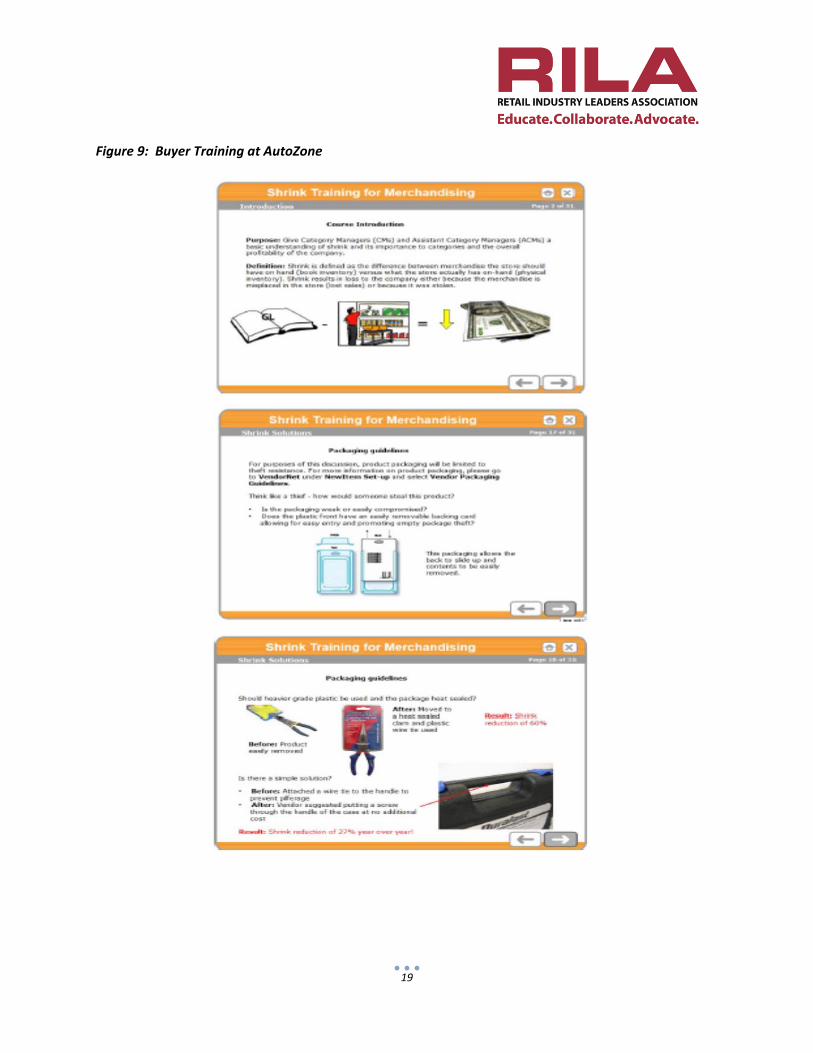
AutoZone is one such retailer that has managed to develop a training tool to explain the importance of
asset protection and the types of solutions employed. It carefully makes the case for why merchants
should care about asset protection. Moreover, it ties the performance of asset protection team
members directly to measures important for merchants such as product availability and lost sales. As
Figure 9 below demonstrates, the AutoZone training platform is simple, visual, and based on real‐world
examples that link key decisions (in this case packaging) to actual performance (sales or shrink
reduction). See Appendix 4 for the full AutoZone case study.
Key partners to retail asset protection teams can also provide assistance. A plausible mechanism for
educating retail buyers is for key partners to develop materials relevant to buyers that can be utilized
across multiple retail formats. In so doing it pools the investments that would need to be made in
individual companies in order to develop material of benefit to all members. Alternatively, key partners
could host a workshop dedicated to the sharing of best practice among their asset protection, supply
chain, and merchant teams. The objective would be to share best practices of retailing and
manufacturing firms known to be on the cutting edge of collaboration when it comes to merchandising,
product planning, and execution.
19
Figure 9: Buyer Training at AutoZone
20
Changing the buyer’s mindset: Enhanced Analytics
Building the tools to educate the buyers about their role in asset protection is only one step in this
process. Our interviews revealed that asset protection teams did not make good partners for the
merchant groups. When asked about the strength of their cross‐functional relationships, the buyers we
surveyed ranked asset protection in the bottom three. In other words, unlike their relationships with
vendors, marketing, and product design teams, they perceived their level of involvement with asset
protection as very low.
Moreover, when describing the capabilities of their asset protection teams, only 25% of the buyers
surveyed believed their asset protection teams conducts in‐depth analytics to identify the drivers of high
shrink items and identifies innovative solutions for the prevention of loss. Instead, the majority of
respondents felt that the capability of the asset protection groups was limited to bringing a list of high
risk items to review on a periodic basis.
Thus, when merchants did allocate time to the asset protection teams, merchants felt that these teams
were great at providing lists of high risk items generated from historical data but that their analytics and
predictive abilities were limited. What we heard more often than not was that the merchants didn’t
have time to figure out the root cause of the problems generating the top items on these high shrink
lists. What they preferred was for the asset protection teams to identify both the problem and a set of
solutions from which the merchant could select. This is the way in which the merchants, as CEOs of
their categories, interact with other teams across the retail organization and it is their expectation for
their interaction with asset protection as well. In fact, buyers perceive the lack of real‐time information
and analytics as well as the lack of root cause analysis as two of the top three barriers to collaborations
between merchandising and asset protection.
The challenge is that many of the solutions require cross‐functional approaches. Specifically, solutions
to poor operational execution require the coordination of numerous functions such as planners, buyers,
vendors, supply chain, sourcing, and store operations. As a result, who owns the problem (and thus who
is accountable for a solution) is unclear. Any asset protection team seeking to offer long‐term solutions
needs to have deep ties to multiple organizational silos and has to be prepared to have to navigate a
tremendous amount of social and political resistance.
Beyond fostering and maintaining these relationships, asset protection leaders also need to develop
analytical capabilities. This may mean providing additional training to existing team members or hiring
specific talent. One big box retailer we interviewed had a sophisticated data driven approach to asset
protection. This group tackled critical problems such as items scanned without a proper barcode at
checkout (e.g., unidentified sales). It did so by collecting large quantities of data and identifying patterns
21
in these data. Ultimately, they uncovered which products accounted for these losses through analytical
detective work and not the kind of detective work traditionally associated with asset protection.
Better analytics can also help asset protection leaders build strong organizational coalitions and improve
the perception of asset protection teams as leading problem solvers within the retail organization. For
example, one specialty retail chain with whom we worked utilized a data driven approach to
demonstrate the value of improved operational execution on category performance. But, their work
didn’t end there, this team designed innovative mobile tools to deliver the results of its analytical
approach to merchants and store operations professionals alike.
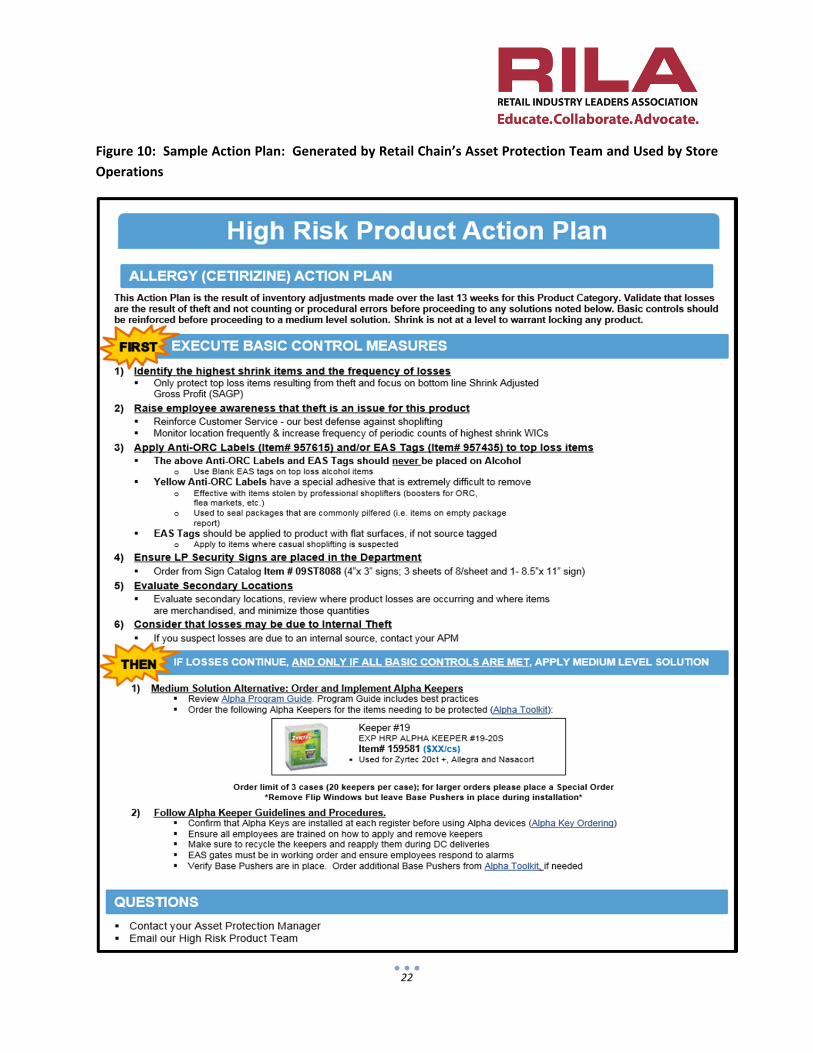
In addition, this team coupled their impact analysis with a menu of solution tools. For instance, if their
scorecard identified a problem in a specific product category, their tool would provide a check‐list of
actions store operators should take to help mitigate the problem (see Figure 10). After executing on this
check‐list, the asset protection team would have better information about what is happening within the
stores and could present this information to merchants if their input was required. Overall, this check‐
list was developed after careful analysis and filled an important need for consistency in store execution.
In this way, the asset protection team helped build a coalition of supporters throughout their
organization.
The need for such innovative analytical approaches will only intensify over time. Asset protection
organizations without this capability need to be thinking about how best to obtain the talent and retool
existing employees to ensure they can compete. Buyers are looking to asset protection for solutions
and solutions require analytical approaches. Using analytics, asset protection teams can test their
beliefs about what drives discrepancies in their retail supply chain, can evaluate the impact of strategies
designed to prevent such discrepancies, and offer evidence based solutions to buyers and other
organizational partners. Such efforts engender trust and confidence in the capabilities of the asset
protection organization. Moreover, by moving beyond the generation of high shrink lists, asset
protection groups can become far more sophisticated in their approach to solving this problem.
Analytics will allow asset protection teams to identify patterns over time, common factors across items
that hinder operational execution, and make these teams better able to predict and plan for potential
problems. Moreover, armed with such results, the asset protection teams can better inform other parts
of the organization, including buying, how their decisions influence metrics such as product availability,
shrink, and inventory accuracy in stores and distribution centers.
22
Figure 10: Sample Action Plan: Generated by Retail Chain’s Asset Protection Team and Used by Store
Operations
23
Current Opportunity
Changing the mindset of buyers will not be easy especially given their workload challenges and the
churn present in the buying positions. But, asset protection leaders can capitalize on current retail
trends to foster change. Specifically, there is a growing emphasis on operational execution within
retailing as a result of the emergence of omnichannel retail strategies. Retail customers expect to be
able to buy on‐line, pick‐up in the store, buy in the store and ship to home, and to view the levels of
inventory for desired product in their store of choice. Retailers are keenly aware of the need to
accurately describe the level of inventory in their stores and to prevent poor product availability
regardless of how the customer shops. Asset protection groups ought to be able to capitalize on this
increased attention on driving a consistent guest experience across channels. Ultimately, omnichannel
is a potential platform for asset protection groups to integrate asset protection and product availability
into retail culture, metrics, and analytical approaches.
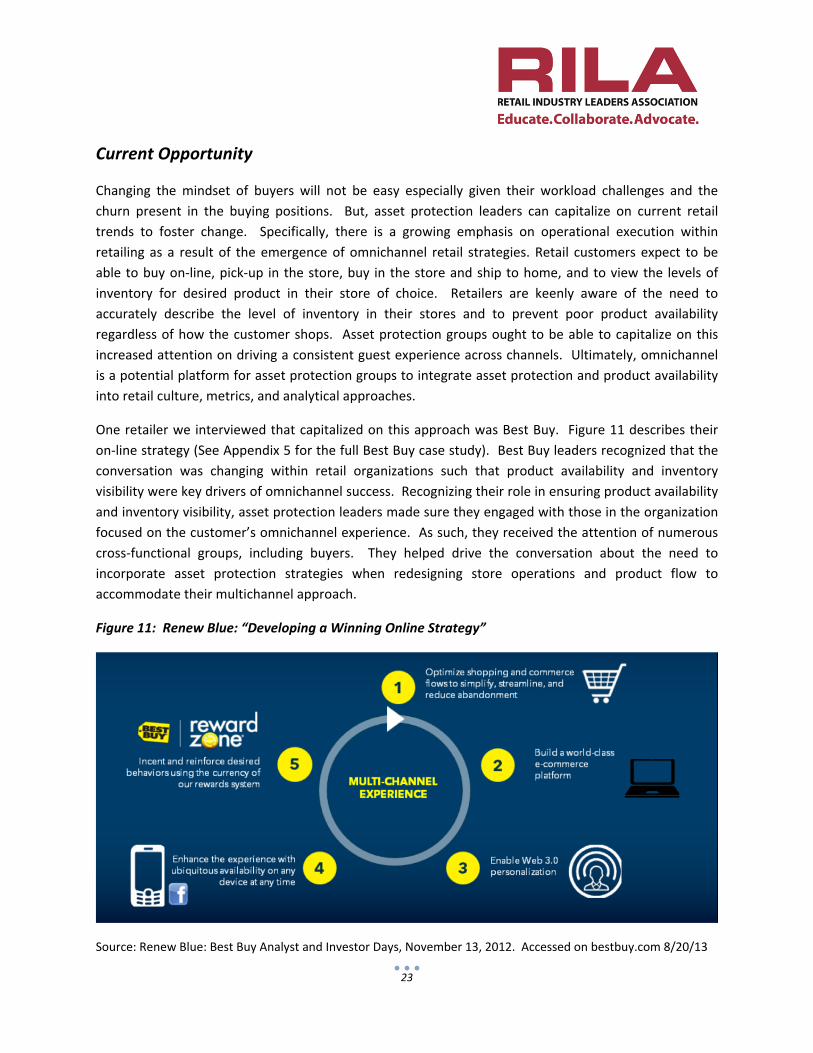
One retailer we interviewed that capitalized on this approach was Best Buy. Figure 11 describes their
on‐line strategy (See Appendix 5 for the full Best Buy case study). Best Buy leaders recognized that the
conversation was changing within retail organizations such that product availability and inventory
visibility were key drivers of omnichannel success. Recognizing their role in ensuring product availability
and inventory visibility, asset protection leaders made sure they engaged with those in the organization
focused on the customer’s omnichannel experience. As such, they received the attention of numerous
cross‐functional groups, including buyers. They helped drive the conversation about the need to
incorporate asset protection strategies when redesigning store operations and product flow to
accommodate their multichannel approach.
Figure 11: Renew Blue: “Developing a Winning Online Strategy”
Source: Renew Blue: Best Buy Analyst and Investor Days, November 13, 2012. Accessed on bestbuy.com 8/20/13
24
Our interviews revealed plenty of opportunity for fraud in the omnichannel space. For instance, at one
retailer consumers were able to buy on‐line with a loyalty coupon and if they returned the item to the
store they were refunded the full amount in cash due to the divide between on‐line and in‐store
systems. At another retailer, none of the store cashiers (or the store manager) knew how to return an
item bought on‐line. As a result, they merely refunded the money to the consumer without scanning
the item back into store inventory. Examples such as these abound and are a critical reason why asset
protection is an essential partner to buyers and planners in the move toward omnichannel.
Moreover, many argue one needs a crisis to generate change. To some extent, asset protection leaders
can utilize the pressures retailers are feeling to improve their omnichannel strategy as their crisis to
generate change. Asset protection leaders can demonstrate, as Best Buy leaders did, how having asset
protection as part of the cross‐functional teams supporting omnichannel strategies adds value. These
teams design operational processes, analyze data pertaining to the overall customer experience, and
engage buyers to, for example, think about packaging for two delivery types (e.g., store and direct‐to‐
consumer).
25
Summary of Key Findings
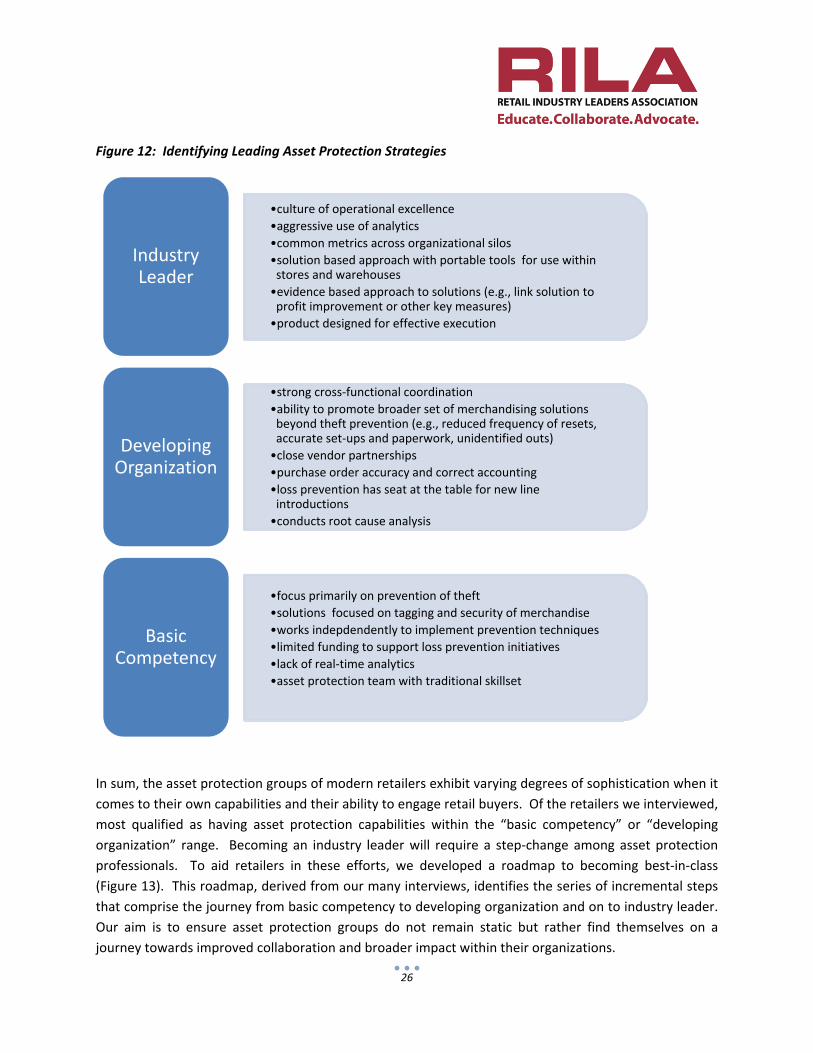
Developing an industry leading approach to asset protection demands dedication, creativity, and senior
management support. In the diagram below (Figure 12), we highlight what differentiates retailers with
basic asset protection competency to those who are perceived among RILA retailers as world class.
Retailers can utilize this diagram to benchmark where they are in their asset protection evolution.
While this figure reveals that there are many steps that need to be made moving from one level to the
next, the first and most important step in this process is redefining the retail organization’s notion of
shrink. Asset protection groups may continue to be sidelined by buyers and others within the
organization if they are unable to broaden their impact. Use of phrases such as profit protection,
inventory discrepancies, data integrity, and product availability are ones that resonate throughout the
retail organization. For some historical reason, the concept of shrink (and the perception of what drives
shrink) actually masks its importance to the organization. Thinking of shrink solely as theft denies the
full extent of the problem and the primary solution methodologies employed by asset protection teams
– theft prevention – may be inadequate to solving the problem in its entirety.
Why the focus on semantics? Our interviews demonstrated that too few buyers understood how they
could influence shrink and how shrink influences their own performance drivers (e.g., buyer incentives).
Only one retail buyer emphatically stated “shrink and markdowns are all part of overall profitability….
[and] play significantly into how the profit margin is determined.” Asset protection groups could
continue to talk about shrink but given existing perceptions these conversations may not have the
desired outcome. Alternatively, asset protection teams can adopt the language of the buyers – a
language that emphasizes profit, sales growth, product availability, customer satisfaction – and
demonstrate how stock loss impacts each and every one of those variables. Our research highlights the
fact that 52% of the buyers surveyed feel that shrink is not clearly defined. This confusion only impedes
any progress asset protection wants to make in engaging buyers effectively.
26
Figure 12: Identifying Leading Asset Protection Strategies
In sum, the asset protection groups of modern retailers exhibit varying degrees of sophistication when it
comes to their own capabilities and their ability to engage retail buyers. Of the retailers we interviewed,
most qualified as having asset protection capabilities within the “basic competency” or “developing
organization” range. Becoming an industry leader will require a step‐change among asset protection
professionals. To aid retailers in these efforts, we developed a roadmap to becoming best‐in‐class
(Figure 13). This roadmap, derived from our many interviews, identifies the series of incremental steps
that comprise the journey from basic competency to developing organization and on to industry leader.
Our aim is to ensure asset protection groups do not remain static but rather find themselves on a
journey towards improved collaboration and broader impact within their organizations.
•culture of operational excellence
•aggressive use of analytics
•common metrics across organizational silos
•solution based approach with portable tools for use within stores and warehouses
•evidence based approach to solutions (e.g., link solution to profit improvement or other key measures)
•product designed for effective execution
Industry Leader
•strong cross‐functional coordination
•ability to promote broader set of merchandising solutions beyond theft prevention (e.g., reduced frequency of resets, accurate set‐ups and paperwork, unidentified outs)
•close vendor partnerships
•purchase order accuracy and correct accounting
•loss prevention has seat at the table for new line introductions
•conducts root cause analysis
Developing Organization
•focus primarily on prevention of theft
•solutions focused on tagging and security of merchandise
•works indepdendently to implement prevention techniques
•limited funding to support loss prevention initiatives
•lack of real‐time analytics
•asset protection team with traditional skillset
Basic Competency
27
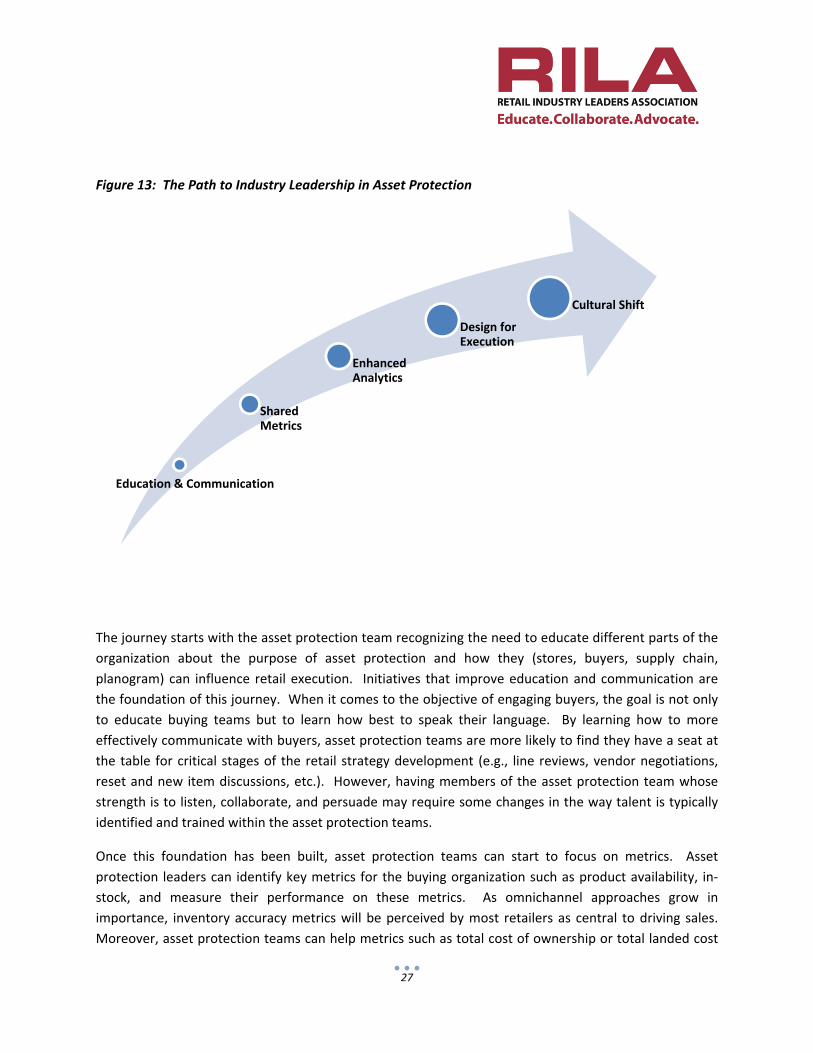
Figure 13: The Path to Industry Leadership in Asset Protection
The journey starts with the asset protection team recognizing the need to educate different parts of the
organization about the purpose of asset protection and how they (stores, buyers, supply chain,
planogram) can influence retail execution. Initiatives that improve education and communication are
the foundation of this journey. When it comes to the objective of engaging buyers, the goal is not only
to educate buying teams but to learn how best to speak their language. By learning how to more
effectively communicate with buyers, asset protection teams are more likely to find they have a seat at
the table for critical stages of the retail strategy development (e.g., line reviews, vendor negotiations,
reset and new item discussions, etc.). However, having members of the asset protection team whose
strength is to listen, collaborate, and persuade may require some changes in the way talent is typically
identified and trained within the asset protection teams.
Once this foundation has been built, asset protection teams can start to focus on metrics. Asset
protection leaders can identify key metrics for the buying organization such as product availability, in‐
stock, and measure their performance on these metrics. As omnichannel approaches grow in
importance, inventory accuracy metrics will be perceived by most retailers as central to driving sales.
Moreover, asset protection teams can help metrics such as total cost of ownership or total landed cost
Education & Communication
Shared Metrics
Enhanced Analytics
Design for Execution
Cultural Shift
28
become more widespread within their organizations. Total cost of ownership, for example, quantifies
the costs associated not just with product acquisition and purchasing activities but also the costs
pertaining to poor quality (rework, return to vendors, labor required to push product to the floor, etc.).
Such metrics help all functional areas within the retail organization to value operational execution.
Once metrics have been identified and the tracking of those metrics established, the next step in the
journey is data driven analytics. The lack of useful, action‐oriented analytics was a complaint repeatedly
expressed among buying teams. Conducting in‐depth analytics is difficult and, as noted above, requires
strategic hires. Asset protection groups need to identify not only what are the right questions to ask of
the data they collect but how can they convert those questions into recommendations for the present
and predictions for the future. It may be tempting to outsource the analytics to third‐parties particularly
as the team is just learning about data and how best to collect and analyze it. We observed, however,
that many of the firms possessed the capabilities in‐house, namely, among their finance teams. Asset
protection teams with strong collaborative relationships with their finance teams often earned the
respect of other parts of the organization due to their data driven approach to decision making.
Developing an organization with design thinking is the next phase of the journey. The firm needs to
think about how to design its processes and products such it is difficult for employees to make execution
mistakes. Such thinking is common in restaurants such as McDonald’s that depends on operational
execution to serve the volumes of customers it does with accuracy and speed. Such care and precision
can be applied in retail execution as well. In this phase, retailers may need to collaborate extensively
with vendors and perhaps even other competing retailers to make improvements that benefit the retail
supply chain. There are several examples of competitive collaboration for the good of the industry. For
instance, two competing retailers recently collaborated to work with cosmetic suppliers on packaging
solutions to improve sustainability performance. The benefit of such collaboration is that it focuses
time, attention, and resources to one industry‐wide solution. In the absence of such collaboration, each
retailer would take a different approach leading to confusion and additional costs. Take, for example,
two different store managers who devise their own shrink prevention solution for a particular category.
Without collaboration, these two store managers will most likely offer a solution that can be perceived
by the customer as inconsistent and confusing. A thoughtful approach to process and product design is
central to this design for execution approach. The objective is to maintain the integrity of the process
with as little rework and execution failures as possible.
And, finally, a firm can reach a place where operational execution is embedded in the firm’s culture. The
focus on operational execution is pervasive and identifying ways in which to improve the protection of
assets is part of the everyday routine rather than an afterthought. In this stage, the role of asset
protection teams is more broadly defined. It is less about theft prevention than it is about inventory
visibility, process improvement, and solutions for the category manager through the retailer’s supply
chain – from vendor to store.
29
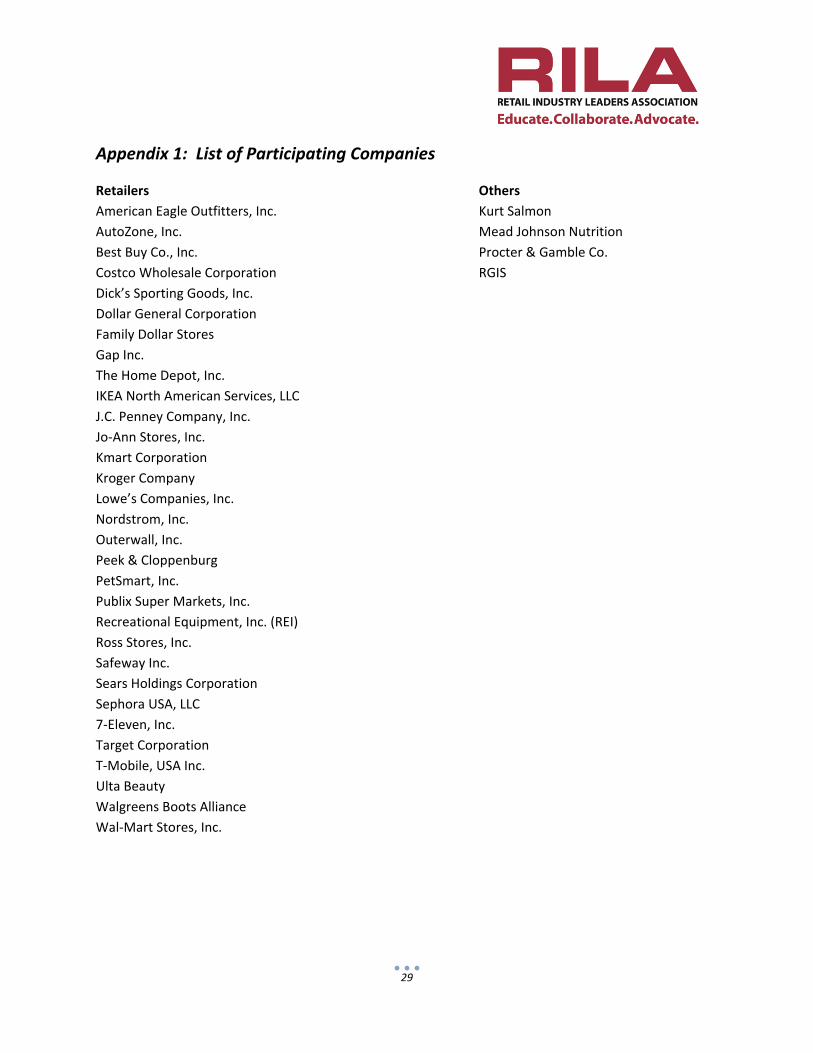
Appendix 1: List of Participating Companies
Retailers Others
American Eagle Outfitters, Inc. Kurt Salmon
AutoZone, Inc. Mead Johnson Nutrition
Best Buy Co., Inc. Procter & Gamble Co.
Costco Wholesale Corporation RGIS
Dick’s Sporting Goods, Inc.
Dollar General Corporation
Family Dollar Stores
Gap Inc.
The Home Depot, Inc.
IKEA North American Services, LLC
J.C. Penney Company, Inc.
Jo‐Ann Stores, Inc.
Kmart Corporation
Kroger Company
Lowe’s Companies, Inc.
Nordstrom, Inc.
Outerwall, Inc.
Peek & Cloppenburg
PetSmart, Inc.
Publix Super Markets, Inc.
Recreational Equipment, Inc. (REI)
Ross Stores, Inc.
Safeway Inc.
Sears Holdings Corporation
Sephora USA, LLC
7‐Eleven, Inc.
Target Corporation
T‐Mobile, USA Inc.
Ulta Beauty
Walgreens Boots Alliance
Wal‐Mart Stores, Inc.
30
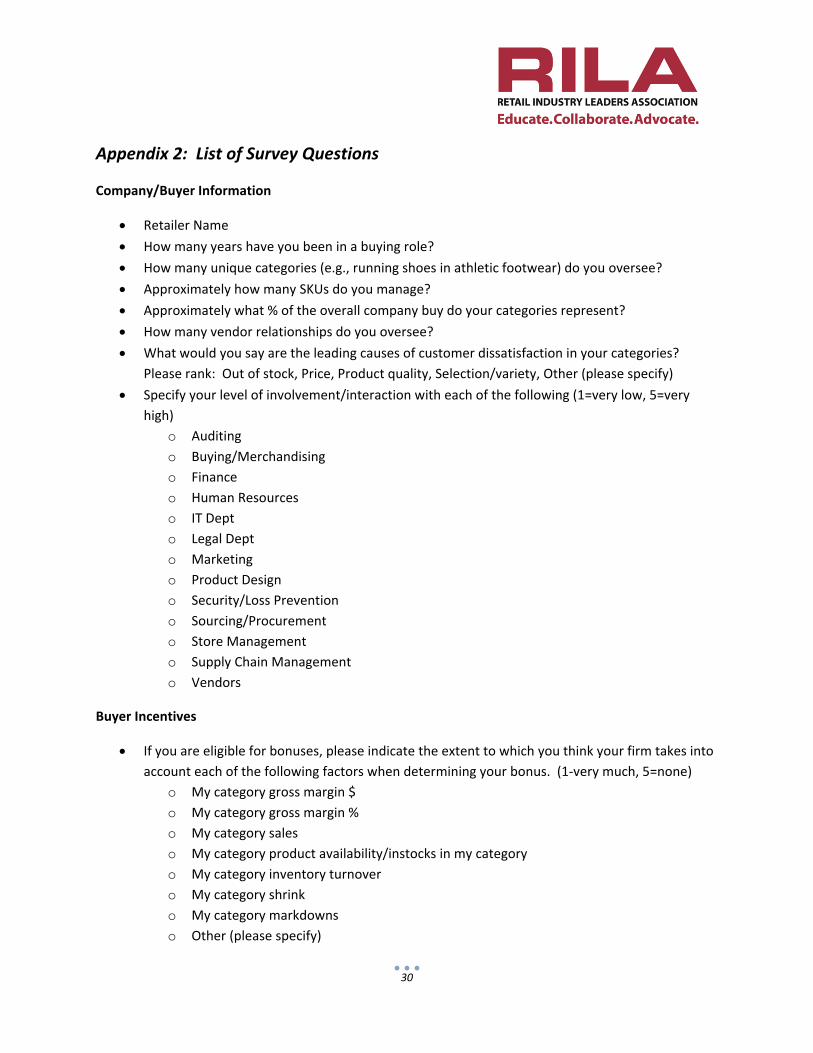
Appendix 2: List of Survey Questions
Company/Buyer Information
Retailer Name
How many years have you been in a buying role?
How many unique categories (e.g., running shoes in athletic footwear) do you oversee?
Approximately how many SKUs do you manage?
Approximately what % of the overall company buy do your categories represent?
How many vendor relationships do you oversee?
What would you say are the leading causes of customer dissatisfaction in your categories?
Please rank: Out of stock, Price, Product quality, Selection/variety, Other (please specify)
Specify your level of involvement/interaction with each of the following (1=very low, 5=very
high)
o Auditing
o Buying/Merchandising
o Finance
o Human Resources
o IT Dept
o Legal Dept
o Marketing
o Product Design
o Security/Loss Prevention
o Sourcing/Procurement
o Store Management
o Supply Chain Management
o Vendors
Buyer Incentives
If you are eligible for bonuses, please indicate the extent to which you think your firm takes into
account each of the following factors when determining your bonus. (1‐very much, 5=none)
o My category gross margin $
o My category gross margin %
o My category sales
o My category product availability/instocks in my category
o My category inventory turnover
o My category shrink
o My category markdowns
o Other (please specify)
31
Shrink/Loss Prevention
What levers do you as a buyer have to reduce shrink? Please list three levers.
To what extent do you agree with the following statements? (1=strongly agree, 5=strongly
disagree)
o Shrink is clearly defined in my organization
o Loss prevention is important/prioritized in our organization
o I always consider shrink in new line introductions
o Shrink has a substantial impact on my product categories
o Shrink prevention improves category performance
o Shrink prevention efforts have substantial impact on my bonus
o The loss prevention team is a partner in efforts to drive sales
o My organization provides me with timely data on shrink levels within my product
category
o Product vendors play a key role in loss prevention initiatives within my product
categories.
Which of the following statements best describe the capabilities of your loss prevention team?
Check all that apply.
o Loss prevention brings a list of high shrink items for us to review on a periodic basis
o Loss prevention conducts in‐depth analytics to identify drivers of high shrink items and
identifies innovative solutions for shrink prevention
o Loss prevention advises merchandising teams in advance of a product launch to prevent
future shrink problems
o Loss prevention independently implements shrink prevention solutions without
merchandising review
o None of the above.
What barriers exist to improve collaboration between merchandising and loss prevention?
Check all that apply.
o There is no or limited ROI to shrink prevention solutions.
o Collaboration is not viewed as important
o Individuals too busy
o Lack of real‐time information and analytics
o Lack of root cause analysis
o No funding to support LP initiatives
o None
o Organizational silos
o Performance measures not aligned
o Poor store‐level execution of LP initiatives
Does your loss prevention team offer shrink prevention training to the buying organization?
o Yes
32
o No
o Don’t know
How frequently is shrink prevention training offered to the buying organization?
o More than once per year
o Once per year
o Less than once per year
o Only for new buyers
o Don’t know
Have you attended shrink prevention training in the past year?
o Yes
o No
33
Appendix 3: Costco
Company Background and Organization
Costco Wholesale Corporation began operations in 1983 in Seattle, Washington. The company operates
as a membership retail club and offers a limited assortment to their customers at prices below
competitors. It also provides members access to various business, consumer, and insurance services.
Such services help the company build a competitive edge and sustain its loyal consumer base. It is,
however, Costco’s assortment strategy for which the company is known. By limiting the assortment to
fast selling models, sizes, and colors, Costco warehouses carry far fewer SKUs than typical grocery or
mass retailers. As a result Costco’s retail supply chain does not have to manage the operational
complexity that comes with buying, distributing, and merchandising a wide variety of SKUs. A Costco
warehouse carries approximately 3,500 SKUs representing six product categories ‐ Sundries7, Hardlines,
Softlines, Food, Fresh Food, and Ancillary Services8.
At present there are 37 million households (68 million cardholders) who pay Costco’s annual
membership fee. The membership renewal rate stands at 90% demonstrating the loyalty of Costco
shoppers who appreciate Costco’s focused SKU selection, value pricing, services, and strong private label
offerings9. It is this membership fee ($55 for basic membership and $110 for executive membership)
model that enables Costco, and other club retailers, to maintain competitive pricing by selling
merchandise nearly at cost. Net margins at Costco are well below industry average as membership fees
contribute substantially to firm profit. 10 With total revenue of $99 billion in fiscal year 2012 – a 12
percent more revenue compared to the year prior – Costco is the sixth largest retailer in the world (see
Exhibit 1 for financial summary).11
Costco currently employs over 174,000 people in their 622 warehouses in the U.S. and in eight other
countries (as of December 2012). There exists three divisions of U.S. warehouses (Northern, Southwest,
and Eastern) and each division is composed of two to three regions. Additionally, Costco operates
regional depots (12 depots in the U.S.) for consolidation and distribution of most of their warehouse
shipments. Nine Executive Vice Presidents (EVPs) report to the CEO in their various roles in finance,
administration, information, merchandising, and international operations, among others. Senior
leadership directly involved in the selection, promotion, and delivery of merchandise to depots and
7 This includes candy, snack foods, tobacco, alcoholic and nonalcoholic beverages, and cleaning supplies. 8 Their ancillary business offerings include gas stations, pharmacies, optical and hearing aid centers, food courts, one‐hour photo services, and travel. 9 Approximately 20% of all items are sold under the name Kirkland Signature. 10 Product margins are typically capped at 14% but average 10%. This is the case even in instances when Costco may have been able to increase their margin to 25% and still price lower than their competition (e.g., Calvin Klein Jeans). Source: Interview with Jim Senegal Portland Business Journal Power Breakfast March 2009. 11 Costco Annual Report 2012
34
warehouses include Merchandising and Distribution. Costco also grants individual warehouse managers
significant autonomy to direct in‐store merchandising, promotion, and merchandise displays.
Costco’s corporate culture is rooted in building loyalty with their employees and their members. With
high wages, employee benefits, realistic promotion opportunities, as well as overall mutual respect
between management and hourly workers, Costco manages to sustain a turnover rate of 5% for
employees with one year of tenure (10% if one includes turnover within the first year). This turnover
rate is nearly 20% lower than reported in the overall industry12 due, Costco leaders argue, to a sense of
ownership among all employees. The strong corporate culture is in turn reflected in satisfied members
who benefit from quality customer service provided by experienced and loyal employees.13
Competition
Costco faces significant competition not only from over 800 warehouse club locations across the U.S.
and Canada (e.g., Walmart’s Sam’s Club and BJ’s) but also from a range of wholesale and retail market
players, including supermarkets, department and specialty stores, discount stores, and online retailers.
Competitors with significant market share in the retail industry include Amazon, Kohl’s, Kroger, Lowe’s,
Target, Walgreens, Walmart, among others. Costco competes on price, merchandise quality, a tailored
selection, retail sites, and member service. While competitors of Costco may have greater financial
resources and market penetration not to mention a broader product assortments, Costco manages to
differentiate itself through lower prices, better value, and higher employee retention which results in a
satisfied membership base. One trade‐off, however, of this strategy is that Costco may not be able to
follow consumer trends as closely as their competitors who have larger buying budgets and more
flexibility in the planning of assortments and the introduction of new items to the sales floor.
Technology, e‐Commerce, and omnichannel strategy
Costco’s online sales have grown by 10% year over year to $2.1 billion, or 2.1% of total sales, in fiscal
year 2012 (Exhibit 2). E‐Commerce sales have been impacted in recent years by Costco club members
buying fewer big‐ticket items on‐line.14 Recent initiatives to improve their members’ omnichannel
experience include the introduction of Apple and Android mobile applications as well as a revamped and
more customer‐friendly e‐commerce website. Products that are available online overlap, to some
extent, with Costco’s warehouse assortment. However, the majority of online merchandise offers
members product choices not available in the warehouses.15 Costco members do not yet have the
option of picking up in the store orders made online, as these orders are shipped directly to a member’s
home. Online orders are either drop‐shipped directly to the customer or sent from one of Costco’s
three e‐commerce depots. Nevertheless, Costco members do have the option of returning items to
12 The National Retail Federation states that 2010 retail employee turnover was 24.6%. 13 Costco Annual Report 2012 and interviews 14 Internet Retailer – 2013 Top 500 Guide 15 Costco Annual Report 2012
35
either a Costco warehouse or depot. Warehouse returns are then sent to the depot for sorting and
redistribution. See Exhibit 3 for a summary of Costco’s current omnichannel capabilities.
The company’s web assortment, which is managed by the e‐Commerce group, is merchandised
separately from the assortment found in Costco warehouses. In an attempt to align buyers that deal
with the same vendors or order the same items for the web and warehouse assortments, buyers for
online and brick‐and‐mortar sales both report to same VP of merchandising.16 Costco’s omnichannel
strategy is continuing to evolve as the firm experiments with integrating on‐line with warehouse buying
functions.
Mapping the process flow: Costco’s supply chain
Vendor relationships
Costco merchandises national brand‐name products as well as items produced by private label
manufacturers. Because buyers focus on each item individually (see section on the purchasing process
below), vendor relationships differ at Costco compared to other retailers. Specifically, Costco does not
emphasize providing Costco members a specific item supplied by a particular vendor. Instead, the focus
is on which item can provide their members with the best value in a specific product category. 17 As a
result, no one vendor makes up a significant share of Costco’s total assortment. Products and brands
move into and out of the assortment relatively frequently. Moreover, Costco buyers seem to have little
concern about finding alternate sources should any of their current supply sources become unavailable.
Vendor compliance tends to be high for Costco’s suppliers. In the case that a supplier is non‐compliant
(e.g., fails to meet shipping specifications or on‐time delivery expectations), the supplier may be fined.
However, buyers prefer to bring such issues to their management for them to address or to
communicate directly with the vendors. The objective is to identify possible solutions rather than
penalize their partners. Moreover, buyers may reward vendors who perform well in terms of delivery
accuracy and timing by offering them additional SKUs in future orders.
Rather than always return products to vendors, Costco tries to manage products that do not sell by
marking them down and sending coupon books to their members – so called multi‐vendor mailers
(MVMs) – in order to drive demand. Vendors typically fund MVMs and are common in Costco’s health
and beauty department. Other types of vendor funds and rebates include early payment discounts, full
refunds for unsold inventory (as in the case of DVDs), promotional funds for prominent placement, and
credit for damaged products. One example of the latter comes from Costco’s apparel department,
where buyers get a five percent across the board co‐op that covers opened items. Vendor funds are
16 Interviews 17 Interviews
36
generally recorded as a reduction in the cost of goods sold after the merchandise has been sold or, more
broadly, when the established terms of agreement with the vendor have been completed.18
DC‐to‐store inventory flow
Costco sources the majority of its merchandise directly from manufacturers, instead of from
distributors. Most items are shipped from suppliers either through one of their depots or directly to the
warehouses. The million‐square foot depot facilities serve as cross‐docking points. Inventory is not held
or stored at the depots. Instead pallets are received, consolidated, and shipped to warehouses typically
within 24 hours. This logistics strategy provides Costco an opportunity to optimize freight volume and
minimize handling. This, in turn, keeps operational costs low.
Costco also keeps operational costs low by requiring vendors to deliver items on display‐ready pallets
(Exhibit 4).19 This eliminates store labor as Costco employees simply need to unload the pallet from the
delivery truck and place it on the warehouse floor. This is a distinct advantage compared to other
retailers that need to receive a pallet, unpack it, and then shelve individual items. Such processes
require substantial time and labor – particularly for stores with a plethora of SKUs. Moreover, such
handling may increase the likelihood of damages, misplacement, or loss. Ninety‐five percent of what
Costco sells is sold on full‐pallets.
While the general rule of thumb is that no pallet or location should contain more than one item to avoid
confusion among members and employees alike, more than one item may be found on a pallet or in a
location at the discretion of a warehouse manager. Usually, this only occurs when a SKU is being
discontinued or discounted and another SKU with higher turn gains priority (see Exhibit 5 for examples
of split pallets). Avoiding split pallets whenever possible contributes to the prevention of unidentified
loss in the supply chain. When there is one item in one location, counting and replenishing merchandise
is less complicated than when there are multiple items with similar packaging merchandised in close
proximity to one another.
Costco communicates with vendors through a “Structural Packaging Specification” handbook that details
the requirements of these pallets and product packaging. This document, among other things, identifies
in detail the size, strength, and material composition of any pallet, product packaging, or shipping
material that is permissible within the Costco supply chain. Failure to comply with these specifications
can lead to a penalty (e.g., 2% chargeback) or even the delisting of a vendor’s item. Regardless, all new
items will be rejected upon delivery should prior deliveries be found in violation of Costco specifications.
At this point in time, buyers will, as noted above, intervene to attempt to solve these issues. Any
stoppage of product flow means that the performance of their product category suffers.
18 Costco Annual Report 2012, Interviews 19 Items required to replenish these displays can be found stored in steel shelves above the display pallet location.
37
Throughout all its documentation and communications with vendors, Costco makes it very clear that its
supply chain extends all the way to the warehouse floor and vendors need to consider not only the
quality of the items they are bringing into the warehouse but also the quality of the packaging. They
require packaging that can withstand movement within the Costco supply chain but also convert to
merchandising displays that are attractive and informative for members and that provide easy access to
individual items. Overall, the clear focus even within this supply chain function is on optimizing member
experience while controlling costs. This is a goal that seems to unify this organization and provides an
overarching objective towards which all functions can contribute.
Costco’s distribution strategy, which requires less handling and stocking, along with other efficiencies
derived from their warehouse‐style store set‐up (e.g., shorter hours of operation, minimal display racks,
limited hanging, etc.) offer significant cost saving opportunities relative to more traditional retail
operations. This is reflected in the low selling, general and administrative (SG&A) expenses at Costco,
namely 9.81 percent of net sales in fiscal year 2012 (see Exhibit 6 for the breakdown of Costco’s key cost
components in their profit structure, including its SG&A). At Costco, SG&A consists of salaries, benefits,
and workers’ compensation for all warehouse staff20 as well as regional and home office employees and
utilities, bank charges, rent, asset depreciation.21
The purchasing process
Costco’s merchandising groups are multi‐layered and vary in size and level of responsibility across
regions and categories. At the corporate level, buyers are organized in five groups: General Merchandise
Managers (GMMs), Assistant GMMs, Buyers, Assistant Buyers22, and Inventory Control Specialists (ICSs),
each of which is responsible for one or several product categories. The GMM is in charge of making
strategic decisions at the department level and for approving the final assortment together with the
Assistant GMM. The latter is also responsible for Costco’s category‐level strategy for their assigned
items. The Buyers at Costco are the main decision makers in selecting SKUs for the assortment, setting
prices, forecasting overall volume, and determining distribution quantities for individual regions. They
are also accountable for hitting their weekly and annual category sales and budget targets, and for
conducting item Line Reviews (see below). The ICSs set up purchase orders (POs) in the system,
communicate these to the vendors, and make sure that items are in stock. Exhibit 7 depicts the
decisions in the merchandising and distribution of goods made by buyers and other key groups within
Costco retail supply chain.
The buying group has a parallel structure for regionally sourced items that to a large extent resembles
the structure in corporate. The fresh foods category, for instance, which is largely sourced at a regional
level, is managed by Regional Buyers, Assistant Regional Buyers, and Regional ICSs. These employees
20 It excludes the salaries, benefits, and workers’ compensation for those who staff the fresh food departments and certain ancillary business services. 21 Costco Annual Report 2012 22 The exact number of Assistant Buyers assigned to a category as well as their level of responsibility varies.
38
operate out of regional offices, and decide on how best to manage inventory and in‐stock in terms of
volume and allocation. They also rely on warehouse managers to identify needs in the local market (e.g.,
a warehouse manager may suggest a local food manufacturer).23 Other categories, such as apparel, will
only have regional ICSs.
These groups work together such that the purchasing process follows one of these three paths.
Corporate decides what to order and regions decide how much. Corporate allocates products to
regional depots and regions decide how to allocate within the region. Lastly, regions receive vendor‐
allocated inventory directly according to corporate direction and regions decide how to allocate within
the region.
The selection of merchandise by buyers follows a structured process. Buyers hold regular Line Reviews
with vendors in order to go over new items, analyze prospects of sales, growth, and pricing structure.
The frequency of Line Reviews varies significantly by category, starting at once per month for fashion
and seasonal merchandise such as apparel and foods. Line reviews occur with some frequency as do
new set‐ups. Nearly every single week, buyers are putting new products into Costco warehouses in
order to keep members from being bored and to create the ‘treasure hunt’ atmosphere desired by
Costco leadership. Note that new SKUs will often be tested in the warehouses before the buyer decides
to create the PO. This usually involves an eight‐week test period in 25‐40 buildings selected by the
buyer24. Frequent resets also have operational benefits in addition to member benefits. Costco used to
have the majority of their new items enter the warehouse at the beginning of a selling period and then
the warehouse would sell through these items until the next period. With re‐sets occurring each week,
it not only keeps the inventory fresh and exciting, it helps balance the flow and required workload.
Instead of needing to ramp up space, labor, transportation, receiving, etc. for the start of each selling
season, there is now a steady influx of new items that can be readily managed by existing staffing levels.
Buyers’ bonuses are based 50 percent on corporate performance and 50 percent on the specific
department’s performance. Key determinants of bonus include sales, margin, growth, and inventory
turns. GMMs are additionally incented on shrink targets.25 Buyers argue, however, that sales tend to
drive everything because the cap on margins means little variability across items in margin. GMMs
allocate buyers a certain number of spaces in a category, also known as pallet positions, and they then
determine what the best use of that space is. They often have productivity targets – a minimum
threshold of sales per week per warehouse per item – they have to meet to keep a product in the
assortment. Each item has to stand on its own and to justify its own space. These buyers follow a few
key rules, namely, sell nothing below cost, do not exceed a margin of 14%, for non‐food items, and try to
order in full pallet quantities.
23 Interviews 24 It takes 6‐9 months from start to finish to create an item that will be displayed in a Costco warehouse. This can extend to as much as 1 year for private label Kirkland Signature items. 25 Interviews
39
Costco buyers argue that their roles are far less complex than the jobs of their counterparts at other
retailers mainly because they need only focus on 60‐80 items compared to 2‐3,000 items. With so few
items, it is really easy to quickly look at the performance of each item daily and, when needed initiate
research to determine if something is going wrong. Moreover, buyers state that they require little
computerized support to conduct their analyses given their focus on each item rather than shopping
baskets. They perceive their ability to manage and manipulate the raw data an advantage as it provides
them first‐hand knowledge of their category.
By focusing on fewer items, buyers have the time to evaluate each item in more depth. Specifically,
buyers can focus on how their decision impact operational factors. They do so in part due to incentives
and in part due to the understanding of warehouse tasks and empathy for warehouse employees. Buyer
margins at Costco take into account not just the negotiated price26 of an item but also the net landed
cost – or how much it costs to get the item all the way to the warehouse floor. Thus, buyers, when
setting up an item, are trying to figure out how to get the item from the factory to the warehouse as
efficiently as possible. Buyers can impact this decision through the choice of packagers (vendor
packaged versus utilizing a third party packer), buying in truckloads, pallets, etc. Buyers even go so far
as to focus on the SG&A required to sell the product. They often think about how much time and effort
will go into stocking and item because the sales need to offset those payroll dollars.
Costco buyers have often spent many years – even entire careers – within different roles on the buying
teams working their way up from the ICS position and gaining experience across categories. Worth
noting is that nearly all members of the buying team enter through the ICS position. Therefore, the
buyers understand the inventory flow process and the challenges that can arise with product
replenishment. The length of time the buyers have been with the company, and within their buying
roles, is seemingly unique among retailers. It is not unusual to meet buyers who started as an hourly in
their local warehouse and thus have a deep understanding of the operational challenges faced by stores
in the movement, sale, and merchandising of items. This frontline experience among those buying and
planning inventory engenders a respect for operational execution. Moreover, because of this
experience, they understand how the decisions they make as buyers (product selection, type of
packaging, display choices, new item introduction, pricing, etc.) can influence the productivity of each
warehouse location by making an item easy to merchandise, keep in stock, sell, and rapidly replenish.
Product availability at Costco
Inventory management, cycle counting, & shrink
Costco’s inventories are valued at the lower of cost or market, determined by the retail inventory
method, and are stated using the last‐in, first‐out (LIFO) method for U.S. merchandise, whereas foreign
operations are stated using the first‐in, first out (FIFO) method.27 It is important to note that Costco does
26 The cost of goods sold is reduced by vendor rebates. 27 Costco Annual Report 2012, company‐provided information.
40
not track items by color or size28. An item gets one number regardless of its color and size. This causes
challenges not only for accurate replenishment but also for managing and identifying inventory shrink.
Costco measures inventory shrink by taking the difference between actual and expected inventory levels
at the item level, valued at retail, as a percentage of net sales. All merchandise is counted twice a year.
In addition to the semi‐annual inventory adjustments associated with these physical inventory audits,
Costco‐employed auditors do periodic inventory counts (cycle counts) in the warehouses once per week,
with a new category chosen at the discretion of the warehouses for counting each week. The cycle
counts are summarized in bi‐annual shrink reports that are developed by the company’s Financial
Accounting group under the direction of the Comptroller. These reports include a list of top‐25 shrink
items and are shared with the warehouses. Cycle counting results are also presented by the GMMs in
the monthly budget meetings for executives from specific regions and departments.
Buyers believe these monthly shrink reports to be somewhat ad‐hoc in that the items counted are not
chosen systematically so an item might show up in the top‐25 because it was counted by a warehouse
whereas another item, with shrink issue, might not be on the list because it wasn’t selected for a count.
Buyers do, however, rely frequently on the pictures sent to them by warehouse managers to identify
which colors of an item are selling more rapidly than another or sizes that might be missing from a pallet
so that the buyer will send some more of those colors and sizes. This manual process is in place to
mitigate any product availability problems that might arise due to shrink or inaccurate replenishment
due to the lack of style‐color‐size visibility.
Shrink is presented as a line item in the annual budget, based on the company’s experience and past
results. Shrink is also present on the monthly budgets managed by buyers. Buyers, however, argue that
this line item rarely fluctuates and thus it is not often taken into consideration during any of their line
review meetings. What does garner more addition from buyers is the damaged and destroyed line item
on the budget. This line item is maintained separately from shrink and it primarily captures returns.
Returns at Costco, like at most retailers, represent a substantial problem within some product
categories. Returns could be due to quality problems, buyers’ remorse, or a product that is too
complicated to assemble or to hook up. The adoption of the Costco concierge service aimed to help
members with complicated electronics set‐ups reduced returns dramatically but not enough to draw
attention entirely away from the challenge of returns.
Shrink prevention at Costco
Costco acknowledges that internal and external theft is only one component of shrink and estimates this
accounts for 50% of their overall shrink. Inventory markdowns and process failures such as receiving
errors, concealed shortage (e.g., inner‐carton shortage), undocumented destroyed, unauthorized use,
and front‐end errors comprise the remaining 50%. Overall, shrink is relatively low at Costco, with an
28 Some basic items do have size tracking and on‐line merchandise is tracked by item, color, and size.
41
annual shrink rate 0.1 percent of net sales in 200929 and less than 0.25% of net sales at present30. Any
product category with a shrink number of 1% or greater is considered “big” and garners managerial
attention.
Although widely used in the industry, Costco chooses not to use electronic article surveillance (EAS)
tagging to prevent shrink nor does it have any plans to start tagging its merchandise. Managers argue
that tagging would not only potentially damage merchandise but would slow down check‐out lanes as
member services try to remove the tags. Instead of technology, Costco relies on process compliance
and packaging. Specifically, Costco tries to prevent theft by requiring that their full pallets maintain
their integrity during handling and vendors provide shelf ready pallets that can be placed on warehouse
floor without handling. In their packaging, they prefer not to use clamshells but are fine with the use of
blister cards or stretch cards. While packaging choice is important in electronics, buyers often find it
hard to influence packaging in this product category because vendors often keep a close hold on product
launches. Under these conditions, buyers may not have the opportunity to see the item beforehand in
order to influence the packaging choice. In this case, buyers may have to work with vendors in a
reactionary mode as they try to mitigate any shrink or damage problems that arise.
GMMs have an explicit shrink metric included in their bonus and are among the few corporate
employees that do. Nevertheless, the corporate culture encourages company‐wide consideration of the
issue. Similar to quality at Toyota where quality was everyone’s business, shrink is everyone’s business
at Costco. Warehouse managers educate hourly floor walkers how they can minimize merchandize
tampering, loss, or markdowns by simply carrying tape and repairing any damaged cartons they observe.
Their training manual emphasizes the need for member services to watch for pilferage, concealment, or
breakage of merchandise. The same is true at corporate. Buyers, in the apparel department for
instance, proposed hanging a jacket in the store instead of using the traditional merchandise plan of
folding the pieces on tables. Folding the jacket resulted on pieces falling off the display settings and
getting damaged in the process, thus exacerbating the shrink rate (See Exhibit 8). Another example
comes from the Media product category, where high theft rates of a popular movie trilogy led to the
withdrawal of blockbuster DVDs.
Warehouse managers and their assistant managers also have shrink included in their bonus structure (in
addition to payroll expenses, P&L results, controllable expenses, and discretionary funding). Because of
the relatively high autonomy awarded to warehouse managers, and because planograms are not used at
Costco, warehouse managers can decide how products should be displayed, and where, within specific
sections in the warehouse they should be located. This includes deciding whether or not to lock up
product perceived to be high risk (e.g., high likelihood of being stolen). However, whether or not a
product is locked‐up or whether a particular packaging type is effective at mitigating shrink is not
29 Portland Business Journal Power Breakfast March 2009. 30 Apparel at 0.6% shrink is among the highest shrink product categories along with jewelry, tobacco, and computer software.
42
systematically reported back to buyer. This may translate into a lost opportunity to analyze the impact
of packaging solutions within warehouses for key SKUs and the impact that the decisions warehouse
managers make have on shrink and sales.
The Loss Prevention (LP) Department at Costco is comprised of one individual, a director of security,
who reports to an EVP31. There are 14 Regional LP Managers responsible for overseeing specific
geographic areas across the globe and who report directly to an operational VP. These individuals have
dotted line responsibility to the director of security at central. The warehouse manager determines
whether or not there are LP associates at the warehouse. LP associates function, typically, as
undercover floor agents. Determining how much payroll to allocate to this LP associate is completely at
the discretion of the warehouse manager. Some warehouse managers elect not to allocate payroll to
this function whereas others may choose to have as many as four LP associates. Typically, a warehouse
has one or two but this may change over time and depends on the needs of the specific warehouse.
Since shrink prevention is more broadly embedded throughout the various functions of the company,
including Operations, Merchants, and Depots, LP staff devote most of their time to issues related to
theft and safety. LP management also serves as a communication point for buyers and warehouse
management if they notice inventory discrepancies. If a buyer notices shrink discrepancies, their first
step would be to communicate with vendors. If a solution cannot be reached with the vendor, the issue
would in turn be escalated to the LP team for internal investigation.32
However, the LP team recognizes that Costco has unique advantages when it comes to the prevention of
shrink that might not exist in other retail organizations. These include:
One door in & one door out
Membership Club with shopping history, loyal members due to prices and refund policy, and last
but not least member photos
Member Service Employees at each door
Large packaging
Employee loyalty – good wages, benefits, and internal promotions
Shrink embedded in every position
Depot is designed as a flow through moving only 3,500 SKUs as pallet stock. If any product is in
the depot at the end of the day – they have a visual cue that something went wrong.
No minors unless accompanied by an adult
31 Costco operates with an LP department budget nearly 1/10th the size of comparably sized retailers. 32 Interviews
43
No vendor stocking with the exception of bread.
Overall, Costco is tremendously focused and disciplined in all its operational tasks, including shrink
prevention. Because its objective is to “turn inventory, not people”33, Costco employees have long
tenures with the company and exhibit tremendous pride in the work that they do. This experience may
mean they are more familiar with the merchandise and therefore less likely to make mistakes that could
lead to inventory shrinkage.
Key lessons learned from Costco
Costco’s specific business model as a big‐box club retailer brings a number of advantages with a positive
impact on availability and shrink. First, the low number of SKUs allows for a manageable workload for
the buyers and more time to think about packaging, and how this may impact product availability in the
warehouses. Similarly, pallet‐size delivery to the warehouses, with only one product displayed on each
pallet creates a higher level of simplicity in product handling and replenishment as well as a potential for
lower shrink numbers. Third, Costco‘s club format creates a sense of responsibility even for their
members, not only because a majority of customers renew their memberships year after year, but also
because it allows for better monitoring and product tracking for the company. Finally, Costco’s strong
corporate culture and the sense of belonging that employees have to the company creates a level of
ownership and accountability for all departments, both in corporate, warehouses, and the depots, and
incentivizes the teams to think about product availability in their day‐to‐day operations. Teams within
corporate exhibit very strong cross‐functional teamwork with a lot of communication and discussion
focused on common goals.
In spite of its strengths, areas for improvement do exist. Buyers have to exert a great deal of effort to
determine the color and size sold of an item which can be challenging for replenishment as well as for
tracking shrink. Buyers express a strong desire to be able to see on‐hand inventory as well as sales by
color and size. They don’t know if the 100 units they have left are all one size or one color. It often
requires a manual process whereby they request that the store go and check. This hinders their ability
to flex within the season – and they can really only make adjustments for the next year.
Store operators seek better capture of data and learning across warehouses, products, and over time.
Some argue for the adoption of better processes to determine what worked, what didn’t work, and why.
Because each event is treated as a discrete event, there is little analysis. While this fits with the Costco
culture of keeping it simple and not adding to the overhead, it means that the firm is often repeating the
same mistakes or each warehouse operator has to learn for him‐ or herself about how best to execute.
One suggestion is to implement a packaging forum – a place where a warehouse operator could upload
pictures of problems that is accessible to buyers. In so doing, buyers can be educated about the
challenges they are facing in real time. And, perhaps with these pictures there would be sufficient data
33 http://www.fool.com/investing/general/2013/07/31/an‐interview‐with‐jim‐sinegal ‐of‐costoc.aspx. Accessed 8/6/2013.

44
to systematically determine what drives some of the packaging problems that lead to damage and
shrink.
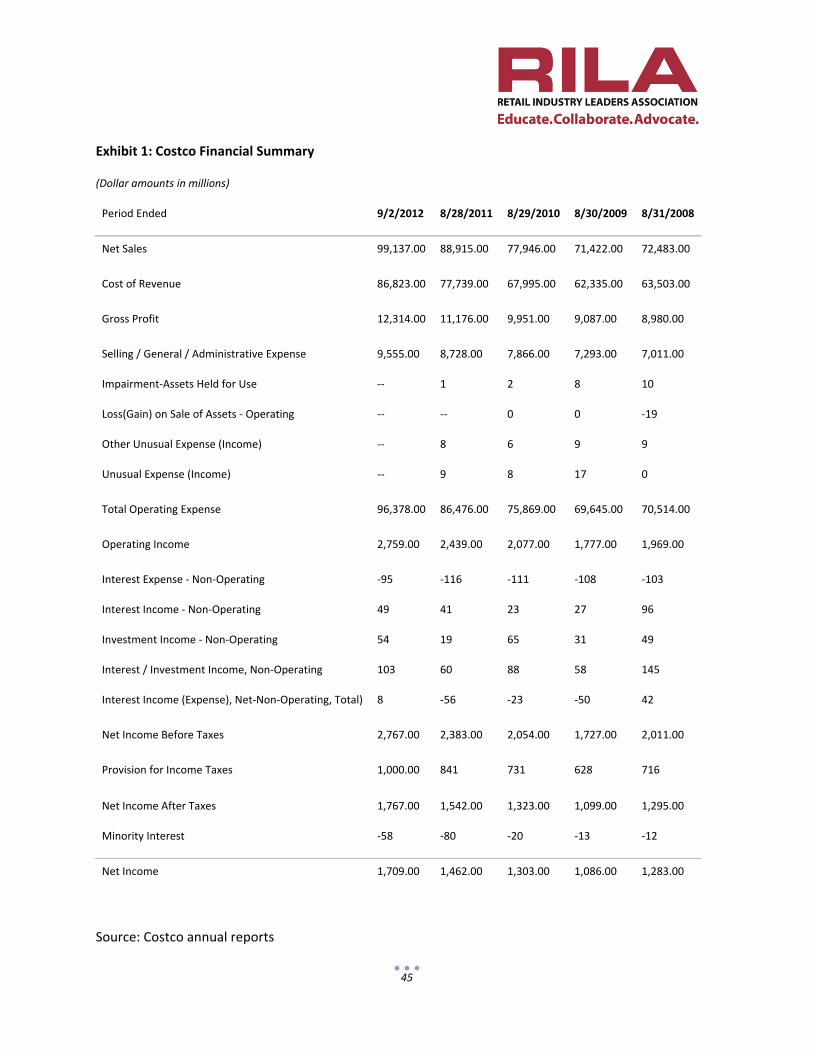
45
Exhibit 1: Costco Financial Summary
(Dollar amounts in millions)
Period Ended 9/2/2012 8/28/2011 8/29/2010 8/30/2009 8/31/2008
Net Sales 99,137.00 88,915.00 77,946.00 71,422.00 72,483.00
Cost of Revenue 86,823.00 77,739.00 67,995.00 62,335.00 63,503.00
Gross Profit 12,314.00 11,176.00 9,951.00 9,087.00 8,980.00
Selling / General / Administrative Expense 9,555.00 8,728.00 7,866.00 7,293.00 7,011.00
Impairment‐Assets Held for Use ‐‐ 1 2 8 10
Loss(Gain) on Sale of Assets ‐ Operating ‐‐ ‐‐ 0 0 ‐19
Other Unusual Expense (Income) ‐‐ 8 6 9 9
Unusual Expense (Income) ‐‐ 9 8 17 0
Total Operating Expense 96,378.00 86,476.00 75,869.00 69,645.00 70,514.00
Operating Income 2,759.00 2,439.00 2,077.00 1,777.00 1,969.00
Interest Expense ‐ Non‐Operating ‐95 ‐116 ‐111 ‐108 ‐103
Interest Income ‐ Non‐Operating 49 41 23 27 96
Investment Income ‐ Non‐Operating 54 19 65 31 49
Interest / Investment Income, Non‐Operating 103 60 88 58 145
Interest Income (Expense), Net‐Non‐Operating, Total) 8 ‐56 ‐23 ‐50 42
Net Income Before Taxes 2,767.00 2,383.00 2,054.00 1,727.00 2,011.00
Provision for Income Taxes 1,000.00 841 731 628 716
Net Income After Taxes 1,767.00 1,542.00 1,323.00 1,099.00 1,295.00
Minority Interest ‐58 ‐80 ‐20 ‐13 ‐12
Net Income 1,709.00 1,462.00 1,303.00 1,086.00 1,283.00
Source: Costco annual reports
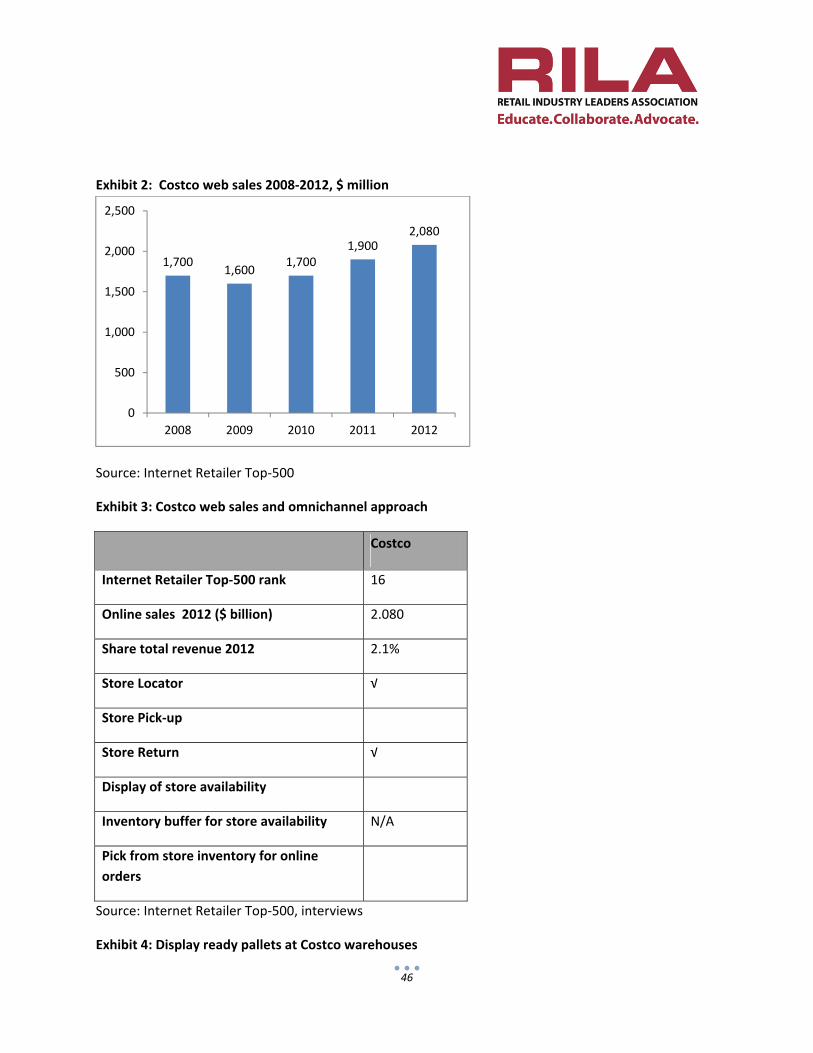
46
Exhibit 2: Costco web sales 2008‐2012, $ million
Source: Internet Retailer Top‐500
Exhibit 3: Costco web sales and omnichannel approach
Costco
Internet Retailer Top‐500 rank 16
Online sales 2012 ($ billion) 2.080
Share total revenue 2012 2.1%
Store Locator √
Store Pick‐up
Store Return √
Display of store availability
Inventory buffer for store availability N/A
Pick from store inventory for online
orders
Source: Internet Retailer Top‐500, interviews
Exhibit 4: Display ready pallets at Costco warehouses
1,7001,600
1,7001,900
2,080
0
500
1,000
1,500
2,000
2,500
2008 2009 2010 2011 2012
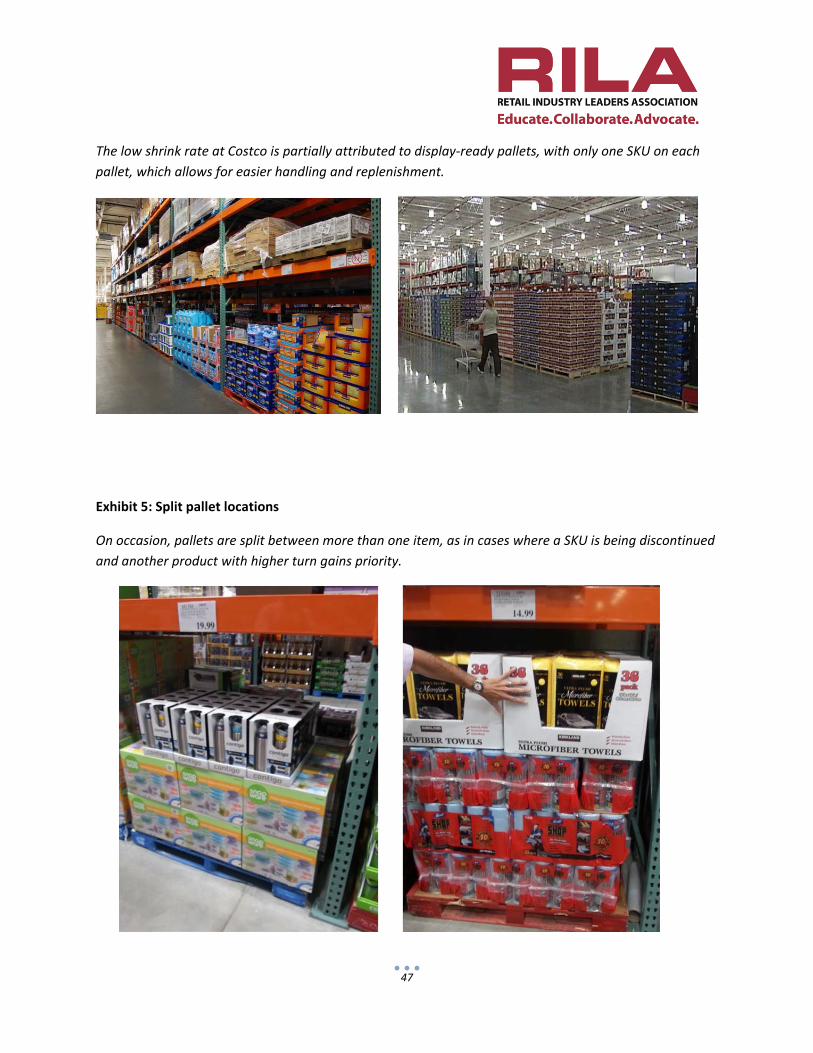
47
The low shrink rate at Costco is partially attributed to display‐ready pallets, with only one SKU on each
pallet, which allows for easier handling and replenishment.
Exhibit 5: Split pallet locations
On occasion, pallets are split between more than one item, as in cases where a SKU is being discontinued
and another product with higher turn gains priority.
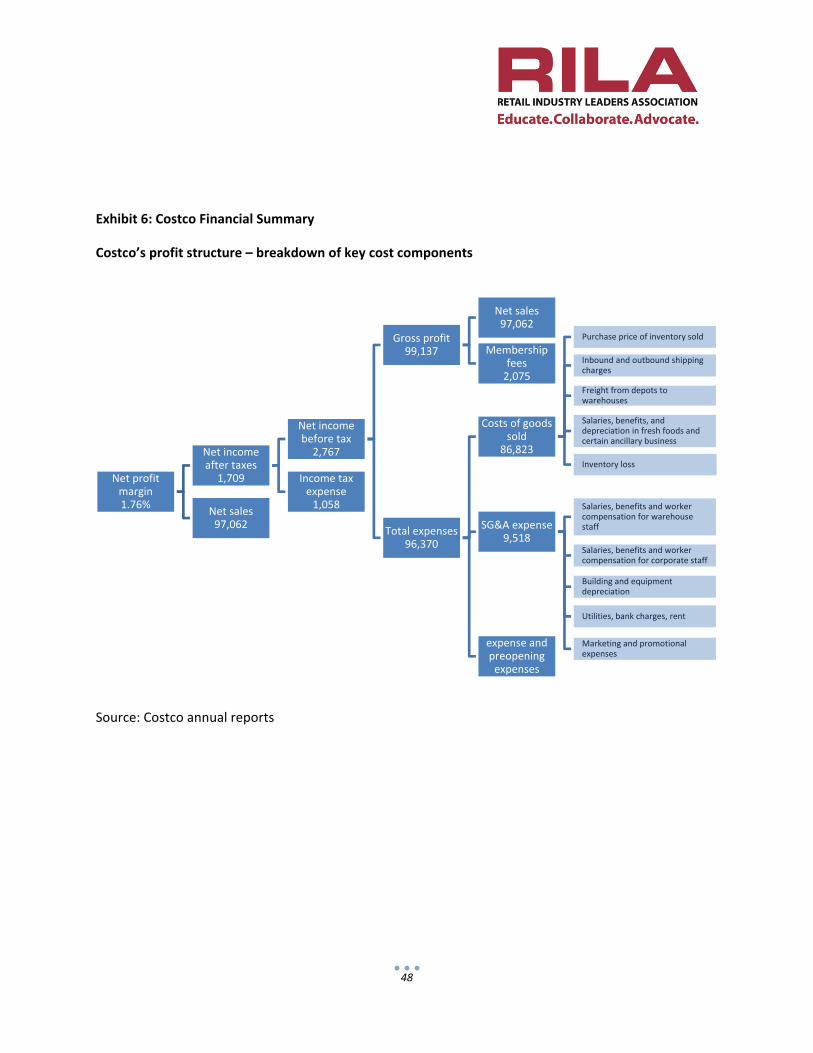
48
Exhibit 6: Costco Financial Summary
Costco’s profit structure – breakdown of key cost components
Source: Costco annual reports
Net profit margin1.76%
Net income after taxes
1,709
Net income before tax2,767
Gross profit99,137
Net sales97,062
Membership fees2,075
Total expenses96,370
Costs of goods sold
86,823
Purchase price of inventory sold
Inbound and outbound shipping charges
Freight from depots to warehouses
Salaries, benefits, and depreciation in fresh foods and certain ancillary business
Inventory loss
SG&A expense9,518
Salaries, benefits and worker compensation for warehouse staff
Salaries, benefits and worker compensation for corporate staff
Building and equipment depreciation
Utilities, bank charges, rent
Marketing and promotional expenses
Interest expense and preopening expenses
132
Income tax expense1,058
Net sales97,062
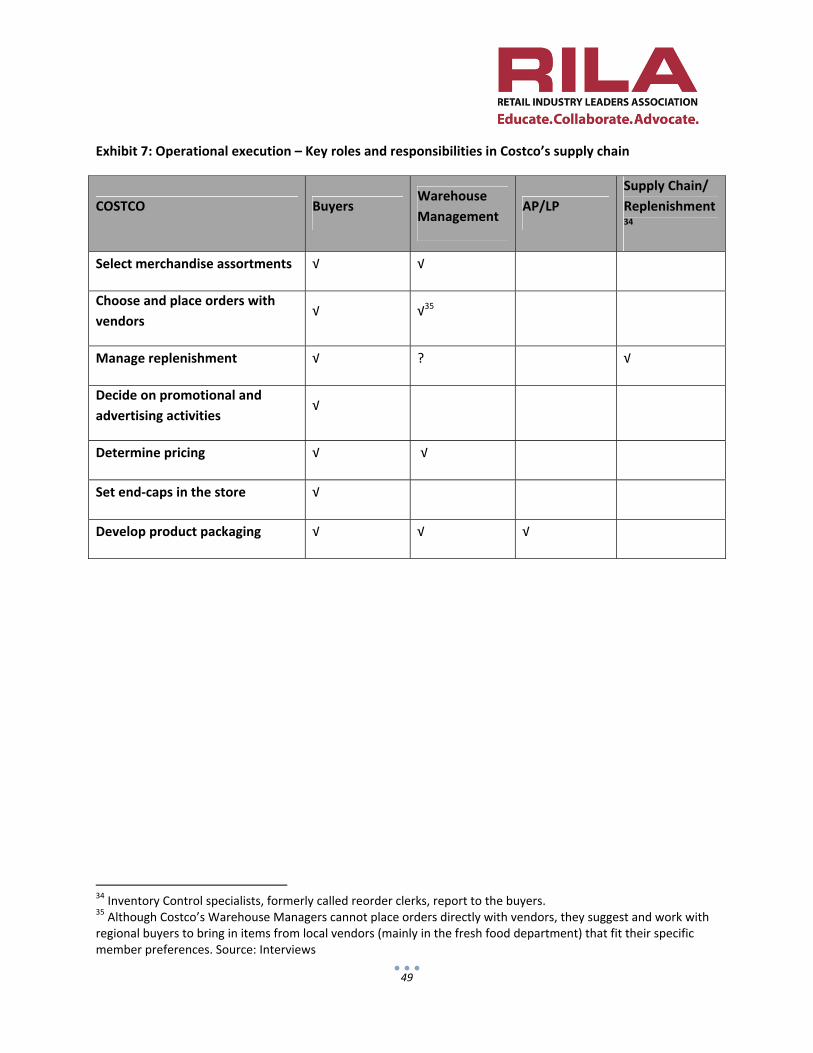
49
Exhibit 7: Operational execution – Key roles and responsibilities in Costco’s supply chain
COSTCO Buyers Warehouse
Management AP/LP
Supply Chain/
Replenishment34
Select merchandise assortments √ √
Choose and place orders with
vendors √ √35
Manage replenishment √ ?
√
Decide on promotional and
advertising activities √
Determine pricing √ √
Set end‐caps in the store √
Develop product packaging √ √ √
34 Inventory Control specialists, formerly called reorder clerks, report to the buyers. 35 Although Costco’s Warehouse Managers cannot place orders directly with vendors, they suggest and work with regional buyers to bring in items from local vendors (mainly in the fresh food department) that fit their specific member preferences. Source: Interviews
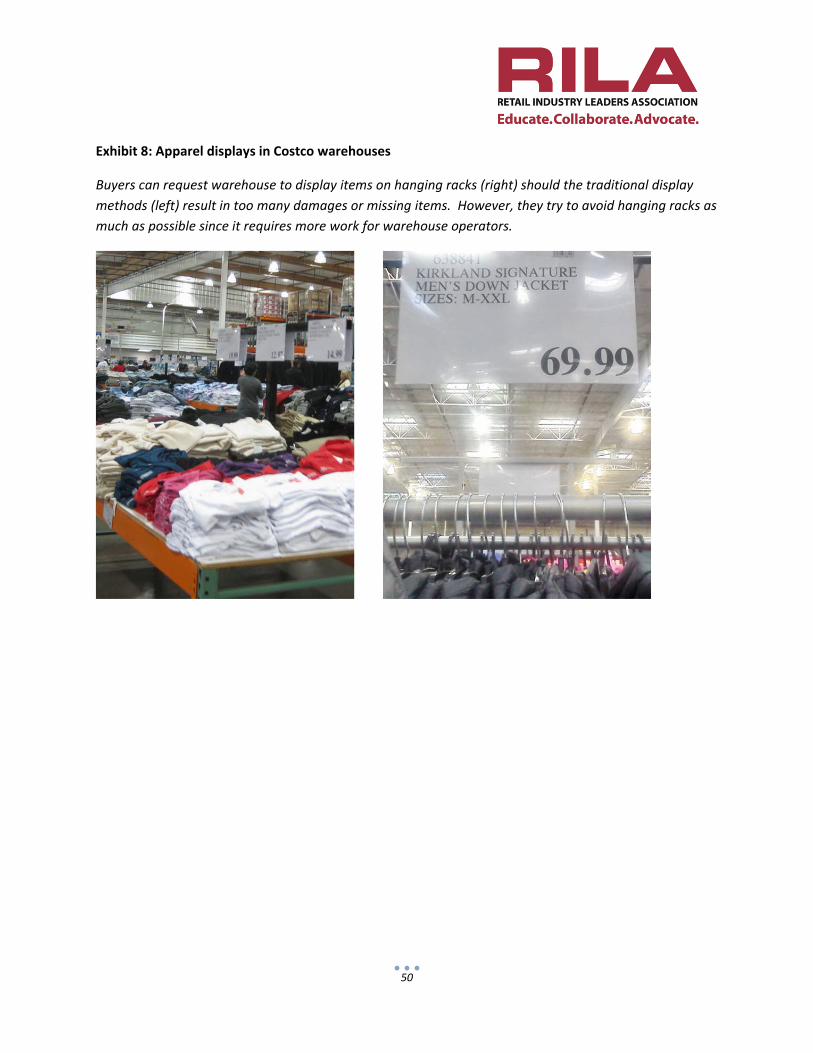
50
Exhibit 8: Apparel displays in Costco warehouses
Buyers can request warehouse to display items on hanging racks (right) should the traditional display
methods (left) result in too many damages or missing items. However, they try to avoid hanging racks as
much as possible since it requires more work for warehouse operators.
51
Appendix 4: AutoZone Case Study
Company Background and Organization
Founded in 1999, AutoZone, herein referred to as AZ, is the leading US specialty retailer of automotive
aftermarket parts. AZ carries an extensive product line that includes new and remanufactured
automotive maintenance items, accessories and non‐automotive products for cars, sport utility vehicles,
vans, and light trucks. AZ serves its customers through both Do‐It‐Yourself (DIY) and Do‐It‐For‐Me (DIFM
or Commercial) channels, as well as several e‐Commerce channels. The commercial sales program
provides commercial credit and delivery of parts and other products to local, regional, and national
repair garages, dealers, service stations, and public sector accounts. AZ’s product groups are organized
in 8 key categories: Performance and Personalization, Tune‐up and Fuel, Under‐car, Brakes, Commodity
and Seasonal, Chemicals, Minor Repair and finally Starting, Charging and Major Repair. In fiscal year
2012, the company recorded revenues of $8.6 billion, a 6.6 percent increase from the year prior, with a
net margin of 10.8 percent. Exhibit 1 presents a summary of the firm’s financial position.
The 70,000‐strong workforce is mainly employed in AZ’s 5,109 stores in the U.S. and Puerto Rico. Of
these, 341 stores are in Mexico and one store is in Brazil. Around five percent of staff is employed in
distribution centers and an additional three percent in store support functions in the corporate offices in
Memphis, TN, and Monterrey, Mexico.36 Key groups involved in operational execution, e.g. all activities
required in getting products to store and available to customers, are Merchandising, Supply Chain, Store
Operations and Loss Prevention. Given AZ’s centralized structure, store management tends to play an
operational role, with less exposure to merchandising, replenishment, and assortment planning (e.g.,
selecting items to be carried in the store). See Exhibit 2 for overview of roles and responsibilities.
Providing high levels of customer service is a key component of AZ’s corporate culture, with store
employees providing prompt, courteous service and trustworthy advice. At the same time there is a
notion of thrift in staff operations that is prevalent across the organization. Store managers, merchants,
and operations staff are all cost conscious in their respective responsibilities – a culture that is
emphasized by AZ’s incentive structure. Merchants, Store Operations, Supply Chain Management and
Loss Prevention staff are all incented on overall company performance relative to target objectives.37
Individual performance is considered for managerial evaluation purposes but not included in the
monetary bonus calculations except for those that don’t meet or failed to meet expectations. In those
cases, bonuses are reduced for lower performance.
36 AutoZone Annual Report 2012 37 The incentive objectives are set by the Board at the beginning of the fiscal year and are based on the achievement of specified levels of earnings before interest and taxes (EBIT) and return on invested capital (ROIC). The total incentive award is determined based on the impact of EBIT and ROIC on AZ’s economic profit for the year, rather than by a simple allocation of a portion of the award to achievement of the EBIT target and a portion to achievement of the ROIC target. If both the EBIT and ROIC targets are achieved, the result will be a 100%, or target, payout. Source: AutoZone Annual Report 2012
52
Competition
AZ operates in a fragmented aftermarket auto‐parts industry, with stringent competition in many areas.
Competitors include national, regional, and local auto‐parts chains, original equipment manufacturers,
independently owned and online parts stores, repair shops, as well as discount and mass merchandise
stores that sell aftermarket auto‐parts. Key competitors include O’Reilly, Advance Auto Parts, Inc. and
Genuine Parts Company, among others. AZ competes on the basis of customer service (i.e. GOTTChA –
going out to the customer’s automobile) and delivering trustworthy advice. With a DIY market share of
38.6 percent, AZ’s competitive advantage is particularly reflected in customer service and the level of
expertise and technical assistance that AZ employees can offer their customers due to continued
investment in training of store‐level staff. This ranges from helping customers change wipers on their car
to providing them with in‐store technology through electronic catalog terminals where they easily can
identify the appropriate parts and locate the items either in the store, another location or online. The
company also focuses on improving product availability in local markets by increased and more efficient
use of Hub Stores, which on average carry 35,000 SKUs, compared to 18,000‐23,000 SKUs in a regular AZ
store.38
Technology, e‐Commerce, and omnichannel strategy
AZ has a relatively developed online retailing system, with $236 million, or 2.75 percent of the
company’s sales coming from ALLDATA, E‐Commerce, and AutoAnything – 32.5 percent growth from the
trailing four quarters as of May of 2013. AZ sells automotive hard parts, maintenance items, accessories,
and non‐automotive products through www.autozone.com, www.alldata.com, www.autoanything.com
and commercial customers can make purchases through www.autozonepro.com. AZ also sells the
ALLDATA brand diagnostic and repair software through www.alldata.com. Finally, in December 2012 AZ
further expanded its online presence through acquisition of the San Diego‐based online specialized
auto‐parts retailer AutoAnything.39
Customers can have their online orders either shipped directly home or picked up in store. The company
has an assigned fulfillment center for online orders that will ship online orders to the home. Store
managers still have to consider the process of returns to store (which is a customer option within 90
days of purchase), and how they source it back to the fulfillment center in a way that will not result in in‐
store inventory discrepancies. See Exhibits 3a and 3b for overview of AZ’s omnichannel approach and
performance.
38 OneSource Information Services; accessed on 7.30.2013, Internal company resources 39 Internet Retailer – 2013 Top 500 Guide
53
Mapping the process flow: The AutoZone supply chain
Vendor relationships
AZ’s items are supplied by numerous vendors, ranging from original equipment manufacturers (OEMs)
to small local vendors that are solely, or to a large extent, dependent on AZ as a customer. In fiscal year
2012, the company had one vendor that supplied more than 10 percent of total purchases, with
remainder of vendors all supplying smaller shares.40
AZ receives various payments and allowances from their vendors through a variety of programs and
arrangements, including allowances for warranties, advertising, general promotion of vendor products,
new store allowances, bulk purchases, item tagging and sealing, credit for returned excess inventory,
among others. Close to 90 percent of the vendor funds received are recorded as a reduction of the cost
of inventories and recognized as a reduction to cost of sales as these inventories are sold.41 AZ’s vendors
are held accountable for their fulfillment plans, as they are charged five percent of the total purchase
order when they fulfill less than 95 percent of the order quantity.42
DC‐to‐store inventory flow
Merchandise is selected and purchased for all stores through AZ’s store support centers located in
Memphis, TN, and Monterrey, Mexico. A sourcing agent is used for imports from China (Test Rite
Sourcing) who acts directly on behalf of AZ overseas. AZ leadership has made a strong push towards
direct imports (DI) as a key strategy for sourcing of merchandise. There is a risk associated with this
approach, as it could omit considerations of costs arising from transportation, and other import‐related
outlays, that could offset any savings from lower vendor prices. Once the product is received from the
supplier in the distribution centers (DCs), there are three main channels through which the item can
reach the end‐customer: (i) base stores; (ii) hub stores; (iii) satellite stores (Exhibit 4). Alternatively,
online orders are fulfilled directly from web fulfillment centers. Most of AZ’s merchandise flows through
DCs to the stores, either by their own fleet or by third‐party trucking firms. In addition to DCs, AZ also
operates 155 hub stores which generally have a larger assortment of products in addition to regular
replenishment items that can be delivered to a store within its network more promptly. Introduction of
hub stores, which are replenished from DCs several times per week, have increased AZ’s ability to
distribute products on a timely basis and to provide an expanded product assortment.
Merchandising and Supply Chain Replenishment staff is organized under the same arm of AZ’s
operations, a strategic move to improve collaboration through regular participation of replenishment
staff in merchant/vendor meetings where product purchases and volume are decided. The integration
was seen as necessary as the number of SKUs continues to increase – totaling nearly 450,000 SKUs to
date – and products have become more complex. This has created a need for timely communication
between merchants and replenishment staff in order to ensure that accurate lead times and volume can
40 AutoZone Annual Report 2012, Interviews 41 AutoZone Annual Report 2012 42 Interviews
54
be determined upfront. By having both merchandising as well as supply chains staff reporting to the
same leadership team, AZ minimizes the risk of diluting ownership of product availability issues as they
arise and allows the team to more accurately forecast product availability and plan around accurate lead
times for sourcing their products. One possible downside of having the replenishment teams collocated
with the buying teams is that it makes supply chain communication more challenging, as their group is
organized by category and thus scattered in eight different places on each merchandising category
team.43
Focusing in on the merchants
Organization and performance
Similar to most other retailers, the merchandising group at AZ plays an important role in the
organization, with the responsibility of selecting products to be included in the assortment, setting
prices that keep AZ competitive, managing promotions and displays, and being the key contact point
towards the company’s suppliers.
The buyers are organized in two groups: Category Managers (CMs) and Assistant Category Managers
(ACMs). CMs are responsible for specific sub‐categories (within the main eight categories), with
responsibility being decided by total volume that the sub‐category represents for the company.
Category responsibility can thus range for anywhere between one and five categories for each CM, with
high variation in the number of vendor relationships handled. Lastly, ACMs serve as analysts and are
responsible for doing background research on each category, as well as for the on‐boarding of new
products into the existing assortment and measuring the results and presenting the category to
Merchandising’s upper management. Some ACM’s will actually manage a sub‐category within the CM’s
category. In so doing, they make the decisions as a category owner although their CM is held
accountable for these decisions. Through this process, CMs are able to train ACMs in key CM skills and
evaluate their performance in order to determine if they are ready to take on a larger CM role.
Performance of CMs are monitored along a number of metrics, including sales, gross margin, gross
profit, inventory turns, payables, shrink and vendor funding. Their bonus is however not based on their
specific category, but is instead tied to corporate earnings and expenses through a set percentage of
EBIT. This way, AZ strives to align individual CMs’ incentives and productivity with the company’s overall
performance level. Exhibit 5 identifies the key components of the firm’s profit structure. Decisions made
by category managers can impact many of the key cost drivers noted.
The merchandising process
CMs go through a Product Line Review process annually where they present their categories to senior
leadership. The Line Review presents the history of the category, SKUs and vendors included, success in
the past year and objectives going forward. In addition to covering metrics on item performance that
43 Interviews
55
include sales, margins, productivity, pricing, and scoring relative to competitors, the Loss Prevention (LP)
team contributes to the review with shrink history overview for the specific category. This overview
includes shrink percentage, top‐5 shrink SKUs for the category, as well as key drivers of shrink. The
results are however not tracked for patterns across time and categories and LP can often struggle with
communicating the importance of the shrink metric to their buying fellows. Given the high number of
SKUs that each CM is responsible for (ranging from 189 to 50,420), there is often limited time available
to devote to issues related to stocking and shrink, but instead their incentive is to drive sales for their
specific categories. This has been a shift from CMs having earlier spent time in distribution centers and
in the stores, thus gaining a better understanding for product flow throughout the supply chain.
Final decisions on product execution are taken by a senior leadership team consisting of Vice Presidents
from Merchandising, Marketing and Store Operations. In addition to the annual review, the CMs also
prepare a weekly report for the category director on category performance. Once the Line Review is
complete, the merchandising team sends their details to the planogram group that in turns plans the
stocking for individual stores and the hubs. This initially involves determining which items to manually
hold in the backroom for the purpose of preventing shrink. Holding items in the backroom or manager’s
office can create significant space issues in AZ’s regular stores. Note that all items, regardless of location,
are automatically replenished based on point of sales data and the pre‐established replenishment rules
(e.g., min and max thresholds).
Product availability
Loss prevention at AutoZone
The Loss Prevention team overseen by an AZ Vice President consists of four primary areas: LP Field Ops
and Process Improvement, Security Services, Safety, and Supply Chain LP (Exhibit 6). In our focal area,
the LP Field Ops and Process Improvement group, there are approximately 69 team members reporting
either directly or indirectly to the Director of LP Field Ops and Process Improvement. Each of these team
members has a different role within the organization ranging from driving shrink analytics, managing
improvement projects (e.g., packaging, placement and processes), overseeing field investigation teams,
etc. Some of the group is organized around the stores and mirror the divisional and regional store
structure whereas others reside in corporate. The annual budget of the entire Loss Prevention group
amounts to $12.5 million and is used to support staff, shrink analysis, and safety solutions. LP serves as
an advisory unit, consulting CMs and store managers on issues pertaining to shrink, product packaging
and display solutions. Having presence in the stores through the Regional Loss Prevention Managers, LP
manages to be present in the communication between CMs and store managers. On the one hand, they
see the specific conditions in individual stores that allow them to develop solutions specific to the local
environment. On the other hand, they are one step closer in the communication with vendors and are
looking for best solutions in terms of product display and packaging. In addition, LP provides the buyers
and other AZ staff with an online learning module to be taken by new CMs and assistant CMs as a way to
56
educate them on their role in loss prevention and profit protection. The module is however taken
sporadically, less frequently so by seasoned employees, and is not part of a formal training program.44
Inventory management
AZ records their inventory at the lower of cost or market, and using the last‐in, first‐out (LIFO) method
for domestic inventory and the first‐in, first out (FIFO) method merchandise in Mexico. If AZ ends up
with excess inventory, these are returned to vendors for credit. In the occasional instances where less
than full credit will be received for such returns and where AZ anticipates that items will be sold at retail
prices that are less than recorded costs, they record a charge (less than $20 million in each of the last
three years) through cost of sales for the difference and may discard the merchandise at the store or DC
level versus returning it to the vendor. These charges are based on management’s judgment, including
estimates and assumptions regarding marketability of products and the market value of inventory to be
sold in future periods.
AZ acts selectively in their availability at the store‐level, as assortment is tailored by limiting certain high‐
shrink products in stores that are considered higher risk of theft. The at times limited selection is
counterbalanced by the technology and omnichannel strategy available to the customer. In‐store
inventory is managed through AZ’s proprietary catalog, Z‐net, that enables staff to serve their customers
efficiently through access to product information, and availability at the store, nearby stores, hubs, as
well as online. The Z‐net display screens are placed on the hard parts counter or pods, where both the
AutoZoner and customer can view the screen. The stores also use AZ’s Store Management System
(SMS), which includes bar code scanning and point‐of‐sale data collection terminals. The SMS provides
administrative assistance and improved personnel scheduling at the store level, as well as enhanced
merchandising information and improved inventory control.45
Cycle counting at the store‐level
AZ performs a physical inventory every 18 months in the stores and every 6 months in the hubs. In
addition, AZ also makes cycle counts of their stores and DCs throughout the year, on a weekly basis. The
counts are executed by internal staff and the categories to be counted are determined based on how
many items are included in a category. They make assumptions regarding upcoming physical inventory
counts that may differ from actual results. This has replaced the earlier process of “forced item counts,”
where the system would generate a list of items to count – some items being miscellaneous and some
having higher turns or shrink. This system was considered to be inefficient, as items could be disbursed
across the store, with high labor expense as a result, but it did give store management, buyers, and
replenishment staff a good sense of true on‐hand inventory.46
44 Interviews 45 AutoZone Annual Report 2012 46 Interviews
57
A corrective method to shrink
One common way in which AZ faces inventory losses is through shrink, which they see arising through
external and internal theft, loss, and inaccurate records for receipt of goods. Non‐theft related shrink is
mainly attributed to losses in commodities and oil products, with common causes being related to SKU
recycling and set‐up in wrong package sizes.47 Shrink is estimated as a projected dollar value and is
based on historical losses and current inventory loss trends resulting from previous physical inventories.
Over the last several years, there has been a 50 basis point reduction in their shrink rate. Moreover,
accrued shrink is evaluated each quarter in light of actual shrink results, and in the case that actual
inventory counts differ from the estimates, material adjustments are made to their financial statements.
As an illustrative example, a 10 percent difference in AZ’s inventory reserves in fiscal year 2012 would
have affected net income by $7 million.48
Shrink has been maintained at below 1.5 percent annually. AZ uses a Cluster Model in their
merchandising process that groups stores by different characteristics that are expected to impact risk
level of the specific store. The six categories are: “High Risk,” “Urban Theft,” “Chain Average,”
“Rural/Suburban,” “Small Town,” and “Puerto Rico.” Depending on where in these categories a specific
store falls, it may not receive products considered to be high‐risk. The Cluster Model, which is based on
demographic data, is a relatively manual system that is filled out by buyers and vendors by answering a
list of questions related to their specific product category and SKUs, leaving significant room for error in
the process.49
The Loss Prevention team introduced a Predictive Model (PM) that maps stores “red” “yellow” and
“green” categories, and looks at Current predictive shrink, Previous predictive shrink, Basis points
variance (current vs. previous), and Actual shrink. The PM is based on an annual regression of two
repeat variables identified as best predictors of shrink: Item Adjustments (+/‐ adjustments to the
inventory) and Uncredited PCIs (returns not credited by the DC). These two variables are used to predict
shrink dollars, and then together with sales to predict shrink %. The PM includes a two‐step process:
First, the correlation coefficient for the two predictors is calculated for the most recent stores. As a
second step, and using the coefficients, shrink dollars are predicted for the whole chain. It is then
divided by store level sales to predict shrink. The monthly aggregated results are shared with Regional
LP Managers, with key insights being reflected LP team’s Dashboard, and results being posted in the
stores.
LP makes continuous efforts to have impact on minimizing shrink not only through development of their
Cluster and Predictive models, but also by applying the results of model findings – in terms of high shrink
products and stores. The LP team provides new and safer packaging solutions, such as spider and blister
wraps. See Exhibit 7 for examples of packaging solutions introduced by LP. Solutions will be tested in
47 Interviews 48 AutoZone Annual Report 2012 49 Interviews
58
selected stores, based on previous loss levels. Ultimately, the ability of LP to introduce change in
product execution will depend on their relationship with individual buyers in the organization and the
ability to provide factual data on what programs work for the stores.
Key lessons learned from AutoZone
In sum, retailers gain much to learn from AZ’s approach to operational execution and product
availability. First, the company has an integrated merchandising and replenishment structure, which
allows the collaborative team to catch problems early, and optimize lead times and volumes. Second,
the data‐driven approach in measuring availability through the use of a predictive model provides AZ an
opportunity to move from a corrective to a mitigating approach to solving issues of product availability
and shrink. This data driven approach is complemented by careful tracking of performance over time
that is shared in easily accessible formats (Exhibit 8). Third, the progress made by the LP team in the
integration into Merchandising has helped in getting in front of recurring high shrink categories.
Examples of this include providing shrink information for all category line reviews, input on new items,
and incorporation of a shrink included EVA model (known internally as category contribution) gives
added visibility to shrink although it is still somewhat diluted. Finally, if applied in the form of a
structured and regular training tool, LP’s training module that is currently available internally for
merchandising (Exhibit 9), could serve as a solid opportunity for the LP team to educate buyers on the
importance of shrink to their sales and margins.
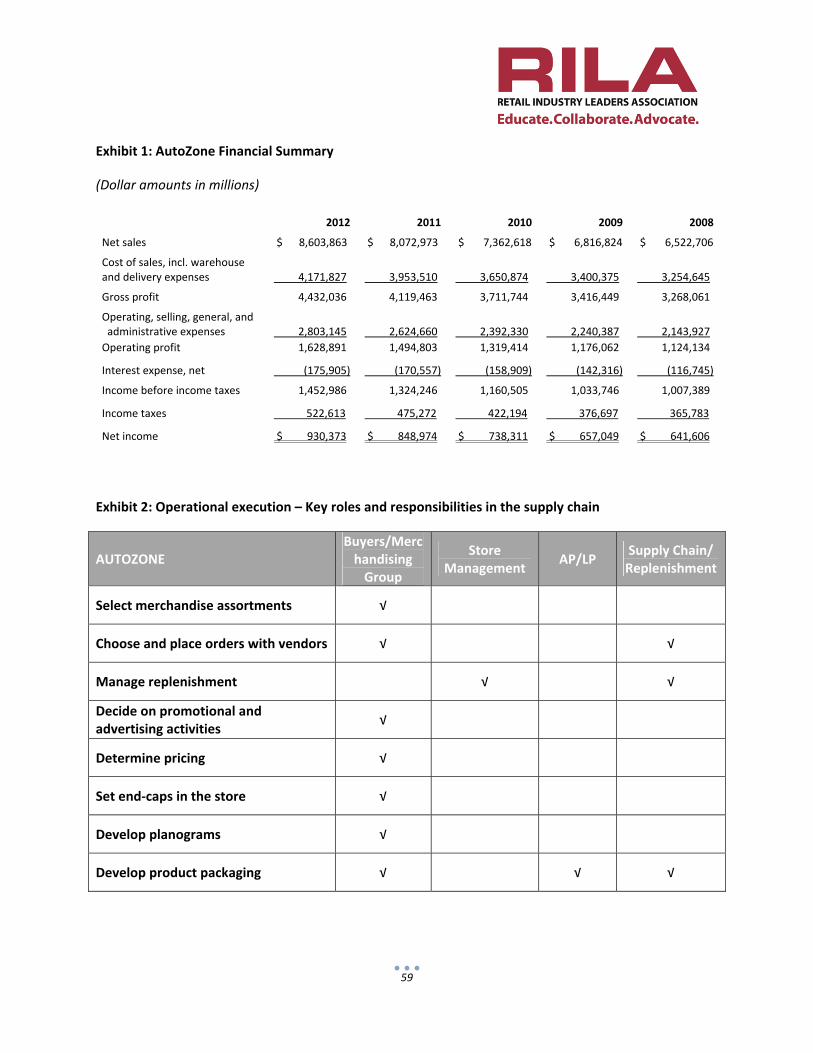
59
Exhibit 1: AutoZone Financial Summary
(Dollar amounts in millions)
2012 2011 2010 2009 2008
Net sales $ 8,603,863 $ 8,072,973 $ 7,362,618 $ 6,816,824 $ 6,522,706
Cost of sales, incl. warehouse and delivery expenses 4,171,827 3,953,510 3,650,874 3,400,375 3,254,645
Gross profit 4,432,036 4,119,463 3,711,744 3,416,449 3,268,061
Operating, selling, general, and administrative expenses 2,803,145 2,624,660 2,392,330 2,240,387 2,143,927
Operating profit 1,628,891 1,494,803 1,319,414 1,176,062 1,124,134
Interest expense, net (175,905) (170,557) (158,909) (142,316) (116,745)
Income before income taxes 1,452,986 1,324,246 1,160,505 1,033,746 1,007,389
Income taxes 522,613 475,272 422,194 376,697 365,783
Net income $ 930,373 $ 848,974 $ 738,311 $ 657,049 $ 641,606
Exhibit 2: Operational execution – Key roles and responsibilities in the supply chain
AUTOZONE Buyers/Merchandising Group
Store Management
AP/LP Supply Chain/ Replenishment
Select merchandise assortments √
Choose and place orders with vendors √ √
Manage replenishment √ √
Decide on promotional and advertising activities
√
Determine pricing √
Set end‐caps in the store √
Develop planograms √
Develop product packaging √ √ √
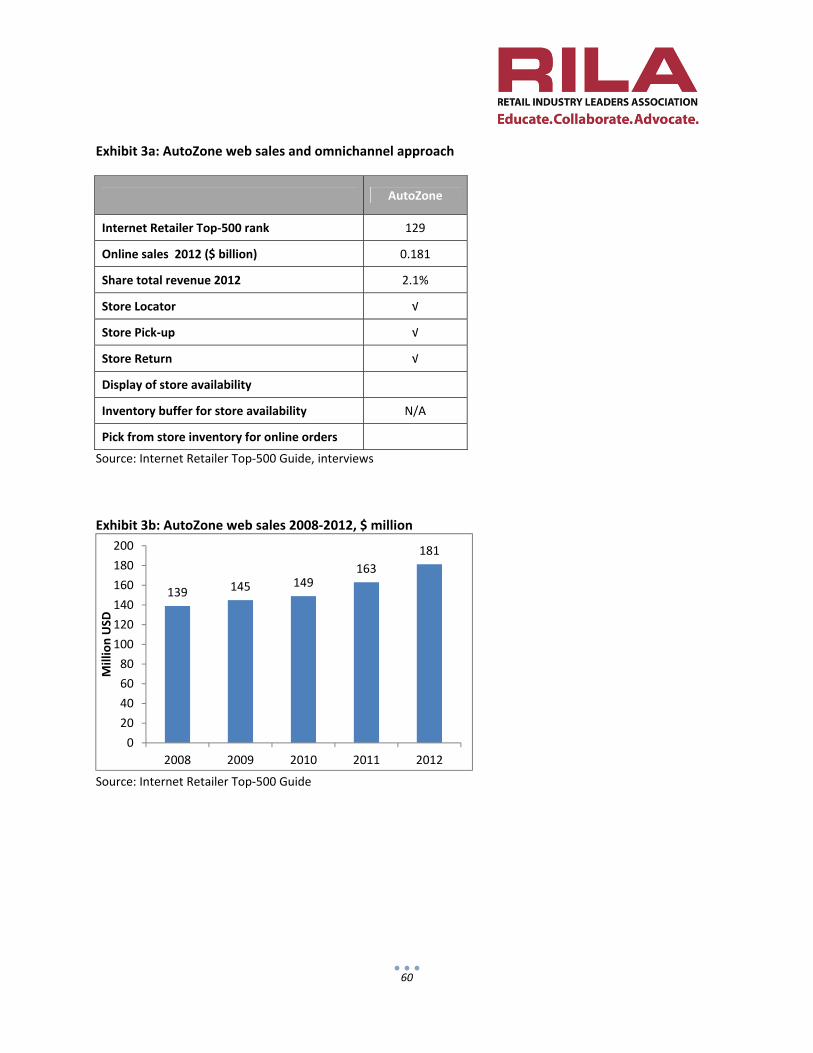
60
Exhibit 3a: AutoZone web sales and omnichannel approach
AutoZone
Internet Retailer Top‐500 rank 129
Online sales 2012 ($ billion) 0.181
Share total revenue 2012 2.1%
Store Locator √
Store Pick‐up √
Store Return √
Display of store availability
Inventory buffer for store availability N/A
Pick from store inventory for online orders
Source: Internet Retailer Top‐500 Guide, interviews
Exhibit 3b: AutoZone web sales 2008‐2012, $ million
Source: Internet Retailer Top‐500 Guide
139 145 149163
181
0
20
40
60
80
100
120
140
160
180
200
2008 2009 2010 2011 2012
Million USD
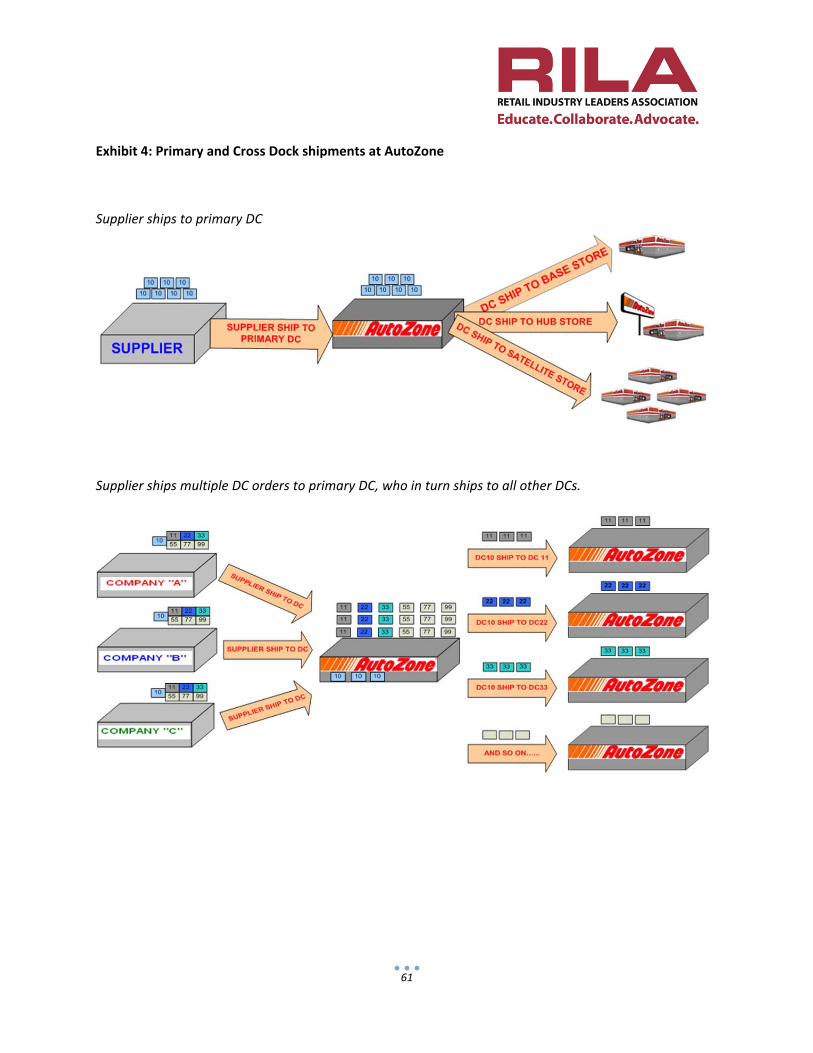
61
Exhibit 4: Primary and Cross Dock shipments at AutoZone
Supplier ships to primary DC
Supplier ships multiple DC orders to primary DC, who in turn ships to all other DCs.
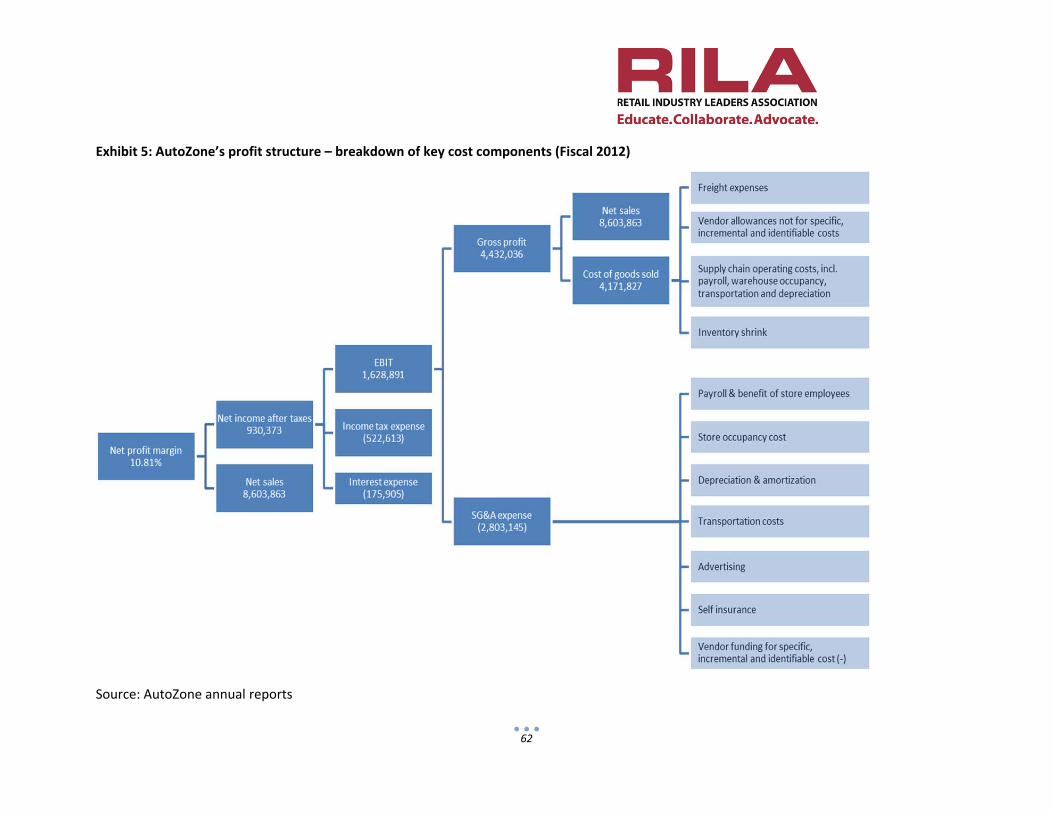
62
Exhibit 5: AutoZone’s profit structure – breakdown of key cost components (Fiscal 2012)
Source: AutoZone annual reports
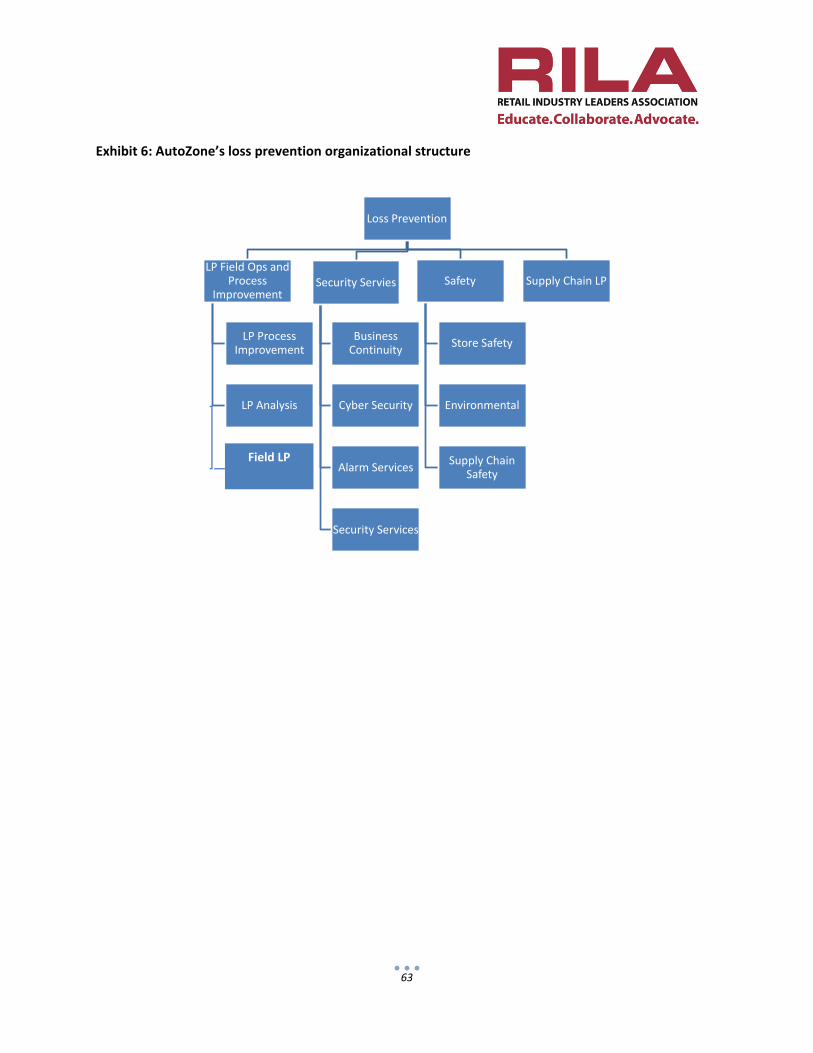
63
Exhibit 6: AutoZone’s loss prevention organizational structure
Loss Prevention
LP Field Ops and Process
Improvement
LP Process Improvement
LP Analysis
Security Servies
Business Continuity
Cyber Security
Alarm Services
Security Services
Safety
Store Safety
Environmental
Supply Chain Safety
Supply Chain LP
Field LP
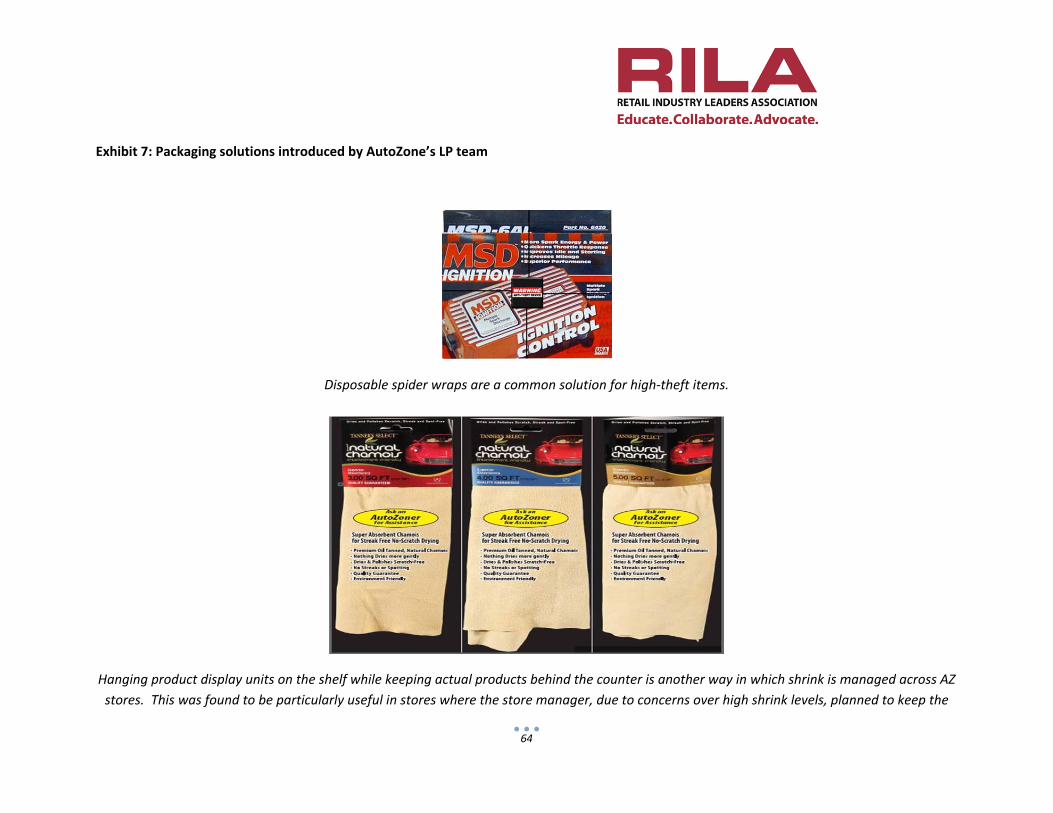
64
Exhibit 7: Packaging solutions introduced by AutoZone’s LP team
Disposable spider wraps are a common solution for high‐theft items.
Hanging product display units on the shelf while keeping actual products behind the counter is another way in which shrink is managed across AZ
stores. This was found to be particularly useful in stores where the store manager, due to concerns over high shrink levels, planned to keep the
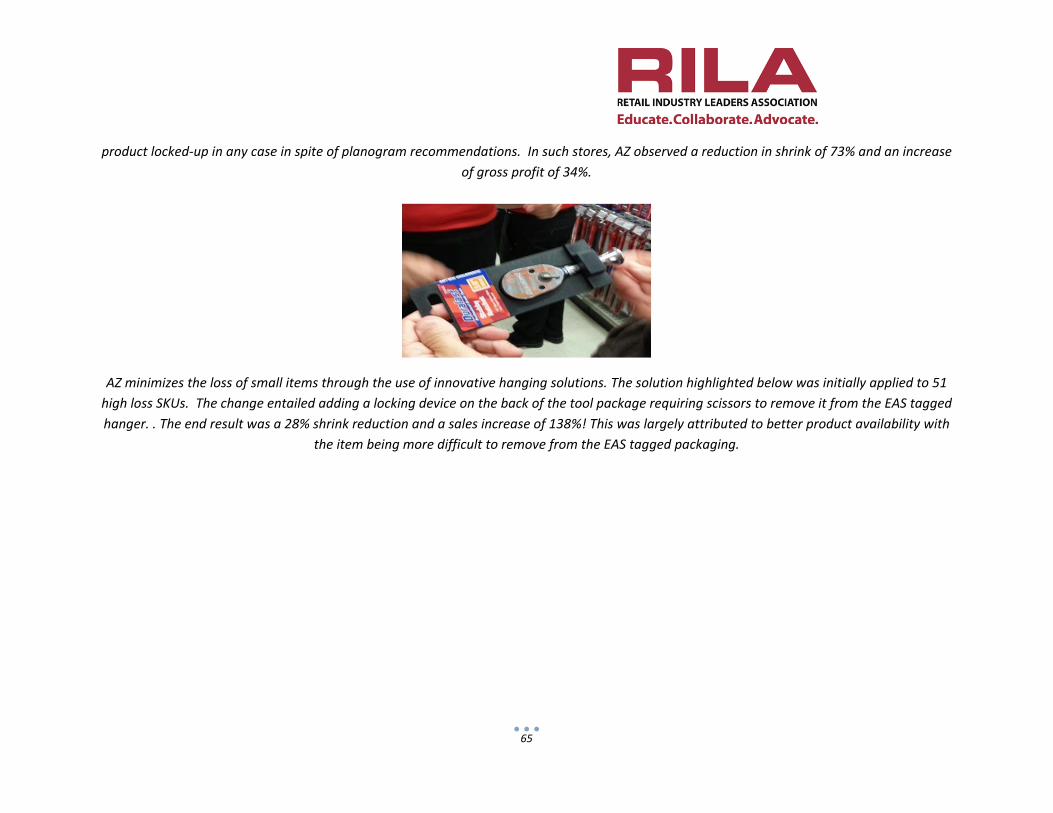
65
product locked‐up in any case in spite of planogram recommendations. In such stores, AZ observed a reduction in shrink of 73% and an increase
of gross profit of 34%.
AZ minimizes the loss of small items through the use of innovative hanging solutions. The solution highlighted below was initially applied to 51
high loss SKUs. The change entailed adding a locking device on the back of the tool package requiring scissors to remove it from the EAS tagged
hanger. . The end result was a 28% shrink reduction and a sales increase of 138%! This was largely attributed to better product availability with
the item being more difficult to remove from the EAS tagged packaging.
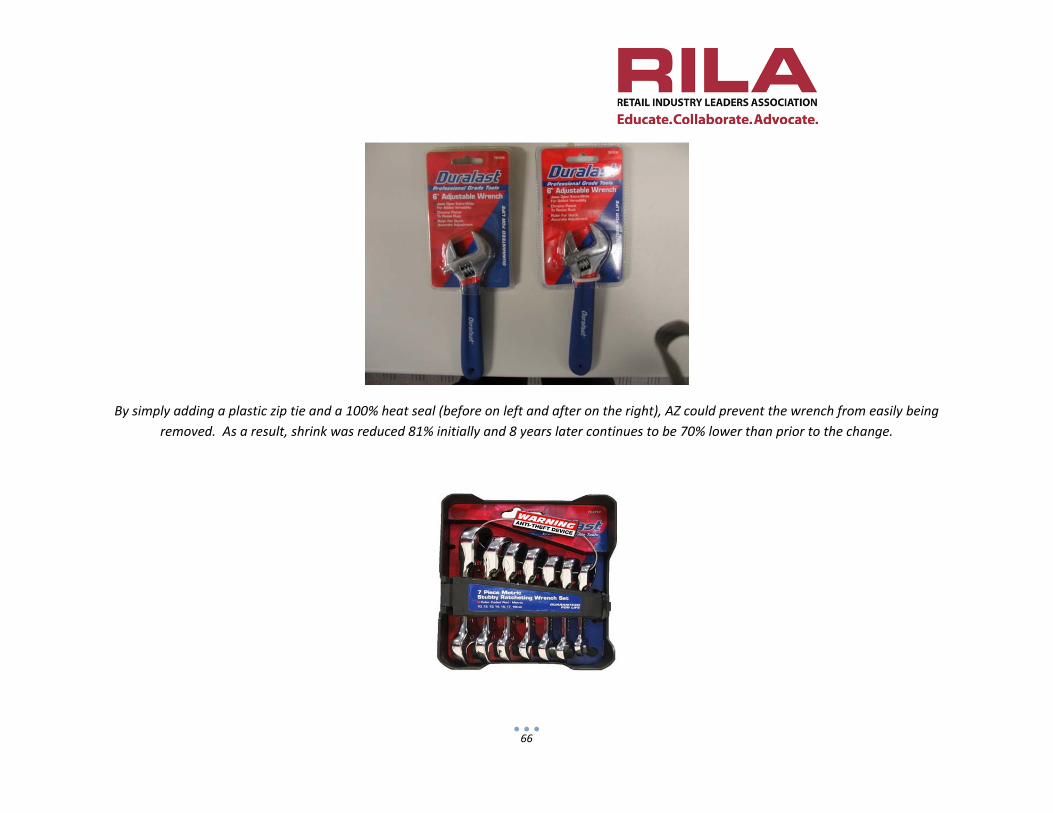
66
By simply adding a plastic zip tie and a 100% heat seal (before on left and after on the right), AZ could prevent the wrench from easily being
removed. As a result, shrink was reduced 81% initially and 8 years later continues to be 70% lower than prior to the change.
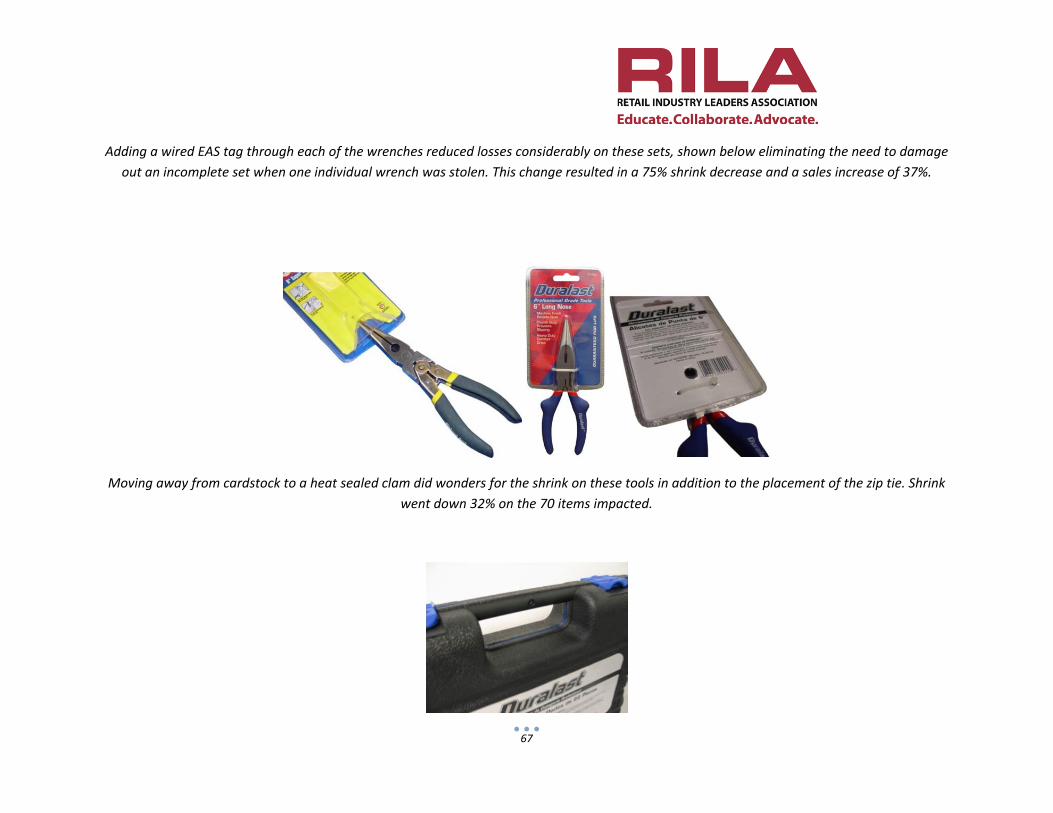
67
Adding a wired EAS tag through each of the wrenches reduced losses considerably on these sets, shown below eliminating the need to damage
out an incomplete set when one individual wrench was stolen. This change resulted in a 75% shrink decrease and a sales increase of 37%.
Moving away from cardstock to a heat sealed clam did wonders for the shrink on these tools in addition to the placement of the zip tie. Shrink
went down 32% on the 70 items impacted.
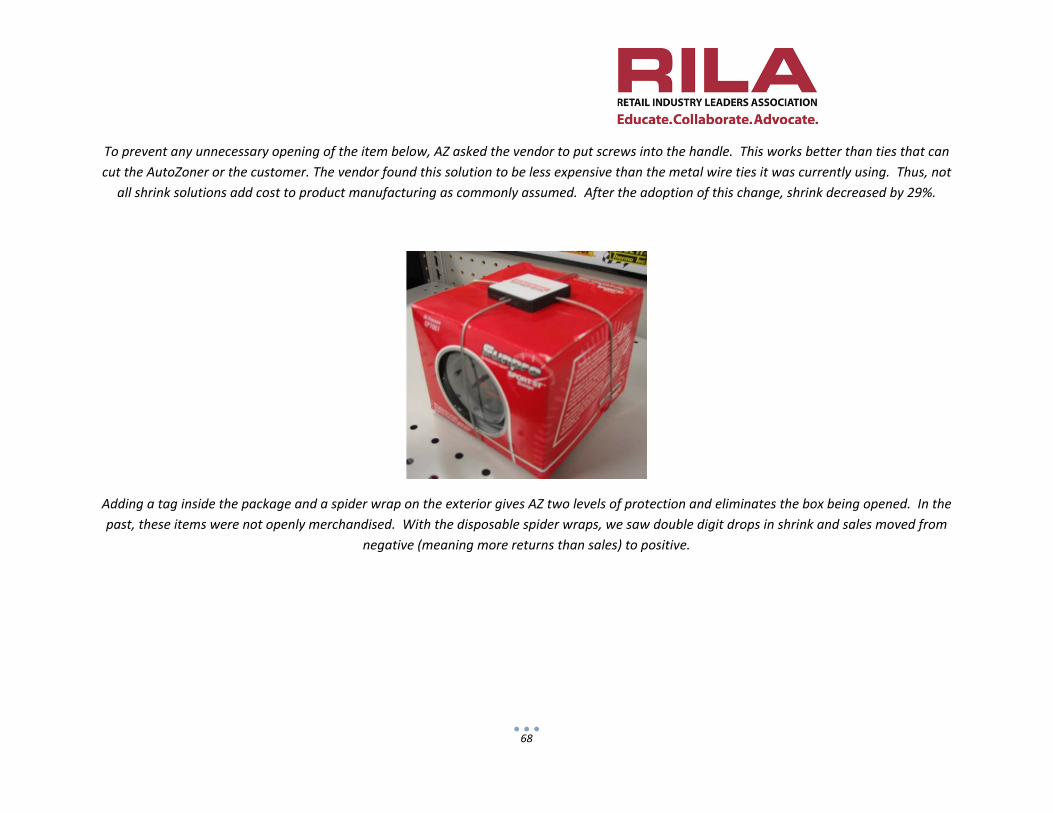
68
To prevent any unnecessary opening of the item below, AZ asked the vendor to put screws into the handle. This works better than ties that can
cut the AutoZoner or the customer. The vendor found this solution to be less expensive than the metal wire ties it was currently using. Thus, not
all shrink solutions add cost to product manufacturing as commonly assumed. After the adoption of this change, shrink decreased by 29%.
Adding a tag inside the package and a spider wrap on the exterior gives AZ two levels of protection and eliminates the box being opened. In the
past, these items were not openly merchandised. With the disposable spider wraps, we saw double digit drops in shrink and sales moved from
negative (meaning more returns than sales) to positive.
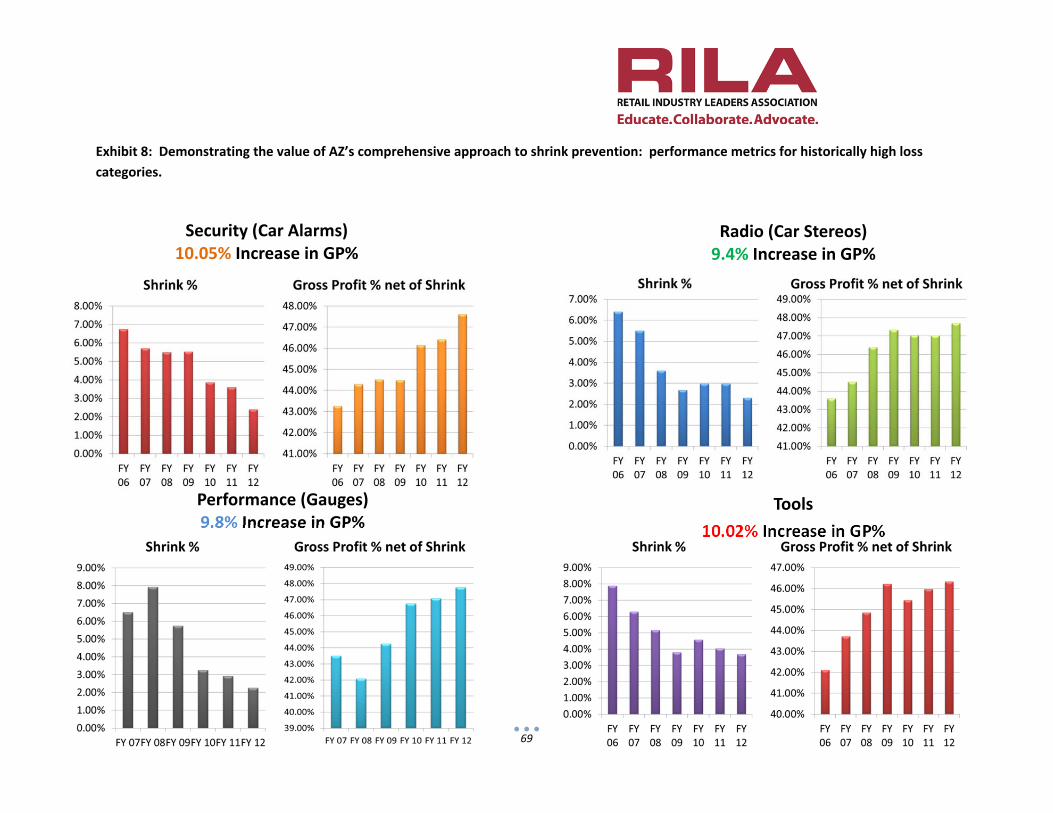
69
Exhibit 8: Demonstrating the value of AZ’s comprehensive approach to shrink prevention: performance metrics for historically high loss
categories.
Security (Car Alarms) 10.05% Increase in GP%
Radio (Car Stereos) 9.4% Increase in GP%
Performance (Gauges) 9.8% Increase in GP%
Tools
10.02% Increase in GP%
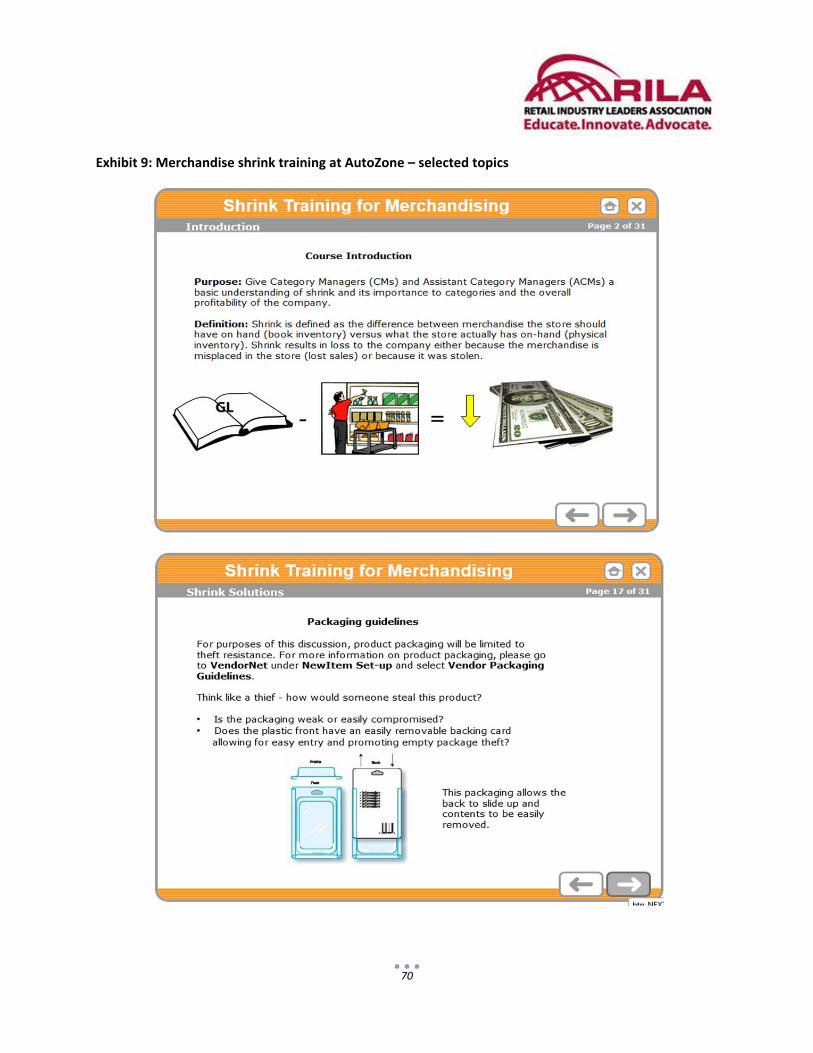
70
Exhibit 9: Merchandise shrink training at AutoZone – selected topics
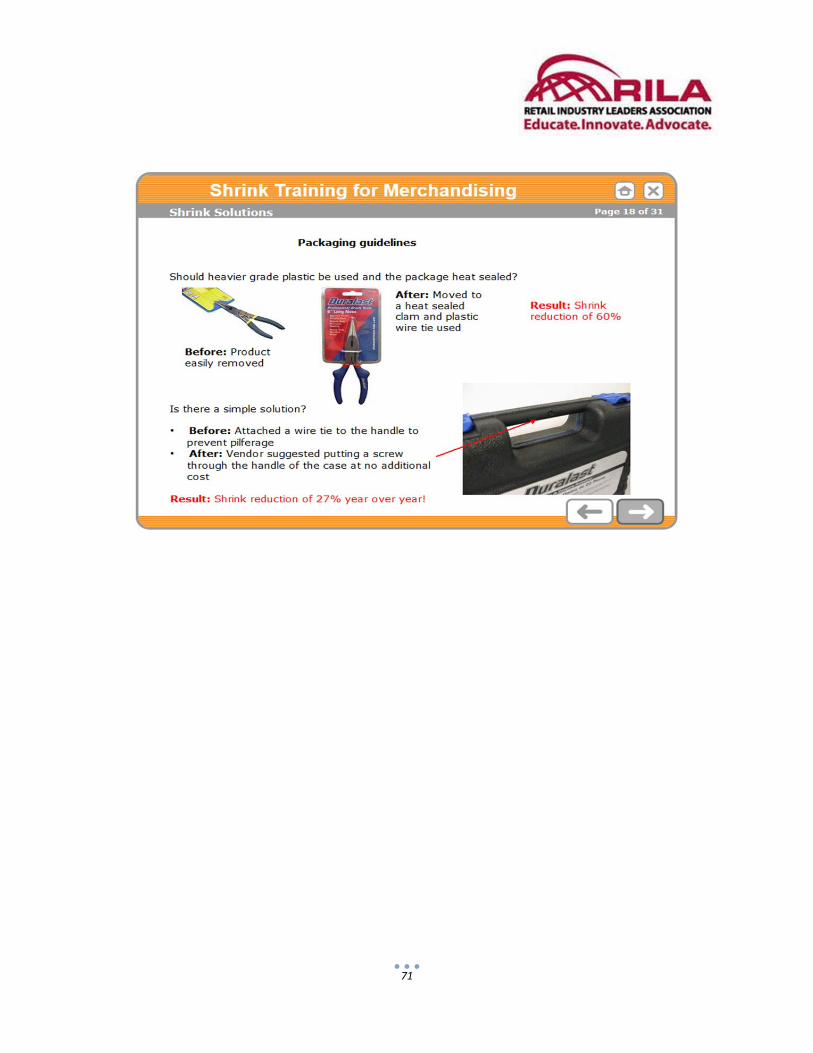
71
72
Appendix5:BestBuyCaseStudy
CompanyBackgroundandOrganizationFounded and headquartered in Richfield, Minnesota, Best Buy is a multinational specialty retailer in the
consumer electronics business. Their offerings are divided in six categories: consumer electronics,
computing and mobile phones, entertainment, appliances, services, and other. The company employs
165,000 employees, with operations in North America, Europe, and Asia. The company’s activities are
organized in two geographic segments: domestic and international, with the domestic segment
comprising all U.S. stores, call centers, Geek Squad, Magnolia, Pacific Sales, as well the expanding sales
in Best Buy Mobile and e‐Commerce activities. With an 18 percent market share in consumer electronics
in fiscal 2012, Best Buy remains a key player in the industry.50 In fiscal year ended March 3, 2012 the
company recorded revenues of $50.71 billion, a 1.9 percent increase from the year prior. For fiscal 2013
(11 months due to a transition period) Best Buy’s comparable store sales saw a decline of 2.8 percent
from the 2012 (11 month), mainly due to decrease in gaming, computers, television, digital imaging
sales.51 Worth noting is that quarterly net profits for the second quarter in fiscal 2014 reached $266
million, up from $12 million a year earlier and the $81 million net loss in the first quarter of fiscal 2014.52
See Exhibit 1 for an overview of Best Buy’s financials.
In 2012, Best Buy announced a new ‘Renew Blue’ strategy that focuses on five pillars: (i) Reinvigorate
and rejuvenate the customer experience; (ii) Attract and inspire leaders and employees; (iii) Work with
vendor partners to innovate and drive value; (iv) Increase the company’s return on invested capital for
shareholders; and (v) Continue leadership role in recycling and other initiatives. Based on this strategy,
key priorities for fiscal 2014 include accelerating online growth; enhancing the multi‐channel customer
experience; increasing revenue and gross profit per square foot through enhanced store space
optimization and merchandising; driving down cost of goods sold through supply chain efficiencies;
continuing to gradually optimize the U.S. real estate portfolio; and reducing selling, general and
administrative (SG&A) costs. The Renew Blue initiative includes improvement objectives for key
indicators related to product availability such as in‐stock performance, consolidation of multi‐unit
orders, and net‐promoter score (that measures online customer satisfaction and conversion to actual
buys).53 A recent move towards opening smaller Best Buy Mobile stores that specialize in mobile phones
and consumer electronics may have positive implications for product availability and inventory accuracy,
as stores start dealing with smaller volumes and more limited back‐stock inventory.
50 Renew Blue: Best Buy Analyst and Investor Days, November 13, 2012. Accessed on bestbuy.com on Aug 20, 2013 51 Best Buy Annual Report 2013, for the transition period from 3.4.2012‐2.2.2013 (henceforth referred to as ‘Best Buy 2013 10KT’) 52 Best Buy Press Release, August 20, 2013 53 Interviews
73
In 2012 Best Buy reorganized several of its retail groups – ranging from computers to tablets, cellphones
and associated service plans – under one umbrella, the so called Connectivity Business Group (CBG).
CBG encompasses about 35,000 employees from both Best Buy Mobile and regular Best Buy retail
stores. CBG’s objective is to boost revenues of hardware such as laptops or tablets through closer
connection to the high‐growth mobile segment.54 Hence, previously isolated business functions are now
better connected through the CBG and its various group representatives in retail, operations, and asset
protection, which allows for better communication and streamlining of performance objectives.55
CompetitionThe consumer electronics business is becoming increasingly competitive, with options available to
customers in specialty retail, such as Best Buy, traditional department stores, direct vendor sales, and
increasingly so online retailers. Best Buy’s key competitors include Amazon, eBay, Walmart, Target, and
Apple, among others. The low‐cost model of certain competitors, in particular the ones focusing
exclusively on internet retailing can pose a particularly strong threat to Best Buy. The strong competition
has direct impact on its sales and margins, in particular as price is a key determinant for their customers.
In an attempt to stem “show rooming,” where visitors examine the product in store and then order
online from other retailers, Best Buy has implemented pilots on price‐matching policies in the U.S. These
pilots have in turn been enhanced in 2013 by honoring customer’s request to match prices offered by
certain retail stores and online operators.
Finally, as Best Buy moves into specialized mobile device retailing through its smaller Best Buy Mobile
stores, they can expect to face new competition from rivals such as AT&T, T‐Mobile, and Verizon. In
order to retain a strong competitive advantage and as a way to mitigate competitive pressures and
differentiate itself, Best Buy plays strongly on being a highly customer centric retailer. This is reflected in
the presence and continued training of knowledgeable in‐store staff, as well as the continued efforts to
create a seamless and integrated multichannel experience for their customers.56
E‐Commerce,andomnichannelstrategyAlthough Best Buy is a major player in brick‐and‐mortar sales, they have been slower in responding to
the online retailing trend, holding a 7 percent share of the $30 billion online retail market in consumer
electronics in fiscal 2012 (compared to a 21 percent share for the main competitor Amazon).57 The
company has made a conscious effort to embrace an omnichannel approach as a key priority to ensuring
not only market share in the growing online space, but presenting a unified customer experience. This
54 Forbes.com, January 12, 2012 55 Interviews 56 Best Buy 2013 10KT 57 Market segments include: mobile phones, tablets, eReaders, appliances, physical music/movies, gaming, notebooks/desktops, home theater, and digital imaging. Source: Renew Blue Best Buy Analyst and Investor Days, November 13, 2012. Accessed on bestbuy.com on Aug 20, 2013
74
has been reflected in growing web sales which in 2012 reached $3.35 billion, comprising approximately
seven percent of net sales.58 Moreover, online sales in the second quarter of fiscal 2014 increased by
10.5 percent relative to the year prior and are mainly attributed to increased online traffic and higher
average order value.59
Working towards the goal of accelerating online growth, Best Buy plans to implement a new search
platform that helps customers find products more easily with increased relevance, as well as adding
more depth to their product assortment. In addition to the existing bestbuy.com site, the e‐commerce
channel is also complemented by a mobile website and mobile applications that have an integrated
browsing experience with the website. The company also has an online marketplace where Best Buy
allows trusted vendors to sell their products directly to Best Buy customers. Additionally, Best Buy has
taken away inventory buffers when displaying in‐store availability on their website. These are all ways
that leadership has embraced in making sure to move inventory faster through the supply chain.
Recognizing the implicates of an omnichannel approach to inventory accuracy and availability issues,
Best Buy is conducting tests of employees’ online activity. This has not only helped bring issues of out‐
of‐stock to the forefront, but has also helped understanding the validity and efficiency of the company’s
current tracking mechanisms. For instance, the company has started using tracking online usage data
through the newly minted ‘Net Promoter Score,’ that looks at not only the satisfaction of customers who
shop at Best Buy, but also of the ones who do not. When looking at the NPS, the digital team can see
that the main reasons potential customers who go online do not end up buying products are: (i) Need
more product information; (ii) product was unavailable; (iii) price was too high; (iv) need to see product
in person; (v) was not available for store pickup; or (vi) shipping will take too long.60
Products are today sourced through numerous channels, including buy online, ship from fulfillment
center; buy online, pick up in store; and buy online, pick and ship from store inventory. Online sales in
the U.S. are generally either picked up at U.S. stores or fulfilled directly to customers from one of the 23
distribution centers. Shipping from store was introduced in 50 selected stores in the U.S. 18 months ago,
and is currently in the process of being evaluated. One challenge facing the supply chain and store
teams related to inventor accuracy is to pick the item and process it in the system fast enough once the
customer has reserved it online. Leadership at Best Buy is recognizing that if the company manages to
source efficiently in a multichannel environment, they will be able to increase reliability and retain
higher shares of potential customers. Looking ahead, Best Buy remains focused on customer satisfaction
through better in‐stock performance across channels; improved price perception; higher personalization
58 Internet Retailer Top 500 2013 59 Best Buy Press Release, August 20, 2013 60 Renew Blue: Best Buy Analyst and Investor Days, November 13, 2012. Accessed on bestbuy.com on Aug 20, 2013
75
in online offers; and reallocation of store labor to customer‐facing activities.61 See Exhibit 2 for Best
Buy’s current omnichannel approach.
Mappingtheprocessflow:BestBuy’ssupplychain
VendorrelationshipsItems sold through Best Buy’s numerous channels are sourced from domestic and international vendors,
and include both private label and national brands. A majority of products come from a limited number
of dominant players. In 2012, the 20 largest suppliers accounted for nearly 70 percent of purchased
inventory, with Apple, HP, LG, Samsung, and Sony representing 45 percent of total merchandise.62 There
are usually no contracts with suppliers binding them to continued supply. This present a certain risk
level to Best Buy in cases where vendors do not deliver on time or do not fulfill the agreed upon volume.
Although vendors are not penalized for discrepancies in inventory delivered, they are held accountable
through vendor dashboards (or scorecards) that are developed in collaboration between the merchants
and the vendor. These are discussed in regular merchant and vendor meetings, where metrics covered
include performance sales inventory, in‐stock rates, inventory turn, cash flow, and shrink, among
others.63 More generally speaking, Best Buy’s status as a major retailer in consumer electronics puts the
company in a good position to maintain solid vendor relationships, and negotiate on prices and
exclusives. For instance, buyers negotiate vendor funding for various programs, including markdowns,
margin protection, advertising and sales initiatives.64
DC‐to‐storeinventoryflowThe Best Buy distribution network for the U.S. market comprises of 23 locations in 17 states. Most goods
for the U.S. market are shipped directly from suppliers to one of the DCs or to the warehouses. To
ensure availability to customers, certain products are shipped from vendors directly to the stores, in
instances where release dates for new products are announced late. Merchandise is transported by
contract carriers from DCs and warehouses to stores, with some appliances products being transported
directly to customers. Although this ensures a positive customer experience by making the products
available to them faster, it can also lead to discrepancy and shrink issues, as each store receives
individual purchasing orders, instead of the traditional DC‐sourced POs.65
The company plans to further drive down cost of goods sold (COGS) and improve the customer
experience through increased efficiencies in the supply chain. This will be done by expanding online
fulfillment to all distribution centers and improve allocations of inventory. Multi‐unit customer orders
61 Best Buy 2013 10KT, Interviews 62 Best Buy 2013 10KT 63 Interviews 64 Best Buy 2013 10KT 65 Interviews
76
will be optimized into one shipment as often as possible, and shipped from optimal locations, given the
specific end‐delivery. The company also has a global sourcing operation to design, develop, test and
produce lines of private brands exclusive to Best Buy.66
Best Buy is a highly centralized organization, where the key decisions around product flow – all the way
down to the store level – are in corporate. Key roles in operational execution are held by merchandising,
planning, and forecasting teams, and with support coming from asset protection (AP), digital operations,
human resources, legal and finance departments, as needed. Store management at Best Buy has limited
responsibility in execution of products in the store, mainly holding an operational role. Based on the
Product Protection Standards provided by AP, store managers have some say in which security options
and materials to set up in their store, e.g. cameras and spider wraps. They can use predictive tools
provided by AP (details below) to understand product availability patterns in their stores by week and
category, and decide accordingly how to protect their items from shrink.67 See Exhibit 3 for overview of
responsibilities in execution.
FocusinginonthemerchantThe merchandising organization at Best Buy holds a key position in the company, with final responsibility
for assortment, sales forecasting, promotions, setting prices, signage, and managing the vendor
relationship, among others. It is a four‐tiered organization, with the Merchant and Senior Merchant
holding key roles in the team. These are supported by the Merchant Analyst (MA) for executional
matters and the Merchant Director for strategic decisions. The MA is a technical analyst and is
responsible for system entry of sales and forecasting data, promotional setup, price protection, price
changes, and signage. An MA stays in this role for an average two years before moving on to the
merchant role. The Merchant, in turn, is in charge of the day‐to‐day planning, including promotional and
pricing of a specific sub‐category. This role is generally vendor‐assigned, with merchants handling the
day‐to‐day vendor relationship. They are motivated by weekly and monthly sales and market share
results within their sub‐category. Senior Merchants take a more overarching category view of the
strategy, while keeping a six‐month perspective. Similarly, Merchant Directors keep a 6‐18 month
perspective on a certain category and work closely with the VP of Merchandising on implementing
corporate‐set strategies. At the beginning of each fiscal year, merchant teams review each category and
establish their respective budgets, and ensure that these are in line with key performance indicators
(KPIs) for each category. KPIs can include conversion rate, customer retention, service plans (in the case
of mobile phones), among others. Finally, there is a separate team under the merchandise operations
group that is responsible for SKU setup. This role was recently separated from the merchant role, and
centralized in the organization, as leadership started recognizing discrepancies in SKU attributes across
categories and the importance of taking a more overarching view.
66 Best Buy 2013 10KT 67 Interviews
77
The merchandise teams hold regular weekly and monthly meetings to review performance of each
category. Weekly performance meetings are held with multifunctional groups and led by the Merchant
Director. The meetings include representatives from groups that support buyer decisions, including
planning, digital, retail operations, services and after care, and finance, depending on category. Key
objectives are to review performance of the past week and what is planned for the following week. The
Merchant Director will then summarize outcomes and share with senior leadership. Similarly, Version
Meetings are held once per month, with a similar outline as the weekly performance meetings. Finally,
P&L meetings are merchant‐specific meetings where the team reviews key metrics relevant to category
performance, including SG&A, shrink, sub‐services, deferral, and logistics. Performance, Version and P&L
meetings are generally compartmentalized, vary greatly by working team, and take place across
numerous levels of the organization, depending on what is needed for that specific category.
Merchants’ annual performance review tracks their results based on: (i) gross profit, both for their
specific category as well as the company as a whole; (ii) a customer index score, which takes into
consideration customer satisfaction and their in‐store experience; and (iii) two goals that each merchant
sets with their supervisor. The bonus for Senior Merchants and Merchant Directors is based on gross
margin performance for the category, and on the operating gross margin for analyst‐level staff. Shrink is
another important metric for the Merchant Directors at Best Buy, as it directly impacts their P&L results
(see below for more details on shrink).68
TheroleofSupplyChainsWith a renewed focus of leadership on operational efficiency across the supply chain, it is also important
to consider the role the Supply Chains (SC) team is having in product availability. The SC group at Best
Buy – through the Demand Planning Forecaster, Demand Planning Analyst, and the Senior Demand
Planning Analyst – plays a key role in working with merchants and forecasters to plan inventory, meet
with vendors, and decide quantity in each warehouse and store. In this partnership, the demand
planning team is responsible for forecasting the number of SKUs to be placed in order as well planning
actual purchases (i.e. managing in‐stock levels, inventory, turns, and cash flow). Buyers on the other
hand focus on pricing, promotion, and assortment in the monthly category transitions. These two
groups have over time become more integrated, with a staggered organizational structure which allows
planners and merchants to work efficiently together and complement their respective capabilities.
Another key responsibility of the SC team is planning for upcoming resets in inventory, i.e. the process of
exiting older models of an item once new ones are introduced into assortment. In addition to inventory
planning, SC also manages a third party vendor for reverse logistics for returned items that are resold.
Although reverse logistics generates additional sales for the company, in particular in the lucrative
mobile segment, it also creates new problems related to inventory loss (or shrink). For instance, when
68 Interviews
78
customers trade in an old cell phone for a new one, problems in inventory accuracy can arise when
determining how to account for the return and resale of the phone.69
ProductavailabilityatBestBuy
InventorymanagementBest Buy values inventory at the lower of cost (using either the average cost or first‐in, first‐out method)
or market through the use of (a) markdown adjustments and (b) inventory loss adjustments. Markdown
adjustments reflect excess of cost over the amount expected to be derived from final sale or other
disposal of inventory, and establish a new cost basis. Markdown adjustments involve uncertainty
because the calculations require management to make assumptions and to apply judgment regarding
inventory aging, forecast consumer demand, the promotional environment and technological
obsolescence. Inventory loss adjustments reflect anticipated physical inventory losses (i.e. shrink coming
from process failures and theft) that have occurred since the last physical inventory. These shrink
adjustments involve uncertainty because use of management assumptions around historical results and
current shrink trends.
Also included in inventory costs are in‐bound freight‐related costs from vendors as well as certain
vendor allowances that are not a reimbursement of specific, incremental and identifiable costs to
promote a vendor's products. Other costs associated with acquiring, storing and transporting
merchandise inventories to the stores are expensed as incurred, and included in COGS calculation. See
Exhibit 4 for an overview of Best Buy’s cost structure. Best Buy monitors inventory levels to match
quantities on hand with actual consumer demand. Key elements to this inventory management process
include monitoring of historical and projected consumer demand; monitoring and adjustment of
inventory receipt levels; agreements with vendors around reimbursement for markdowns or sales
incentives and for certain product return privileges.70
TheroleofAssetProtectionThe Asset Protection (AP) team at Best Buy plays an important supporting role when it comes to
measuring shrink and product availability, and its impact on profits, and possible solutions. Although
shrink is not included in AP’s bonus structure (which instead covers net operating profit, set revenue
goals, and sales comps. Their work focuses on field investigation, infrastructure and technology, process
and training development, safety, and product returns. To what level AP engages with merchants in the
assortment planning process will to a large extent depend on their relationships with the individual
buyers. With eight team members in corporate and approximately 50 AP focused team members in the
field that oversee, big box and small box operations, as well as service centers, the team manages to
drive results in terms of shrink beyond the industry average. For instance, although Best Buy spending
69 Interviews 70 Best Buy 2013 10KT
79
on asset protection activities is 20 percent lower, they have on average shrink results that are 70
percent lower than the industry average. They do this by using business acumen and partner with other
groups in the organization, including merchandising, supply chain, and CBG, and driving employee
engagement to get better results.
Shrinkandinventorycountingpracticesatthestore‐levelPhysical inventory is done once per year at Best Buy, with half of inventory in the spring, and half in the
fall. The physical inventory counts, in combination with short term estimates, help set the shrink rate for
the following fiscal year, with very little regression used for the estimate. Shrink is measured in dollar
value as well as share of net sales, and is estimated based on difference in system inventory and the
actual on‐hand volume. Each product category is budgeted for shrink one year in advance, with
merchants getting credited in cases where they fall below this figure. Merchants have noticed a higher
shrink in “back‐end” categories, i.e. items that have additional services tied to them (e.g., cell phones
and mobile plans). When Best Buy sells a phone at a discounted price and the customer receives a plan
together with it, this makes the rate look worse, but the dollar amount remains the same, thus
negatively impacting the overall shrink rate. Based on the physical inventory shrink rate, average shrink
rate in Best Buy’s brick‐and‐mortar operations has averaged approximately 0.4 percent over the past
decade. Overall, AP has been seeing a reduction in the shrink rate, something that is attributed to
numerous factors, including locking up high‐risk items, bringing more labor to bear to the problem, re‐
educating store level staff, among others.
In addition to the physical inventory counts, cycle counting is executed in all Best Buy stores on a weekly
basis, and reconciled against current on‐hand levels. Counts are done by a dedicated staff member from
store operations who receives a pre‐set weekly stock count schedule. Individual categories will be
counted ranging from weekly up to every eight weeks, based on risk level. Focus is usually on high‐loss
and high turn items, with roughly 80 percent of counts being centrally driven based on actual physical
inventory trends, and 20 percent being locally driven based on market needs and what is identified in
individual locations. Based on the cycle counting results, the AP team calculates an anticipated shrink
rate and publishes for store and merchant availability on a weekly basis.
The anticipated shrink rates are summarized in a weekly Predictive Shrink Barometer which is prepared
at the department and sub‐category level. The Barometer is a predictor of shrink result and shows the
volume of inventory adjustments (i.e. corrections in inventory levels) since the last physical inventory
count. Results from the corrections are only made in the inventory system, and not in the financial
budget. The barometer results influence both target and accrual levels, as they will adjust targets and
expected results according to the inventory adjustments. This data can be broken down to category and
sub‐class levels, and AP can see which categories are the drivers of shrink on a week‐by‐week basis. It
allows them to see any alerts and anomalies relatively quickly and can address the issue with relevant
groups. Finally, as trend also can be important, the Barometer allows for tracking over 13‐week trends
80
across several metrics, including average shrink rate, cost of adjustments, and level of stock count
completion.71
SolutionstoshrinkpreventionBest Buy leadership does frequent tests in the store to track impact of packaging solutions that have
been developed. Here they take the point of view of merchants, demand planning, retail operations, AP
internally, as well as vendors as an external partner. For instance, AP has worked with buyers to present
gaming hardware in empty boxes on the shelves and keep the actual products in the backroom. Such
solutions are dependent on AP’s team having strong relationships with individual buyers who are
responsible for individual categories and have the direct contact with vendors. Other theft‐related loss
prevention solutions include sharing with vendors a set of co‐developed standards and rules to best
adjust the security to the Best Buy‐specific store environment (e.g. how a packaging solution gets
activated). Moreover, as industry‐wide standards become more common (e.g. for source tagging), Best
Buy can get the benefit with less internal effort and fewer resources. Finally, as Best Buy moves further
towards their stores‐within‐a‐store concept, solutions become more frequently developed in
collaboration with vendors. For instance, Samsung will provide store staff to be present in a Samsung‐
dedicated area. This ensures consistency in look, feel, messaging of the vendor on the one hand. But it
also ensures a higher level of quality interaction with the customers, which may have a positive
(reducing) impact on shrink levels.
KeylessonslearnedfromBestBuyThe retail industry gains to learn from the approach that Best Buy is taking to operational execution
through a focus on customer service, omnichannel development, and store presence. First, Best Buy’s
customer‐centric approach drives much of the other activities in the organization and impacts product
availability through a focus on the customer experience and making sure that items are readily available.
Second, this directly translates into a recent push to set Best Buy’s omnichannel strategy at the
forefront and holding all teams accountable to accurate inventory and flow of products through the
supply chain. The company’s Renew Blue strategy and inclusion of such key metrics as product
availability and net promoter score is another indicator of the company‐wide operational execution
efforts. Finally, the AP team is able to act more proactively to issues related to shrink and product
availability by having a smaller corporate staff and more field staff that are working closely with the
Connectivity Business Group, merchant representatives, planning teams, as well as operations staff.
71 Interviews
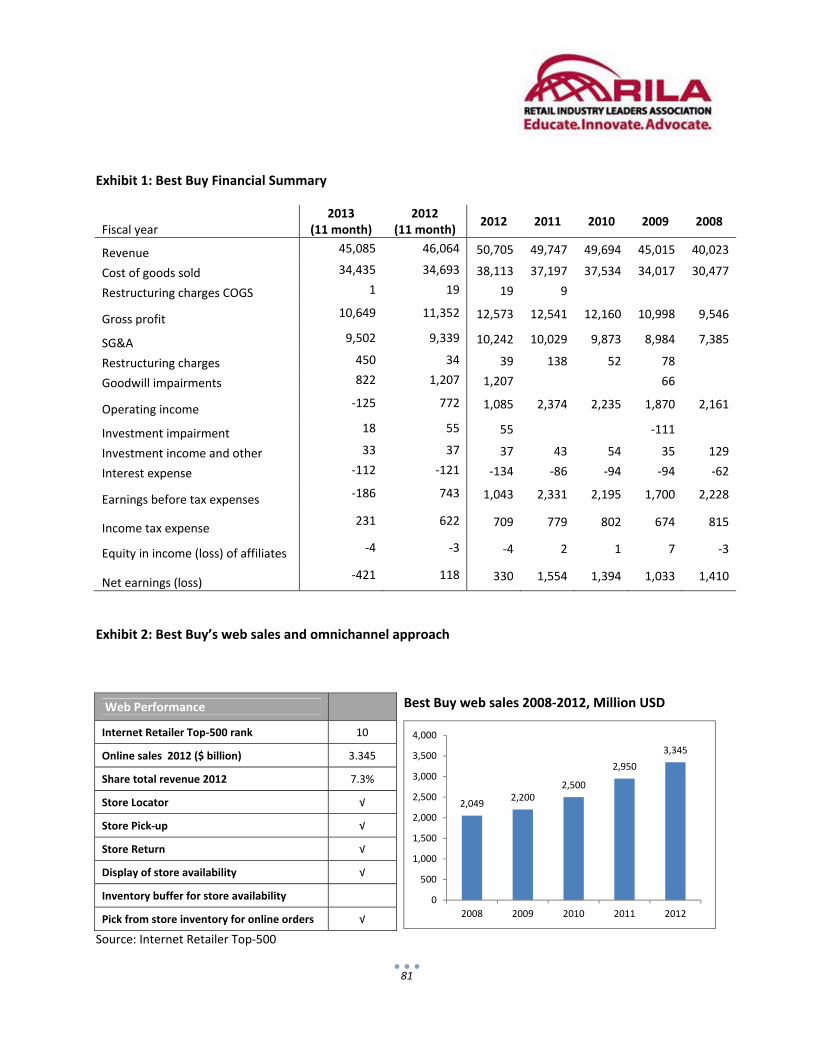
81
Exhibit 1: Best Buy Financial Summary
Fiscal year 2013
(11 month) 2012
(11 month) 2012 2011 2010 2009 2008
Revenue 45,085 46,064 50,705 49,747 49,694 45,015 40,023
Cost of goods sold 34,435 34,693 38,113 37,197 37,534 34,017 30,477
Restructuring charges COGS 1 19 19 9
Gross profit 10,649 11,352 12,573 12,541 12,160 10,998 9,546
SG&A 9,502 9,339 10,242 10,029 9,873 8,984 7,385
Restructuring charges 450 34 39 138 52 78
Goodwill impairments 822 1,207 1,207 66
Operating income ‐125 772 1,085 2,374 2,235 1,870 2,161
Investment impairment 18 55 55 ‐111
Investment income and other 33 37 37 43 54 35 129
Interest expense ‐112 ‐121 ‐134 ‐86 ‐94 ‐94 ‐62
Earnings before tax expenses ‐186 743 1,043 2,331 2,195 1,700 2,228
Income tax expense 231 622 709 779 802 674 815
Equity in income (loss) of affiliates ‐4 ‐3 ‐4 2 1 7 ‐3
Net earnings (loss) ‐421 118 330 1,554 1,394 1,033 1,410
Exhibit 2: Best Buy’s web sales and omnichannel approach
Web Performance Best Buy web sales 2008‐2012, Million USD
Internet Retailer Top‐500 rank 10
Online sales 2012 ($ billion) 3.345
Share total revenue 2012 7.3%
Store Locator √
Store Pick‐up √
Store Return √
Display of store availability √
Inventory buffer for store availability
Pick from store inventory for online orders √
Source: Internet Retailer Top‐500
2,0492,200
2,500
2,950
3,345
0
500
1,000
1,500
2,000
2,500
3,000
3,500
4,000
2008 2009 2010 2011 2012
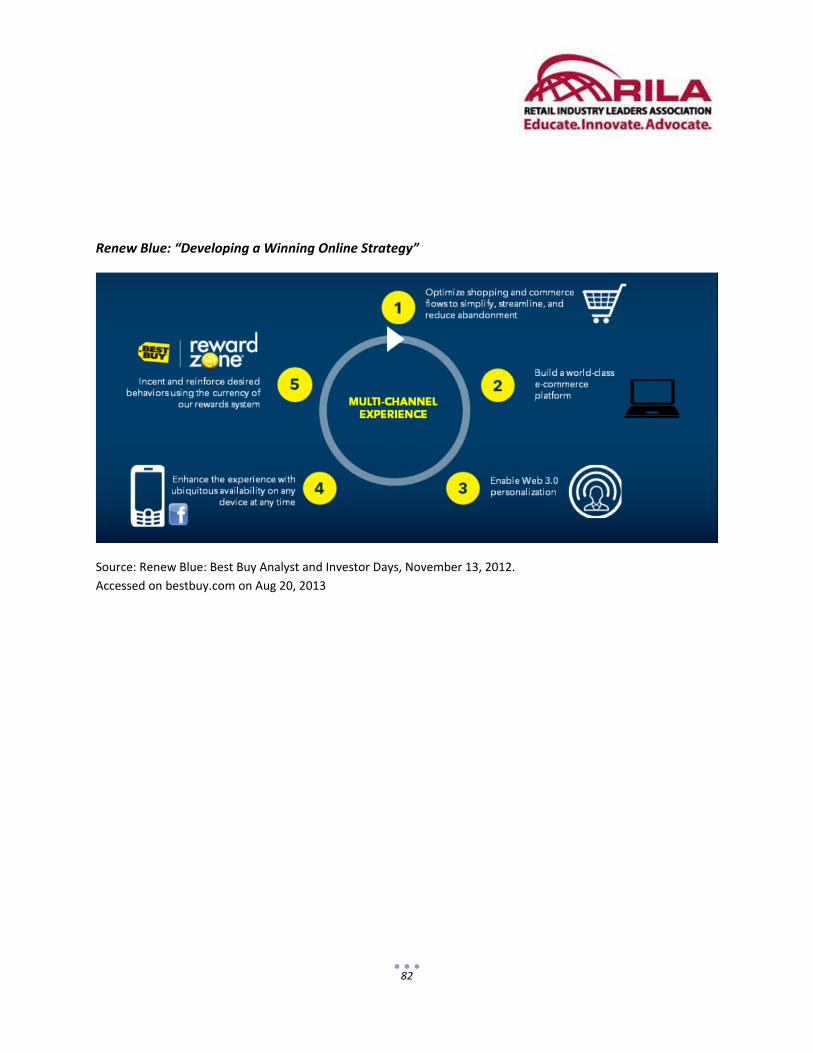
82
Renew Blue: “Developing a Winning Online Strategy”
Source: Renew Blue: Best Buy Analyst and Investor Days, November 13, 2012.
Accessed on bestbuy.com on Aug 20, 2013
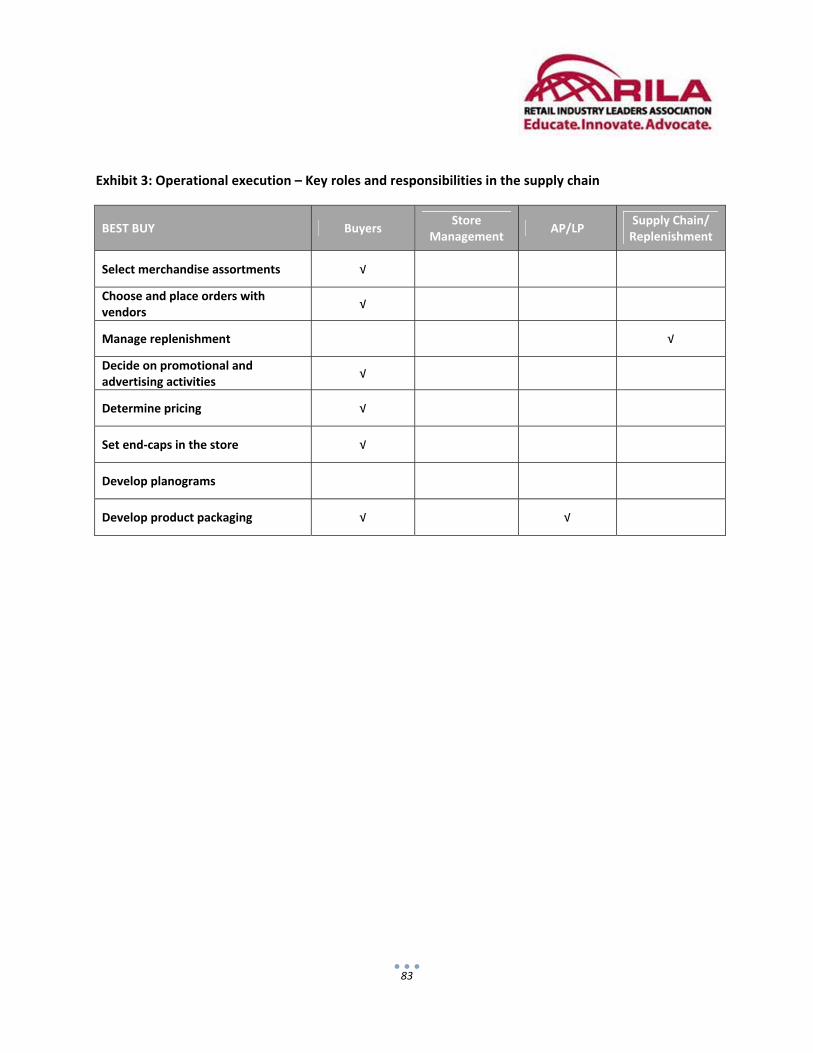
83
Exhibit 3: Operational execution – Key roles and responsibilities in the supply chain
BEST BUY Buyers Store
Management AP/LP
Supply Chain/ Replenishment
Select merchandise assortments √
Choose and place orders with vendors
√
Manage replenishment
√
Decide on promotional and advertising activities
√
Determine pricing √
Set end‐caps in the store √
Develop planograms
Develop product packaging √ √
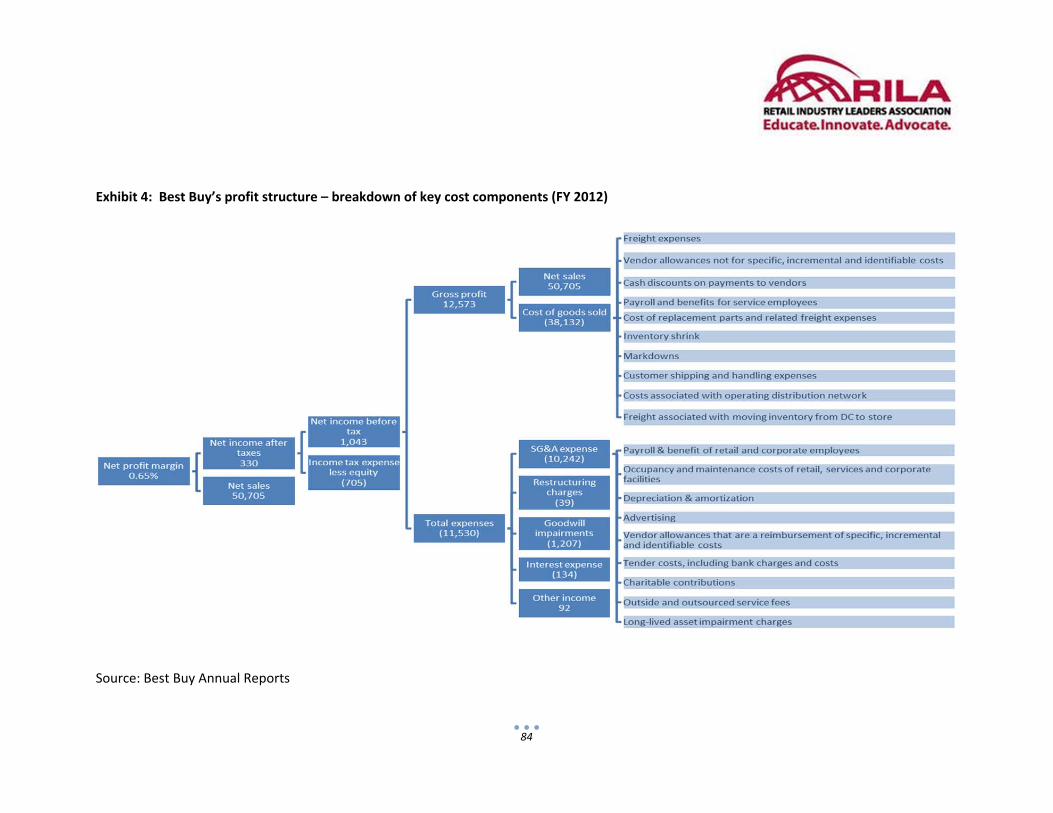
84
Exhibit 4: Best Buy’s profit structure – breakdown of key cost components (FY 2012)
Source: Best Buy Annual Reports

85
86
About the Authors
Nicole DeHoratius is an expert in the management of retail operations. As a faculty member of the
University of Chicago’s Booth School of Business she has published in leading journals such as California
Management Review, Harvard Business Review, and Management Science. The Manufacturing &
Service Operations Management Society awarded her its Best Paper Award for her article “Retail
Inventory Management When Records are Inaccurate”. She has conducted industry projects with a
number of firms including Fred Meyer, Hugo Boss, McDonald’s, Procter & Gamble, Staples, Target, Ulta
Beauty, and Walmart. Nicole serves as the Past‐President of the POMS College of Supply Chain
Management and as an associate editor and senior editor for key journals in her field.
Nicole received her DBA from Harvard Business School, her MSc from the University of Sussex as a
Rotary Ambassadorial Scholar, and her AB, magna cum laude, from Harvard College. For more than a
decade she has been teaching operations management, service operations, and supply chain
management to executives in programs and companies around the globe.
Dragana Pajovic is a 2nd year student at the University of Chicago Booth School of Business with
concentrations in operations and strategic management. She holds a BS in International Economics and
German Business Studies and an MS in Economics from Lund University, Sweden.
Prior to business school, Dragana worked as an Economist at the World Bank, in the private sector
development practice, where she analyzed enterprise survey data on conducting business in emerging
markets. By identifying gaps in local foreign direct investment climates, her work has contributed to
recommendations for better policy making, improved competition, and increased investment in
emerging economies. Upon graduation from Chicago Booth, Dragana will be joining McKinsey & Co. as
an Associate in the Chicago office.
87
Acknowledgements
We are grateful to the many retail executives who moved mountains within their organizations to
execute this study. Without their efforts, this project would not have been possible. We are particularly
indebted to Scott Fink, Sonya Hostetler, Bill Inzeo, Michael Lamb, Larry Montague, Matt Parrish, Colin
Peacock, Libby Rabun, and Paul Stone for their guidance and thought leadership. Yusef Ahmed, Tim
Fisher, Craig Railton, and Brenda Seeger were also instrumental in sharing data, insights, and arranging
various meetings. Of course, none of this would have been possible without the strong support of Lisa
LaBruno, Senior VP of Retail Operations at RILA.
Published July 2015