Embed Size (px)
Citation preview
Challenges Facing the Global Architecture for Food and Agriculture Going ForwardUma Lele, Manmohan Agarwal (Assistance-Sambuddha Goswami)Forum on Food Price Increases: Causes, Impacts and Responses - AGENDAInstitute for International Economic Policy, Elliott School of International Affairs, GWU September 30, 2011.
Food Price Rise or Volatility?
0
2
4
6
8
10
12
FAO Real Food Price Index(Annual)
(1990-2011)
Source: www.fao.org/worldfoodsituation/wfs-home/foodpricesindex/en/-
2002
-200
4=10
0
?
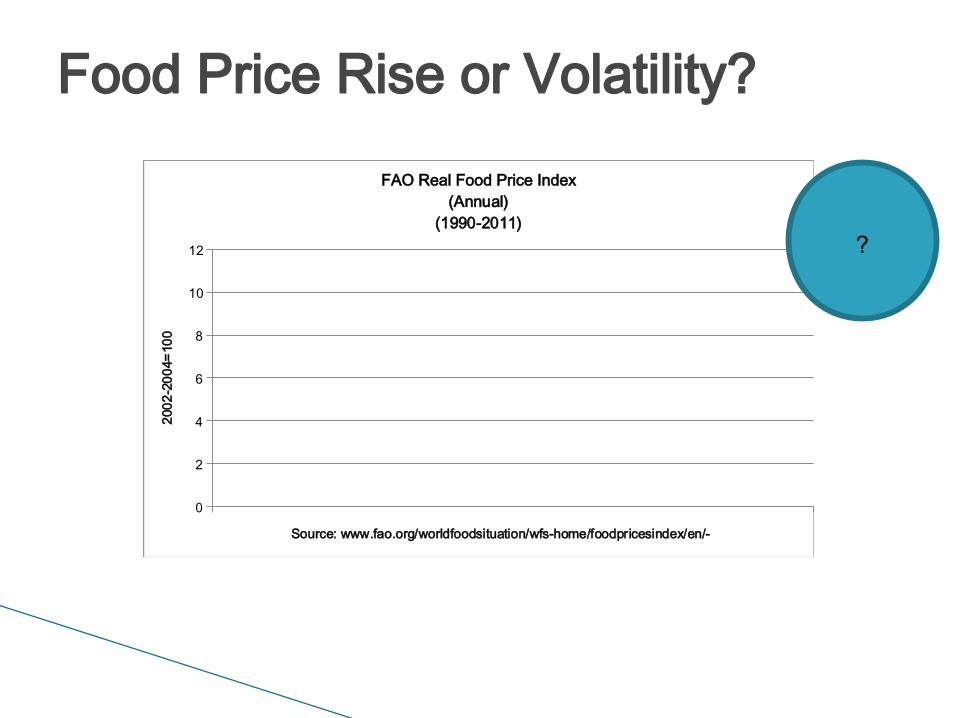
Overarching Challenge9 Billion + in 2050: Cereal Production (Net of Biofuels) Increase by 70%, Meat production 220%, Cereal Imports of Developing countries by 220%
On Demand Side Uncertainties on the Supply Side
Population Growth: ◦ All in LDCs
Income Growth: ◦ Mostly in LDCs
Urbanization: ◦ Up from 50% to 70%
Shift in Food Preferences: ◦ Rice, Wheat, Maize,
Soybeans for Feed: Biofuels: maize,
oilseeds Processed Foods
Slowing Ag. Productivity Growth?
Climate Change Limits to Land, Water,
Soils, Biodiversity, Forests, Fisheries –in Asia
Increased Market Related Risks and Uncertainty
Public and Private Investment in R and D
Last Frontiers?◦ Brazil, SSA?
Potentially A Tremendous Opportunity to Get an Organically Grown International Architecture working together effectively around short and long term issues of global food and agriculture◦ Hugely Increased Investments in R and D◦ Infrastructure◦ Macro and Sector Policy Environment◦ Human and Institutional Capacity◦ Knowledge on “How to”?◦ Not Just North-South But South South Partnerships
What Is Needed to Take On the Challenge by G 20?
Policy Options Paper By Core International Organizations
G 20 Declaration is a low hanging fruit
G 20 Declaration of Ministers of Agriculture on Food and Agricultural Markets & Price Volatility, June 21-22, 2011
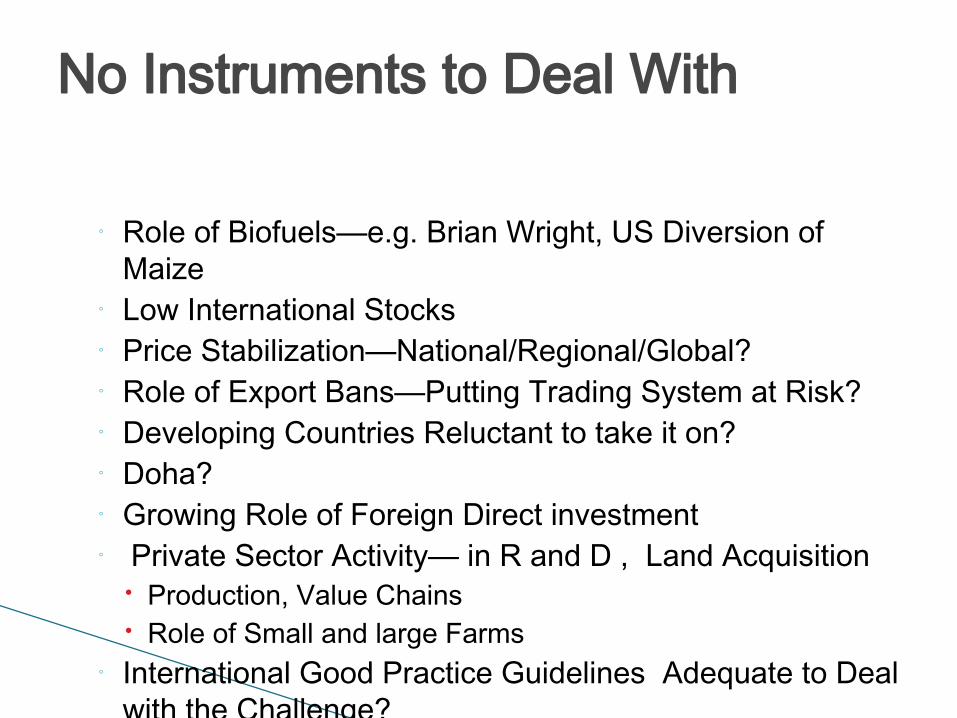
◦ Role of Biofuels—e.g. Brian Wright, US Diversion of Maize
◦ Low International Stocks◦ Price Stabilization—National/Regional/Global?◦ Role of Export Bans—Putting Trading System at Risk?◦ Developing Countries Reluctant to take it on?◦ Doha?◦ Growing Role of Foreign Direct investment◦ Private Sector Activity— in R and D , Land Acquisition Production, Value Chains Role of Small and large Farms
◦ International Good Practice Guidelines Adequate to Deal with the Challenge?
No Instruments to Deal With
WFP and Increased Demand for Emergency Assistance
Despite Growing Commitments- Gap in Donor Pledges and Commitments
Increased Fragmentation of Aid Rising Foreign Direct investment-- Developing Countries’ Reticence Towards Bretton
Woods Institutions since the 2008 Financial Crisis Doha deadlock Increased Role of Emerging Countries, New
Actors—BMGF, Civil Society
Volatility Related Challenges
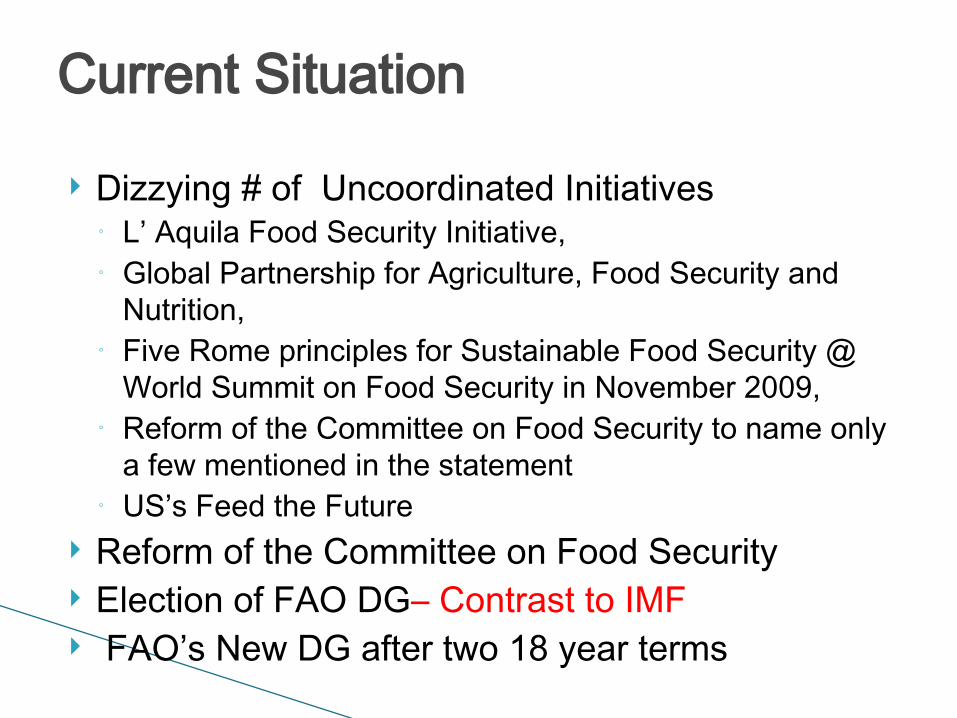
Dizzying # of Uncoordinated Initiatives◦ L’ Aquila Food Security Initiative, ◦ Global Partnership for Agriculture, Food Security and
Nutrition, ◦ Five Rome principles for Sustainable Food Security @
World Summit on Food Security in November 2009,◦ Reform of the Committee on Food Security to name only
a few mentioned in the statement◦ US’s Feed the Future
Reform of the Committee on Food Security Election of FAO DG– Contrast to IMF FAO’s New DG after two 18 year terms
Current Situation
Core International Organizations Concerned with Food and Agriculture
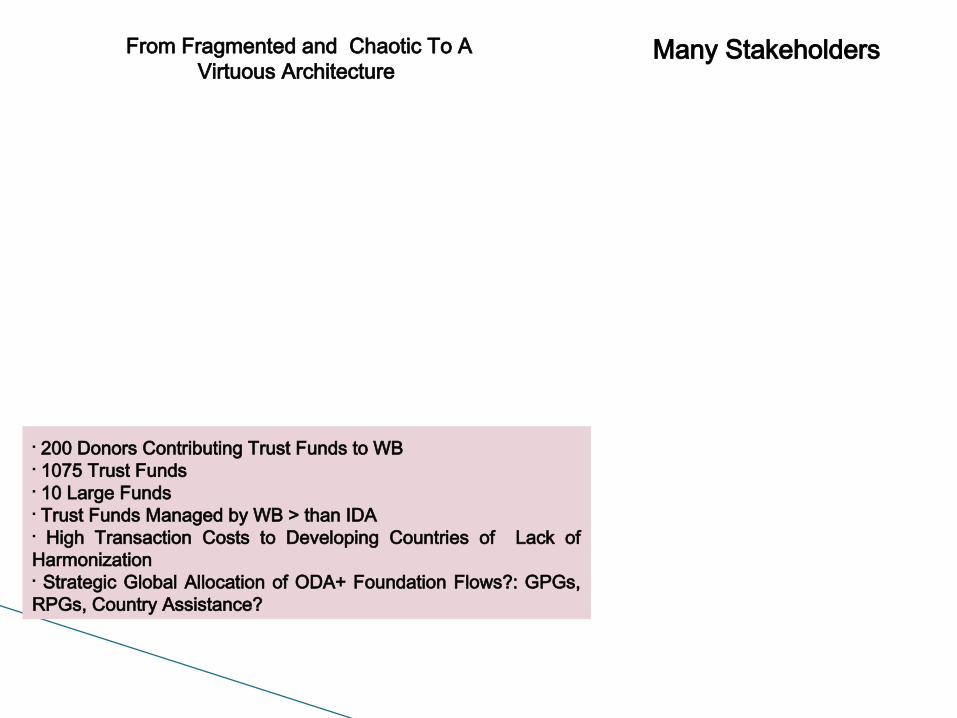
From Fragmented and Chaotic To A Virtuous Architecture
§ 200 Donors Contributing Trust Funds to WB§ 1075 Trust Funds§ 10 Large Funds§ Trust Funds Managed by WB > than IDA§ High Transaction Costs to Developing Countries of Lack of Harmonization§ Strategic Global Allocation of ODA+ Foundation Flows?: GPGs, RPGs, Country Assistance?
Many Stakeholders
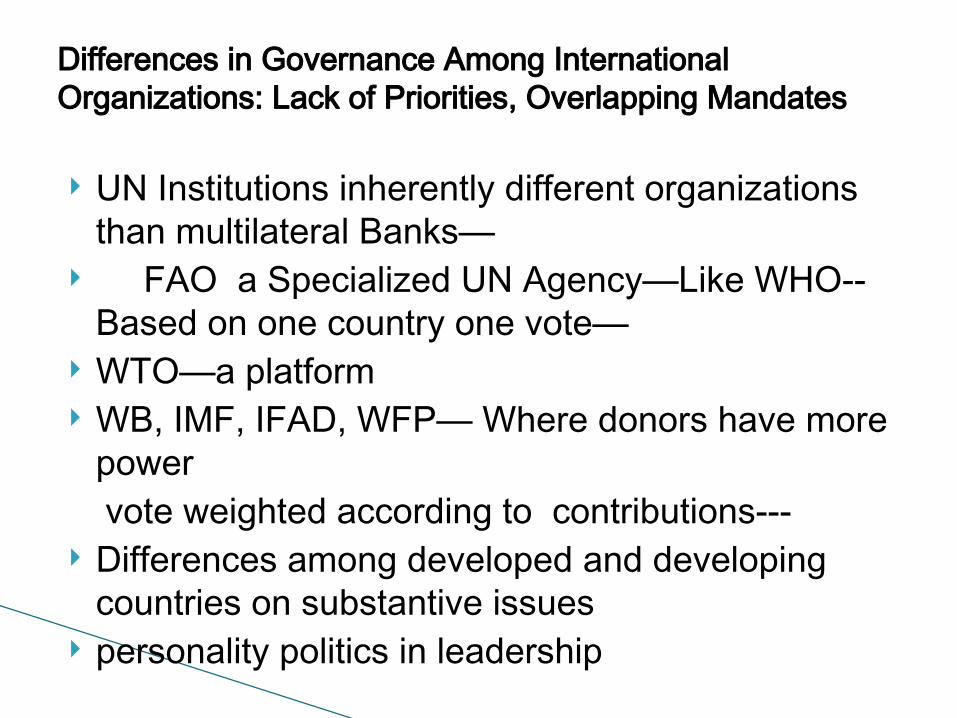
UN Institutions inherently different organizations than multilateral Banks—
FAO a Specialized UN Agency—Like WHO-- Based on one country one vote—
WTO—a platform WB, IMF, IFAD, WFP— Where donors have more
powervote weighted according to contributions---
Differences among developed and developing countries on substantive issues
personality politics in leadership
Collective Action challenges Efficiency vs. Legitimacy They Need Each Other Can they come together with a vision for the G 20
Meeting in November?
Differences in Governance Among International Organizations: Lack of Priorities, Overlapping Mandates
Implications of Differentiation Among Developing Countries
Middle Income Countries
Low Income Countries
Large Share of Global Poverty in Middle Income countries where aid is unimportant
Importance of Knowledge Transfers?
Special Challenges of less developed countries◦ Diseconomies of scale◦ Limited capacity◦ Early stage of
demographic transition
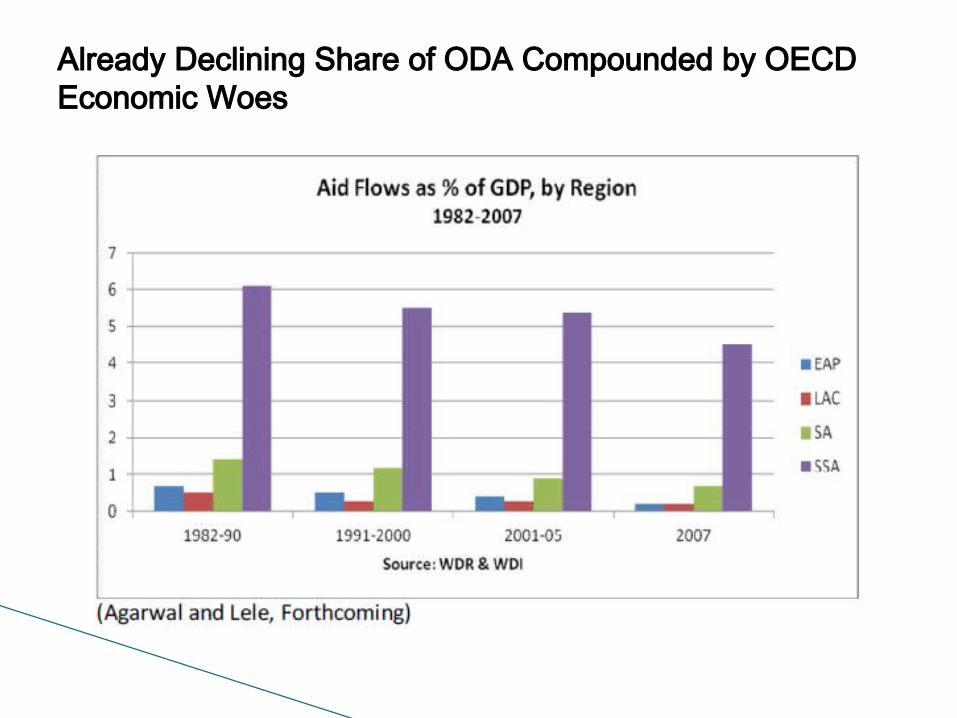
Already Declining Share of ODA Compounded by OECD Economic Woes
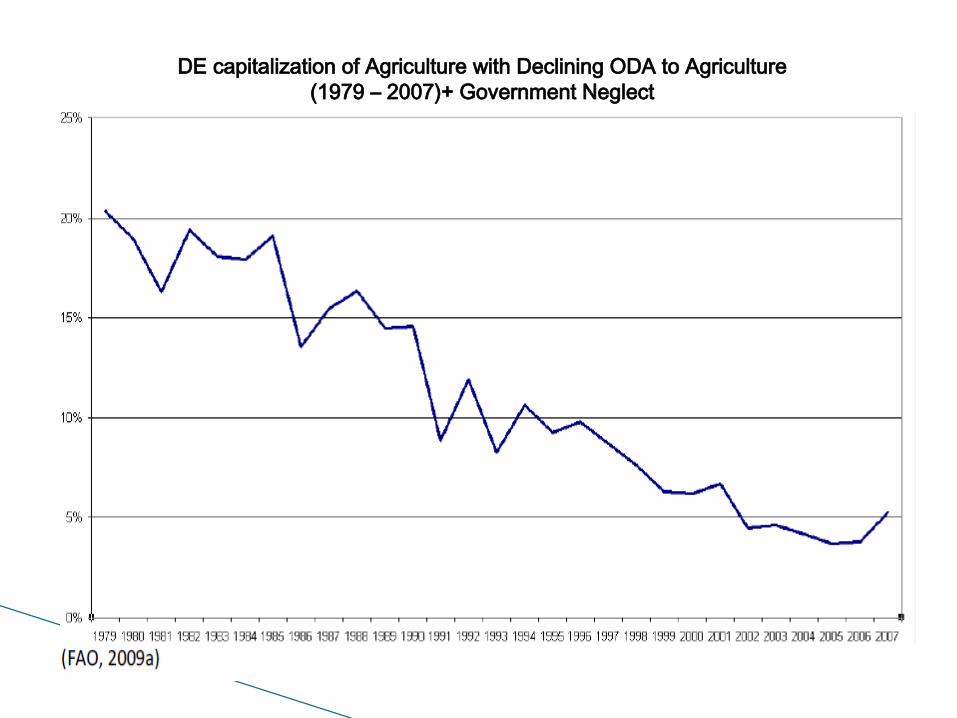
DE capitalization of Agriculture with Declining ODA to Agriculture (1979 – 2007)+ Government Neglect
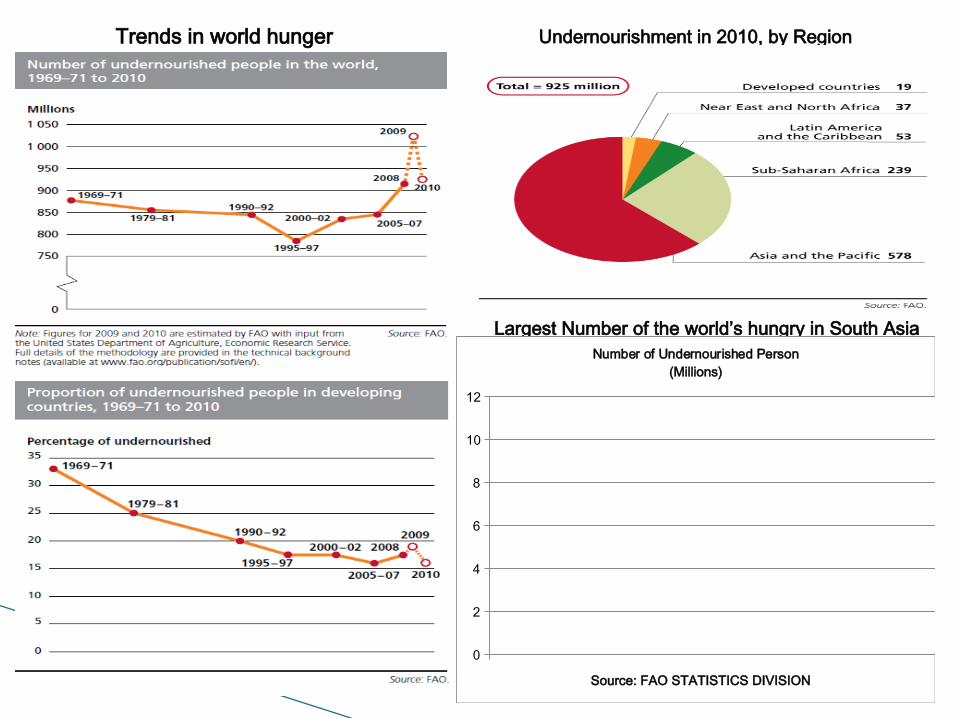
Trends in world hunger Undernourishment in 2010, by Region (Millions)
Largest Number of the world’s hungry in South Asia
0
2
4
6
8
10
12
Number of Undernourished Person(Millions)
Source: FAO STATISTICS DIVISION
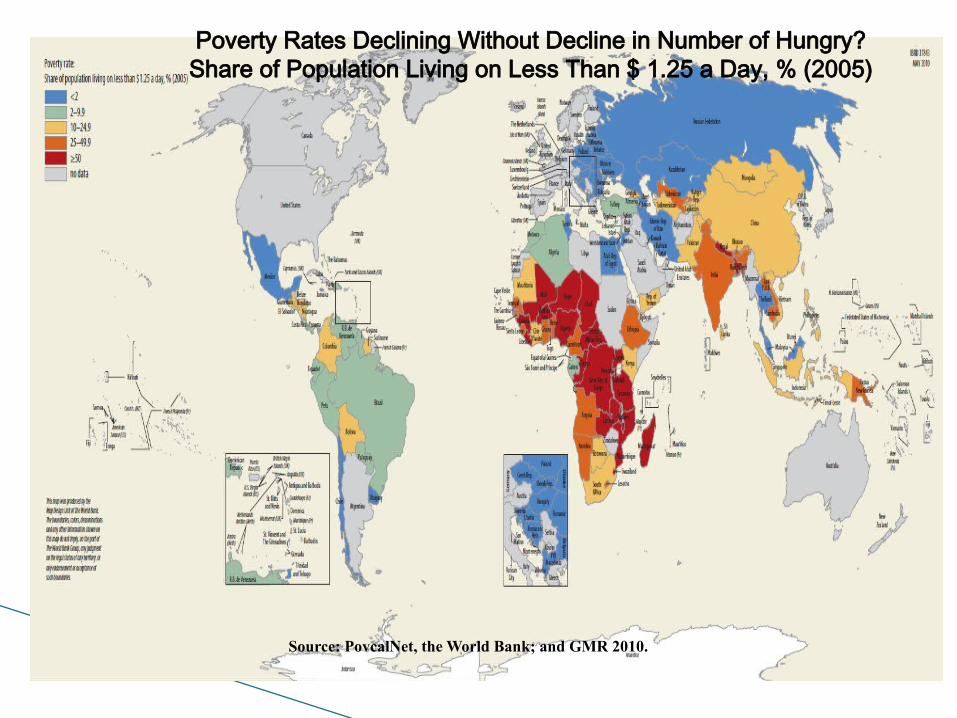
Source: PovcalNet, the World Bank; and GMR 2010.
Poverty Rates Declining Without Decline in Number of Hungry?Share of Population Living on Less Than $ 1.25 a Day, % (2005)
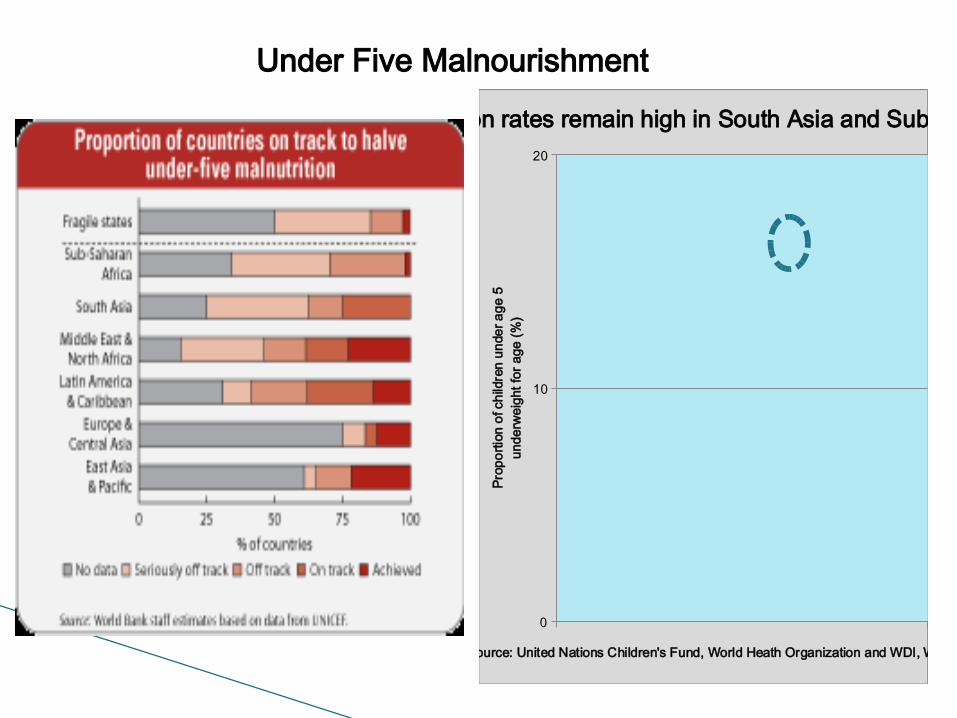
Under Five Malnourishment
0
10
20
Child malnutrition rates remain high in South Asia and Sub-Saharan Africa
Source: United Nations Children's Fund, World Heath Organization and WDI, World Bank
Prop
ortio
n of
chi
ldre
n un
der a
ge 5
unde
rwei
ght f
or a
ge (%
)
Agricultural TFP Growth: SA and SSA Lagging in TFP Growth
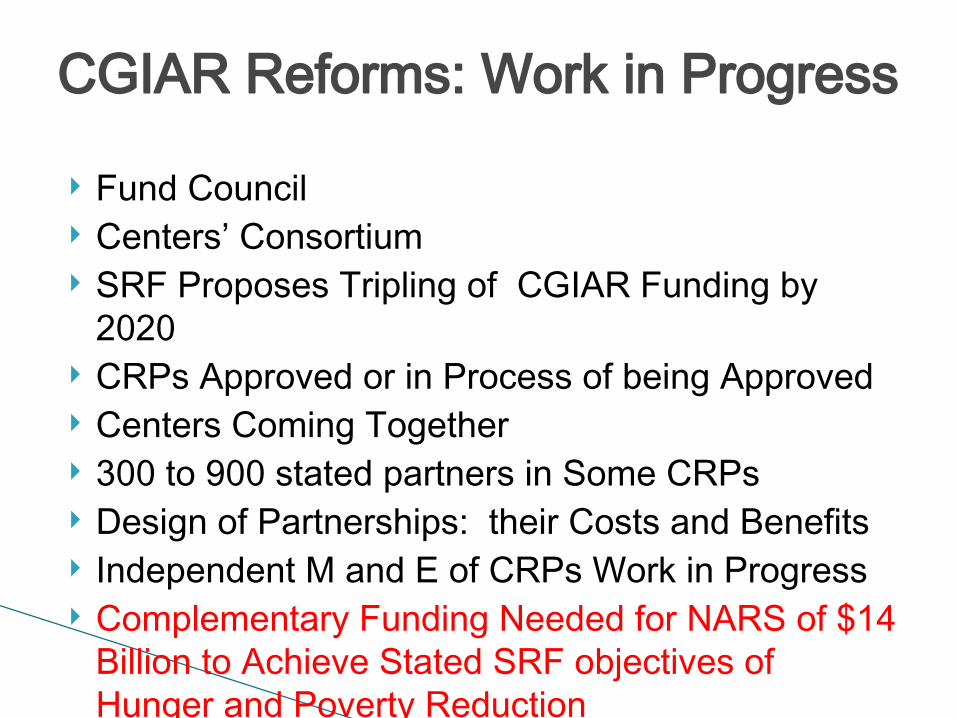
Fund Council Centers’ Consortium SRF Proposes Tripling of CGIAR Funding by
2020 CRPs Approved or in Process of being Approved Centers Coming Together 300 to 900 stated partners in Some CRPs Design of Partnerships: their Costs and Benefits Independent M and E of CRPs Work in Progress Complementary Funding Needed for NARS of $14
Billion to Achieve Stated SRF objectives of Hunger and Poverty Reduction
Funding not yet forthcoming nor any explicit strategy for NARS funding
Contrast to the Green Revolution Period
CGIAR Reforms: Work in Progress
CGIAR Funding Grows but Remains Restricted
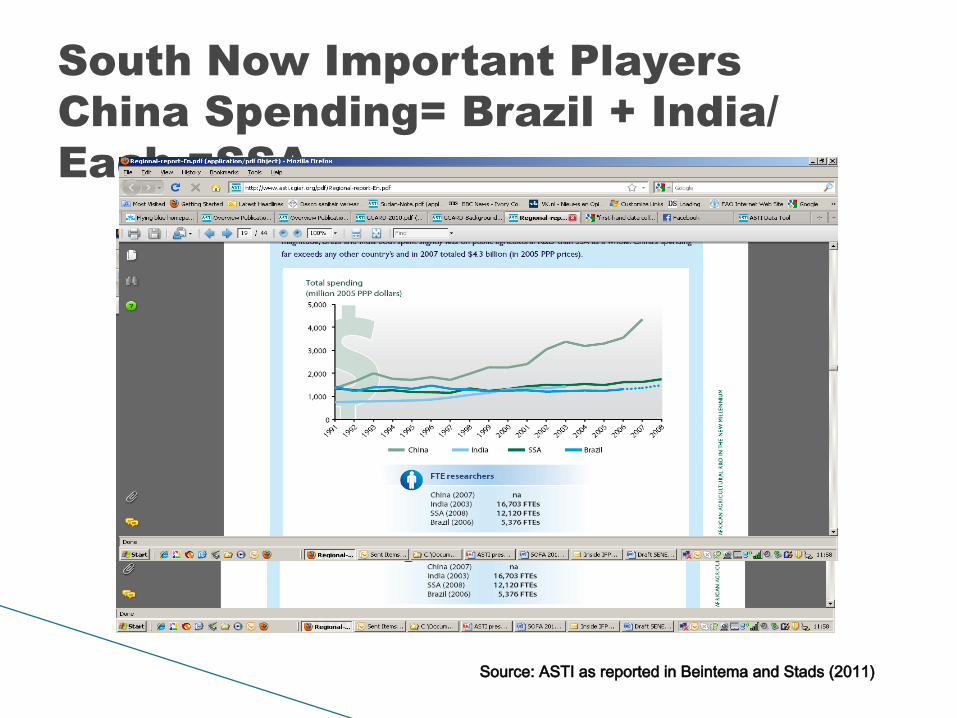
South Now Important PlayersChina Spending= Brazil + India/ Each =SSA
Source: ASTI as reported in Beintema and Stads (2011)
0
2
4
6
8
10
12
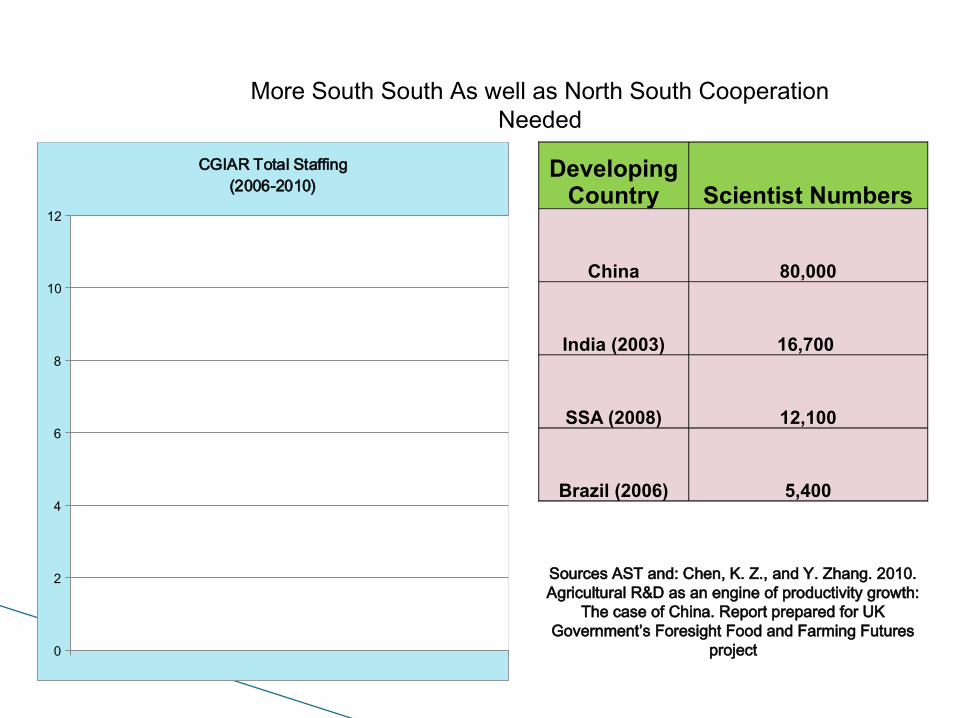
CGIAR Total Staffing(2006-2010)
Developing Country Scientist Numbers
China 80,000
India (2003) 16,700
SSA (2008) 12,100
Brazil (2006) 5,400
Sources AST and: Chen, K. Z., and Y. Zhang. 2010. Agricultural R&D as an engine of productivity growth:
The case of China. Report prepared for UK Government’s Foresight Food and Farming Futures
project
More South South As well as North South Cooperation Needed
FOOD AID
From Food Aid to Food Assistance?Evolution of WFP Strategy in Recent Years
0
2
4
6
8
10
12
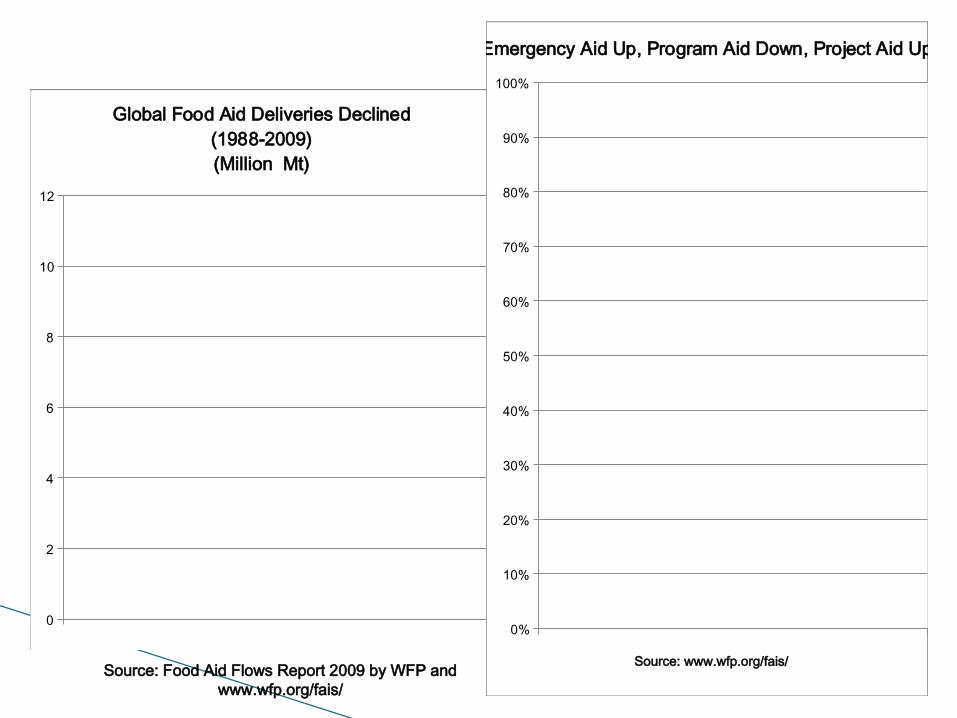
Global Food Aid Deliveries Declined(1988-2009)(Million Mt)
Source: Food Aid Flows Report 2009 by WFP and www.wfp.org/fais/
0%
10%
20%
30%
40%
50%
60%
70%
80%
90%
100%
Emergency Aid Up, Program Aid Down, Project Aid Up
Source: www.wfp.org/fais/
0%
10%
20%
30%
40%
50%
60%
70%
80%
90%
100%
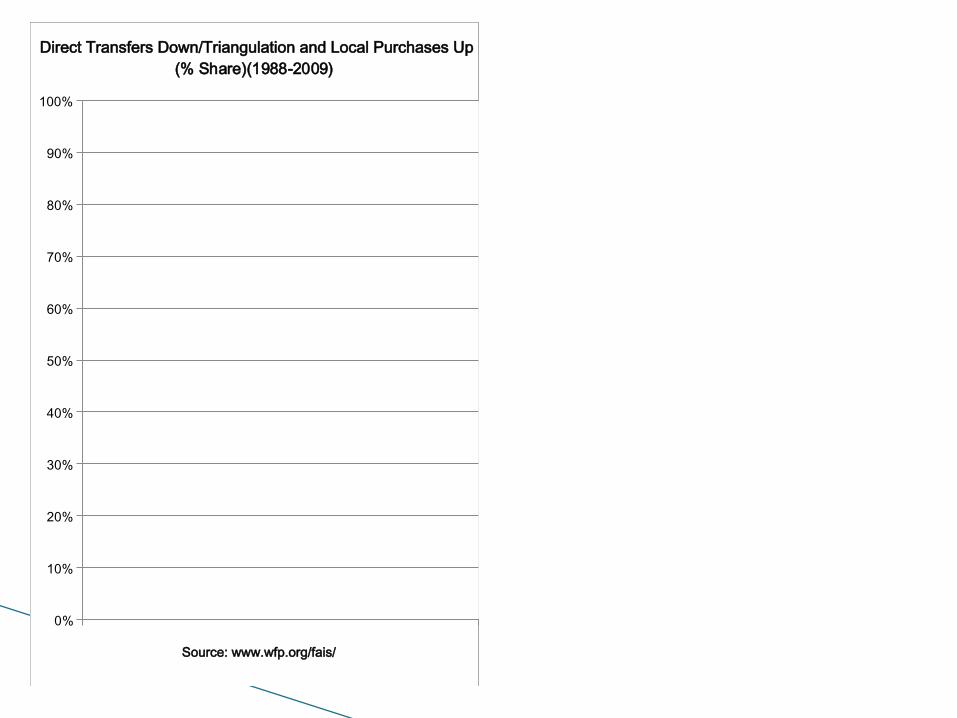
Direct Transfers Down/Triangulation and Local Purchases Up(% Share)(1988-2009)
Source: www.wfp.org/fais/
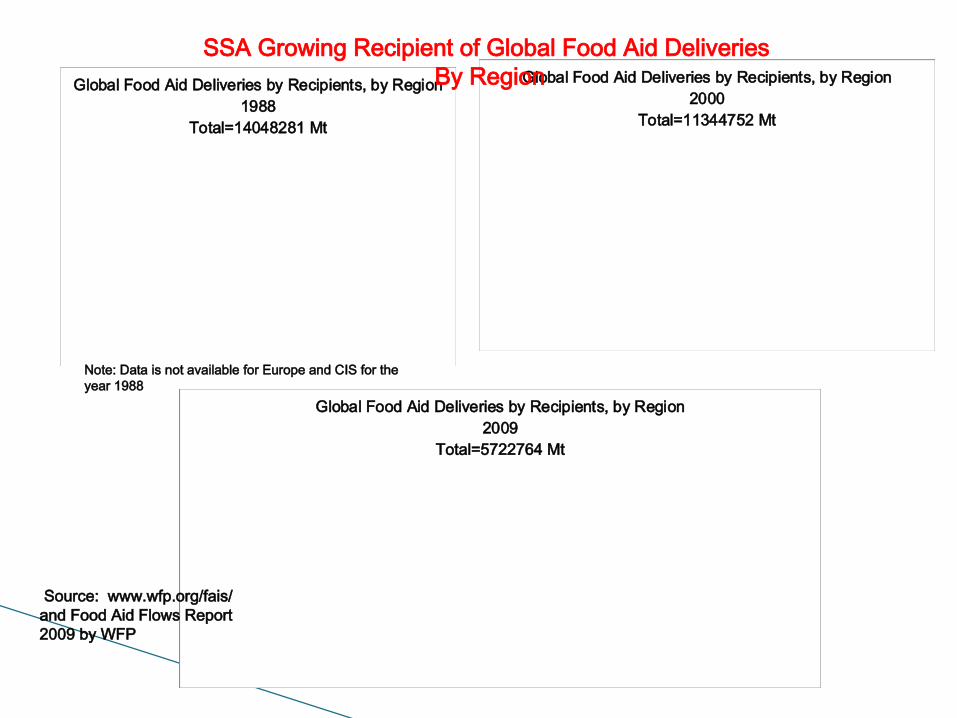
Global Food Aid Deliveries by Recipients, by Region1988
Total=14048281 Mt
Global Food Aid Deliveries by Recipients, by Region2000
Total=11344752 Mt
Note: Data is not available for Europe and CIS for the year 1988
Global Food Aid Deliveries by Recipients, by Region2009
Total=5722764 Mt
Source: www.wfp.org/fais/ and Food Aid Flows Report 2009 by WFP
SSA Growing Recipient of Global Food Aid Deliveries By Region
0
2
4
6
8
10
12
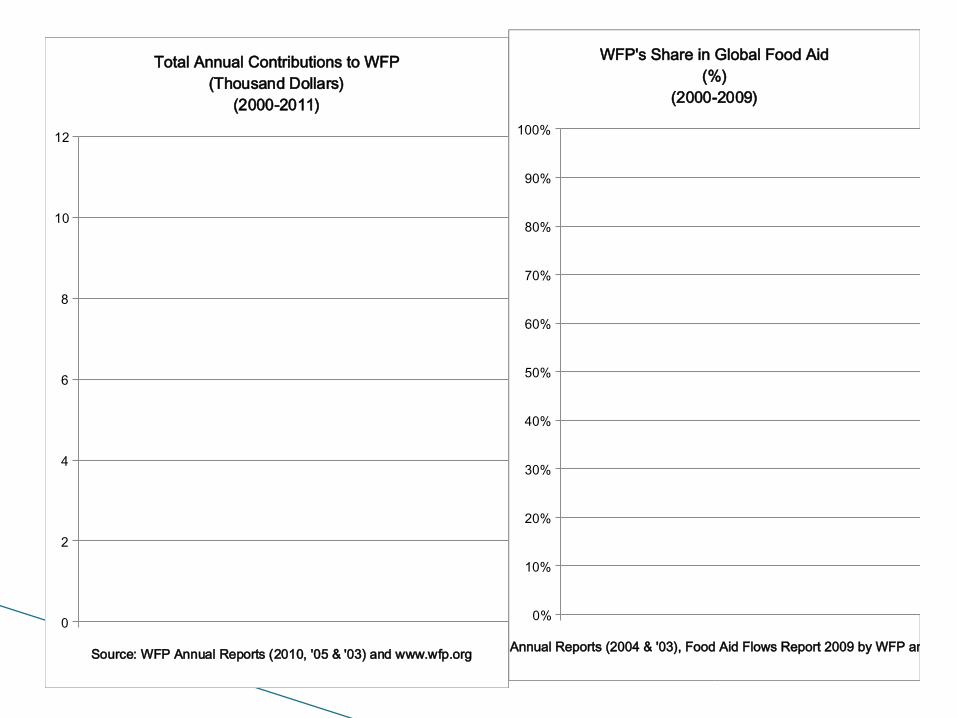
Total Annual Contributions to WFP(Thousand Dollars)
(2000-2011)
Source: WFP Annual Reports (2010, '05 & '03) and www.wfp.org
0%
10%
20%
30%
40%
50%
60%
70%
80%
90%
100%
WFP's Share in Global Food Aid(%)
(2000-2009)
Source: WFP Annual Reports (2004 & '03), Food Aid Flows Report 2009 by WFP and www.wfp.org
World Bank: Recent Rise in Lending as Share of total and still the Largest Single Lender to ARDHas been Transforming itself As a Knowledge Bank mobilizing Relevant global Development Experience And More grant funding
0
2
4
6
8
10
12
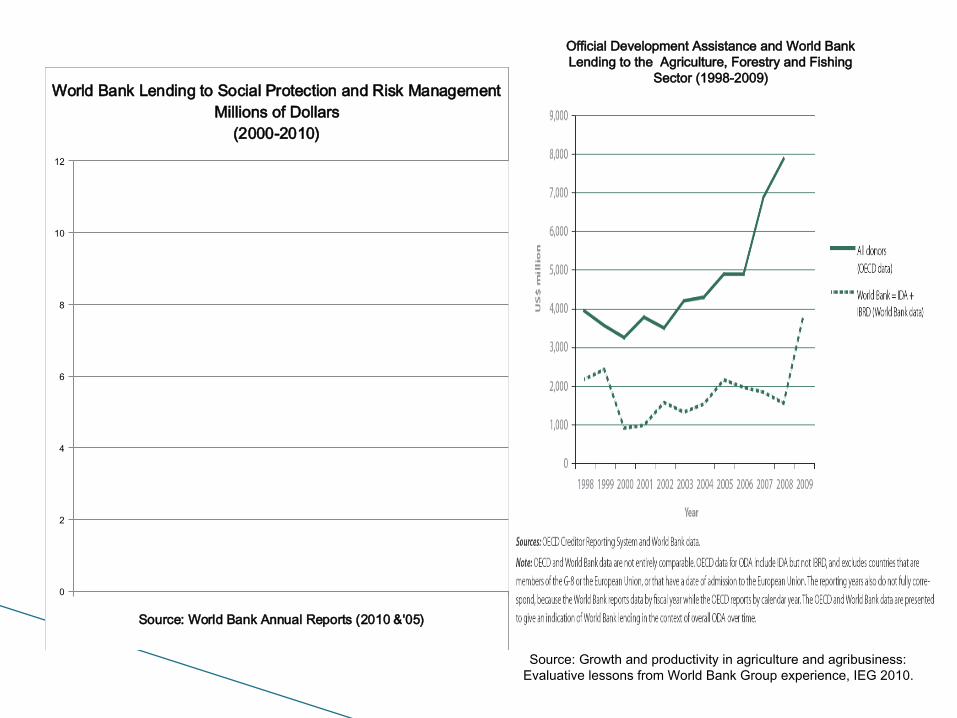
World Bank Lending to Social Protection and Risk ManagementMillions of Dollars
(2000-2010)
Source: World Bank Annual Reports (2010 &'05)
Official Development Assistance and World Bank Lending to the Agriculture, Forestry and Fishing
Sector (1998-2009)
Source: Growth and productivity in agriculture and agribusiness: Evaluative lessons from World Bank Group experience, IEG 2010.
0
2
4
6
8
10
12
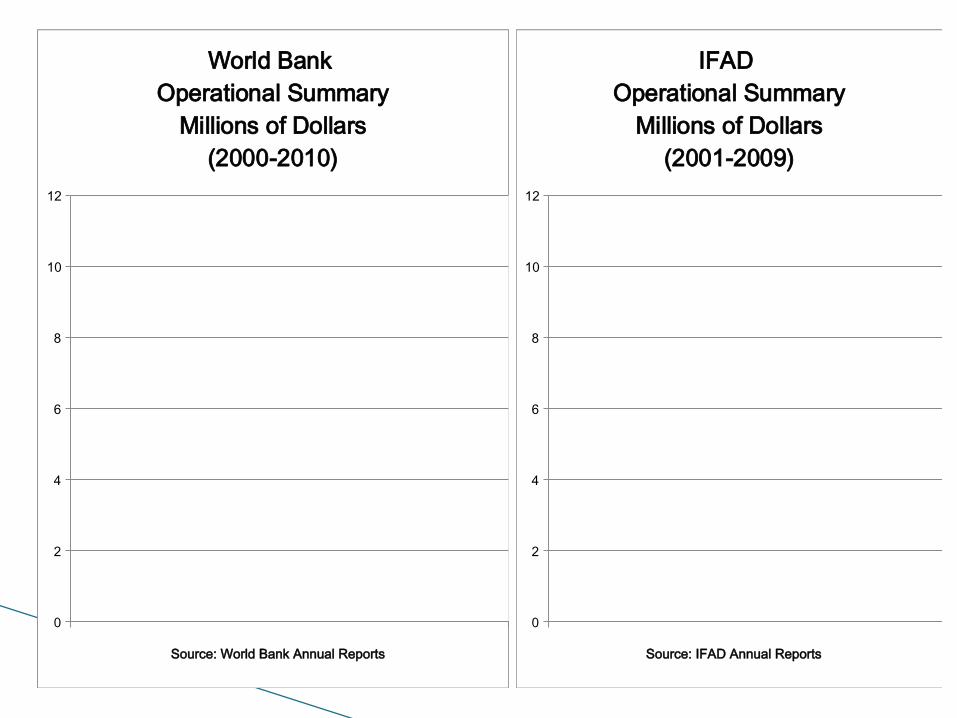
World Bank Operational Summary
Millions of Dollars(2000-2010)
Source: World Bank Annual Reports
0
2
4
6
8
10
12
IFAD Operational Summary
Millions of Dollars(2001-2009)
Source: IFAD Annual Reports
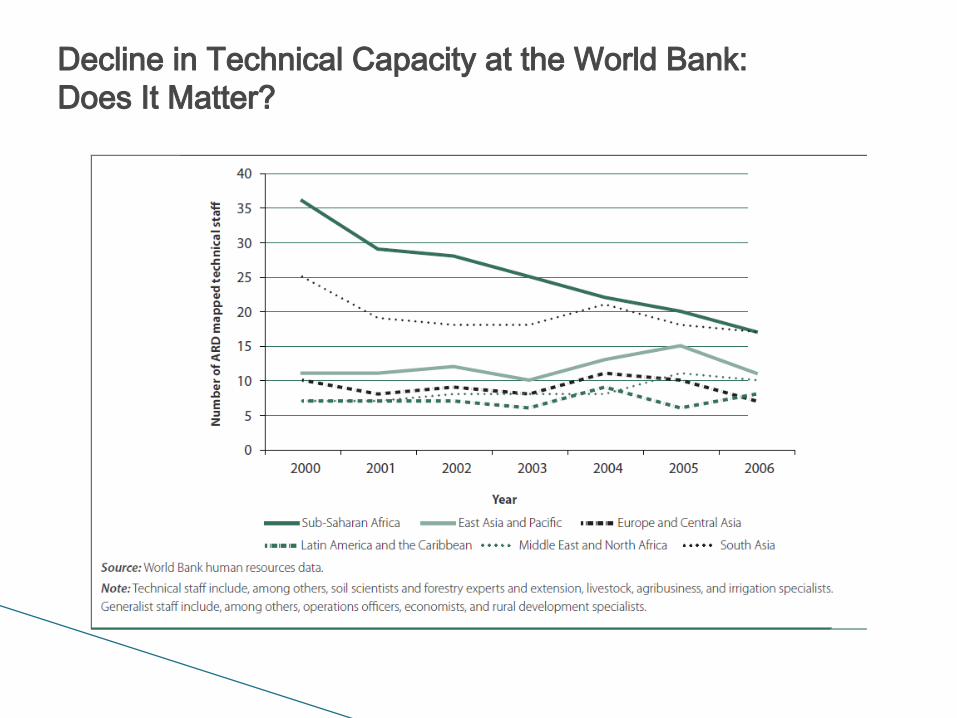
Decline in Technical Capacity at the World Bank:Does It Matter?
FAO’s Essential Roles“FAO would Need to be Created if it did not exist”
• Bring Strategic View of the State of Global Food and Agriculture
• Mobilize Information and Knowledge on State of the World’s Food, Agriculture, Forestry and Fisheries and Agriculturally Related Natural Resources
• Provide a Neutral Platform for discussion and reaching of International Agreements and Standard Setting—food safety, Plant Genetic Resources, Agricultural Practices
• Promote Guidelines and Their Implementation• FAO-CP ‘s Support for World Bank Lending• Other TA/Regional Offices• Emergency Assistance growing most rapidly
through voluntary contributions
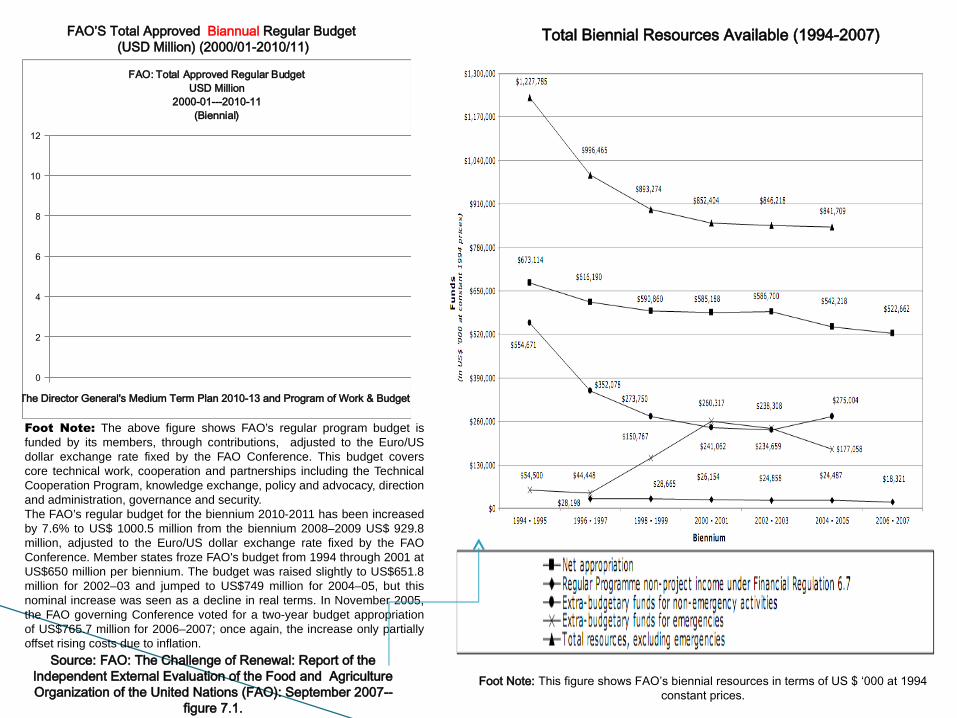
FAO’S Total Approved Biannual Regular Budget (USD Million) (2000/01-2010/11)
0
2
4
6
8
10
12
FAO: Total Approved Regular BudgetUSD Million
2000-01---2010-11(Biennial)
Source: FAO: The Director General's Medium Term Plan 2010-13 and Program of Work & Budget 2010-11 Report
Foot Note: The above figure shows FAO’s regular program budget is funded by its members, through contributions, adjusted to the Euro/US dollar exchange rate fixed by the FAO Conference. This budget covers core technical work, cooperation and partnerships including the Technical Cooperation Program, knowledge exchange, policy and advocacy, direction and administration, governance and security.The FAO’s regular budget for the biennium 2010-2011 has been increased by 7.6% to US$ 1000.5 million from the biennium 2008–2009 US$ 929.8 million, adjusted to the Euro/US dollar exchange rate fixed by the FAO Conference. Member states froze FAO's budget from 1994 through 2001 at US$650 million per biennium. The budget was raised slightly to US$651.8 million for 2002–03 and jumped to US$749 million for 2004–05, but this nominal increase was seen as a decline in real terms. In November 2005, the FAO governing Conference voted for a two-year budget appropriation of US$765.7 million for 2006–2007; once again, the increase only partially offset rising costs due to inflation.
Total Biennial Resources Available (1994-2007)
Foot Note: This figure shows FAO’s biennial resources in terms of US $ ‘000 at 1994 constant prices.
Source: FAO: The Challenge of Renewal: Report of the Independent External Evaluation of the Food and Agriculture Organization of the United Nations (FAO): September 2007--
figure 7.1.
0
2
4
6
8
10
12
WHO: Total Biennium Program Budget (US$ Million)(Biennium)
(2000-01/2010-11)
Source: www.who.int/gb/
US
$ M
illion
0
2
4
6
8
10
12
WHO: Voluntary Contribution and Regular Budget(Biennium Program Budget)
(US $ Million)(2000-01/2010-11)
Source: www.who.int/gb/
US
$ M
illion
Looking To the Future
Zero Hunger and Sustainable Intensification of Small Farm Agriculture:
Walking on Two legs: Productivity Growth and Effective Safety Nets
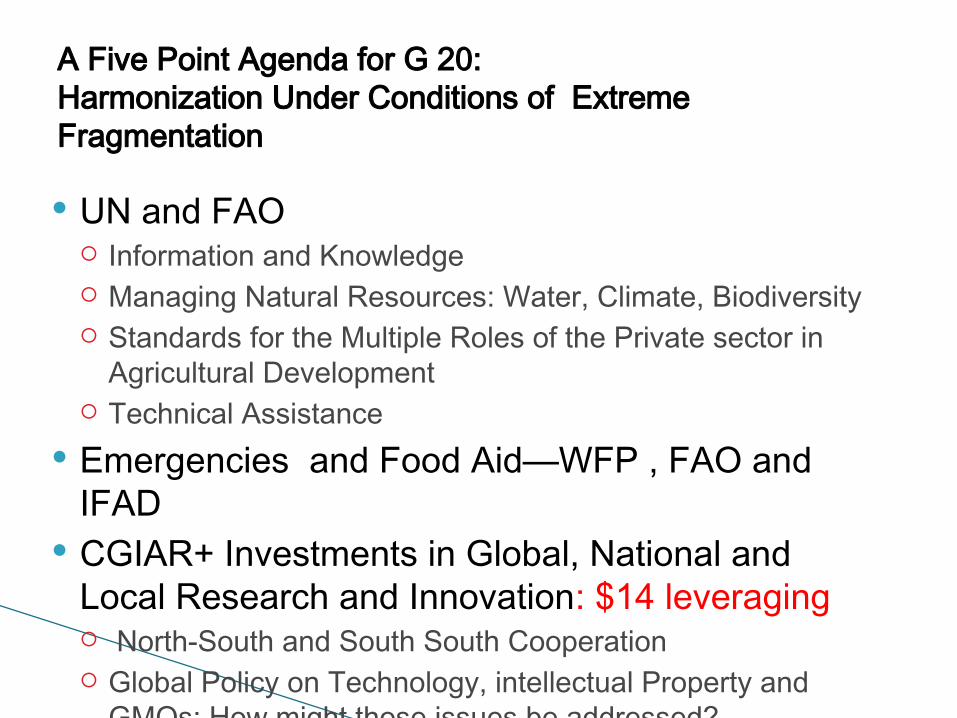
A Five Point Agenda for G 20: Harmonization Under Conditions of Extreme Fragmentation
UN and FAO Information and Knowledge Managing Natural Resources: Water, Climate, Biodiversity Standards for the Multiple Roles of the Private sector in
Agricultural Development Technical Assistance
Emergencies and Food Aid—WFP , FAO and IFAD
CGIAR+ Investments in Global, National and Local Research and Innovation: $14 leveraging North-South and South South Cooperation Global Policy on Technology, intellectual Property and
GMOs: How might those issues be addressed? Investments in Agricultural and Rural
Development+ Roads, Health, Education, Water and Sanitation, Power, IT World Bank and Regional Banks, BRINCS Abolition of Chronic Hunger and Food Security—Put
women and Children at the Center Stage Health, Nutrition and Food and Safety Nets and Standards
WTO, UNCTAD Agricultural Trade Liberalization, Pricing, Subsidies and Doha
Annual Cost of Bringing Populations to the Poverty Line: Possible G 20 Agenda?
0
2
4
6
8
10
12
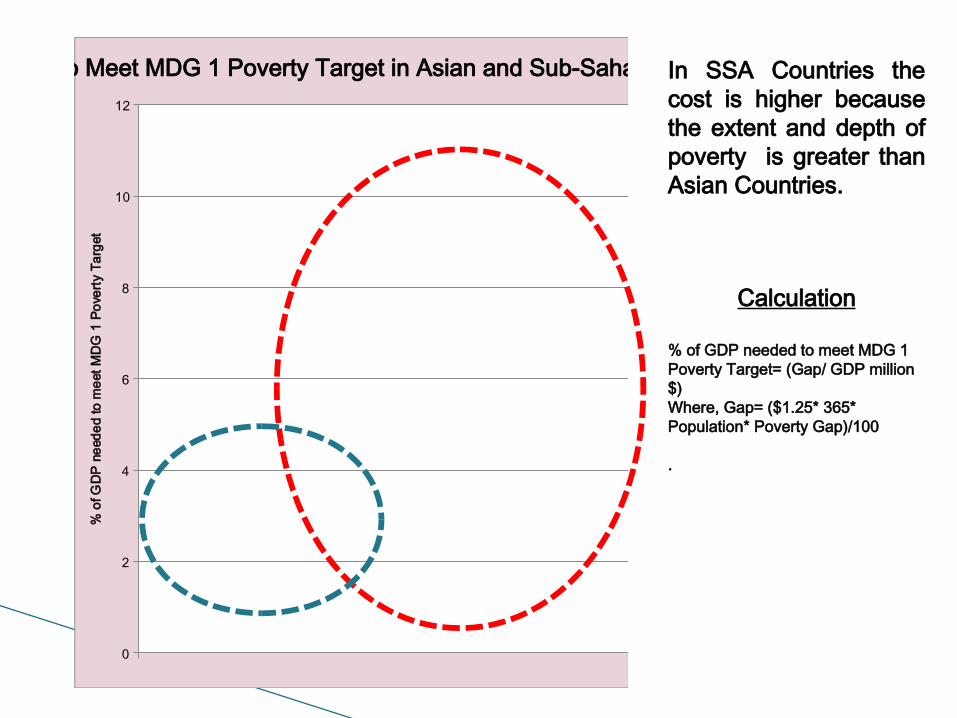
% of GDP Needed to Meet MDG 1 Poverty Target in Asian and Sub-Sahara African Countries%
of G
DP
need
ed to
mee
t MD
G 1
Pov
erty
Tar
get
In SSA Countries the cost is higher because the extent and depth of poverty is greater than Asian Countries.
Calculation
% of GDP needed to meet MDG 1 Poverty Target= (Gap/ GDP million $)Where, Gap= ($1.25* 365* Population* Poverty Gap)/100
.
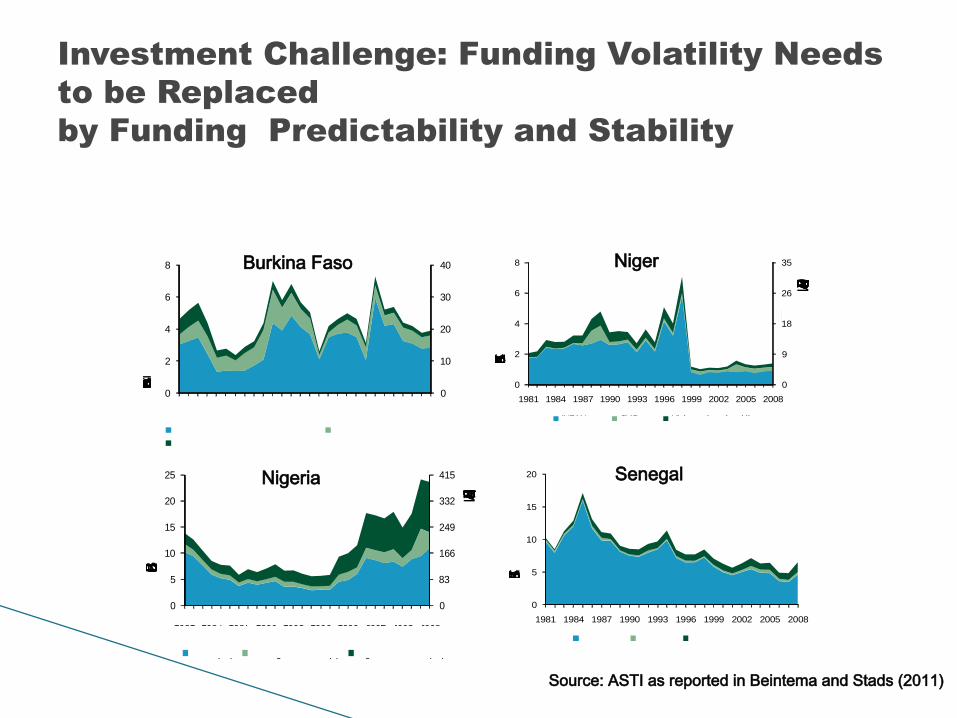
Investment Challenge: Funding Volatility Needs to be Replaced by Funding Predictability and Stability
0
83
166
249
332
415
0
5
10
15
20
25
1981 1984 1987 1990 1993 1996 1999 2002 2005 2008
Million 2005 PPP dollars
Billion 2005 naira
NARIs (15) Other government (7) Higher education (66)
0
5
10
15
20
1981 1984 1987 1990 1993 1996 1999 2002 2005 2008
Billion 2005 CFA francs
ISRA ITA Higher education (7)
0
9
18
26
35
0
2
4
6
8
1981 1984 1987 1990 1993 1996 1999 2002 2005 2008
Billion 2005 CFA francs
INRAN CMB Higher education (4)
Million 2005 PPP dollars
0
10
20
30
40
0
2
4
6
8
1981 1984 1987 1990 1993 1996 1999 2002 2005 2008
Millions de dollars PPA 2005
Milliards de francs CFA 2005
INERA et prédécesseurs Autres agences d'État (12)Enseignement supérieur (4)
SenegalNigeria
NigerBurkina Faso
Source: ASTI as reported in Beintema and Stads (2011)