Embed Size (px)
Citation preview

Center for Behavior, Institutions and the Environment
CBIE Working Paper Series
#CBIE-2015-006
Challenges and Opportunities in Coding the Commons: Problems,Procedures, and Potential Solutions in Large-N Comparative Case Studies.
Elicia Ratajczyk, Arizona State University
Ute Brady, Arizona State University
Jacopo A. Baggio, Utah State University
Allain J. Barnett, University of New Brunswick
Irene Perez-Ibarra, Arizona State University
Nathan Rollins, Arizona State University
Cathy A. Rubinos, Arizona State University
Hoon C. Shin, Arizona State University
David J. Yu, Arizona State University
Rimjhim Aggarwal, Arizona State University
John M. Anderies, Arizona State University
Marco A. Janssen, Arizona State University
July 13, 2015
The Center for Behavior, Institutions and the Environment resides in the School of Human Evolution and Social Changeat Arizona State University. CBIE can be found on the internet at: http://csid.asu.edu. CBIE can be reached via emailat [email protected].
c©2015 E. Ratajczyk. All rights reserved.

Challenges and Opportunities in Coding the Commons: Problems, Procedures, andPotential Solutions in Large-N Comparative Case Studies.
Elicia Ratajczyka, Ute Bradya, Jacopo A. Baggiob, Allain J. Barnettc, Irene Perez-Ibarraa, NathanRollinsa, Cathy A. Rubinosa, Hoon C. Shinb, David J. Yub, Rimjhim Aggarwalc, John M. Anderiesb,Marco A. Janssenb,
aCenter for Behavior, Institutions and the Environment, Arizona State University;bDepartment of Environment and Society, Quinney College of Natural Resources, Utah State University;cDepartment of Anthropology, University of New Brunswick;
Corresponding author:Elicia RatajczykCenter for Behavior, Institutions and the Environment, Arizona State [email protected]
Abstract:On-going efforts to understand the dynamics of coupled social-ecological (or more broadly, coupledinfrastructure) systems and common pool resources have led to the generation of numerous datasetsbased on a large number of case studies. This data has facilitated the identification of importantfactors and fundamental principles which increase our understanding of such complex systems.However, the data at our disposal are often not easily comparable, have limited scope and scale, andare based on disparate underlying frameworks inhibiting synthesis, meta-analysis, and the validation offindings. Research efforts are further hampered when case inclusion criteria, variable definitions,coding schema, and inter-coder reliability testing are not made explicit in the presentation of researchand shared among the research community. This paper first outlines challenges experienced byresearchers engaged in a large-scale coding project; then highlights valuable lessons learned inlarge-scale coding projects; and finally discusses opportunities for further research on comparative casestudy analysis focusing on social-ecological systems and common pool resources.
Keywords:Common Pool Resources, Social-Ecological Systems, Complexity, Coupled Infrastructure Systems,Coding, Content Analysis, Intercoder Reliability Testing, Intercoder Agreement, CodebookDevelopment.

1
Challenges and Opportunities in Coding the Commons: Problems, Procedures, and Potential Solutions in Large-N Comparative Case Studies.*
1. Introduction Long-term efforts to understand the dynamics of coupled infrastructure systems (CIS) involving the management of common pool resources (CPR) have led to the creation of a large body of data which encompasses a broad range of case studies and comparative analyses (Baland and Platteau, 1999; Bardhan and Mookherjee, 2006; Berkes, 1989; Cox, 2014; Epstein et al., 2014; Fleischman et al., 2014; McKean, 1992; Netting, 1976; Ostrom 1990; Villamayor-Tomas et al., 2014; Wade, 1984). This work is often based on studies which rely upon secondary data gathered for other purposes using diverse measures and variables, even when capturing similar concepts. Relying on secondary data often makes synthesis difficult (Poteete et al., 2010) as existing data are often limited in their scope and scale, and are separated into independent databases using unique coding schema and storage structures which are not always made publicly available. These limitations and divisions hamper synthesis efforts and comparability. For example, there are a number of data repositories (Table 1) which are based upon the work of Elinor Ostrom and her collaborators. While each of these databases has increased and facilitated new knowledge related to the study of common pool resources, they each possess their own idiosyncrasies, sometimes leading to diverse interpretations of theory, coding schemes, organization, variables, and definitions. Examples of this divergence include databases which focus primarily on a single sector such as forestry or irrigation, a single geographic area, or certain theoretical concepts such as property rights or boundaries. A predominant focus on small-scale systems and the specification of overarching factors like “success” in these types of cases are other examples of problems in consistency and interpretation across studies which are commonly criticized in the literature (Agrawal, 2014; Araral, 2014; Laerhoven and Ostrom, 2007; McGinnis and Ostrom, 2008). In addition, studies often do not disclose sufficient methodological information to replicate, verify or compare findings, such as access to the codebooks, information on case or variable selection, theoretical assumptions, or intercoder reliability testing approaches. These differences and lack of a unified coding methodology (or transparency) have limited synthesis work and the possibility to advance research in common pool resource theory by identifying possible common factors related to biophysical, social, and contextual conditions upon which failure or success depends.
In order to increase coding replicability and transparency, some scholars assert that explicit identification and alignment of the coding rules, organization and work-process knowledge (or coding schema†) used in this type of methodology may be important in mitigating problems of missing data and theoretical ambiguity (MacQueen et al., 1998; Medjedović & Witzel, 2005; Stemler, 2001). In this paper, we critically explore the coding schema and processes utilized during a nine-month meta-analysis of sixty-nine case studies which were
* Acknowledgements: The team would like to acknowledge the support of this project from the National Science Foundation, grant number GEO—1115054. † The term “schema” is defined as the organization and structure for a database as often used in computer programming literature.

2
found to explicitly reference Elinor Ostrom’s (1990) Design Principles (DP), at the Center for Behavior, Institutions and Environment (CBIE)‡ at Arizona State University (ASU). This project draws upon and extends a previous study conducted by Cox et al. (2010), although with somewhat different aims. While the Cox et al. (2010) study focused on possible relationships between individual DPs and social-ecological system (SES) success, our study sought to discover whether there is evidence of the co-occurrence of DPs in relation to either the success or failure of these systems (Baggio et al., this volume). Both research teams drew from the same set of case studies and relied upon the same basic variables. However, differences in the coding processes and assumptions utilized by each team raised fundamental issues regarding the use of meta-analysis that are the focus of this paper. Table 1: Matrix of databases containing SES and/or Commons related datasets
Database Affiliation Case Studies Coding Variables
Codebook Basis
CommonsDB (on long-term dynamics of institutions)1
Utrecht University (collective-action.info)
~1000 cases ~100 variables
Codebook available by request
IAD Framework,
Common Pool Resources (CPR) Database
Indiana University 87 cases currently included in the SES Library at ASU
~600 variables
Original codebook developed by Elinor Ostrom et al. (1987)
IAD Framework
Social-Ecological Systems Governance Database (SESGO)
Martin-Luther University Halle-Wittenberg
Currently no data publicly available
~500 variables
No codebook is available3
SES Framework
International Forestry Resources and Institutions (IFRI) Database
University of Michigan (ifriresearch.net)
233 case studies 600+ variables2
Coding Manual and Forms are publicly available on website
CPR Database, IAD Framework
Nepal Irrigation Institutions and Systems (NIIS) Database
Indiana University 274 cases (not currently publicly available)
600+ variables2
Codebook not currently publicly available
CPR Database, IAD Framework
Social-Ecological Systems (SES) Library
Arizona State University (ASU) (seslibrary.asu.edu)
~130 case studies publicly available
CPR variables
Utilizes the original codebook from the CPR database
IAD Framework and Robustness Framework
Social-Ecological Meta-Analysis Database (SESMAD)
Dartmouth University (sesmad.dartmouth.edu)
Currently 7 case studies are publicly available
125 variables3
Coding schema and variable definitions are publicly available on website
SES Framework
1. The CommonsDB is focused on the long-term dynamics of commons, guilds, waterboards, and benguinages with some historical data going as far back as the 8th Century.
2. The NIIS and IFRI variables are based on the CPR variables with some modifications. 3. Users of the SESMAD database can propose to add their own cases to the database and can also propose to add and/or
combine the SESMAD variables with their own variables within their own case studies.
The aim of this paper is to discuss the methods utilized by our team at ASU to generate the data that is the basis of Baggio et al. (this volume) and Barnett et al. (this volume). We discuss coding process, codebook development, and intercoder reliability testing, and will discuss our ‡ Formerly the Center for the Study of Institutional Diversity (CSID).

3
methodology, some of the issues it raises, and suggest some ways of increasing methodological rigor in this area of study by adopting certain techniques and strategies from disciplines such as anthropology (e.g. content analysis). We hope that by sharing the key methodological challenges and opportunities we discovered that we will stimulate a broader platform for communication and collaboration which will lead to better, more transparent research designs, new opportunities and discoveries that will enhance our understanding of CISs.
2. Coding methodology
In order to increase the replicability and the transparency of the coding process we have created a detailed Coding Manual and a recommended Coding Protocol (see Appendix). A coding protocol is the common set of systematic procedures that a research team agrees to follow during the coding process (Rourke and Anderson, 2004) and a coding manual typically contains the coding questions, answer codes, and information to aid in clarification and coder alignment which embody the research questions being explored in a study (MacQueen et al., 1998). Our coding manual and protocol (see Appendix) are the result of a synthesis between our own coding experience and best practices found in the literature.
One of the primary best practices identified in the literature for inclusion in the design of qualitative content analysis is intercoder reliability testing (Hruschka et al. 2004; MacQueen et al. 1998; Guest and MacQueen 2008, Mayring, 2000). We have found that this important step is often missing from reports on studies of SESs and the commons, but can be helpful when iteratively included throughout the coding process. We compare the methodology we used to the “best practices” for qualitative content analysis as suggested by the literature, which include the following steps (Fig. 1):§ (Hruschka et al., 2004, MacQueen et al. 1998, and Mayring 2000).
1) Formulation of a research question;
2a) Designation and structuring of coding teams;
2b) Identification of a set of data to be analyzed including case selection and text segmentation**;
3) Definition of theoretically based coding schema including categories, definitions, and coding rules/protocols;
4) Preliminary codebook development;
5) Iterative testing of the coding schema on samples of the data and codebook refinement until acceptable intercoder reliability ratings are achieved;
6) Use of the tested coding schema upon the entire data set, including continuous spot testing of intercoder reliability ratings until coding is complete; and
§ The “Best Practices” model described here and illustrated in Figure 1 is adapted from the combination of models offered by Hruschka et al. 2004, MacQueen et al. 1998, and Mayring 2000. ** While there is plentiful literature on the formation of coding teams and identification of data, these steps are often assumed as completed within the literature. We have combined and adapted the methodological models cited in order to explicitly reduce ambiguities in assumptions.

4
7) Analysis and interpretation of the results which may lead to further refinement of the coding schema (Hruschka et al., 2004; Mayring, 2000).

5
Figure 1: Coding process comparison illustrating the process utilized by our team compared to the “best practices” model described above and discussed in further detail in the following sections. 1Pre-coding process; 2 Table 2, this document; Cox et al., 2010; 3 Ostrom et al., 1987.
Best Practices Model (adapted from Hruschka et al., 2004; MacQueen et al., 1998; Guest and MacQueen, 2008; Mayring,
2000; Weed, 2005)
Process used by team at ASU
Formulation of Research Question/Agenda1
Identification of Data Set (Case
selection & Text segmentation)1
Coding Team Formation1
Definition of Coding Schema
Identification of Data Set (Case
selection & Text segmentation) 1:
Predetermined from Cox et al. (2010) data
set
Definition of Coding Schema: Predetermined by expanded DPs2
plus selected CPR variables3
Organization of Relational Database
Theoretical Interpretation of Categories
Formulation of Research Question/Agenda1
Coding Team Formation1
Organization of Relational Database
Theoretical Interpretation of Categories
Codebook Development
Iterative Refinement
Codebook Development
Iterative Refinement
Sample Coding
Intercoder Reliability
Testing Not Acceptable
Intercoder Reliability Testing:
Formal Post Hoc
Sample Coding & Informal
Intercoder Agreement
Testing
Coding of entire dataset
Analyses & Interpretation
of Results
Coding of entire dataset
Analyses & Interpretation
of Results

6
2.1 Coding process
Formulation of the Research Agenda and Definition of Coding Schema
The main objective of the research presented here was to look for combinations of DPs, along with biophysical conditions and technologies (i.e. sector), that increase the likelihood of successful CPR governance. This question was motivated by previous studies (Agrawal, 2001) and our intuitions that the DPs are not independent and likely do not contribute to successful governance in isolation. In addition, we were inspired to expand upon a previous study conducted by Cox et al. (2010), which provided some empirical support for the claim that there is a higher chance for each of Ostrom’s (1990) individual DPs to be present in “successful” cases of SES management across a range of contexts. We also hoped to be able to link the expanded DPs (Table 2) found in Cox et al. (2010) with existing variables found within the existing database for the Common Pool Resources (CPR) Project (Ostrom et al., 1987). Because the DPs and the CPR variables are both based upon the theoretical foundations established by Elinor Ostrom (1990), the effective linking of these variables might establish a precedent for developing and testing a methodology that facilitates the synthesis of separate datasets that are based upon similar theoretical foundations but utilize different coding schema. Larger datasets of comparable cases improve researchers’ ability to use mixed qualitative and quantitative methods, as well as improve analyses across multiple sectors, scales, and time periods, thus potentially enhancing our ability to understand complex system dynamics and adaptation (Poteete et al., 2010).
Case Selection
Case selection is a critical first step in any research design. According to the literature, cases should typically be screened and analyzed for fit within a secondary analysis based on both their applicability to the research questions and data completeness (Hinds et al. 1997; Stemler, 2001; Weed, 2005). For our study, the set of cases from which we drew was pre-determined by those cases previously utilized by Cox et al. (2010). We re-coded sixty-nine of the ninety-one studies presented in Cox et al., limiting our dataset to irrigation, fishery, and forestry sector cases. Ostrom (1987) found exclusion criteria to be extremely important and included careful screening criteria for cases to be included in the CPR project. Our exclusion criteria based on sector was intended as a pragmatic feature of the study design but could not include screening of cases for appropriate quality because the set of cases was pre-determined by the Cox study (2010). However, ambiguities in the assumptions made in previous studies, such as exclusion criteria, can sometimes be a significant problem in secondary analyses. While perhaps more of a problem in analyses and the reporting of findings rather than study designs, these types of ambiguity often contribute to the pervasive problem of incomplete data (Corti et al. 2005; Medjedović & Witzel 2005). Even when studies share the same theoretical basis, individual studies may focus on one part of the theory while ignoring other parts, or may not clearly communicate certain aspects in reporting. Our team found that some of the cases used for the study did not have sufficient information for thorough analysis due to missing data. For example, there were some cases which had sufficient social outcome data but not enough biological data, or vice versa, making the overall determination of success or failure in these cases difficult. Other cases were found to contain ample data on one or two specific DPs but lacked information on the presence or absence of the others. These cases illustrate some the difficulties that may be encountered when utilizing secondary data sources which were collected with different objectives than that of the current study.

7
Text segmentation
A coding protocol generally includes guidelines as to how a text should be segmented for data analysis and coding (Bernard and Ryan 2010, Bernard 2011, Hruschka et al., 2004). The literature recommends that texts be segmented into smaller units to increase intercoder agreement and reliability (Krippendorff, 2013) and decrease coding discrepancies. The segmentation of texts for our study was pre-determined by the division of texts into cases by the Cox et al. (2010) team. Since exclusion criteria and criteria for the segmentation of texts into cases within regional studies was not explicitly reported in the Cox, et al. (2010) publication, we initially debated whether to include or exclude cases based on our own screening criteria, but ultimately decided to limit our study to the same cases that were also evaluated by the Cox team.
Coding team structure
The use of two or more coders is important for assessing the replicability and reliability of the coded data (MacQueen et al. 1998). We divided all cases among eighteen distinct coding teams generally consisting of three coders each. The number of coders sufficient to establish reliability is not agreed upon in the literature and may depend on the level of inference required to identify relevant issues and themes, as well as on the frequency of coding themes and variables which occur in the texts (Bernard and Ryan 2010), i.e., the more coder inference required and/or the rarer that codes appear in texts, the greater the number of coders that should be utilized. Since our coding project involved case studies that reported on SES conditions from a variety of perspectives, utilizing three coders, rather than just two, was an appropriate and beneficial design feature, even though using a higher number of coders may have lowered intercoder reliability ratings.
Theoretical Interpretation of Categories
The primary coding variables used within our study were derived from the expanded design principles defined by the Cox et al. (2010) study (Table 2). It is important to note that in a recent paper discussing the applicability of case studies and meta-analysis to theories on the commons, Araral (2014) points out two distinct specification problems which he found in the Cox et al. (2010) study that may also apply to our study††. Araral’s (2014) first concern is the re-specification of Ostrom’s (1990) DP for clear boundary rules (DP1) into two distinct DPs for user boundaries (DP1A) and resource boundaries (DP1B) (Cox et al. 2010). Araral (2014) asserts that Ostrom (1990) intentionally did not separate the original design principle in this manner because within the “context of collective action in the commons” (p.18), boundaries refer to enforceable property rights, not spatial boundaries. He also points out that the relevant critical literature has previously illuminated that spatially based definitions of community are problematic because the “overlapping, fuzzy and temporal nature of rights” can lead to difficulties in defining community across scales, both spatial and temporal (Araral 2014). Others, however, have suggested that the distinction made by Cox et al. (2010) is a helpful tool in defining clear agent boundaries (Pitt et al., 2012). This illustrates a clear example of differences in theoretical interpretation which can exist between different researchers and which may not
†† The ASU study was being conducted at the time of the writing of Araral’s (2014) paper was not aware of that work at the time of study.

8
only fuel the dialogue within the literature but may also cause significant problems in intercoder agreement and data synthesis.
Table 2: Expanded Design Principle Questions (adapted from Cox et al., 2010) Design Principle Description
1a The presence of the design principle 1A means that individuals or households who have rights to withdraw resource units from the common-pool resource must be clearly defined. Is this design principle present?
1b The presence of the design principle 1B means that the boundaries of the CPR must be well defined. Is this design principle present?
2a The presence of design principle 2A means that appropriation rules restricting time, place, technology, and/or quantity of resource units are related to local conditions. Is this design principle present?
2b The presence of design principle 2B means that the benefits obtained by users from a CPR, as determined by appropriation rules, are proportional to the amount of inputs required in the form of labor, material, or money, as determined by provision rules. Is this design principle present?
3 The presence of design principle 3 means that most individuals affected by the operational rules can participate in modifying the operational rules. Is this design principle present?
4a The presence of design principle 4A means that monitors are present and actively audit CPR conditions and appropriator behavior. Is this design principle present?
4b The presence of design principle 4B means that monitors are accountable to or are the appropriators. Is this design principle present?
5 The presence of design principle 5 means that appropriators who violate operation rules are likely to be assessed graduated sanctions (depending on the seriousness and context of the offense) by other appropriators, officials accountable to these appropriators, or both. Is this design principle present?
6 The presence of design principle 6 means that appropriators and their officials have rapid access to low-cost local arenas to resolve conflicts among appropriators or between appropriators and officials. Is this design principle present?
7 The presence of design principle 7 means that the rights of appropriators to devise their own institutions are not challenged by external governmental authorities. Is this design principle present?
8 The presence of design principle 8 means that appropriation, provision, monitoring, enforcement, conflict resolution, and governance activities are organized in multiple layers of nested enterprises. Is this design principle present?
Araral (2014) also points to the definition of a “successful CPR” as the second specification error of concern. Our team found the defining of success and failure to be difficult and complex and found some significant differences in how success was defined between our study and the Cox et al. (2010) study. Cox, et al. (2010) defined “success” in cases that “reported successful long-term environmental management” (Cox, et al. 2010, p.40). Success in our study was defined in relation to a number of social and ecological outcome variables drawn from the CPR project coding schema (Ostrom et al., 1987), including dimensions of resource sustainability, process of collective choice arrangements, and equity among users. We also utilized CPR variables to augment each DP variable. In total, fifty-seven variables/questions were used, which were divided into theoretical categories for the three dimensions of outcome “success” and each of the eleven expanded design principle categories (Table 3).

9
Table 3: Coding variables/questions and categories Outcomes Variables
Resource Sustainability Process of Collective Choice Arrangements
Equity among users Overall Success/Failure of the CIS
1a & 1b: Quality of units being withdrawn
7a & 7b: Levels of trust among appropriators
10: Disadvantaged appropriators
14: Success or Failure
2a & 2b: Maintenance of public appropriation infrastructure
8: Changes in trust level 11: Harm to those who are worst off
3a & 3b: Maintenance of public distribution infrastructure
9: Rule following 12: Distance between least and most advantaged
4a & 4b: Maintenance of public production infrastructure
13: Changes in the levels of equity among appropriators
5a & 5b: Balance of resource availability and withdrawal
6a: Changes in condition of natural infrastructure
6b: Changes in condition of human-made hard infrastructure
Expanded Design Principle Variables
DP1A DP1B DP2A DP2B DP3 15: Well defined group
17: Spatial Boundary construction
19: Rule flexibility
21: Rule fairness
23: Options to express needs to decision makers
16: Presence or absence of DP
18: Presence or absence of DP
20: Presence or absence of DP
22: Presence or absence of DP
24, 24.1 & 24.2: Chief exec. position
25 & 25.1: Proposed Collective Choice rules
26: Presence or absence of DP DP4A DP4B DP5 DP6 DP7 DP8 27 & 27.1: Records of use
30: Self-monitoring 33: Sanctions vary
35: Arenas for exchange of info
37, 37.1 & 37.2: Right to participate in management
39: Chief exec. report externally
28 & 28.1: Records of resource condition
31 & 31.1: Official guard
34: Presence or absence of DP
36: Presence or absence of DP
38: Presence or absence of DP
40: More than one organization
29: Presence or absence of DP
32: Presence or absence of DP
41: Presence or absence of DP
The problem of specifying success as identified by Araral (2014) may be a fundamental issue within our field and could be partially based on the legacy of shared theoretical roots which may sometimes be taken for granted. The Cox et al. (2010) definitions of success and failure are well aligned with the common definitions found in the literature. Ostrom (1990) defined “success”

10
within CPR governance as those “institutions that enable individuals to achieve productive outcomes in situations where temptations to free-ride and shirk are ever present” (p.15). “Institutions” are the rules, norms, and shared strategies that people use to organize all forms of repetitive and structured interactions at all scales (Ostrom, 2005). When Ostrom talks about “success,” she is referring to successful collective action, essentially referencing the converse of the definition of “failure” used by Cox et al. (2010). Both the Cox et al. (2010) definition and the outcomes variables which we used to construct our definition of success capture this part of Ostrom’s (1990) definition, however, the major difference comes from the inclusion of the temporal idea of “long-term environmental management” (Cox et al. 2010, p.40) which is not included within the outcome variables used in our study. While the idea of long-enduring CPR institutions is also well founded within the literature (Anderies et al., 2004; Cox et al., 2010; Ostrom 1990, 2005; Poteete et al., 2010), we found this to be a difficult concept to assess within a meta-analysis of secondary data, such as this study. While some of the outcome variables used (Variables 1-7) included a temporal qualification of the system as measured by a beginning to an end period of time, many of the cases in the dataset only captured a limited snapshot in time and did not include adequate longitudinal data to indicate the longevity of success within the case. In fact, we found that the outcome variables which included a two-part question aimed at capturing the beginning and end of the study period were problematic and could almost always be effectively reduced to a new outcome variable which captured only whether or not the indicator (such as resource quality) was maintained throughout the time period of the study. By looking more generally at the maintenance of quality over time rather than measured instances of beginning and end qualities, we were better able to assess and construct important take-away messages in analysis such as:
• In forests, success occurred most often when the resource and/or infrastructure were maintained; and when users trusted one another and followed the rules; but did not necessarily imply equity.
• In irrigation systems, success often was achieved on all dimensions, including resource and/or infrastructure maintenance, equity, and helping users in their ability to solve asymmetrical upstream/downstream collective action problems.
• Successful fisheries often included conservation of the resource, following of rules, and sometimes addressed equity issues, but did not necessarily include trust among users.
Ambiguities involved in the specification of variables make it difficult, if not impossible, to reproduce the analysis of a previous study and hinder synthesis and meta-analysis efforts. Furthermore, these types of specification problems are also key drivers of the missing data problem which can plague both analysis efforts and intercoder agreement (Araral, 2014).
Codebook Development and Sample Coding
The variables described above were initially documented in a set of coding questions and were pre-tested on a sample of three cases randomly selected from the existing CPR database to represent each of the sectors included in the study (irrigation, fishery, and forestry). Coding results‡‡ were compared to the existing CPR coding of these cases in order to determine
‡‡ Results from the Sample Coding of the three CPR cases were compared to the original results for those cases contained within the relational database for the CPR Project (Ostrom et al. 1987) and so were comparable with only

11
consistency in theoretical interpretation. Any questions related to the interpretation of variables were discussed and clarified by the entire research team. Coding results were subjected to informal intercoder reliability testing by one of the primary investigators of the project before coding of the entire dataset commenced. Ambiguities and questions that arose during coding were addressed in project meetings, and the answers/clarifications to those issues were incorporated into an informal coding guide and included the original list of 57 coding questions supplemented with explanations and answers derived from coder questions. Although the best practices model (Fig. 1) would call for formal intercoder reliability testing on a subset of the dataset, as well as sample intercoder agreement testing throughout and after the formal coding process, our team only tested coder agreement on the initial sample of CPR test cases. No formal intercoder reliability testing was conducted to “spot-check” coder agreement during the coding process, and official intercoder reliability ratings were not calculated until after coding was completed. Our informal coding guide development process, however, was aimed at establishing an informal feedback loop of intercoder alignment, refinement of theoretical interpretations and iterative adjustments to the coding questions based on ambiguities and questions that arose during coding. Assessment of studies based on coding (Cox, 2014; Ostrom et al., 1993; Wollenberg et al., 2007) suggests that this is a more common practice in our research community than the more formal methods. Hruschka et al., (2004), recognize this consensus based approach toward “interpretive convergence” (p.321) as a potentially useful method for increasing intercoder reliability, but state that more analysis may be needed to determine the validity of this approach.
Coding
The iterative process of team discussion on theoretical interpretations, and iterative refinement of the coding questions and guide continued throughout the coding process. In order to define a DP as present or absent or assign an answer to a CPR variable, coders looked for explicit evidence within the analyzed texts. These selected text segments were then utilized as “evidence” of an appropriate code when mitigating discrepancies between team members to arrive at an agreed-upon group code. It should be noted that no qualitative data analysis (QDA) software was utilized, which has been found to aid in increasing rigor and intercoder reliability during the coding process (Denzin and Lincoln, 2000; Rambaree, 2007). Instead, coders individually coded the texts assigned to them and recorded their coding results, notes and memos in Excel spreadsheets. Where there was consensus between the individual codes on any variable, the same answer was given as the group code for that variable. Any coding disagreements were resolved through group discussion among the coding team members and during project meetings where study PIs addressed unresolved issues. Individual coding sheets were later combined by team and case, after which group codes were added for each coding variable. Final coding results (individual and team) for all cases were later combined into a master Excel spreadsheet.
Coding Team Dynamics
Since there was no established written coding protocol or detailed codebook descriptions for each of the variables, and no qualitative data analysis (QDA) software used, the use of text segments as evidence to support coding results developed organically as teams met to compare those variables extracted from the CPR project (45 variables), not including the “Success” variable or any of the eleven expanded design principle variables.

12
their coding results and was not a consistent methodology among all coders. The conversational group decision process arguably resulted in advantages for coders who were able to more forcefully argue their positions, as well as for those who were better at documenting all instances of text that led them to code a variable in a certain way. The discovery of these differences in coding approach between individual members of the coding team supports the need for explicit rules of coding to increase intercoder agreement and replicability (Stemler, 2001; MacQueen et al., 1998). Select social network analyses was performed with the SNA package in R (Butts, 2007), showing that some coders agreed with the final group code more than others (Table 4). In addition, the dichotomized matrix in Table 5 shows which coders influenced other coders overall, and it is clear that some coders (such as “D”) influenced all other coders while some coders (such as “B”) were influenced more often. Table 4: Coder agreement with group code
A B C D E F G Agreement 273 215 288 298 293 314 302 Total Possible 336 264 348 324 336 324 336 Percentage 0.8125 0.8144 0.8276 0.9198 0.8720 0.9691 0.8988
Table 5: Coder to coder influence matrix: A code of “1” indicates that the coder indicated within the row influenced the coder indicated in the column more often than vice versa.
A B C D E F G A - 1 0 0 1 0 0 B 0 - 1 0 0 0 0 C 0 0 - 0 0 1 1 D 1 1 1 - 1 1 1 E 0 1 1 0 - 0 0 F 1 0 0 0 1 - 1 G 1 1 0 0 1 0 -
2.2 Post Hoc Intercoder reliability testing
The inconsistencies in interpretation and the coding team dynamics discussed above contributed to low intercoder reliability ratings in our coding project. However, these challenges are not insurmountable. They can and should be considered part of a normal coding process and are typical of many similar projects within our field of study. Coder agreement is expected to be low initially, particularly when coding “focuse[s] on identifying and describing both implicit and explicit ideas” (Namey et al., 2008, p.138), such as inferring the presence or absence of DPs to case studies. The fact that many of the case studies were lengthy texts may have further contributed to marginal intercoder agreement. In order to address such discrepancies in coder interpretation, the literature recommends coding several iterations of subsets of the data by question and/or text segment, followed by formal reliability testing (percent agreement and a Kappa statistic that takes chance into account), and iterative codebook revisions, until acceptable intercoder reliability ratings have been reached (MacQueen et al., 2008; Hruschka et al., 2004; Bernard, 2011). Once intercoder reliability ratings are in the acceptable range, the team codes the entire dataset. Additional reliability tests are recommended throughout the coding process to prevent “coder drift” or “code favoritism” (Carey and Gelaude, 2008 p.251).

13
As previously discussed, no formal intercoder reliability ratings within our coding teams were calculated during the coding process. Because there was a sense among coders that intercoder agreement was not high, post hoc calculations of intercoder reliability ratings were subsequently performed to examine the overall intercoder agreement by team, but also to determine which coding variables were more difficult to identify within the texts (see Baggio, et al., this volume).
Data preparation
In order to unify the coding data and minimize bias due to incompatible comparisons, cases which did not include the standard three-coder-team were eliminated from the intercoder reliability analysis, including five cases reported in Spanish and coded by only two coders. Furthermore, since intercoder reliability ratings require a comparison of more than one case per team, the four groups that only coded one case study together were also removed from the dataset, leaving a total of thirteen coding groups and sixty cases. Individual coding results were extracted from the group coding spreadsheets (Fig. 2) for each coder and case in order to create individual spreadsheets for these groups with the group coding results removed.
SECDESC Cox Case Group Coder 1a.BEGQUAL 1b.ENDQUAL NotesQUAL 2a.BEGCONDA
Rural coastal fishing village 50km south of Mombasa, Kenya
1 AEN A -‐1 -‐1
It says the stocks decline but does not mention the quality of the
fish.
-‐2
Rural coastal fishing village 50km south of Mombasa, Kenya
E -‐1 4
pg. 2773 mentions the decline of fish
stocks in the area
-‐2
Rural coastal fishing village 50km south of Mombasa, Kenya
N -‐1 3 -‐1
Rural coastal fishing village 50km south of Mombasa, Kenya
Group -‐1 -‐1 -‐1
Figure 2: Excerpt of coding results by case study, coder and team. Team coding is highlighted in grey, blue indicated disagreement between coders which was resolved by group agreement.
The coding values utilized in the project were nominal and varied significantly. Although the bulk of the codes were structured in binary format (0/1 – absence/presence), coders could also code a value of (-1) to indicate that the information was “missing in case (MIC)” or (-2) to indicate that the question was not applicable to the examined text. Additionally, many of the variables testing for environmental and social conditions included values that were on a scale from 1 (extremely good) to 5 (extremely poor), with a majority of codes also allowing code value combinations, e.g., “1, 2 = extremely high or high” or “4,5 = poor or extremely poor” where exact condition could not be determined but generally good or poor conditions could be sufficiently determined. To address this coding value complexity, the following steps were necessary:

14
• Coding values of (-2) were converted to (-1) values. Whether information was missing or not applicable to a text is arguably a semantic issue. In either event, the coder determined there was not enough information to answer that particular question. Reducing variability in this area is likely not to result in a bias, but leaving it in will reduce intercoder agreement due to coder subjectiveness and/or coding mistakes, e.g., two coders feel there is not enough information to answer the question, but one uses code (-1) and the other (-2) resulting in a lack of agreement where there really is none.
• In instances where coding values were given as range of values (e.g. (4,5) or (1,2), the comma was removed from the coding values, thereby converting the coding results to simple numbers, i.e. (4,5) was converted to 45 and (1,2) to 12. This modification is justified since it does not bias the results but prevents programming errors during intercoder reliability testing.
Ultimately, eleven spreadsheets were created for each coding team. Each spreadsheet contained each coder’s coding value for each variable in the set for each of the case studies assigned to that particular team (Fig. 3).
A B C D E F G
VarCase Var142 Var143 Var144 Var145 Var146 Var147 A 1 1 1 0 0 0 C 1 1 1 0 0 0 H 1 1 1 0 0 0
Figure 3: Example of coding team results by variable and case study
Intercoder reliability testing
After all 143 spreadsheets were created (13 teams x 11 variable groups), formal intercoder reliability testing could be conducted. Feng (2014) provides guidance on selecting the appropriate intercoder testing statistic. For coding projects involving >2 coders and coding values that are nominal and multiple (i.e., not binary), Feng recommends Krippendorff’s alpha, Fleiss’ kappa, and/or percent agreement (2014, p.1812, Table 4). Krippendorff’s alpha is a reliability coefficient that is a “generalization of several known reliability indices” (Krippendorff, 2013, p.1). Its advantage lies in its ability to calculate intercoder agreement among an indefinite number of coders and any number of scale values. It can handle missing and incomplete data, as well as large and small sample sizes (Krippendorff, 2013; Bernard and Ryan, 2010). Although not widely used because many statistical packages do not include it, Krippendorff’s alpha is considered a robust measure of intercoder reliability. Fleiss’ kappa is a variant of the popular Cohen’s kappa statistic which allows for more than two coders (Bernard and Ryan, 2010). Similar to Krippendorff’s alpha, Fleiss is a statistic that measures “how much better than chance” the agreement is among a group of coders (Bernard, 2011, p.448). Finally, although simple percent agreement tends to overestimate intercoder reliability because it does not account for chance agreement (Hruschka et al., 2004; Feng, 2014), it is appropriate to utilize this technique in conjunction with other measures if the variables analyzed are nominal (Feng, 2014). Moreover, simple percent agreement provides a good yardstick to determine whether the intercoder reliability ratings obtained through Krippendorff and Fleiss may be skewed due to particularly high agreement or missing variables.
Var147 = Variable 14 (Success) + Case Study #7

15
Utilizing the irr-package in R (Gamer et al., 2012), intercoder agreement for all three statistics was calculated for all 11 variable groups in each of the 13 coding teams (see Table 6 for excerpt and the Appendix for complete intercoder reliability ratings and R code). It should be noted that the original intent was to perform intercoder reliability testing on a dataset that included all the coding values, including (-1: missing in case), as well as on a dataset from which the missing values were excluded. However, due to a large proportion of (-1) coding values in some of the case studies, replacing them with “NA” generated erroneous intercoder reliability ratings which hindered the elimination of missing values in the process. The high number of (-1) values may be attributed to multiple factors, including ambiguities in the examined texts, and the lack of a formal codebook. Although it is important to further investigate the cause of the high number of (-1) values, doing so extends beyond the purpose of this paper. It should also be noted that Fleiss’s kappa generated several error messages in instances in which neither Krippendorff’s alpha nor simple percent agreement indicated any errors.
Table 6: Excerpt of intercoder reliability testing results (all statistics). Values for Krippendorff’s alpha and Fleiss’ kappa range between 0 and 1, with 1 demonstrating perfect agreement between coders and 0 indicating agreement that is consistent with chance, i.e., the absence of reliability. Negative alpha values signify coder agreement that is below chance (Krippendorff, 2008).
Coding Team Variable Group Krippendorff values Fleiss values Percent agreement
ACH env 0.603 0.602 80.60 ACH soc 0.693 0.692 68.80 ACH success 1.000 1.000 100.00 ACH DP1 0.261 0.256 33.30 ACH DP2 0.327 0.322 37.50 ACH DP3 0.387 0.384 64.30 ACH DP4 0.591 0.590 59.30 ACH DP5 -0.138 -0.149 50.00 ACH DP6 -0.241 -0.258 16.70 ACH DP7 0.389 0.385 50.00 ACH DP8 -0.274 -0.286 33.30 CHN env 0.636 0.634 66.70 CHN soc 0.507 0.503 45.80 CHN success -0.063 -0.125 66.70 CHN DP1 0.635 0.630 83.30 CHN DP2 0.584 0.578 66.70 CHN DP3 0.657 0.654 71.40 CHN DP4 0.551 0.548 63.00 CHN DP5 0.802 0.799 88.90 CHN DP6 0.773 0.766 83.30 CHN DP7 0.895 0.893 91.70 CHN DP8 0.438 0.427 55.60 EHU env 0.384 0.381 75.00 EHU soc 0.285 0.280 54.20 EHU success 0.292 0.250 33.30 EHU DP1 0.624 0.618 75.00 EHU DP2 0.560 0.554 66.70
Krippendorff (2013) recommends drawing study conclusions only from coded variables with reliabilities above 0.800, although variables with reported reliabilities in the range of 0.667

16
to 0.800 could be used to draw tentative conclusions. Landis and Koch (1977) outlined a set of values that mark different agreement levels based on the value of Fleiss’ kappa: <0.00 Poor; 0.00-0.20 slight; 0.21-0.40 fair, 0.41-0.60 moderate, 0.61-0.80 substantial, and 0.81-1.00 almost perfect. Generally, researchers consider kappa values of >0.80 as evidence of high reliability, and values in the range of 0.70 to 0.79 are deemed acceptable, however, these standards are “ad hoc” and still evolving” (Bernard and Ryan, 2010). The desired range of value for simple percent agreement is ≥ 85% (MacQueen et al., 2008). As previously outlined, in our study, simple percent agreement values were used solely to assess the robustness of the other two coder agreement statistics.
Before evaluating whether coding agreement reached high (>0.80) or acceptable (0.70 to 0.79) levels of reliability, simply adding the Krippendorff and Fleiss values by variable group and coding team provides a first insight into those variable groups/teams with high/low scores. As Figures 4 through 7 reveal DP1 (clearly defined boundaries) and coding team “AEN” as those with the highest intercoder agreement. In contrast, DP8 (nested governance) and team “ACH” had the lowest intercoder agreement. For codebook and coding protocol development purposes, such initial high/low values can be important bellwethers of particularly well or poorly functioning coding questions/teams which require further investigation in order to strengthen intercoder agreement across all variables and teams.
Variable Group Sum of Krippendorff DP1 8.462 DP2 6.431 DP3 8.043 DP4 7.813 DP5 7.136 DP6 6.416 DP7 7.543 DP8 5.626 env 6.812 soc 6.662
success 7.370 Figure 4: Sum of Krippendorff values by variable group for all coded cases. Results indicate that generally DP1 had the highest overall intercoder agreement and DP8 the lowest.
Variable Group Sum of Fleiss DP1 8.409 DP2 6.352 DP3 8.008 DP4 7.784 DP5 7.065 DP6 5.258 DP7 7.474 DP8 4.519 env 6.785 soc 6.621
success 5.003
Figure 5: Sum of Fleiss values by variable group for all coded cases. Results are similar to Krippendorff values further confirming DP1 as the variable with the highest intercoder agreement and DP8 with the lowest.
0 2 4 6 8
10
Sum of Krippendorff by Variable Group
0
2
4
6
8
10
Sum of Fleiss by Variable Group

17
Team Sum of Krippendorff
ACH 3.598 ACU 4.055 ADU 6.545 AEN 8.078 AEU 6.473 AHU 6.749 ANU 5.947 CDE 7.324 CDU 5.006 CHN 6.416 DEU 5.792 DHN 6.831 EHU 5.500
Figure 6: Sum of Krippendorff values by coding team/all cases coded. Results reflect highest coder agreement for team AEN and lowest coder agreement for team ACH.
Team Sum of Fleiss ACH 3.538 ACU 3.910 ADU 5.422 AEN 8.059 AEU 6.443 AHU 6.592 ANU 5.827 CDE 5.292 CDU 3.949 CHN 6.307 DEU 5.722 DHN 6.816 EHU 5.401
Figure 7: Sum of Fleiss values by coding team/all cases coded. Results are similar to Krippendorff values confirming highest coder agreement for team AEN and lowest for team ACH.
The initial findings from the simple summary calculations are further confirmed by evaluating the mean and median values of the intercoder agreement scores. Additionally, the mean/median values reveal significant skewing of the data for variables success, DP5, DP6, and less so for DP2 and DP3 (Fig. 8) as well as for many of the coding teams (Fig. 9). Although the skewing is replicated in a similar fashion in the mean/median simple percent agreement values for success, DP5, DP6, DP2, and DP3, it is not evident in the simple percent agreement values for the coding teams indicating that these distortions may be due to coding team dynamics, not missing values or other factors. In the case of the success variable, programming errors generated no Fleiss ratings in two cases which serves to further bias the statistics. An in-depth discussion of these discrepancies goes beyond the scope of this paper and will be addressed at a later time.
Despite the informal nature of our coding process and the aforementioned problems, many of the intercoder agreement ratings were >0.65 for both Krippendorff and Fleiss statistics. As outlined above, scores >0.80 evidence high data reliability, and values in the range of 0.70 to 0.79 indicate acceptable intercoder reliability (Bernard and Ryan 2010). This places our data reliability/replicability factor only slightly below the 0.70 score that is generally deemed as acceptable in the literature. Given the high level of inference required to determine some of the
0 1 2 3 4 5 6 7 8 9
ACH ACU ADU AEN AEU AHU ANU CDE CDU CHN DEU DHN EHU
Sum of Krippendorff by Team
0 1 2 3 4 5 6 7 8 9
ACH ACU ADU AEN AEU AHU ANU CDE CDU CHN DEU DHN EHU
Sum of Fleiss by Team

18
variables, the large number of missing values, and the ad hoc nature of our coding process, such ratings are defensible for the completed project and may easily be improved in the future through the use of a detailed codebook and coding protocol. More importantly, by disclosing our intercoder reliability ratings, procedures, preliminary codebook and coding protocol, we have taken additional steps to enhance the ability of others to analyze and replicate our findings.
Figure 8: Mean and median values by variable group for Krippendorff and Fleiss statistics.
Figure 9: Mean and median values by coding team for Krippendorff and Fleiss statistics.
0
0.1
0.2
0.3
0.4
0.5
0.6
0.7
0.8
0.9
DP1 DP2 DP3 DP4 DP5 DP6 DP7 DP8 ENV SOC SUCCESS
Mea
n &
Med
ian
Valu
es (K
rippe
ndor
ff &
Fle
iss)
Variable Groups
Intercoder Reliability Testing Mean & Median Values by Variable Group
Krippendorff mean value Krippendorff median value (p50) Fleiss mean value Fleiss median value (p50)
0
0.1
0.2
0.3
0.4
0.5
0.6
0.7
0.8
ACH ACU ADU AEN AEU AHU ANU CDE CDU CHN DEU DHN EHU
Krip
pend
orff
& F
leis
s Va
lues
Coding Teams
Intercoder Reliability Testing Mean and Median Values by Coding Team
Krippendorff mean value Krippendorff median value (p50) Fleiss mean value Fleiss median value (p50)

19
Coder Drift
Coder drift, or code favoritism, is the process over time, in which coders can become less reliable in their coding due to “sloppiness in applying coding criteria or adoption of idiosyncratic coding biases” (Bartholomew et al., 2000 p.303). This is part of the normal coding process and the reason why it is recommended that spot checking of coder agreement continue throughout the coding process, particularly in large coding projects (Carey and Gelaude, 2008). In our coding project, such spot checks may have mitigated some of the ambiguity with regard to coders’ assessment of whether or not a case study was deemed “successful”. After coding was completed and intercoder reliability ratings performed, discussion among coders revealed that there may have been some coder drift which may have produced inconsistencies in the way that coders applied information within the text to answer the question of overall success (Question 14). Random sampling of the answers given to question 14 as well as purposive sampling of ten cases revealed notes that indicated several coders may have considered more than the outcomes variables in answering. However, in all but two cases, coders were in agreement with their assessment of the studies overall success or failure, regardless of the potential for coder drift. In the two instances of coder drift where there was no initial coder agreement, the coders were able to resolve the disagreement through discussion. As outlined throughout this paper, a codebook containing detailed coding descriptions that is iteratively updated to include coder questions and coding ambiguities, as well as continuous spot-checking of intercoder agreement might have resolved these instances of coding bias.
3. Discussion and Conclusions
The libraries of data that have been compiled on CISs and the commons over the past several decades represent a rich and mostly unexploited resource of information that could be exploited to increase our understanding of common pool resources via meta-analysis and comparison with contemporary data (Corti et al., 2005). Secondary analysis of existing case studies has the advantage of being a relatively low cost approach compared to primary data collection and analysis. Further, by basing studies on an ensemble of secondary data, we are able to gather more information allowing wider comparison and, in turn, further increase our understanding of CPRs and CISs in general (Kelder, 2005; Savage, 2005). Meta-analysis and the use of synthesized datasets allows for the use of existing data in new ways including mixed qualitative and quantitative methods and analyses across multiple time periods, scales and sectors, thereby potentially improving researchers’ ability to understand complex system dynamics and adaptation (Cox, 2014; Kelder, 2005; Ostrom, 1990, 2012; Poteete et al., 2010). Araral (2014) and Agrawal (2014) characterize this type of work in the study of the commons as the “emerging third generation” of research within the legacy of Elinor Ostrom, and see these efforts to generalize and extend her arguments across scales and with increased complexity as being of “fundamental importance” (Agrawal, 2014, p.87). Agrawal (2014) asserts that furthering this research will require methodological innovation, better theoretical sophistication and improved data. Furthermore, he states that the use of new methods involving more qualitative analysis and experimentation are the current drivers pushing the field forward. However, the successful use of these new methods will depend upon substantial amounts of new data, better integration of data, a sophisticated hierarchical organization of datasets, and increased analytical rigor (Agrawal, 2014).

20
Because meta-analysis of this type is a relatively new methodological approach in social science research (Corti et al., 2005), some authors argue that there has not yet been enough published research looking at the issues it may raise (Corti and Thompson, 2004). We have found, however, that the approach has been utilized often enough to generate some critical analyses (Araral, 2014; Corti et al., 2005; Kelder, 2005) which offer guidance and identify valid issues of concern involved in the use of this type of methodology. Furthermore, we find that enduring issues within the norms of current coding practices in commons research are two-fold: (1) very few publications disclose specific methodological information extending beyond the identification of coding themes and/or variables used; and (2) even fewer studies report intercoder reliability ratings or some informal process by which the reliability of coding outcomes can be assessed. Problems associated with ambiguous or missing information based on unreported assumptions, like those discussed here, hamper the replicability of study findings and undermine the reliability and validity of such research. The overall discourse of any area of research is always a work in progress and case studies and comparative analysis done in isolation may be disputed or later found to be wrong. Meta-analysis offers the opportunity to refine findings within a wider community, discover what the dominant discourses are and generate new knowledge through the validation and synthesis of previous findings. In addition, there may be issues of confirmatory bias or non-representative sampling involved in the selection of cases for secondary analyses, even when they contain sufficient levels of information. In order to advance the intra- and inter-institutional analysis of data, more rigorous standards should be established, such as common standards and protocols and the explicit reporting of assumptions. Even without consensus on standards or protocols, however, selection criteria should be made more transparent by research teams in order to facilitate the emergence of common practices and increased methodological rigor in social-ecological systems science in general. The conducting and reporting of intercoder reliability is also critically important, as is the disclosure of coding variables and codebooks which can facilitate better meta-analysis of data. The resource of CIS and commons data that exists can, itself, be viewed as a commons and institutions which govern the proper and productive use of these resources could effectively reduce the externalities which the private property dataset approach now generate.
Kelder (2005) succinctly explains why it is important for all researchers, but especially those using and creating secondary data, to explicitly consider and document their assumptions and interpretations throughout the process of coding and data analysis, when she states that “these elements soon become familiar and ‘disappear’ from the researcher’s consciousness, and the record provides the context for the collection of data that informs later analysis” (p.6). Kelder further explains how incompleteness or lack of this type of information creates ambiguities that have consequences in any potential future research or utilization of the data. These problems are acutely reflected in our coding project. Agrawal (2014) argues that scholars of the commons have not clearly differentiated between different measures, dimensions, and outcomes but have relied upon the use of relatively vague terms like “sustainability”, “success”, and “long-term viability” instead. As previously discussed, the tendency to not disclose supplementary coding information and the failure to perform intercoder reliability ratings inhibits a deeper examination of the study findings by other researchers, including the replication and cross-comparison of the data. A possible explanation for the reluctance to assess coder agreement in some branches of social science is provided by Hruschka et al. (2004): (1) researchers may generally believe that the quantification of qualitative data is unnecessary because qualitative research is a “distinct

21
paradigm” that cannot or should not be subject to a quantitative evaluation; and (2) a general skepticism about the ability to actually measure subjective data and reproduce coding results.
We argue that full data disclosure and intercoder reliability rating protocols are important because qualitative research often generates complex information that is difficult to process and can lead to judgments based on “intuitive heuristics” (Hruschka et al., 2004). Even if one is inclined to believe that qualitative data analysis should not be quantified, it is helpful to know that two or more persons are generally able to glean the same information from the same text. It is precisely the subjective nature of the evaluations which makes them more susceptible to individual interpretation and the intentional or unintentional introduction of biases, random errors, and other distortions (Krippendorff, 2013; Hruschka et al., 2004). The establishment of a coding protocol and intercoder reliability testing regime represents an effort to “reduce the error and bias” (Hruschka et al., 2004) in text analysis by ensuring that the data meaning remains consistent across a variety of coders and research teams. In fact, it can be argued that coding is an essential element of classical content analysis because it converts qualitative data into datasets that are supportive of robust analyses which can be replicated by other scholars (Krippendorff, 2013). Replicability creates greater reliability which empirically grounds confidence in the data and, thus, the study findings (Krippendorff, 2013). In addition, we found that utilizing two or more coders increases data reliability because coding agreement between different people, who have been given the same instructions and have independently coded the same segments of text, demonstrates a reduction of subjective biases and increases trustworthiness (Guest and MacQueen, 2008). Depending on the code values (nominal/binary or ordinal/variable) and number of coders utilized, there are a variety of intercoder reliability statistics available to calculate coder agreement. Since each method has its drawbacks, however, it is considered best practice to utilize more than one intercoder reliability technique (Feng, 2014). Coding team dynamics may be a concern, however, which may be mitigated through the use of more rigorous coding protocols and coder training.
The study of coupled infrastructure systems (CIS) and the dynamics that affect human-environment interactions are varied across spatial and temporal scales and are extremely important to understanding and coping with many of the issues we now face as a global society. Many scholars, like Agrawal (2014) and Araral (2014), see these current trajectories within CIS research as fundamental and critical, yet at their infancy. Araral (2014) argues that Ostrom’s theories may only be applicable to the special-case of locally governed, small-scale commons may not be easily generalized but recognizes that the body of evidence collected within Ostrom’s legacy has thus far not much extended beyond these types of commons. We question whether there has yet been a sufficiently sizable body of data gathered and analyzed, including information on larger-scale systems, multi-scalar governance structures, temporal dimensions, and other important factors with which to compare the existing studies, or if there are any sufficiently developed methods by which to conduct such comparisons. It was one of Ostrom’s (2005) deep convictions that beneath the coupled human and natural infrastructure processes are a set of universal building blocks which could be tapped to create adaptive and long-enduring governance systems. Work towards creating a methodology that will foster cooperation and cross-comparison of data could allow us to expand our understanding of these systems. By sharing our coding experience and protocols, we hope to stimulate the development transparency norms within the commons research community which others may build upon as we move further toward the identification of these universal building blocks. It is important to continue

22
pushing social-ecological science towards greater rigor and a greater understanding of the complex interactions that lead to successful outcomes. Towards this goal, we assert that methodology must be tested and refined for more precise measurement of the dependent and independent variables involved in CISs. Furthermore, the commons research community should work to ensure that studies are replicable and that different research teams are able to achieve similar answers. In conclusion, while there may be many challenges and opportunities associated with the coding and synthesis of case studies, increased collaboration and consensus in a few key areas within the research community may lead to new horizons and possibilities in understanding CISs and the commons.
Literature cited
Anderies, J.M., M.A. Janssen, E. Ostrom.2004. A Framework to Analyze the Robustness of Social-Ecological Systems from an Institutional Perspective.Ecology and Society. 9(1):18
Agrawal, A. 2001. Common Property Institutions and Sustainable Governance of Resources. World Development, 29(10), 1649-1672. doi:10.1016/S0305-750X(01)00063-8.
Agrawal, A. 2014. Studying the Commons, Governing Common-Pool Resource Outcomes: Some Concluding Thoughts. Environmental Science & Policy 36(2014):86-91.
Araral, E. 2014. Ostrom, Hardin and the Commons: A Critical Appreciation and a Revisionist View. Environmental Science & Policy 36(2014):11-23.
Baggio, J.A., A. Barnett, I. Perez-Ibarra, U. Brady, E. Ratajczyk, N. Rollins, C. Rubiños, H. Shin, D. Yu, R. Aggarwal, J.M. Anderies, M.A. Janssen. 2015. The Puzzle of Good Governance: Putting the Pieces Together through the Lens of Ostrom’s Design Principles. International Journal of the Commons, this volume.
Baland, J.M., and J.P. Platteau. 1999. The ambiguous impact of inequality on local resource management. World Development 27(5):773-788.
Bardhan, P., and D. Mookherjee. 2006. Decentralization and local governance in developing countries: a comparative perspective (Vol. 1). Cambridge, MA: MIT Press.
Barnett, A.J., J. Baggio, H. Shin, D. Yu, I. Perez-Ibarra, C. Rubiños, U. Brady, E. Ratajczyk, N. Rollins, R. Aggarwal, J.M. Anderies, and M.A. Janssen. 2015. Contextualizing the Commons in a World of Interdependency: Qualitative Analysis of Quantitative Inconsistencies. International Journal of the Commons, this volume.
Bartholemew, K., A.J.Z. Henderson, and J.E. Marcia. 2000. Coded Semi-Structured Interviews in Social Psychological Research. Pages 286-312 in Reis, H.T., and C.M. Judd (Eds.). Handbook of Research Methods in Social and Personality Psychology. Cambridge, MA. Cambridge University Press.
Berkes, F. 1989. Common property resources: ecology and community-based sustainable development. London, U.K.: Belhaven Press.
Bernard, H.R. 2011. Research Methods in Anthropology: Qualitative and Quantitative Approaches. Fifth Edition. Plymouth, United Kingdom: Altamira Press.
Bernard, H.R. and G.W. Ryan. 2010. Analyzing Qualitative Data: Systematic Approaches. Thousand Oaks, CA: Sage Publications, Inc.
Butts CT. 2007. Carter’s Archive of S Routines for the R Statistical Computing Environment: Tools for Social Network Analysis. Retrieved from http://erzuli.ss.uci.edu/R.stuff.
Carey, J.W., D. Gelaude.2008. Systematic Methods for Collecting and Analyzing Multidisciplinary Team-Based Qualitative Data. Pages 227-274 inG. Guest, and K.M. MacQueen (Eds.). Handbook for Team-Based Qualitative Research. Lanham, MD: Altamira Press.
Corti, L., and P. Thompson. 2004. Secondary Analysis of Archived Data. In C. Seale, G. Gobo, J.F. Gubrium, and D. Silverman (Eds.), Qualitative Research Practice (pp.327-343). London: Sage.

23
Corti, L., A. Witzel, and L. Bishop. 2005. On the Potentials and Problems of Secondary Analysis: An Introduction to the FQS Special Issue on Secondary Analysis of Qualitative Data. Forum: Qualitative Social Research (FQS) 6(1):Art.49.
Cox, M. 2014. Understanding Large Social-Ecological Systems: Introducing the SESMAD Project. International Journal of the Commons 8(2):265-276.
Cox, M., G. Arnold, and S. Villamayor-Tomas. 2010. A Review of Design Principles for Community-Based Natural Resource Management. Ecology and Society 15(4).
Denzin, N.K., and Y.S. Lincoln. 2000. Handbook of qualitative research (2nd Ed.). Thousand Oaks, CA: Sage Publications, Inc.
Epstein, G., Nenadovic, M., and A. Boustany. 2014. Into the deep blue sea: Commons theory and international governance of Atlantic Bluefin Tuna. International Journal of the Commons. 8(2).
Feng, G.C. 2014. Intercoder reliability indices: disuse, misuse, and abuse. Qual. Quant. 48:1803-1815.
Fleischman, F.D., Loken, B., Garcia-Lopez, G.A., and S. Villamajor-Tomas. 2014. Evaluating the utility of common-pool resource theory for understanding forest governance and outcomes in Indonesia between 1965 and 2012. International Journal of the Commons. 8(2).
Gamer, M., J. Lemon, and P. Singh. 2012. irr: Various Coefficients of Interrater Reliability and Agreement. Retrieved from http://cran.r-project.org/web/packages/irr/index.html.
Guest, G. and K.M. MacQueen. 2008. Reevaluating Guidelines in Qualitative Research. Pages 205-226 in G. Guest and K.M. MacQueen (Eds.). Handbook for Team-Based Qualitative Research. Lanham, MD. Altamira Press.
Hinds, P.S., R.J. Vogel, and L. Clarke-Steffen. 1997. The Possibilities and Pitfalls of Doing a Secondary Analysis of a Qualitative Data Set. Qualitative Health Research 7:408.
Hruschka, D. J., D. Schwartz, D.C. St.John, E. Picone-Decaro, R. Jenkins, and J.W. Carey. 2004. Reliability in Coding Open-Ended Data: Lessons Learned from HIV Behavioral Research.Field Methods. 16(3):307–331.
Kelder, J. 2005. Using Someone Else’s Data: Problems, Pragmatics and Provisions. Forum: Qualitative Social Research (FQS) 6(1):Art.39.
Krippendorff, K. 2008. Systematic and Random Disagreement and the Reliability of Nominal Data. Communication Methods and Measure. 2(4):323-338.
Krippendorff, K. 2013. Content Analysis: An Introduction to Its Methodology. Third Edition. Thousand Oaks, CA: Sage Publications, Inc.
Laerhoven, F. and E. Ostrom. 2007. Traditions and trends in the study of the commons. International Journal of the Commons 1(1):3-28.
Landis, J.R. and G.G. Koch. 1977. The Measurement of Observer Agreement for Categorical Data. Biometrics. 33:159-174.
MacQueen, K. M., E. McLellan, K. Kay, and B. Milstein. 1998. Codebook Development for Team-Based Qualitative Analysis. Field Methods, 10(2):31–36.
MacQueen, K. M., E. McLellan-Lemal, K. Bartholow, B. Milstein. 2008. Team-based Codebook Development: Structure, Process, and Agreement. Pages 119-135inG. Guest, and K.M. MacQueen (Eds.). Handbook for Team-Based Qualitative Research. Lanham, MD: Altamira Press.
Mayring, P. 2000. Qualitative Content Analysis. Forum: Qualitative Social Research (FQS) 1(2):Art.20.
McGinnis, M. and E. Ostrom. 2008. Will lessons from small-scale social dilemmas scale up? New issues and paradigms in research on social dilemmas (p.189-211). New York, NY: Springer.

24
McKean, M. 1992. Success on the commons: A comparative examination of institutions for Common property resource management. Journal of theoretical politics 4(3):247-281.
Medjedović, I., and A. Witzel. 2005. Secondary analysis of interviews: Using codes and theoretical concepts from the primary study. Forum: Qualitative Social Research 6(1):Art.46.
Namey, E., G. Guest, L. Thairu, and L. Johnson. 2008. Data Reduction Techniques for Large Qualitative Data Sets. Pages 137-161 in Guest,G. and MacQueen, K.M. (Eds.). Handbook for Team-Based Qualitative Research. Lanham, MD: Altamira Press.
Netting, R. McC. 1976. What alpine peasants have in common: observations on communal tenure in a Swiss village. Human Ecology 4:135-146.
Ostrom, E. 2012. Why do we need to protect institutional diversity? [keynote lecture]. European Political Science 11(2012):128-147.
Ostrom, E. 2005. Understanding Institutional Diversity. Princeton, N.J. Princeton University Press.
Ostrom, E. 1990. Governing the Commons: the Evolution of Institutions for Collective Action. Cambridge, MA: Cambridge University Press.
Ostrom, E., P. Benjamin, and G.P. Shivakoti. 1993. Use of Case Studies and Structural Coding in a Relational Database for Storage and Analysis of Irrigation Institutions and Systems. Proceedings of an International Workshop held at the Institute of Agriculture and Animal Science (IAAS). Retrieved from http://dlc.dlib.indiana.edu/dlc/handle/10535/7996.
Ostrom, E., E. Schlager, S.Y. Tang, and L. Anderson. 1987. Common pool resource project. Unpublished manuscript. Tempe, AZ: Center for the Study of Institutional Diversity. Arizona State University.
Pitt, J., J. Schaumeier, and A. Artikis. 2012. Axiomatization of Socio-Economic Principles for Self-Organizing Institutions: Concepts, Experiments and Challenges. ACM Transactions on Autonomous and Adaptive Systems 7(4):Art.39.
Poteete, A. R., M. A. Janssen, and E. Ostrom. 2010. Working Together: Collective Action, the Commons, and Multiple Methods in Practice. Princeton, NJ: Princeton University Press.
Rambaree, K. 2007. Bringing rigour in qualitative social research: the use of CAQDAS. University of Mauritius Research Journal 13(A):1-16. Retrieved from http://www.gfmer.ch/GFMER_members/pdf/CAQDAS_Rambaree_2007.pdf.
Rourke, L., and T. Anderson. 2004. Validity in quantitative content analysis. Educational Technology Research and Development 52(1):5-18.
Savage, M. 2005. Revisiting Classic Qualitative Studies. Forum: Qualitative Social Research 6(1):Art.31.
Stemler, S. 2001. An overview of content analysis. Practical Assessment, Research & Evaluation. 7(17): 137-146.
Villamayor-Tomas, S., Fleischman, F.D., Perez Ibarra, I., Thiel, A., and F. van Laerhoven. 2014. From Sandoz to Salmon: Conceptualizing resource and institutional dynamics in the Rhine watershed through the SES framework. International Journal of the Commons. 8(2).
Wade, R. 1984. Irrigation reform in conditions of populist anarchy: an Indian case. Journal of Development Economics 14(3):285-303.
Weed, M. 2005. “Meta Interpretation”: A Method for the Interpretive Synthesis of Qualitative Research. Forum: Qualitative Social Research 6(1):Art.37.
Wollenberg, E., L. Merino, A. Agrawal, and E. Ostrom. 2007. Fourteen years of monitoring community-managed forests: learning from IFRI’s experience. International Forestry Review 9(2):670-684.

APPENDIX: Challenges and opportunities in coding the Commons: problems,
procedures, and potential solutions in large-N comparative case studies
Contents:
Coding Manual page 2
Introduction page 3
Coding Protocol page 4
Definition of Key Concepts and Terms page 9
References page 10
Coding Variable Descriptions page 11
Coding Questions page 81
Intercoder Reliability Testing page 91
Summary (split by groups and variables) page 92
Detailed Results: All Teams page 96
R Script page 110

CENTER FOR BEHAVIOR, INSTITUTIONS & THE ENVIRONMENT
(CBIE)
CODING MANUAL
(Version 2)1
NOTE: BASED ON OUR CODING EXPERIENCE, WE BELIEVE THIS CODING
MANUAL REPRESENTS AN IMPORTANT FIRST STEP TOWARDS A MORE
STANDARDIZED CODING METHODOLOGY FOR THE TEXT ANALYSIS OF
SECONDARY DATA. HOWEVER, THIS MANUAL HAS NOT BEEN FULLY
REVIEWED OR TESTED AND SHOULD NOT BE CITED OR DISTRIBUTED
WITHOUT THE AUTHORS’ EXPRESS PERMISSION.
Original authors: Ute Brady and Elicia Ratajczyk
Acknowledgments: This coding manual has benefited greatly from the intellectual
contributions, comments, edits, and support of Marco Janssen, J. Marty Anderies, and the
original CBIE2 project coding team members: Jacopo Baggio, Allain Barnett, Irene Perez Ibarra,
David Yu, Cathy Alida Rubiños, Hoon Shin, and Nathan Rollins.
We would also like to acknowledge the Cox, et al. (2010) study from which the revised design
principle structure utilized in this manual was borrowed.
Finally, and most importantly, this coding manual aspires to be an extension of Elinor “Lin”
Ostrom’s (August 7, 1933 - June 12, 2012) work. It is her extraordinary scholarship in common
pool resource governance and institutional theories that has provided the foundation, as well as
the inspiration, to create this open source codebook. Furthermore, many of the key elements
contained in the 1987 Common-Pool Resource Project created by Lin Ostrom, Edella Schlager,
and Shui Yan Tang are included in this manual, and we hereby extend our gratitude and
appreciation for their work.
The coding manual is a part of the Social-Ecological System (SES) Library at Arizona State
University which is funded by National Science Foundation grants BCS-0527744 and SES-
0645789.
1 Original version: March , 2015; revised July 8, 20152 Formerly known as the Center for the Study of Institutional Diversity (CSID)

2
Table of ContentsIntroduction..................................................................................................................................... 3
SES Library................................................................................................................................. 3
Coding Protocol .............................................................................................................................. 4
Step One: Preliminary Considerations........................................................................................ 4
Case Selection......................................................................................................................... 4
Text Segmentation .................................................................................................................. 4
Coding Team Structure ........................................................................................................... 4
Qualitative Data Analysis (QDA) Software ........................................................................... 4
Step Two: Test Coding .............................................................................................................. 5
Detailed Coding Variable Descriptions .................................................................................. 5
Codebook Evolution through Collaboration........................................................................... 6
Recommended Test Coding Procedure................................................................................... 6
Step Three: Intercoder Reliability Testing.................................................................................. 6
Calculation of Intercoder Agreement...................................................................................... 6
Determining Acceptable Intercoder Reliability Ratings......................................................... 7
Concluding Remarks....................................................................................................................... 7
Contributors .................................................................................................................................... 8
Definition of Key Concepts and Terms .......................................................................................... 9
References..................................................................................................................................... 10
Coding Variable Descriptions....................................................................................................... 11

3
IntroductionThis coding manual is an open source document which can be accessed and used by researchers,
students, and practitioners engaged in the analysis of social-ecological or other coupled
infrastructure systems (CIS). It builds directly on the work of Elinor Ostrom, Edella Schlager, and
Shui Yan Tang who, in 1987, created the common-pool resource (CPR) coding database which
has become a part of the Social-Ecological Systems (SES) Library. The original CPR variables,
codebook, and case studies are available for review and use at the SES Library’s website
[https://seslibrary.asu.edu/seslibrary/welcome].
SES LibraryThe SES Library is located within ASU's Center for Behavior, Institutions & the Environment
(CBIE3) which was founded in the summer of 2006 by Elinor “Lin” Ostrom (August 7, 1933 -
June 12, 2012) as a sister center to the Vincent and Elinor Ostrom Workshop in Political Theory
and Policy Analysis at Indiana University.
CBIE, and by extension the SES Library, emerged from the collaborative work between Lin
Ostrom, Marty Anderies, and Marco Janssen after their first meeting at a Resilience Alliance
workshop in Stockholm in 2000. The core of the SES Library consists of 86 case studies that were
initially coded by Lin Ostrom, Edella Schlager and Shui Yan Tang of Indiana State University in
the 1980s. The primary goal of the coding analysis project was to gain an understanding of the
conditions present in successful social-ecological systems (SES). In 1990, Lin Ostrom utilized the
information gleaned from these cases in her seminal work “Governing the Commons” to identify
the eight design principles present in successful, long-enduring common pool governance systems
and to provide an alternative framework of collective action based on empirical observations. This
work was a clear departure from the standard theory of the time which argued that only
privatization or governmental regulation could prevent a tragedy of the commons (Hardin 1968).
In “Governing the Commons,” Ostrom proved that in many SESs resource users were able to
successfully govern their common resources over time. The Institutional Analysis and
Development (IAD) Framework was one of the extensions of that work and provided a theoretical
basis from which to systematically study institutional arrangements. It was this work that won Lin
Ostrom the Nobel Prize for Economics in 2009.
The SES Library continues to be an integral part of the larger innovative cyber-infrastructure of
the CBIE. At its core remain the 86 case studies coded by Schlager and Tan under the guidance of
Lin Ostrom. These cases can be accessed directly through the SES Library’s main page, and the
original coding results are available through the SES Library's Common Pool Resource (CPR)
database. We encourage users to make use of the SES Library resources, including this coding
manual. However, more importantly, we ask that you consider contributing new case studies to
the SES Library and provide us with your comments and suggestions to the detailed codebook
descriptions provided herein. As we will elaborate further below, we hope that such collaborative
efforts will move commons theory towards identifying the universal building blocks underlying
the diversity of interactions, institutions, and other linked human-environment interactions that are
described within these case studies, as Elinor Ostrom argued would be possible (Ostrom 2005).
3 Formerly known as Center for the Study of Institutional Diversity (CSID)

4
Coding ProtocolThis is the recommended Coding Protocol of a team of researchers at Arizona State University
following an analysis of the issues raised during a lengthy coding project. For more information
on the reasoning behind the establishment of this protocol, please reference “Challenges and
opportunities in coding the commons” (Ratajczyk, et al., CBIE Working paper).
Step One: Preliminary Considerations
Case Selection
For more information on case selection, please reference “Challenges and opportunities in coding
the commons” (Ratajczyk, et al., CBIE Working paper).
Text Segmentation
Although data segmentation is largely driven by epistemological considerations, the literature
tends to recommend that a text be segmented into smaller units in order to facilitate better
intercoder agreement and reliability (Krippendorff 2013:101), thereby avoiding an increase in the
“complexity of coding decisions” (Hruschka, et al. 2004:319) and related coding discrepancies.
However, if a researcher is attempting to compare the occurrence of certain themes or variables
across a variety of texts, the whole text is considered the appropriate unit of analysis (Bernard
2011). In either event, text segmentation should be determined and defined prior to proceeding
with coding.
Coding Team Structure
Utilizing two or more coders increases data reliability because coding agreement between different
people, who have been given the same instructions and have independently coded the same
segments of text, demonstrates a reduction of subjective biases within the study findings and
increases trustworthiness (Guest and MacQueen 2008 Chap 10:215).
The question as to how many coders are sufficient to establish data reliability and replicability is
an enduring one without a defined answer. We defer to Bernard and Ryan (2010) who encourage
researchers to examine their data for two criteria: (1) “the level of inference required to identify
themes/coding variables”; and (2) “the prevalence of themes/coding variables” within the texts (p.
306). If coding variables/themes occur frequently, then it is assumed that even inexperienced
coders will find at least one supporting example of the variable within the text. However, if coding
variables are assumed to be rare and/or difficult to identify due to the high level of inference
required to recognize codes within the texts, researchers are encouraged to use more coders to
ensure that rare and important themes are not missed.
Since most, although not all, of the data analyzed in the study of the commons is derived from
secondary data sources, and the analyses requires examining the texts for the presence and absence
of theoretical design principles requiring at times a high level of coder inference, we recommend
utilizing 3 coders. However, we also acknowledge that time and budget constraints often drive
these considerations. As a result, this coding protocol also supports coding projects utilizing
coding teams of two.
Qualitative Data Analysis (QDA) Software
Although coders can enter their coding results in Excel spreadsheets, such a process is tedious,
time-consuming, difficult to verify over time, and subject to entry error. This can, in part, be
attributed to the fact that coders are unable to tag and assign codes to the text directly. Instead,
utilizing spreadsheets requires coders to either independently keep track of the segment of text that

5
supports a particular code, and/or manually enter the supporting text passage in a separate column
of the spreadsheet. This complicates the coding process and increases coding errors due to issues
such as failure to keep track of supporting text, losing documentation, and entering supporting
information in the wrong field of the spreadsheet. In contrast, QDA software facilitates the
marking and tagging of texts with codes, eliminating the need to manually keep track of supporting
text passages. Furthermore, most QDA software facilitates blind-coding by different coders and
the subsequent merging of codes from various coders into a final document for further detailed
analysis of coding discrepancies, including intercoder reliability ratings. We do not specifically
endorse a particular QDA software, but recommend teams take advantage of free trial periods to
test individual programs’ usefulness prior to commencing coding. The guidelines in this coding
protocol should be broad enough to support a variety of code tracking setups, including, if
necessary, spreadsheets.
Step Two: Test Coding
Detailed Coding Variable Descriptions
The coding variables provided with this coding protocol are a synthesis of coding questions
developed by Lin Ostrom, Edella Schlager, and Shui Yang Tan during their CPR coding project
in the mid to late 1980s, as well as additional variables created by members of the CBIE team
during a large-scale coding project in 2013-2014. For further information on the coding project,
please reference “Challenges and opportunities in coding the commons” (Ratajczyk, et al., CBIE
Working paper).
In order to describe the coding variables in enough detail so that coders are independently able to
identify and tag a code in texts, each coding variable (question) utilized in the 2013-2014 coding
project was given a one-page detailed explanation in the following ten-component format:
Code title and name (e.g. Code 13: Equity level over time)
Variable name: provides the code mnemonic and the coding question it relates to (e.g.
BEGCONDP (Question #4a)
Theory area: identifies the underlying theory to which the variable is linked (e.g.,
Outcomes – Resource Sustainability).
Short description: short phrase that communicates to the coder what the coding variable is
looking for (e.g., condition of public production infrastructure at beginning of time)
Detailed description: Detailed explanation as to what information the coding variable is
looking for.
Inclusion criteria: List features or conditions that would automatically require that a text
segment be coded with this specific variable.
Exclusion criteria: List specific features or conditions that would automatically exclude a
text segment from being coded with this variable.
Typical exemplars: Typical examples of instances where a particular code would apply.
Atypical exemplars: Examples of less common instances where a particular code would
apply.
Close, but no: Examples of ambiguous instances where coders may feel that the code
applies, but it does not.
(MacQueen, et al. 2008 Chap 6:121-122, Bernard & Ryan 2010).

6
Codebook Evolution through Collaboration
Codebook development is a dynamic and ongoing process, and the attached codebook descriptions
are provided as an initial pool of variables to utilize. This is a living document! It is designed to
evolve. Accordingly, we invite and welcome contributions, comments, corrections, criticism, and
suggestions from others; both researchers and practitioners alike. It is our hope that these variables
provide the fertile ground from which, over time, the seeds of collaboration will grow those
variables that are most meaningful and applicable to cross-sectoral and/or cross-scalar analyses.
Recommended Test Coding Procedure
Following MacQueen, et al.’s (2008) recommendation, we encourage users of this
codebook to review the attached coding variables with their respective coding teams until
everyone is familiar with the codes.
The next step is for the principal investigator and members of the coding team to
independently test code a subset of the data (either select case studies or passages of text
from within designated case studies).
Test coding should be followed up with an assessment of intercoder agreement (at
minimum simple percent agreement which is, ideally, compared to an intercoder reliability
statistic that takes chance into account, such as Krippendorff’s alpha or Cohen’s/Fleiss’
kappa).
Based on the intercoder reliability ratings and feedback from the coding team, the
codebook variables should be revised to address ambiguities and problems.
Once the coding descriptions have been revised, iterative rounds of test coding are
conducted with subsequent intercoder reliability testing and coding variable adjustments
until acceptable intercoder agreement has been reached (MacQueen, et al. 2008 Chap
6:130-131; Hruschka 2004:325, Bernard 2011:448). (For more information on acceptable
intercoder agreement ratings, see the “Intercoder reliability statistics” section below).
Once acceptable intercoder reliability ratings have been reached, the team codes the entire
dataset.
To ensure continued coding reliability, we recommend that the principal investigator
continue spot-checking intercoder reliability throughout the entire coding process in order
to prevent “coder drift” or “coder bias” (Carey and Gelaude 2008 Chap 11:251). Codebook
revisions should also continue throughout the coding process, as necessitated by coder
questions and requests for clarification.
Step Three: Intercoder Reliability TestingAs outlined above, intercoder reliability testing is important in the test coding phase to identify
and mitigate any coder questions and/or ambiguities in the coding variable descriptions. Spot-
checking coder reliability throughout the coding process is necessary to prevent coder bias/drift
from setting in and affecting coding outcomes. Once the entire dataset has been coded, formal
intercoder reliability ratings on the entire coding project should be calculated to determine the
overall agreement among coders. For more information on intercoder reliability statistics, please
reference “Challenges and opportunities in coding the commons” (Ratajczyk, et al., CBIE Working
paper).
Calculation of Intercoder Agreement
The open source statistical program R (R Core Team 2013) has programming scripts to calculate
all three statistics outlined above. We have modified these scripts to facilitate intercoder
agreement of all three statistics for the attached variables utilizing the irr-package in R (Gamer, et

7
al. 2012), and these scripts are available for download through the SES Library. Users will need
to set up matrices as follows in order for R to be able to calculate the statistics:
Determining Acceptable Intercoder Reliability Ratings
Please reference “Challenges and opportunities in coding the commons” (Ratajczyk, et al., CBIE
Working paper).
Concluding RemarksBy providing this coding protocol, we hope to create a collective action forum in which scholars,
students, and practitioners can come together and collaboratively develop a more unified
methodological approach to the analysis of complex SES/CIS. We believe that the tendency to
not disclose supplementary coding information and the reluctance to perform intercoder
reliability ratings creates a positive feedback loop that inhibits a deeper examination of the study
findings across institutions and fields of study, including the replication and cross-comparison of
data. It was one of Lin Ostrom’s deep convictions that beneath the vast diversity of regularized
coupled human-built and natural infrastructure processes lies a set of universal building blocks
which can be tapped to create adaptive and long-enduring governance systems (Ostrom 2005:5-
6). As admirers of her teachings and followers of her theories, we at CBIE owe it to her to work
towards creating a methodology that will foster cooperation and cross-comparison of the data we
collect and analyze. By sharing our coding protocol, we are sharing what we believe is a useful
tool for others to utilize, criticize, improve upon, but above all as a means of collaboration. In
doing so, we hope to move the field forward to tackle some of the world’s most intractable
problems. We invite you to join us in this endeavor.

8
ContributorsUte Brady, Center for Behavior Institutions and Environment, School of Human Evolution
and Social Change, Arizona State University.
Elicia Ratajczyk, Center for Behavior Institutions and Environment, School of Human
Evolution and Social Change, Arizona State University.

9
Definition of Key Concepts and TermsAppropriation
Appropriation infrastructure
Coupled infrastructure system
De facto
De jure
Distribution infrastructure
Infrastructure
Production infrastructure
Provision
Social-ecological system
Success

10
ReferencesBernard, H.R. (2011). Research Methods in Anthropology: Qualitative and Quantitative
Approaches. Fifth Edition. Altamira Press. Plymouth, United Kingdom.
Bernard, H.R. and G.W. Ryan (2010). Analyzing Qualitative Data: Systematic Approaches. Sage
Publications, Inc. Thousand Oaks, CA. United States.
Carey, J.W., D. Gelaude (2008). Systematic Methods for Collecting and Analyzing
Multidisciplinary Team-Based Qualitative Data. Pages 227-274 in G. Guest, and K.M.
MacQueen (Eds.). Handbook for Team-Based Qualitative Research. Altamira Press.
Lanham, MD. United States.
Cox, M., G. Arnold, and S. Villamayor-Tomas (2010). A Review of Design Principles for
Community-Based Natural Resource Management. Ecology and Society 15(4).
Gamer, M., J. Lemon, and P. Singh (2012). irr: Various Coefficients of Interrater Reliability and
Agreement. Retrieved from http://cran.r-project.org/web/packages/irr/index.html.
Hardin, G. (1968). The Tragedy of the Commons. Science. 162(3859):1243-1248.
Hruschka, D. J., D. Schwartz, D.C. St. John, E. Picone-Decaro, R.A. Jenkins, and J.W. Carey
(2004). Reliability in Coding Open-Ended Data: Lessons Learned from HIV Behavioral
Research. Field Methods, 16(3), 307–331. doi:10.1177/1525822X04266540.
MacQueen, K. M., E. McLellan-Lemal, K. Bartholow, B. Milstein (2008). Team-based
Codebook Development: Structure, Process, and Agreement. Pages 119-135 in G. Guest,
and K.M. MacQueen (Eds.). Handbook for Team-Based Qualitative Research. Altamira
Press. Lanham, MD. United States.
Ostrom, E. (2005). Understanding Institutional Diversity. Princeton, N.J. Princeton University
Press.
Ratajczyk, E., U. Brady, J.A. Baggio, A. Barnett, I. Perez-Ibarra, N. Rollins, C. Rubiños, H.
Shin, D. Yu, R. Aggarwal, J.M. Anderies, M.A. Janssen. 2014. Challenges and
opportunities in coding the commons: problems, procedures, and potential solutions in
the coding of case studies. CBIE Working Paper. Center for Behavior, Institutions, and
the Environment. Arizona State University.
R Core Team (2013). R: A language and environment for statistical computing. R Foundation for
Statistical Computing, Vienna, Austria. ISBN 3-900051-07-0. URL: http://www.R-
project.org/.

CODING VARIABLE DESCRIPTIONS

OUTCOMES: RESOURCE SUSTAINABILITY

Code 1a: Resource quality – initial condition
Variable Name BEGQUAL (Question #1a)
Theory Area Outcomes – Resource Sustainability
Short Description Quality of units withdrawn at the beginning of the time period
examined.
Detailed Description Characterize the quality of common pool resource units withdrawn
at the beginning of the time period examined in the text. Quality is
defined as the amount of effort involved in resource extraction.
Considering the way in which the units are used, how would you
evaluate the resource quality?
(1) Extremely high quality
(2) High quality
(12) Extremely high or high quality
(3) Passable
(4) Poor quality
(5) Extremely poor quality
(45) Poor or extremely poor quality
(99) MIC
(98) NA
Inclusion criteria
(when to use)
Discussion by the author as to the quality of the resource units being
withdrawn at the beginning of the time period examined. If the
author does not outline a historical time period for resource quality,
code “99” in answer to this question, and then evaluate the
contemporary quality of the resource unit as described by the author
in answer to #1b.
Exclusion criteria
(when not to use)
These variables generally do not apply to irrigation cases, unless the
text specifically provides information regarding water pollution,
including increasing turbidity and/or salinity levels.
Typical exemplars Fishermen are able to easily fish target species with minimal effort.
Fodder is readily available in sufficient quantities to forest
community members.
Atypical exemplars Strong genetic diversity of Salmon species, which reduces the
likelihood of genetic bottlenecks, and improves the adaptive
capacity of the species. Discussions indicating that the age-class
structure is maintained, which indicates that the resource users are
not taking too many adults, which could result in a loss of
reproductive capacity in the species.
Close but no The economic value or quality of a resource unit. This may
indicated strong genetic diversity, or age-class structure, but cannot
be inferred without some data indicating that the economic value is
related to these resource quality indicators.

Code 1b: Resource quality – end condition
Variable Name ENDQUAL (Question #1b)
Theory Area Outcomes – Resource Sustainability
Short Description Quality of units withdrawn at the end of the described time period.
Detailed Description Characterize the quality of common pool resource units withdrawn
at the end of the time period examined in the text. Quality is
defined as the amount of effort involved in resource extraction.
Considering the way in which the units are used, how would you
evaluate the resource quality?
(1) Extremely high quality
(2) High quality
(12) Extremely high or high quality
(3) Passable
(4) Poor quality
(5) Extremely poor quality
(45) Poor or extremely poor quality
(99) MIC
(98) NA
Inclusion criteria
(when to use)
Discussion by the author as to the quality of the resource units
being withdrawn at the end of the time period examined. If the
author does not outline a historical time period for resource quality,
evaluate the contemporary quality of the resource unit as described
by the author in answer to this question.
Exclusion criteria
(when not to use)
These variables generally do not apply to irrigation cases, unless the
text specifically provides information regarding water pollution,
including increasing turbidity and/or salinity levels. [Took this
from our coding sheet, but I am not sure this is accurate?]
Typical exemplars Fishermen are able to easily fish target species with minimal effort.
Fodder is readily available in sufficient quantities to forest
community members.
Atypical exemplars Strong genetic diversity of Salmon species, which reduces the
likelihood of genetic bottlenecks, and improves the adaptive
capacity of the species. Discussions indicating that the age-class
structure is maintained, which indicates that the resource users are
not taking too many adults, which could result in a loss of
reproductive capacity in the species.
Close but no The economic value or quality of a resource unit. This may
indicated strong genetic diversity, or age-class structure, but cannot
be inferred without some data indicating that the economic value is
related to these resource quality indicators.

Code 2a: Appropriation infrastructure – initial condition
Variable Name BEGCONDA (Question #2a)
Theory Area Outcomes – Resource Sustainability
Short Description Condition and maintenance of public appropriation infrastructure at the
beginning of the described time period.
Detailed Description Characterize the condition of the public appropriation infrastructure at
the beginning of the time period examined in the text. In consideration of
the construction and physical environment of the public appropriation
infrastructure and the financial and technological capabilities of the
appropriators, how well maintained is the appropriation infrastructure?
Appropriation is defined as harvesting/extraction activities.
Public appropriation infrastructure is defined as the infrastructure within
which the allocation of the flow of resource units from the resource
system to the appropriators takes place. Public appropriation
infrastructure can be natural, human-made (physical), or a combination of
natural and human-made infrastructures.
(1) Well maintained - excellent working order
(2) Moderately well maintained - good working order
(12) From well to moderately well maintained
(3) Some- infrastructure deterioration occurring due to insufficient
maintenance
(4) Considerable infrastructure deterioration occurring due to poor
maintenance
(34) Some or considerable infrastructure deterioration due to insufficient
or poor maintenance
(5) Considerable infrastructure deterioration, but due to a natural disaster
(99) MIC
(98) NA
Inclusion criteria
(when to use)
Discussion by the author as to the condition of the public appropriation
infrastructure at the beginning of the time period examined. Assess the
allocation of the flow of resource units from the resource system and the
described allocation conflict between appropriators.
If the author does not outline a historical time period for the appropriation
infrastructure, code “99” for this question, and then evaluate the
contemporary condition of the appropriation infrastructure as described
by the author in answer to #2b.
In cases where a major natural disaster occurs and damages the resource
beyond the appropriators’ or responsible agents’ capability to prevent and
repair, immediately code “5”.
Exclusion criteria
(when not to use)
Institutional arrangements (soft infrastructure) governing resource
extraction, such as catch limits, seasonal closure rules, size and age limits,
etc. Private appropriation infrastructure, such as individually owned
vessels and gear, water pumps, or cattle (?)
Typical exemplars Weir or gate used in an irrigation system to direct water from the
canal/river to the agricultural field. Public auction halls and markets
provided at ports. Publically funded fishing ports for accessing fisheries.
Atypical exemplars Kicking a hole in the side of a dirt canal to direct water onto field.
Close but no In Japan they sunk a series of large concrete blocks into a seabed to stop
scallop trawlers from trawling the area (if they tried, they would destroy
their gear). This would thus be, a conservation tool, but not an
appropriation infrastructure.

Code 2b: Appropriation infrastructure – end condition
Variable Name ENDCONDA (Question #2b)
Theory Area Outcomes – Resource Sustainability
Short Description Condition and maintenance of public appropriation infrastructure at the
end of the described time period.
Detailed Description Characterize the condition of the public appropriation infrastructure at
the end of the time period examined in the text. In consideration of the
construction and physical environment of the public appropriation
infrastructure and the financial and technological capabilities of the
appropriators, how well maintained is the appropriation infrastructure?
Appropriation is defined as harvesting/extraction activities.
Public appropriation infrastructure is defined as the infrastructure within
which the allocation of the flow of resource units from the resource
system to the appropriators takes place. Public appropriation
infrastructure can be natural, human-made (physical), or a combination of
natural and human-made infrastructures.
(1) Well maintained - excellent working order
(2) Moderately well maintained - good working order
(12) From well to moderately well maintained
(3) Some- infrastructure deterioration occurring due to insufficient
maintenance
(4) Considerable infrastructure deterioration occurring due to poor
maintenance
(34) Some or considerable infrastructure deterioration due to insufficient
or poor maintenance
(5) Considerable infrastructure deterioration, but due to a natural disaster
(99) MIC
(98) NA
Inclusion criteria
(when to use)
Discussion by the author as to the condition of the public appropriation
infrastructure at the end of the time period examined. Assess the
allocation of the flow of resource units from the resource system and the
described allocation conflict between appropriators.
If the author does not outline a historical time period for the appropriation
infrastructure, then evaluate the contemporary condition of the
appropriation infrastructure as described by the author in answer to #2b.
In cases where a major natural disaster occurs and damages the resource
beyond the appropriators’ or responsible agents’ capability to prevent and
repair, immediately code “5”.
Exclusion criteria
(when not to use)
Institutional arrangements (soft infrastructure) governing resource
extraction, such as catch limits, seasonal closure rules, size and age limits,
etc. Private appropriation infrastructure, such as individually owned
vessels and gear, water pumps, or cattle (?)
Typical exemplars Weir or gate used in an irrigation system to direct water from the
canal/river to the agricultural field. Public auction halls and markets
provided at portsPublically funded fishing ports for accessing fisheries.
Atypical exemplars Kicking a hole in the side of a dirt canal to direct water onto field.
Creation and maintenance of human-made artificial reefs to improve
habitat. Public attempts to improve shellfish recruitment by collecting
“spat,” rearing to a mature stage, and reintroducing into the shellfish beds.
Close but no In Japan they sunk a series of large concrete blocks into a seabed to stop
scallop trawlers from trawling the area (if they tried, they would destroy
their gear). This would thus be, a conservation tool, but not an
appropriation infrastructure.

Code 3a: Distribution infrastructure condition – initial condition
Variable Name BEGCONDD (Questions #3a)
Theory Area Outcomes – Resource Sustainability
Short Description Condition and maintenance of public distribution infrastructure at the
beginning of the described time period.
Detailed Description Characterize the condition of the public distribution infrastructure at the
beginning of the time period examined in the text. In consideration of the
initial construction and physical environment of the public distribution
infrastructure and the financial and technological capabilities of the
appropriators, how well maintained is the distribution infrastructure?
Distribution is defined as the spatial and temporal distribution of resource
units among appropriators.
Public distribution infrastructure is defined as the infrastructure within
which the resource unit flow is distributed among appropriators. The
public distribution infrastructure can be natural, human-made (physical),
or a combination of natural and human-made infrastructures.
(1) Well maintained - excellent working order
(2) Moderately well maintained - good working order
(12) From well to moderately well maintained
(3) Some- infrastructure deterioration occurring due to insufficient
maintenance
(4) Considerable infrastructure deterioration occurring due to poor
maintenance
(34) Some or considerable infrastructure deterioration, insufficient or
poor maintenance
(5) Considerable infrastructure deterioration, but due to a natural disaster
(99) MIC
(98) NA
Inclusion criteria
(when to use)
Discussion by the author as to the condition of the public distribution
infrastructure at the beginning of the time period examined. Assess the
spatial and temporal distribution of and access to resource units among
appropriators and the described heterogeneity and uncertainty of the
same.
If the author does not outline a historical time period for the distribution
infrastructure, code “99” for this question, and then evaluate the
contemporary condition of the distribution infrastructure as described by
the author in answer to #3b.
In cases where a major natural disaster occurs and damages the resource
beyond the appropriators’ or responsible agents’ capability to prevent and
repair, immediately code “5”.
Exclusion criteria
(when not to use)
Institutional arrangements (soft infrastructure) governing resource
distribution, such as fishing regulations that give spatially explicit rules
regarding how many fish can be caught and where, designed for the
purpose of maintaining stock and sub-stock metapopulation structure.
Private distribution infrastructure.
Typical exemplars Logging roads, irrigation canals, community saw mill, public refrigeration
storage unit for marine catch, etc.
Atypical exemplars NEED EXAMPLE
Close but no Marine protected areas, which have significant implications for the spatial
distribution of species, but is a soft-infrastructure.
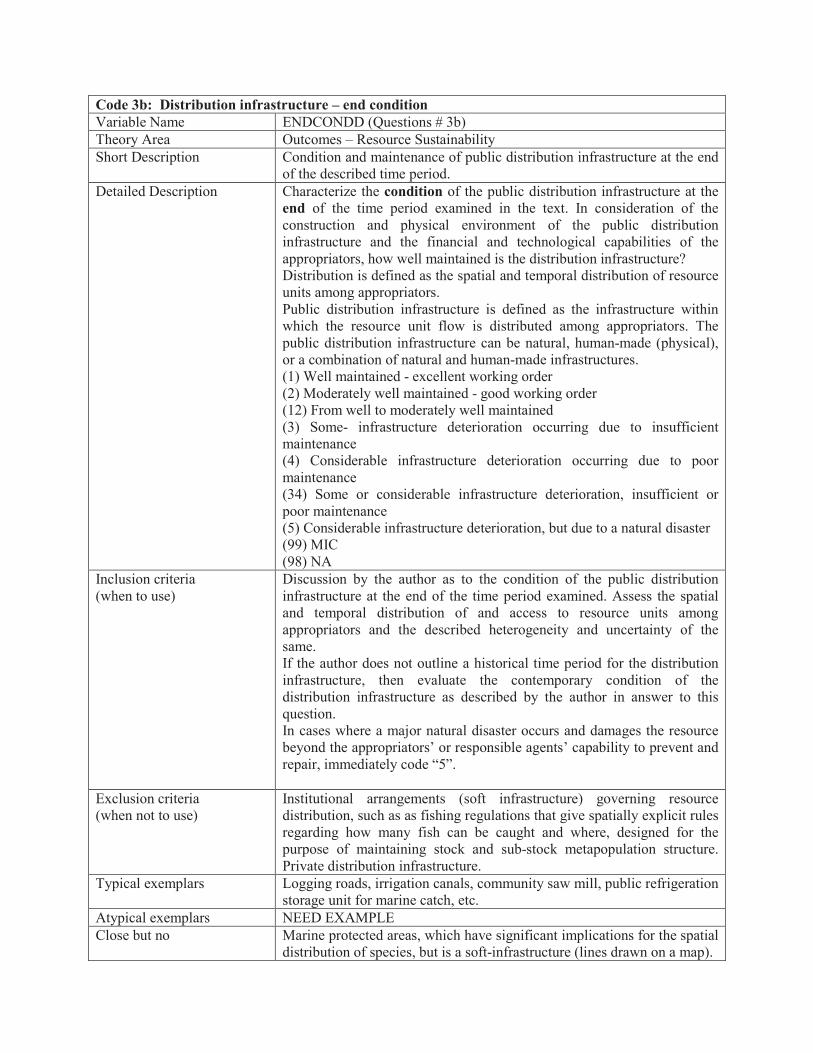
Code 3b: Distribution infrastructure – end condition
Variable Name ENDCONDD (Questions # 3b)
Theory Area Outcomes – Resource Sustainability
Short Description Condition and maintenance of public distribution infrastructure at the end
of the described time period.
Detailed Description Characterize the condition of the public distribution infrastructure at the
end of the time period examined in the text. In consideration of the
construction and physical environment of the public distribution
infrastructure and the financial and technological capabilities of the
appropriators, how well maintained is the distribution infrastructure?
Distribution is defined as the spatial and temporal distribution of resource
units among appropriators.
Public distribution infrastructure is defined as the infrastructure within
which the resource unit flow is distributed among appropriators. The
public distribution infrastructure can be natural, human-made (physical),
or a combination of natural and human-made infrastructures.
(1) Well maintained - excellent working order
(2) Moderately well maintained - good working order
(12) From well to moderately well maintained
(3) Some- infrastructure deterioration occurring due to insufficient
maintenance
(4) Considerable infrastructure deterioration occurring due to poor
maintenance
(34) Some or considerable infrastructure deterioration, insufficient or
poor maintenance
(5) Considerable infrastructure deterioration, but due to a natural disaster
(99) MIC
(98) NA
Inclusion criteria
(when to use)
Discussion by the author as to the condition of the public distribution
infrastructure at the end of the time period examined. Assess the spatial
and temporal distribution of and access to resource units among
appropriators and the described heterogeneity and uncertainty of the
same.
If the author does not outline a historical time period for the distribution
infrastructure, then evaluate the contemporary condition of the
distribution infrastructure as described by the author in answer to this
question.
In cases where a major natural disaster occurs and damages the resource
beyond the appropriators’ or responsible agents’ capability to prevent and
repair, immediately code “5”.
Exclusion criteria
(when not to use)
Institutional arrangements (soft infrastructure) governing resource
distribution, such as as fishing regulations that give spatially explicit rules
regarding how many fish can be caught and where, designed for the
purpose of maintaining stock and sub-stock metapopulation structure.
Private distribution infrastructure.
Typical exemplars Logging roads, irrigation canals, community saw mill, public refrigeration
storage unit for marine catch, etc.
Atypical exemplars NEED EXAMPLE
Close but no Marine protected areas, which have significant implications for the spatial
distribution of species, but is a soft-infrastructure (lines drawn on a map).

Code 4a: Production infrastructure – initial condition
Variable Name BEGCONDP (Question #4a)
Theory Area Outcomes – Resource Sustainability
Short Description Condition and maintenance of public production infrastructure at the
beginning of the time period described.
Detailed Description Characterize the condition of the public production infrastructure at the
beginning of the time period examined in the text (if the production
infrastructure is different from the appropriation or distribution
infrastructure). In consideration of the construction and physical
environment of the public production infrastructure and the financial and
technological capabilities of the appropriators, how well maintained is the
production infrastructure?
Production is defined as the spatial and temporal distribution of resource
units among appropriators.
Public production infrastructure is defined as the infrastructure within
which the resource unit flow is produced. The public production
infrastructure can be natural, human-made (physical), or a combination of
natural and human-made infrastructures.
(1) Well maintained - excellent working order
(2) Moderately well maintained - good working order
(12) From well to moderately well maintained
(3) Some- infrastructure deterioration occurring due to insufficient
maintenance
(4) Considerable infrastructure deterioration occurring due to poor
maintenance
(34) Some or considerable infrastructure deterioration due to insufficient
or poor maintenance
(5) Considerable infrastructure deterioration, but due to a natural disaster
(99) MIC
(98) NA
Inclusion criteria
(when to use)
Discussion by the author as to the condition of the public production
infrastructure at the beginning of the time period examined. Assess the
production of resource units by the appropriators and the described
heterogeneity and uncertainty of the same.
If the author does not outline a historical time period for the production
infrastructure, code “99” in answer to this question, and then evaluate the
contemporary condition of the production infrastructure as described by
the author in answer to #4b.
In cases where a major natural disaster occurs and damages the resource
beyond the appropriators’ or responsible agents’ capability to prevent and
repair, immediately code “5”.
Exclusion criteria
(when not to use)
Institutional arrangements (soft infrastructure) governing production
infrastructure, such as monitoring and sanctioning. Private production
infrastructure.
Typical exemplars River dam, well, pump, water tank
Atypical exemplars Planting trees in a forest, artificial reef? Public attempts to improve
shellfish recruitment by collecting “spat,” rearing to a mature stage, and
reintroducing into the shellfish beds. (e.g. scallop fisheries in Australia,
Bay of Brest, France)
Close but no Sometimes it is argued that we need to remove fish to reduce competition.
So taking more fish means improving production. This is not an argument
for improving production, but for catching more(?)

Code 4b: Production infrastructure – end condition
Variable Name ENDCONDP (Question #4b)
Theory Area Outcomes – Resource Sustainability
Short Description Condition and maintenance of public production infrastructure at the end
of the time period described.
Detailed Description Characterize the condition of the public production infrastructure at the
end of the time period examined in the text (if the production
infrastructure is different from the appropriation or distribution
infrastructure). In consideration of the construction and physical
environment of the public production infrastructure and the financial and
technological capabilities of the appropriators, how well maintained is the
production infrastructure?
Production is defined as the spatial and temporal distribution of resource
units among appropriators.
Public production infrastructure is defined as the infrastructure within
which the resource unit flow is produced. The public production
infrastructure can be natural, human-made (physical), or a combination of
natural and human-made infrastructures.
(1) Well maintained - excellent working order
(2) Moderately well maintained - good working order
(12) From well to moderately well maintained
(3) Some- infrastructure deterioration occurring due to insufficient
maintenance
(4) Considerable infrastructure deterioration occurring due to poor
maintenance
(34) Some or considerable infrastructure deterioration, insufficient or
poor maintenance
(5) Considerable infrastructure deterioration, but due to a natural disaster
(99) MIC
(98) NA
Inclusion criteria
(when to use)
Discussion by the author as to the condition of the public production
infrastructure at the end of the time period examined. Assess the
production of resource units by the appropriators and the described
heterogeneity and uncertainty of the same.
If the author does not outline a historical time period for the production
infrastructure, then evaluate the contemporary condition of the production
infrastructure as described by the author in answer to this question.
In cases where a major natural disaster occurs and damages the resource
beyond the appropriators’ or responsible agents’ capability to prevent and
repair, immediately code “5”.
Exclusion criteria
(when not to use)
Institutional arrangements (soft infrastructure) governing production
infrastructure, such as monitoring and sanctioning. Private production
infrastructure.
Typical exemplars River dam, well, pump, water tank
Atypical exemplars Planting trees in a forest. Artificial reefs. Public attempts to improve
shellfish recruitment by collecting “spat,” rearing to a mature stage, and
reintroducing into the shellfish beds.
Close but no Sometimes it is argued that we need to remove fish to reduce competition.
So taking more fish means improving production. This is not an argument
for improving production, but for catching more. (?)

Code 5a: Resource beginning condition
Variable Name BEGBLNC (Question #5a)
Theory Area Outcomes – Resource Sustainability
Short Description Balance between quantity of units withdrawn and units available at the
beginning of the time period described.
Detailed Description This is an assessment of the beginning balance of the common pool
resource utilized within the action arena during the time period examined
in the text. What is the balance between the quantity of units withdrawn
and the quantity of units needed given the usual patterns of use for these
units? (In fisheries and other biological systems, this is the maximum
sustainable yield (MSY)). )).
(1) Extreme shortage
(2) Moderate shortage
(12) Shortage
(3) Apparently balanced
(4) Moderately abundant
(5) Quite abundant
(45) Abundant
(99) MIC
(98) NA
*In fisheries and other biological systems, this is the maximum
sustainable number of units.
Inclusion criteria
(when to use)
Discussion by the author as to the beginning rate of resource withdrawal.
Does the text provide information as to: (1) rate of withdrawal; and (2)
quantity of units needed. If the author does not outline a historical time
period of resource withdrawal, code “99” in answer to this question, and
then evaluate the current resource withdrawal rate in answer to #5b.
Exclusion criteria
(when not to use)
These variables generally do not apply to irrigation cases, unless the text
specifically provides information regarding water pollution, including
increasing turbidity and/or salinity levels. [Took this from our coding
sheet, but I am not sure this is accurate?]
Typical exemplars “… [the forest was] in a degraded state when NGO started…"
“…although the forest has retained high value timber trees, it exhibits
limited regeneration due to the community's inability to limit damage
from grazing and fire.…”
Any indications of a decline in “Catch per unit effort (CPUE)” in
fisheries, when environmental variable have been ruled out (when/if
possible).
Atypical exemplars Irrigation system is experiencing increased salinity levels due to marine
salt water intrusion caused by excessive groundwater extraction and
decreasing groundwater levels.
Close but no Irrigation case: “…Water distribution involves breaching one of the
shallow ditches to allow water to run down cultivated slopes… 30 to 40
percent of the flow is wasted through inefficient distribution, but there is
enough water to meet most needs in most years…” Declining catch per
unit effort due to changing spatiotemporal patterns caused by climate
change. Herring have declined considerably inshore in the Bay of Fundy,
but it is unclear what has caused the decline, for example.

Code 5b: Resource end condition
Variable Name ENDBLNC (Question #5b)
Theory Area Outcomes – Resource Sustainability
Short Description Balance between quantity of units withdrawn and units available at
the end of the time period described.
Detailed Description This is an assessment of the end balance of the common pool
resource utilized within the action arena during the time period
examined in the text. What is the balance between the quantity of
units withdrawn and the quantity of units needed given the usual
patterns of use for these units? (In fisheries and other biological
systems, this is the maximum sustainable yield (MSY)).
(1) Extreme shortage
(2) Moderate shortage
(12) Shortage
(3) Apparently balanced
(4) Moderately abundant
(5) Quite abundant
(45) Abundant
(99) MIC
(98) NA
*In fisheries and other biological systems, this is the maximum
sustainable number of units.
Inclusion criteria
(when to use)
Discussion by the author as to the end rate of resource withdrawal.
Does the text provide information as to: (1) rate of withdrawal; and
(2) quantity of units needed. If the author does not outline a
historical time period of resource withdrawal, then evaluate the
current resource withdrawal rate in answer to this question.
Exclusion criteria
(when not to use)
These variables generally do not apply to irrigation cases, unless the
text specifically provides information regarding water pollution,
including increasing turbidity and/or salinity levels. [Took this
from our coding sheet, but I am not sure this is accurate?]
Typical exemplars “… [the forest was] in a degraded state when NGO started…"
“…although the forest has retained high value timber trees, it
exhibits limited regeneration due to the community's inability to
limit damage from grazing and fire.…”
Any indications of a decline in “Catch per unit effort (CPUE)” in
fisheries, when environmental variable have been ruled out (when/if
possible).
Atypical exemplars Irrigation system is experiencing increased salinity levels due to
marine salt water intrusion caused by excessive groundwater
extraction and decreasing groundwater levels.
Close but no Irrigation case: “…Water distribution involves breaching one of
the shallow ditches to allow water to run down cultivated slopes…
30 to 40 percent of the flow is wasted through inefficient
distribution, but there is enough water to meet most needs in most
years…”

Code 6a: Natural infrastructure condition over time
Variable Name NATINFRACOND (Question #6a)
Theory Area Outcomes – Resource Sustainability
Short Description Condition of natural infrastructure over time
Detailed Description This is a temporal assessment of the condition of the natural
infrastructure of the common pool resource. Assess whether the
condition of the natural infrastructure over time has improved,
remained the same, or worsened due to the appropriators’ behavior.
(1) Improved
(2) Remained the same
(3) Worsen
(99) MIC
(98) NA
Inclusion criteria
(when to use)
Discussion by the author as to the condition of the natural
infrastructure over time.
Exclusion criteria
(when not to use)
This variable does not apply to non-biological common pool
resources, such as knowledge commons.
Typical exemplars Depletion of fishery and forestry resources. Increasing drought
conditions due to over-allocation of water resources by
appropriators. Overdraft of aquifers and groundwater sources.
Atypical exemplars Fish stock depletion due to commercial activities in international
waters.
Close but no Drought conditions due to conditions beyond the appropriators or
responsible agents’ control and capability to prevent (global climate
change).

Code 6b: Human-made infrastructure condition over time
Variable Name HUINFRACOND (Question #6b)
Theory Area Outcomes – Resource Sustainability
Short Description Condition of human-made infrastructure over time
Detailed Description This is a temporal assessment of the condition of the human-made
hard (physical) infrastructure of the common pool resource. Assess
whether the condition of the human-made physical infrastructure
has improved, remained the same, or worsened over time due to the
appropriators’ behavior.
(1) Improved
(2) Remained the same
(3) Worsen
(99) MIC
(98) NA
Inclusion criteria
(when to use)
Discussion by the author as to the condition of the human-made
hard (physical) infrastructure over time.
Exclusion criteria
(when not to use)
This variable does not apply to soft human-made infrastructure,
such as laws, rules, regulations, etc.
Typical exemplars Deterioration of irrigation canal, public fishing ports/wharves to
access fishing grounds.
Atypical exemplars “Spat” (rearing juvenile scallops to be reintroduced into a bay to
increase survivorship and protect from disease) program, juvenile
fish rearing program
Close but no The Japanese case, (cement blocks used to exclude scallop
trawlers),

OUTCOMES: PROCESS OF COLLECTIVE CHOICE
ARRANGEMENTS

Code 7a: Mutual trust among appropriators – initial condition
Variable Name BEGTRUST (Question #7a)
Theory Area Outcomes – Process of collective choice arrangements
Short Description Level of mutual trust among appropriators at the beginning of the time
period described.
Detailed Description Characterize the described level of mutual trust among appropriators at
the beginning of the time period examined in the text. Mutual trust is
defined as a level of community cohesion that fosters certainty about the
actions of other community members.
(1) Moderate to high level of trust (e.g. oral promises given high
credence)
(2) Modest levels of trust (e.g. oral promises are used but appropriators
may be uncertain about performance)
(12) From moderate to modest levels of trust
(3) Low levels of trust (e.g. oral promises rarely used)
(99) MIC
(98) NA
Inclusion criteria
(when to use)
Discussion by the author as to the level of trust among appropriators at
the beginning of the time period examined. If the author does not outline a
historical time period for trust among appropriators, code “99” in answer
to this question, and then evaluate the contemporary level of trust among
appropriators as described by the author in answer to #7b.
Exclusion criteria
(when not to use)
Distrust of appropriators towards others, such as overarching governing or
administrative bodies, NGO representatives, and people from outside
communities.
Typical exemplars Descriptions of community cohesion, high levels of cooperation, etc.
Atypical exemplars Low frequency of rule infractions
Close but no NEED EXAMPLE

Code 7b: Mutual trust among appropriators – end condition
Variable Name ENDTRUST (Question #7b)
Theory Area Outcomes – Process of collective choice arrangements
Short Description Level of mutual trust among appropriators at the end of the time period
described.
Detailed Description Characterize the described level of mutual trust among appropriators at
the end of the time period examined in the text. Mutual trust is defined as
a level of community cohesion that fosters certainty about the actions of
other community members.
(1) Moderate to high level of trust (e.g. oral promises given high
credence)
(2) Modest levels of trust (e.g. oral promises are used but appropriators
may be uncertain about performance)
(12) From moderate to modest levels of trust
(3) Low levels of trust (e.g. oral promises rarely used)
(99) MIC
(98) NA
Inclusion criteria
(when to use)
Discussion by the author as to the level of trust among appropriators at
the end of the time period examined. If the author does not outline a
historical time period for trust among appropriators, then evaluate the
contemporary level of trust among appropriators as described by the
author in answer to this question.
Exclusion criteria
(when not to use)
Distrust of appropriators towards others, such as overarching governing or
administrative bodies, NGO representatives, and people from outside
communities.
Typical exemplars Descriptions of community cohesion, high levels of cooperation, etc.
Atypical exemplars Low frequency of rule infractions
Close but no NEED EXAMPLE
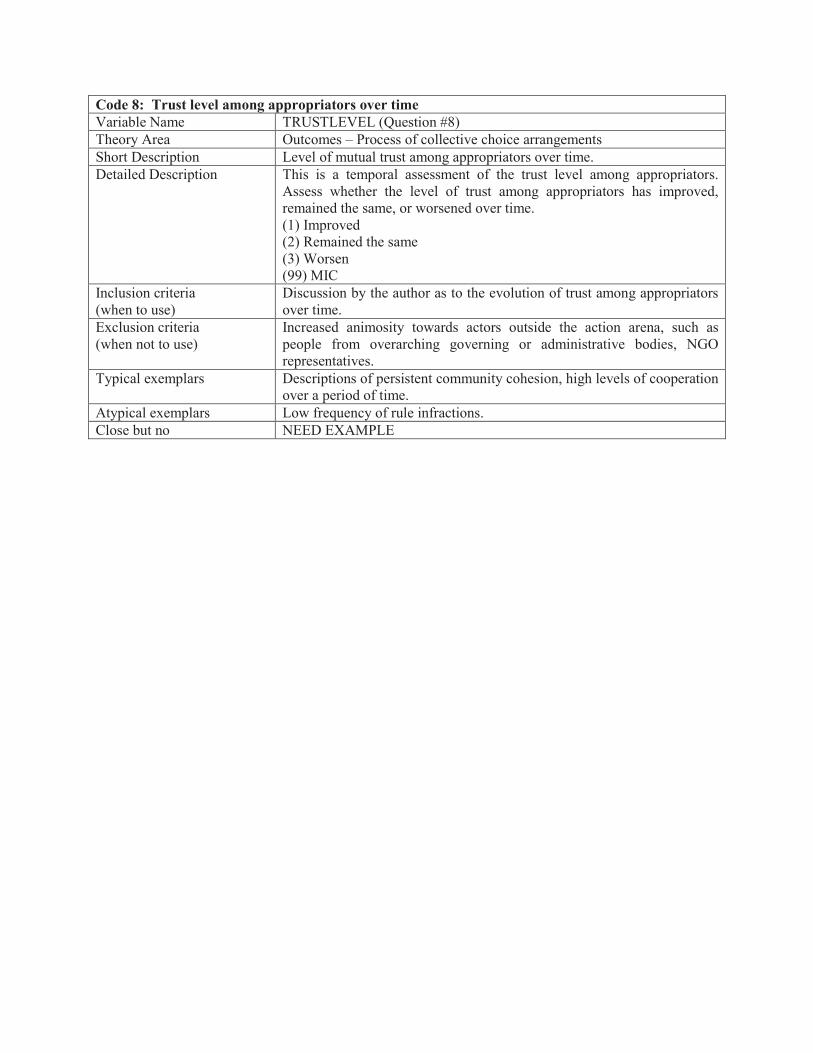
Code 8: Trust level among appropriators over time
Variable Name TRUSTLEVEL (Question #8)
Theory Area Outcomes – Process of collective choice arrangements
Short Description Level of mutual trust among appropriators over time.
Detailed Description This is a temporal assessment of the trust level among appropriators.
Assess whether the level of trust among appropriators has improved,
remained the same, or worsened over time.
(1) Improved
(2) Remained the same
(3) Worsen
(99) MIC
Inclusion criteria
(when to use)
Discussion by the author as to the evolution of trust among appropriators
over time.
Exclusion criteria
(when not to use)
Increased animosity towards actors outside the action arena, such as
people from overarching governing or administrative bodies, NGO
representatives.
Typical exemplars Descriptions of persistent community cohesion, high levels of cooperation
over a period of time.
Atypical exemplars Low frequency of rule infractions.
Close but no NEED EXAMPLE

Code 9: Rule following
Variable Name RULEFOLI (Question #9)
Theory Area Outcomes – Process of collective choice arrangements
Short Description Do the appropriators generally follow the local rules-in-use related to the
resource appropriation process?
Detailed Description Characterize the usual behavior of the appropriators with respect to local
operational level rules-in-use related to the appropriation process from
this resource.
(1) Almost all members follow the rules
(2) Most members follow the rules
(12) More than half of the members follow the rules
(3) About half of the members follow the rules
(4) Most members do not follow the rules
(5) Almost all members do not follow the rules
(35) Half or less of the members follow the rules
(99) MIC
(98) NA
Inclusion criteria
(when to use)
Discussion by the author with regard to any rule-following behavior
related to resource extraction.
Exclusion criteria
(when not to use)
Appropriator behavior that is not related to common pool resource
extraction, e.g., NEED EXAMPLE
Typical exemplars NEED EXAMPLE
Atypical exemplars NEED EXAMPLE
Close but no Rule following behavior in years of extreme resource shortage.

OUTCOMES: EQUITY AMONG USERS

Code 10: Disadvantaged appropriators
Variable Name REALOSER (Question #10)
Theory Area Equity among users
Short Description Disadvantaged appropriators
Detailed Description Describe whether the author identifies any appropriators who have been
consistently disadvantaged during the time period examined in the text?
(1) Yes
(0) No
(99) MIC
(98) NA
Inclusion criteria
(when to use)
This question refers only to appropriators/users. An appropriator is
disadvantaged if he or she is always assigned a smaller amount of units, a
bad time slot, lower priority in withdrawing units, etc.
When evaluating this question, consider the physical and governance
structure boundaries of the CPR analyzed. Appropriators that may be
peripherally affected but are not directly examined are not to be included.
Exclusion criteria
(when not to use)
A group that has consistently been disadvantaged but is outside the action
arena.
Typical exemplars “…Gitsan law requires equitable access to fishing sites within houses and
distribution of resources to those who cannot fish…” [Code: “0”]
Atypical exemplars “The establishment of community forestry in 1980 did not change the
basic power imbalance between an elite from the central village and the
predominantly Mixtec villagers from the out-lying settlements, nor did it
correct an inequitable distribution of forestry benefits...” [Code: “1”]
Close but no Neighboring villagers who used to have access rights to community forest
resources, but who have been excluded from those resources due to the
implementation of Joint Forest Management (JFM) policies.
(Neighboring villagers are not considered appropriators in the sense of
this question. Their equity concerns would be addressed under question
#11 [WORSTOFF]).

Code 11: Loss of benefits or harm
Variable Name WORSTOFF (Question #11)
Theory Area Equity among users
Short Description Appropriators who have lost access to resource benefits or sustained other
harm.
Detailed Description Characterize any evidence within the text that indicates that there is
inequity among appropriators. Have the relatively worst off been cut out
of their benefits from this resource or otherwise substantially harmed?
(1) Yes
(0) No
(99) MIC
(98) NA
Inclusion criteria
(when to use)
This question refers to individuals who used to be or are currently
appropriators.
Exclusion criteria
(when not to use)
Individuals outside the described action arena who are cut out of benefits
or otherwise harmed. People who are not appropriators.
Typical exemplars Village elites restructure resource benefits to their advantage by taking
over resources previously allocated to poor community members.
Atypical exemplars NEED EXAMPLE
Close but no NEED EXAMPLE

Code 12: Equity gap among appropriators
Variable Name RELEQUTY (Question #12)
Theory Area Equity among users
Short Description Disparity in equity level among appropriators.
Detailed Description Think about the relationship between those who are the least advantaged
(e.g., the poor) and those who are the most advantaged (e.g., elites) during
the time period described and the distance between them. By the end of
the situation identified in the text, would you characterize the distance
between those who are the least advantaged and those who are the most
advantaged as increasing, constant, or decreasing?
(1) Increasing over time
(2) Remaining relatively constant over time
(3) Decreasing over time
(99) MIC
(98) NA
Inclusion criteria
(when to use)
This question refers to individuals who used to be or are currently
appropriators. Evaluate the level of fairness within the rules (written
and/or rules-in-use) – is there disparity in rule application between those
that are most advantaged and those who are least advantaged at the end of
the time period? What is the level of fairness in the governance
structure/institutional arrangement?
Exclusion criteria
(when not to use)
Individuals outside the described action arena. People who are not
appropriators. Do not evaluate the social equity within the system. Do not
evaluate the level of fairness in CPR inputs or outputs.
Typical exemplars NEED EXAMPLE
Atypical exemplars NEED EXAMPLE
Close but no NEED EXAMPLE

Code 13: Equity level over time
Variable Name EQUITYLEVEL (Question #13)
Theory Area Equity among users
Short Description Level of equity among appropriators/users over time.
Detailed Description Think about the relationship between those who are the least advantaged
(e.g., the poor) and those who are the most advantaged (e.g., elites) during
the time period described and the level of equity between them. Over the
entire time period identified in the text, has the level of equity among
appropriators increased, remained the same, or decreased?
(1) Increased
(2) Remained the same
(3) Decreased
(99) MIC
Inclusion criteria
(when to use)
This question refers to individuals who used to be or are currently
appropriators. Evaluate the level of fairness within the rules (written
and/or rules-in-use) – has the level of disparity in rule application
between those that are most advantaged and those who are the least
advantaged changed over time? How has the level of fairness in the
governance structure/institutional arrangement changed during the time
period described?
Exclusion criteria
(when not to use)
Individuals outside the described action arena. People who are not
appropriators. Do not evaluate the social equity within the system. Do not
evaluate the level of fairness in CPR inputs or outputs.
Typical exemplars NEED EXAMPLE
Atypical exemplars NEED EXAMPLE
Close but no NEED EXAMPLE

OUTCOMES: CONCLUSION

Code 14: CPR governance evaluation
Variable Name SUCCESS (Question #14)
Theory Area Outcomes: Conclusion
Short Description Evaluate whether the CPR is governed successfully or unsuccessfully.
Detailed Description Based on your answers to questions 1 through 13, determine if this
case is a success or failure in governing the CPR. Briefly explain your
answer (e.g., due to resource overexploitation, inequality, cross-scale
interactions).
A successful case is defined as one in which the common pool
resource was used sustainably and the social system was productive
and conflict-free.
(1) Success
(0) Failure
(99) Unknown or Unsure
Inclusion criteria
(when to use)
This question needs to be answered for all cases analyzed.
Exclusion criteria
(when not to use)
If the case study does not include enough information to assess success or
failure in CPR governance. Code [99].
Typical exemplars NEED EXAMPLE
Atypical exemplars NEED EXAMPLE
Close but no NEED EXAMPLE

DESIGN PRINCIPLE 1
(USER AND RESOURCE BOUNDARIES)

Code 15: User boundaries
Variable Name WELLDEFN (Question #15)
Theory Area Design Principles: 1a – User Boundaries
Short Description Appropriator withdrawal rights boundary
Detailed Description Characterize whether the set of individuals who have rights to withdraw
from the resource is well defined?
(1) Yes
(0) No
(99) MIC
(98) NA
Inclusion criteria
(when to use)
Discussion within the text with regard to user boundaries (hard or soft),
i.e., defined user access to the resource.
Exclusion criteria
(when not to use)
If the set of rules about withdrawal rights is ambiguous or it is practically
difficult to determine from the text who has the rights, answer “no” [0].
Evaluate only the presence or absence of rules. Ignore whether the rules
are implemented or enforced.
Typical exemplars NEED EXAMPLE
Atypical exemplars NEED EXAMPLE
Close but no NEED EXAMPLE
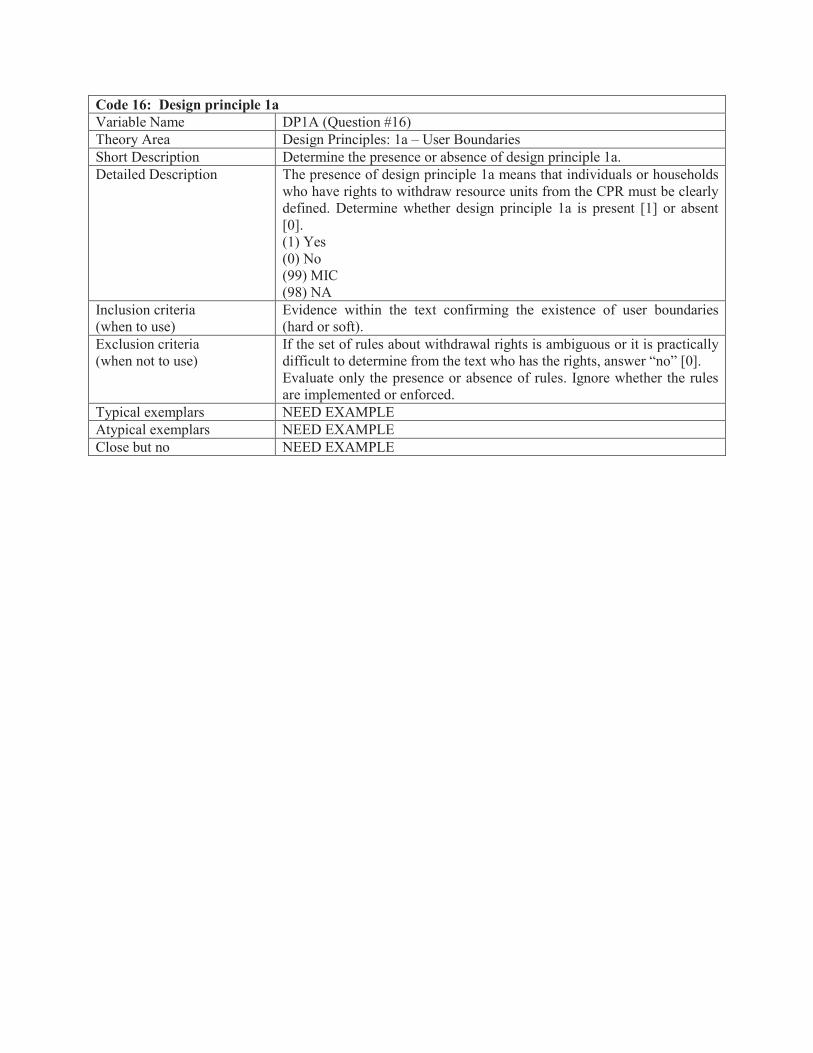
Code 16: Design principle 1a
Variable Name DP1A (Question #16)
Theory Area Design Principles: 1a – User Boundaries
Short Description Determine the presence or absence of design principle 1a.
Detailed Description The presence of design principle 1a means that individuals or households
who have rights to withdraw resource units from the CPR must be clearly
defined. Determine whether design principle 1a is present [1] or absent
[0].
(1) Yes
(0) No
(99) MIC
(98) NA
Inclusion criteria
(when to use)
Evidence within the text confirming the existence of user boundaries
(hard or soft).
Exclusion criteria
(when not to use)
If the set of rules about withdrawal rights is ambiguous or it is practically
difficult to determine from the text who has the rights, answer “no” [0].
Evaluate only the presence or absence of rules. Ignore whether the rules
are implemented or enforced.
Typical exemplars NEED EXAMPLE
Atypical exemplars NEED EXAMPLE
Close but no NEED EXAMPLE

Code 17: Resource boundaries
Variable Name BOUNDAR2 (Question #17)
Theory Area Design Principles: 1b – Resource Boundaries
Short Description Resource withdrawal rights boundary
Detailed Description Determine whether the boundary of the resource is primarily a result of
one of the following conditions:
(1) Natural/constructed attributes which limit entry
(2) Natural/constructed attributes which do not limit entry
(3) Institutional arrangements
(4) Natural/constructed and institutional arrangements which limit entry
(5) Natural/constructed and institutional arrangements which do not limit
entry
Natural/constructed attributes are those which limit entry if the topology
of the resource is such as to focus entry to the resource on one or a few
places. These attributes can be natural (e.g., geological) or human-made
(e.g., physical infrastructure or technological).
Inclusion criteria
(when to use)
Discussion within the text with regard to resource boundaries (natural,
human-built, institutional).
Exclusion criteria
(when not to use)
Evaluate only the presence or absence of boundaries. Ignore whether the
boundaries are implemented or enforced.
Typical exemplars NEED EXAMPLE
Atypical exemplars NEED EXAMPLE
Close but no NEED EXAMPLE

Code 18: Design principle 1b
Variable Name DP1B (Question #18)
Theory Area Design Principles: 1b – Resource boundaries
Short Description Determine the presence or absence of design principle 1b.
Detailed Description The presence of design principle 1b means that the boundaries of the CPR
must be well defined. Determine whether design principle 1b is present
[1] or absent [0].
Definition of well defined: resource boundary is successfully limiting
entry to the CPR. [IS THIS CORRECT?]
(1) Yes
(0) No
(99) MIC
(98) NA
Inclusion criteria
(when to use)
Evidence within the text confirming the existence of resource boundaries
(hard or soft).
Exclusion criteria
(when not to use)
Evaluate only the presence or absence of boundaries. Ignore whether the
boundaries are implemented or enforced.
Typical exemplars NEED EXAMPLE
Atypical exemplars NEED EXAMPLE
Close but no NEED EXAMPLE

DESIGN PRINCIPLE 2
(CONGRUENCE WITH LOCAL CONDITIONS & APPROPRIATION
AND PROVISION)

Code 19: Flexible rules-in-use
Variable Name FLEXIBLE (Question #19)
Theory Area Design Principles: 2a – Congruence with local conditions
Short Description Flexibility of rules-in-use
Detailed Description Determine whether the rules-in-use are flexible in dealing with
times of emergency or unusual problems facing particular members
of the group of appropriators/users?
(1) Yes
(0) No
(99) Don’t Know
Inclusion criteria
(when to use)
Discussion within the text regarding the flexibility of the rules-in-
use governing common pool resources to accommodate emergency
situations faced by individual appropriators/users/community
members. Are the rules responsive and adaptive?
Exclusion criteria
(when not to use)
Evaluate only the flexibility of rule-in-use to respond to
individual/household emergencies/special circumstances. Does not
apply to emergency situations that involve the entire community
(e.g., a natural disaster that affects the entire community).
Does not apply to private strategies of individuals to adjust to
emergency situations (e.g., digging a private well).
Typical exemplars Water rights within the Ait Sidi Musa Clan are tied to the land and
rigidly based on kinship ties to the founders of the irrigation
system. These water rights cannot be transferred to another
community member who is in need under any circumstances. Code
no [0].
Atypical exemplars NEED EXAMPLE
Close but no NEED EXAMPLE

Code 20: Design principle 2a
Variable Name DP2A (Question #20)
Theory Area Design Principles: 2a – Congruence with local conditions
Short Description Determine the presence or absence of design principle 2a.
Detailed Description The presence of design principle 2a means that the appropriation
rules restricting time, place, technology, and/or quantity of resource
units are related to local conditions. Is this design principle present
within the examined CPR? Do the appropriation rules match local
conditions?
Appropriation is defined as harvesting/extraction activities.
(1) Yes
(0) No
(99) MIC
(98) NA
Inclusion criteria
(when to use)
Evidence within the text confirming that appropriation rules exist
which match local conditions and which limit access to the CPR to
allow the system to persist over time without significant depletion
of resources.
Exclusion criteria
(when not to use)
Evaluate only the presence or absence of appropriation rules that
match local conditions. Ignore whether these rules are implemented
or enforced.
Typical exemplars Annual seasonal closures in fisheries limit the extraction of
commercially valuable species and allow the species time to
recover from exploitation. In an irrigation system, access to water
rights is dependent on the effort individuals invest in maintaining
the irrigation infrastructure.
Atypical exemplars NEED EXAMPLE
Close but no NEED EXAMPLE

Code 21: Perceived fairness of rules
Variable Name DP2B (Question #21)
Theory Area Design Principles: 2b – Appropriation and Provision
Short Description Perceived fairness of the rules-in-use.
Detailed Description Based on the information in the text, determine whether the
appropriators/users perceive the rules-in-use as fair.
(1) Yes
(0) No
(99) Don’t Know
Inclusion criteria
(when to use)
Discussion within the text indicating whether users accept the rules-
in-use as fair/legitimate or not. Rules-in-use can be written
laws/regulations or accepted/traditional norms.
Exclusion criteria
(when not to use)
The presence of aggregation rules that specify
constraints/requirements on user actions and/or the extraction
process is not enough to deduce perceived fairness.
Typical exemplars A majority of resource users follow the rules-in-use. “Tziscao’s communal land use rules are also clear and easily understood, and there
was near universal agreement among interviewees regarding the specific aspects and
applicability of rules. Although the creation of certain rules by external authorities
contradicts the prescription of common property institutional design principles, use
rules within Tziscao are essentially functional and robust.”
Atypical exemplars NEED EXAMPLE
Close but no When majority of resource users follow the rules-in-use, but a
smaller group do not because they think it is unfair for them.

Code 22: Design principle 2b
Variable Name DP2B (Question #22)
Theory Area Design Principles: 2b – Congruence of Appropriation and Provision
Short Description Determine the presence or absence of design principle 2b.
Detailed Description The presence of design principle 2b means that the benefits
obtained by users from a CPR, as determined by the appropriation
rules, are proportional to the amount of inputs required in the form
of labor, material, or money, as determined by the provision rules.
Determine whether the text indicates the presence or absence of this
design principle.
Appropriation rules are defined as those rules governing resource
extraction. They are time independent.
Provision rules assign responsibility to users for building, restoring,
or maintaining the CPR. They are time dependent.
(1) Yes
(0) No
(99) MIC
(98) NA
Inclusion criteria
(when to use)
Evidence within the text confirming a congruence between
appropriation and provision rules and local conditions.
Exclusion criteria
(when not to use)
Evaluate only the presence or absence of appropriation rules. Ignore
whether these rules are implemented or enforced.
Typical exemplars Free-riding behavior: When some resource users [e.g. water for
irrigation] do not contribute resources (labor or money) for to the
public infrastructure maintenance are excluded from harvesting.[e.g
the canal or reservoir] but still appropriates resource units without
any consequence. [code = 0]
Atypical exemplars NEED EXAMPLE
Close but no When resource users do not contribute with a fee for the public
infrastructure maintenance but they contribute with labor [code = 1]

DESIGN PRINCIPLE 3
(COLLECTIVE CHOICE ARRANGEMENTS)

Code 23: Users’ ability to express needs and concerns
Variable Name EXPOWN (Question #23)
Theory Area Design Principles: 3 – Collective choice arrangements
Short Description Users’/appropriators’ ability to communicate needs and concerns.
Detailed Description Based on the information in the text, determine whether the
appropriators/users as a group have options to express their needs
and concerns to officials in the group’s organization who make
collective choice decision in relation to the CPR. Can most
individuals affected by the operational rules participate in
modifying the operational rules? Are there activities that the users
can use to express their needs and concerns to officials who make
collective choice decisions, and do users find these activities useful,
i.e., are officials responsive to their needs?
(1) Yes, at least one of these activities are used
(0) No, none of these activities are used
(99) MIC
(98) NA
*Options may include: elections, formal petitions, formal hearings,
advice and consent on nominations to non-elected positions,
demonstrations, general meetings, illegal exchange with officials or
other activities.
Inclusion criteria
(when to use)
Discussion within the text outlining collective choice arrangements
that are open to all users and in which users can participate and
express needs and concerns (e.g., forums, hearings, community
meetings, etc.).
Exclusion criteria
(when not to use)
Instances in which users express needs and concerns to officials
who do not make collective choice decisions. Forums to which
users are invited but where they cannot express their needs and
concerns. There has to be some evidence that users actually
participate in these activities. Very often there are general meetings
and options for petitioning may exist on paper but are not actually
used.
Typical exemplars Monthly meetings of village Van Panchayat to which all
community members are invited and in which concerns and needs
can be addressed to leaders of the Van Panchayat. Other options
include: elections, formal petitions, formal hearings, advice and
consent on nominations to non-elected positions, demonstrations,
general meetings, or other activities.
Atypical exemplars Illegal exchange with officials. Bribery(?)
Close but no Resource users are invited to forums and are asked for their needs,
but in the end users’ needs are not taken into account. In the long
term even though they still get invited, users stop attending to the
forums. In this case the code should be 0.

Code 24: Chief executive position
Variable Name EXECAPR (Question #24)
Theory Area Design Principles: 3 – Collective choice arrangements
Short Description Is the chief executive a CPR user/appropriator?
Detailed Description Based on the information in the text, determine whether the chief
executive/administrator position(s) are filled by appropriators/users.
(1) Yes
(0) No
(99) MIC
(98) NA (no executive positions)
If answer is yes or MIC, answer Code 24.1 next.
If answer is no, skip Code 24.1 and proceed to Code 24.2.
If answer if NA, answer for code 24.1 and code 24.2 should be NA
Inclusion criteria
(when to use)
Discussion within the text about the accountability of chief
executives/administrators to the appropriators.
Exclusion criteria
(when not to use)
Chief executive is appointed by the government and not a
community member.
Typical exemplars Chief executive of an irrigation system is a farmer within the same
irrigation system.
Atypical exemplars NEED EXAMPLE
Close but no The Chief executive is a member of the community but not a
resource user.

Code 24.1: Election of chief executive
Variable Name EXECAPR (Question #24.1)
Theory Area Design Principles: 3 – Collective choice arrangements
Short Description If the chief executive/administrator position is filled by
appropriator/user, how is that position filled?
Detailed Description If the chief executive/administrator position is filled by
appropriator/user, what is the procedure to fill that position? What
are the position rules? How does someone move from being just a
“member” of a group of appropriators to someone who has a
specialized task, such as the chair of a management committee or a
water distributor-guard?
(1) Through direct or indirect elections by appropriators
(2) Appointed by external government
(3) Through inheritance
(4) Other: __________________________________
Inclusion criteria
(when to use)
Discussion in the text with regard to how an appropriator/user can
position themselves in a chief executive/administrator position
within the CPR system.
Exclusion criteria
(when not to use)
Chief executive is appointed by the government and not a
community member.
Typical exemplars The president of a fisheries cooperative is a fisherman in the
community.
Farmers form an irrigation association and all of them vote for a
term president that is also a farmer.
Atypical exemplars NEED EXAMPLE
Close but no NEED EXAMPLE

Code 24.2: Appointment of chief executive
Variable Name EXECAPR (Question #24.2)
Theory Area Design Principles: 3 – Collective choice arrangements
Short Description If the chief executive/administrator position is appointed by an
external government, do appropriators participate in the election?
Detailed Description If the chief executive/administrator position is appointed by an
external government, what is the level of involvement of
appropriators in that appointment process?
(1) The chief executive(s) or administrator(s) position(s) is
appointed by external government with active advice by
appropriators
(2) The chief executive(s) or administrator(s) position(s) is
appointed by external government without active advice by
appropriators
(99) MIC
(98) NA
Inclusion criteria
(when to use)
Discussion in the text with regard to the appointment process of
chief executives/administrators within a CPR system.
Exclusion criteria
(when not to use)
Chief executive is elected by the community.
Typical exemplars Under the Joint Forest Management scheme in India, the chief
executive of a forest community is directly appointed by the
government (with no input from community so coded (2)).
Atypical exemplars NEED EXAMPLE
Close but no NEED EXAMPLE

Code 25: Action by users/appropriators
Variable Name PRONURUL (Question #25)
Theory Area Design Principles: 3 – Collective choice arrangements
Short Description Evidence of proposed group action by appropriators/users.
Detailed Description Based on the information in the text, determine whether the group
of appropriators has proposed action in a collective-choice or
constitutional choice arena to alter the operational or collective
choice rules affecting the operation of the CPR.
Definition of collective choice: [NEED TO SUPPLEMENT]
Definition of constitutional choice: [NEED TO SUPPLEMENT]
(1) Yes
(0) No
(99) MIC
(98) NA
If answer is yes or MIC, answer Code 25.1 next.
If answer is no, skip Code 25.1 and proceed to Code 26.
Inclusion criteria
(when to use)
Any appropriator/user activity in which an alteration to the
institutional arrangements or rules-in-use are discussed, proposed,
or taken.
Exclusion criteria
(when not to use)
Any activity in which the alteration of the physical components of
the CPR are discussed, proposed, or taken.
Any activity to change the operational and/or collective choice rules
affecting CPR operation that is taken by an individual within the
community, not the group of appropriators.
Typical exemplars Group of water users petitions the water users’ association to
implement water saving measures.
Atypical exemplars NEED EXAMPLE
Close but no NEED EXAMPLE

Code 25.1: Type of action taken by users/appropriators
Variable Name PRONURUL (Question #25.1)
Theory Area Design Principles: 3 – Collective choice arrangements
Short Description Type of group action taken by appropriators/users.
Detailed Description Based on the information in the text, determine what type of action
the group of appropriators/users has proposed or taken:
(1) Collective choice arena
(2) Constitutional-choice arena
(3) Both
(99) MIC
(98) NA
Inclusion criteria
(when to use)
Any appropriator/user group action to alter the institutional
arrangements or rules-in-use within the collective choice and/or
constitutional choice arena.
Exclusion criteria
(when not to use)
Any appropriator/user group action to alter the institutional
arrangements or rules-in-use that does not take place within the
collective choice and/or constitutional choice arena. Any action to
alter the institutional arrangements or rules-in-use taken by
individual users/appropriators or imposed by the government
Typical exemplars Example when proposal made by users to water users association or
irrigation district. Fishermen at Lake Titicaca fought against the
government to claim back their rights, and they kept their
customary hold on the onshore water. They recovered the right to
manage the resource but it is not legally stated. Code = 1. If they
had gained legal rights, then it would have been (3).
Atypical exemplars NEED EXAMPLE
Close but no NEED EXAMPLE

Code 26: Design principle 3
Variable Name DP3 (Question #26)
Theory Area Design Principles: 3 – Collective choice arrangements
Short Description Determine the presence or absence of design principle 3.
Detailed Description The presence of design principle 3 means that most individuals
affected by the operational rules can participate in modifying these
rules. Determine whether the text indicates the presence or absence
of this design principle.
(1) Yes
(0) No
(99) MIC
(98) NA
Inclusion criteria
(when to use)
Evidence within the text indicating that most individuals affected
by the CPR governance rules can participate in modifying them.
Exclusion criteria
(when not to use)
Evaluate only the presence or absence of collective choice
arrangement. Ignore whether users choose to utilize them or not.
Typical exemplars Mention of user group association meetings where most users can
participate and propose changes “Tziscao has a very robust system of
collective-choice arrangements. All major decisions in Tziscao are made
jointly in the community asamblea. The asamblea is essentially a town
meeting in which the business of the community is discussed. Each
meeting has a particular focus and an agenda, but anyone can bring up
issues for discussion.” Page 723 Johnson, K., and K. Nelson 2004.
Common property and conservation: the potential for effective
communal forest management within a national park in Mexico.
Human Ecology 36(6):703-733.
Atypical exemplars NEED EXAMPLE
Close but no NEED EXAMPLE

DESIGN PRINCIPLE 4 (MONITORING)

Code 27: Resource withdrawal records
Variable Name RECORDWI (Question #27)
Theory Area Design Principles: 4a – Monitoring users and the resource
Short Description Are records of withdrawals from the CPR kept in any systematic way?
Detailed Description Based on the information in the text, determine whether there is evidence
that withdrawal records from the CPR are kept in any systematic way.
Systematic way implies that the records are kept in a way that allows for
easy inspection by users/appropriators.
Systematic records are defined as any form of collective memory that
becomes a public good of information. That public good of information
may be written, oral, or otherwise.
Analyzing the text, is there evidence that someone within the group of
users/appropriators knows who to ask to obtain CPR withdrawal
information.
(1) Yes
(0) No
(99) MIC
If answer is yes or MIC, answer Code 27.1 next.
If answer is no, skip Code 27.1 and proceed to Code 28.
Inclusion criteria
(when to use)
Discussion within the text about record-keeping of CPR withdrawals.
Records of withdrawals may include the amount of units withdrawn by
each appropriator/user or the total amount withdrawn by all
appropriators/users.
Exclusion criteria
(when not to use)
Discussion on remote sensing as used by the scientists, but not available
to local resource users. This variable is associated with the “withdrawals
from the resource”, not with the “condition of the resource” you can see
in Question #28. NEED EXAMPLE
Typical exemplars Fishing logs. Metering the amount of grass extracted.
Atypical exemplars You cannot infer that the bad condition of the resource implies the more
withdrawals from the resource. This is because the bad condition of the
resource is caused by various factors including purely natural phenomena
(e.g. flood, drought, fire).
NEED EXAMPLE
Close but no NEED EXAMPLE

Code 27.1: Frequency of tallying withdrawal records
Variable Name RECORDWI (Question #27.1)
Theory Area Design Principles: 4a – Monitoring users and the resource
Short Description How often are records of withdrawals from the CPR logged?
Detailed Description Based on the information in the text, determine how often the withdrawal
records from the CPR were kept in any systematic way.
(1) Always
(2) Most times
(3) Sometimes
(99)MIC
(98) NA
Inclusion criteria
(when to use)
Any evidence about the frequency of systematic record-keeping of CPR
withdrawals.
Exclusion criteria
(when not to use)
Vague statements that information is available, but it is not clear to whom
and when.
Typical exemplars Monthly harvesting data reported to forest council.
Atypical exemplars NEED EXAMPLE
Close but no NEED EXAMPLE

Code 28: Resource condition records
Variable Name RECORDCO (Question #28)
Theory Area Design Principles: 4a – Monitoring users and the resource
Short Description Are records of the CPR condition kept in any systematic way?
Detailed Description Based on the information in the text, determine whether there is evidence
that records of the condition of the CPR are kept in any systematic way.
Systematic way implies that the records are kept in a way that allows for
easy inspection by users/appropriators.
Systematic records are defined as any form of collective memory that
becomes a public good of information. That public good of information
may be written, oral, or otherwise.
Analyzing the text, is there evidence that someone within the group of
users/appropriators knows who to ask to obtain information on the
condition of the CPR.
(1) Yes
(0) No
(99) MIC
If answer is yes or MIC, answer Code 28.1 next.
If answer is no, skip Code 28.1 and proceed to Code 29.
Inclusion criteria
(when to use)
Discussion within the text about record-keeping of CPR condition,
including records about the level of pollution of the resource, the amount
of units available, etc..
Exclusion criteria
(when not to use)
When records on the CPR condition are not available to local community
(such as remote sensing data).This variable is associated with the
“condition of the resource”, not with the “withdrawals from the resource”
you can see in Question #27.
NEED EXAMPLE
Typical exemplars Groundwater measurements, reports of water association, reports of
forester.
Atypical exemplars You cannot infer that the more withdrawals from the resource imply the
worse condition of the resource. This is because the entire condition of
the resource is determined by various factors including natural events,
biophysical elements, provision rules, and the population size.
NEED EXAMPLE
Close but no NEED EXAMPLE

Code 28.1: Frequency of tallying CPR conditions
Variable Name RECORDCO (Question #28.1)
Theory Area Design Principles: 4a – Monitoring users and the resource
Short Description How often are records of the condition of the CPR logged?
Detailed Description Based on the information in the text, determine how often the CPR
conditions are logged in any systematic way.
(1) Always
(2) Most times
(3) Sometimes
(99) MIC
(98) NA
Inclusion criteria
(when to use)
Any evidence about the frequency of systematic record-keeping of CPR
conditions.
Exclusion criteria
(when not to use)
No evidence that there is record keeping by community
Typical exemplars Annual reports
Atypical exemplars NEED EXAMPLE
Close but no NEED EXAMPLE

Code 29: Design principle 4a
Variable Name DP4A (Question #29)
Theory Area Design Principles: 4a – Monitoring users and the resource
Short Description Determine the presence or absence of design principle 4a.
Detailed Description The presence of design principle 4a means that monitors are present and
actively audit CPR conditions and appropriator/user behavior. Determine
whether the text indicates the presence or absence of this design principle.
“Audit” is defined as measuring or assessing a condition or behavior in
some way.
To meet this design principle, evidence of both user monitoring and
resource monitoring should be present. However, the presence of CPR
monitoring has greater weight, since it can imply and/or capture some
level of user monitoring as well.
(1) Yes
(0) No
(99) MIC
(98) NA
Inclusion criteria
(when to use)
Evidence within the text indicating that monitors are present in the system
who systematically tally resource conditions and appropriator behavior.
Evidence that appropriators/users are utilizing information on the resource
condition and/or their collective behavior.
Exclusion criteria
(when not to use)
Evaluate only the presence or absence of systematic record-keeping.
Ignore whether users choose to inspect or otherwise utilize the records.
Emphasis on collective behavior patterns, not individual ones. (unclear
when to exclude is there are systematic record. Maybe some standard data
collection that is never looked at? If people actively measure state of CPR
this may affect their mental model. But monitoring might not be a
continuous activity).
Typical exemplars See the exemplars in Code 27, 27.1, 28, 28.1
NEED EXAMPLE.
Atypical exemplars NEED EXAMPLE
Close but no NEED EXAMPLE

Code 30: Appropriator/user self-monitoring
Variable Name SELFMON (Question #30)
Theory Area Design Principles: 4b – Monitors accountability
Short Description Determine whether users monitor the activities of each other.
Detailed Description Determine whether appropriators/users monitor the appropriation
activities of each other apart from the monitoring of any “official”
guards?
(1) Yes
(0) No
(99) MIC
(98) NA
Inclusion criteria
(when to use)
Evidence within the text indicating that users/appropriators are
monitoring the extraction activities of other users. If the community is
small enough in membership and size so as to make monitoring easy, you
can select “yes” in this question (e.g. case #19).
Exclusion criteria
(when not to use)
Monitoring activities only by a designated and/or elected guard.
Typical exemplars Rule-breakers being caught by other local users.
Atypical exemplars NEED EXAMPLE
Close but no Monitoring of outsiders’ use of CPR by users/appropriators.

Code 31: Official monitoring
Variable Name GUARD (Question #31)
Theory Area Design Principles: 4b – Monitors accountability
Short Description Determine whether an “official” position of CPR monitor exists.
Detailed Description Determine whether an “official” position of monitor exists (apart from the
willingness of all appropriators/users to monitor the CPR)?
(1) Yes
(0) No
(99) MIC
(98) NA
If answer is yes or MIC, answer Code 31.1 next.
If answer is no, skip Code 31.1 and proceed to Code 32.
Inclusion criteria
(when to use)
Evidence of a monitor/guard position occupied by a person or person
acting on behalf of some organization or authority. [This could be a
rotating position? Each day another person is the guard?] If the guard
position is in the rules and clearly defined, it can be considered an
“official” position, even if all appropriators rotate into the position.
Exclusion criteria
(when not to use)
Appropriators/users who monitor others by their own initiation.
Typical exemplars Forest guard in an Indian Van Panchayat who is elected by the local forest
council and who may also be a member of that forest community.
Atypical exemplars Rotating positions?
Close but no Fishery official who is appointed by the national government but is not
accountable to local appropriators.

Code 31.1: Official monitoring
Variable Name GUARD (Question #31.1)
Theory Area Design Principles: 4b – Monitors accountability
Short Description Determine whether an “official” position of CPR monitor exists.
Detailed Description If an “official” position of monitor exists (apart from the willingness of all
appropriators/users to monitor the CPR), how is that position selected?
(1) Appropriators (not necessarily all) rotate into this position
(2) Appropriators are selected by appropriators for this position
(3) Local non-appropriators are selected by appropriators for this position
(4) Local non-appropriators are selected by a local general purpose
government
(5) Monitors are employees of an external governmental authority
(6) Some are selected by appropriators and some are selected by a local
general purpose government
(7) Some are selected by appropriators and some are employees of an
external government authority
(8) Some are selected by a local general purpose government and some
are employees of an external government authority
(9) Some are selected by appropriators, some are selected by a local
general purpose government, and some are employees of an external
government authority
(10) Others:_______________________________________________
(99) MIC
(98) NA
Inclusion criteria
(when to use)
Evidence of a formal or informal selection process for the position of
CPR monitor/guard.
Exclusion criteria
(when not to use)
Appropriators/users who monitor others on their own initiation. In other
words, it is important that there exist the “rules-in-use” to define who the
monitors are and how they are selected.
Typical exemplars If the government has a forest guard, you can select “(5)” in this question.
And you can select (1) if you find this kind of sentence: “In Jyalachitti,
the FUG hired two people from its membership for regular monitoring of
the forest ... The forest guards are thus accountable to the users” (case
#16).NEED EXAMPLE.
Atypical exemplars NEED EXAMPLE
Close but no NEED EXAMPLE

Code 32: Design principle 4b
Variable Name DP4b (Question #32)
Theory Area Design Principles: 4b – Monitors accountability
Short Description Determine the presence or absence of design principle 4b.
Detailed Description The presence of design principle 4b means that monitors are accountable
to the appropriators/users or they are themselves appropriators/users.
(1) Yes
(0) No
(99) MIC
(98) NA
Inclusion criteria
(when to use)
Evidence within the text indicating the presence of monitors. The position
of monitor can be self-organized with community members voluntarily
taking turns monitoring the CPR, or the position of monitor can be
“official”, i.e., elected or appointed by an internal or external governance
body.
Exclusion criteria
(when not to use)
Monitor/guard who is not accountable to the appropriators/users (e.g.,
guard appointed by an external government who exerts power with
impunity and without local oversight).
Typical exemplars Forest guard in an Indian Van Panchayat who is elected by the local forest
council and who may also be a member of that forest community.
Fishermen who monitor the fishing activity of other fishermen in their
cooperative. See the typical exemplars in Code 31.1.
Atypical exemplars NEED EXAMPLE
Close but no NEED EXAMPLE (local user who gets hired by external government and
reports to them?)

DESIGN PRINCIPLE 5 (GRADUATED SANCTIONS)
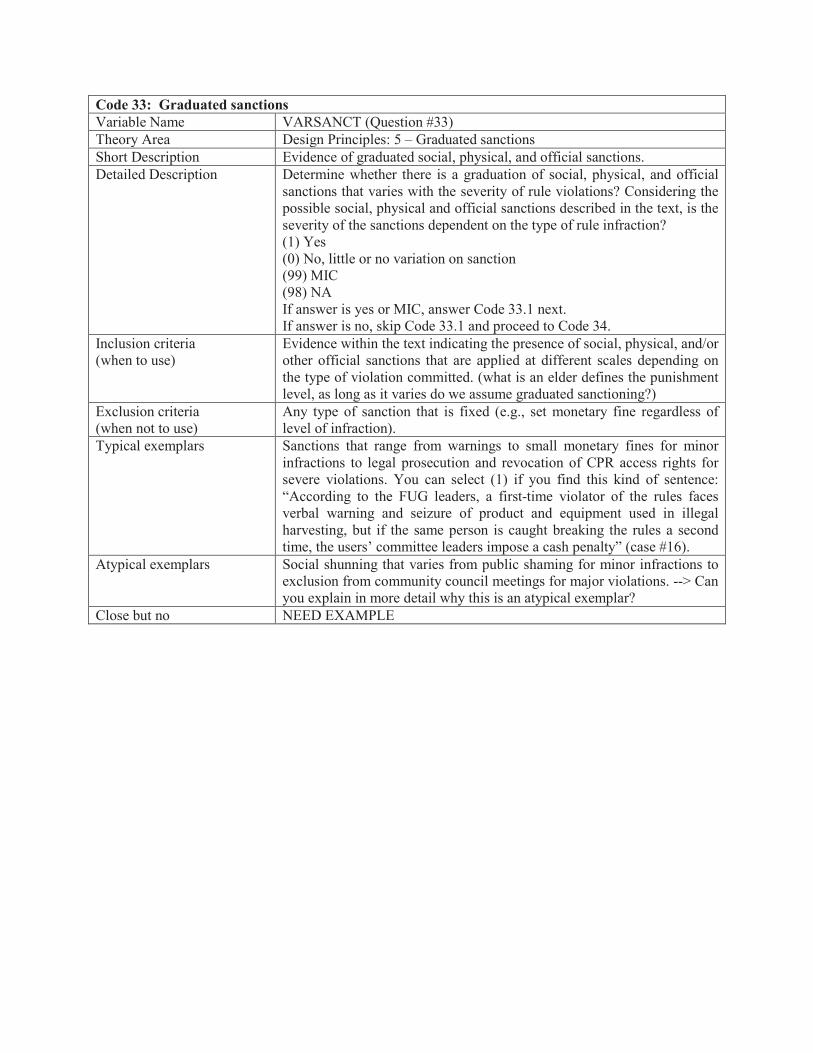
Code 33: Graduated sanctions
Variable Name VARSANCT (Question #33)
Theory Area Design Principles: 5 – Graduated sanctions
Short Description Evidence of graduated social, physical, and official sanctions.
Detailed Description Determine whether there is a graduation of social, physical, and official
sanctions that varies with the severity of rule violations? Considering the
possible social, physical and official sanctions described in the text, is the
severity of the sanctions dependent on the type of rule infraction?
(1) Yes
(0) No, little or no variation on sanction
(99) MIC
(98) NA
If answer is yes or MIC, answer Code 33.1 next.
If answer is no, skip Code 33.1 and proceed to Code 34.
Inclusion criteria
(when to use)
Evidence within the text indicating the presence of social, physical, and/or
other official sanctions that are applied at different scales depending on
the type of violation committed. (what is an elder defines the punishment
level, as long as it varies do we assume graduated sanctioning?)
Exclusion criteria
(when not to use)
Any type of sanction that is fixed (e.g., set monetary fine regardless of
level of infraction).
Typical exemplars Sanctions that range from warnings to small monetary fines for minor
infractions to legal prosecution and revocation of CPR access rights for
severe violations. You can select (1) if you find this kind of sentence:
“According to the FUG leaders, a first-time violator of the rules faces
verbal warning and seizure of product and equipment used in illegal
harvesting, but if the same person is caught breaking the rules a second
time, the users’ committee leaders impose a cash penalty” (case #16).
Atypical exemplars Social shunning that varies from public shaming for minor infractions to
exclusion from community council meetings for major violations. --> Can
you explain in more detail why this is an atypical exemplar?
Close but no NEED EXAMPLE

Code 33.1: Graduated sanctions
Variable Name VARSANCT (Question #33.1)
Theory Area Design Principles: 5 – Graduated sanctions
Short Description Evidence of graduated social, physical, and official sanctions.
Detailed Description If there is evidence of a graduation of social, physical, and official
sanctions that vary with the severity of rule violations, what is the range
of the same?
(1) Considerable range of sanctions are imposed depending on type of
rule infractions
(2) Moderate range of sanctions are imposed depending on type of rule
infractions
(12) Considerable or moderate range of sanctions are imposed depending
on type of rule
infractions
(3) Limited range of sanctions are imposed depending on type of rule
infractions
(99) MIC
(98) NA
Inclusion criteria
(when to use)
Evidence within the text of the level of social, physical, and/or other
official sanctions that are applied at different scales depending on the type
of violation committed.
Exclusion criteria
(when not to use)
Any type of sanction that is fixed (e.g., set monetary fine regardless of
level of infraction).
Typical exemplars Sanctions that range from warnings to small monetary fines for minor
infractions to legal prosecution and revocation of CPR access rights for
severe violations. For example, you can select (1) if you find the
following sentence: “... render written or public apologies, confiscate
cutting implements such as scythes, strip villagers of use rights, impose
fines, report villagers to government officials, and sometimes, seek
redress in courts”. (case #7)
Atypical exemplars Social shunning that varies from public shaming for minor infractions to
exclusion from community council meetings for major violations. --> Can
you explain why this is an atypical exemplar?
Close but no NEED EXAMPLE

Code 34: Design principle 5
Variable Name DP5 (Question #34)
Theory Area Design Principles: 5 – Graduated sanctions
Short Description Determine the presence or absence of design principle 5.
Detailed Description The presence of design principle 5 means that appropriators who violate
operation rules are likely to be assessed graduated sanctions (depending
on the seriousness and context of the offense) by other appropriators,
officials accountable to these appropriators, or both. Is there evidence that
this design principle is present?
Operation rules are rules-in-use dealing with the regulation of resource
extraction/appropriation.
(1) Yes
(0) No
(99) MIC
(98) NA
Inclusion criteria
(when to use)
Evidence within the text indicating a range of sanctions are applied to
violators of operation rules. These sanctions are assessed by other
appropriators or officials accountable to those appropriators (e.g.
monitors, guards). Code for the presence or absence of graduated
sanctions. Ignore whether these sanctions are actually levied/imposed or
not.
Exclusion criteria
(when not to use)
Sanctioning scheme that is not graduated (e.g., fixed fines regardless of
level of violation). No evidence of sanctions at all.
Typical exemplars You can select (1) if you find this kind of sentence: “Sanctions,
particularly, fines are regularly employed to ensure compliance with
management principles (p. 110). As can be seen in table 21, monetary
fines constitute the most common punishment for infractions. There are
other types of sanctions such as “Fine and Cutoff,” “Lose Water for
Cycle,” “Lose Turn,” “Jail,” and so on” (case #21).
NEED EXAMPLE
Atypical exemplars You can select (0) if you find this kind of sentence: “... any punishments
are unsystematic (not graduated)” (case #15).
NEED EXAMPLE
Close but no NEED EXAMPLE

DESIGN PRINCIPLE 6
(CONFLICT-RESOLUTION MECHANISMS)

Code 35: Information arenas
Variable Name ARENAS (Question #35)
Theory Area Design Principles: 6 – Conflict resolution mechanisms
Short Description Determine the existence of arenas to exchange information about CPR
conditions.
Detailed Description Determine whether there are arenas that are being used by
appropriators/users to exchange information about the conditions of the
resource?
An “arena” is defined as a particular place, time, or occasion for
appropriators to gather to communicate CPR conditions with each other.
An arena does not have to be an official venue, such as a meeting hall.
Arenas can be venues to deal with conflict-resolution matters, but do not
have to be.
(1) Yes
(0) No
(99) MIC
Inclusion criteria
(when to use)
Evidence within the text indicating that appropriators are communicating
the CPR conditions with each other. Appropriators who utilize particular
places, times, or occasions to discuss CPR conditions.
Exclusion criteria
(when not to use)
Appropriators discussing CPR conditions during casual encounters. The
existence of “arenas” that are not being used.
Typical exemplars NEED EXAMPLE
Atypical exemplars Farmers gathering at an irrigation canal to discuss the annual repair
schedule.
Close but no NEED EXAMPLE

Code 36: Design principle 6
Variable Name DP6 (Question #36)
Theory Area Design Principles: 6 – Conflict resolution mechanisms
Short Description Determine the presence or absence of design principle 6.
Detailed Description The presence of design principle 6 means that appropriators and their
officials have rapid access to low-cost local arenas to resolve conflicts
among appropriators or between appropriators and officials
AND/OR
That appropriators have access to local arenas of information exchange.
[THIS NEEDS TO BE FURTHER DISCUSSED]
(1) Yes
(0) No
(99) MIC
(98) NA
Inclusion criteria
(when to use)
Evidence of the existence and use of formal and informal arenas/venues
for appropriators and their officials to exchange information about CPR
conditions.
Evidence of the existence of and low-cost, rapid-access local
arenas/venues (e.g., courts, judiciary, elder/tribal council) to resolve
conflicts among appropriators/users or between appropriators/users and
officials.
Exclusion criteria
(when not to use)
NEED EXAMPLE
Typical exemplars NEED EXAMPLE
Atypical exemplars NEED EXAMPLE
Close but no NEED EXAMPLE

DESIGN PRINCIPLE 7
(MINIMAL RECOGNITION OF RIGHTS)

Code 37: Appropriator right to manage
Variable Name MANAGE (Question #37)
Theory Area Design Principles: 7 – Minimal recognition of rights to organize
Short Description Determine whether users/appropriators have the right to manage CPR.
Detailed Description Determine whether members of the group of appropriators/users have the
right to participate in the management of the CPR? Do appropriators/users
have the capability to make decisions over the use of the CPR?
(1) Yes
(0) No
(99) MIC
If answer is yes or MIC, answer Code 37.1 next.
If answer is no, skip Code 37.1 and proceed to Code 37.2.
Inclusion criteria
(when to use)
Evidence within the text that the appropriators/users have the capability to
make decisions over resource use and exercise that capability.
Exclusion criteria
(when not to use)
This question does not ask you to evaluate the level of management
capability that users have (great deal of authority or little authority). Users
who have de jure rights but are unable to or do not exercise them. Code
no (0). Users who have de facto rights but are unable to or do not exercist
them.
Typical exemplars NEED EXAMPLE
Atypical exemplars NEED EXAMPLE
Close but no NEED EXAMPLE

Code 37.1: De jure or de facto right to manage
Variable Name MANAGE (Question #37.1)
Theory Area Design Principles: 7 – Minimal recognition of rights to organize
Short Description Determine whether users/appropriators have de jure or de facto rights to
manage CPR.
Detailed Description If members of the group of appropriators/users have the right to
participate in the management of the CPR are those rights de jure (legal)
or de facto (actual)?
(1) De jure
(2) De facto
(99) MIC
(98) NA
If answer is de jure or de facto, skip Code 37.2 and proceed to Code 38.
If answer is MIC or NA, proceed to Code 37.2.
Inclusion criteria
(when to use)
Evidence within the text that the appropriators/users have de jure or de
facto rights to manage the CPR and exercise those rights.
Exclusion criteria
(when not to use)
This question does not ask you to evaluate the level of management
capability that users have (great deal of authority or little authority). If
users/appropriators do not have the right to participate in the management
of the CPR. Do not code both de jure and de facto. It can only be one or
the other.
Typical exemplars NEED EXAMPLE
Atypical exemplars NEED EXAMPLE
Close but no NEED EXAMPLE

Code 37.2: Presence of de jure rights
Variable Name MANAGE (Question #37.2)
Theory Area Design Principles: 7 – Minimal recognition of rights to organize
Short Description Are de jure rights present?
Detailed Description If appropriators/users do not have the right to participate in the
management of the CPR, determine whether de jure rights are
present/exist?
(1) Yes
(0) No
(99) MIC
(98) NA
Inclusion criteria
(when to use)
Users who do not have rights to manage the CPR even though de jure
rights exist.
Exclusion criteria
(when not to use)
Users who do not have rights to manage the CPR and no de jure rights
exist.
Typical exemplars NEED EXAMPLE
Atypical exemplars NEED EXAMPLE
Close but no NEED EXAMPLE

Code 38: Design principle 7
Variable Name DP7 (Question #38)
Theory Area Design Principles: 7 – Minimal recognition of rights to organize
Short Description Determine the presence or absence of design principle 7.
Detailed Description The presence of design principle 7 means that the rights of appropriators
to devise their own institutions are not challenged by external
governmental authorities. There exists a minimal recognition of
appropriators’ rights to organize.
(1) Yes
(0) No
(99) MIC
(98) NA
Inclusion criteria
(when to use)
Appropriators who have de jure rights to manage CPR and are exercising
those rights. Appropriators who have de facto rights to manage CPR and
are exercising those rights.
Exclusion criteria
(when not to use)
NEED EXAMPLE
Typical exemplars NEED EXAMPLE
Atypical exemplars NEED EXAMPLE
Close but no NEED EXAMPLE

DESIGN PRINCIPLE 8
(NESTED ENTERPRISES)

Code 39: Reporting to external authority
Variable Name EXTREP (Question #39)
Theory Area Design Principles: 8 – Nested enterprises
Short Description Does the chief executive/administrator report to external authority?
Detailed Description Determine whether the chief executive or administrator of the users’
group reports to any external/higher level authority?
(1) Yes
(0) No
(99) MIC
(98) NA
Inclusion criteria
(when to use)
Hierarchical flow of reporting. Horizontal information sharing. Look for
evidence of any form of regular reporting conducted by the chief
executive or administrator to a higher level authority that is part of his/her
regular responsibilities.
Exclusion criteria
(when not to use)
Special reports provided to higher governance structures that are not part
of the usual responsibilities of the chief executive (e.g., reports made in
the event of a natural disaster or accident).
Typical exemplars Annual reporting of catch by head of the fishery cooperative to the
regional cooperative and/or national fishery department.
Atypical exemplars NEED EXAMPLE
Close but no NEED EXAMPLE

Code 40: Embeddedness in other organizations
Variable Name ORGTYPE (Question #40)
Theory Area Design Principles: 8 – Nested enterprises
Short Description Are the appropriators of the CPR part of more than one organization?
Detailed Description Determine whether the appropriators of the CPR are embedded in more
than one organization? *
(1) Yes
(0) No
(99) MIC
(98) NA
*The types of organizations are:
General Purpose Government and Communal Enterprises
A = a regular agency of the national government
B = a regular agency of a regional government
C = a regular agency of a local government
D = a local communal enterprise
Sector Specific Government
E = a specially created national enterprise
F = a specially created regional governmental enterprise
G = a specially created local governmental enterprise
Special Organizations Related to Resource
I = an AGO organized as a cooperative
J = an AGO not organized as a cooperative
K = a group that has achieved coordination without formal organization
General Voluntary and Private Associations
L = private for profit
M = co-ops with broader jurisdiction than resource
N = unions
Others
Inclusion criteria
(when to use)
Look for any evidence of a degree of modularity or autonomy in the
system in which individual units have power to make decisions but there
are also some higher level coordination and/or conflict resolution
mechanisms present for mediating between units.
Exclusion criteria
(when not to use)
NEED EXAMPLE
Typical exemplars NEED EXAMPLE
Atypical exemplars NEED EXAMPLE
Close but no NEED EXAMPLE

Code 41: Design principle 8
Variable Name DP8 (Question #41)
Theory Area Design Principles: 8 – Nested enterprises
Short Description Determine the presence or absence of design principle 8.
Detailed Description The presence of design principle 8 means that the appropriation,
provision, monitoring, enforcement, conflict resolution, and governance
activities are organized in multiple layers of nested enterprises.
(1) Yes
(0) No
(99) MIC
(98) NA
Inclusion criteria
(when to use)
CPR governance structure is connected horizontally and/or vertically with
other independent parts of the governance structure. Information about
the CPR flows within the system. Look for the capacity for conflict
resolution beyond the local level. Look for any evidence of a degree of
modularity or autonomy in the system in which individual units have
power to make decisions but there are also some higher level coordination
and/or conflict resolution mechanisms present for mediating between
units.
Exclusion criteria
(when not to use)
NEED EXAMPLE
Typical exemplars NEED EXAMPLE
Atypical exemplars NEED EXAMPLE
Close but no NEED EXAMPLE

OUTCOMES: Resource sustainability
1. As of the beginning and end of this period, characterize the quality of the units being withdrawn:
1a. BEGQUAL(1) Extremely high quality (2) High quality (1,2) Extremely high or high quality(3) Passable (4) Poor quality (5) Extremely poor quality (4,5) Poor or extremely poor quality(-l) MIC (-2) NA
1b. ENDQUAL(1) Extremely high quality (2) High quality (1,2) Extremely high or high quality(3) Passable (4) Poor quality (5) Extremely poor quality (4,5) Poor or extremely poor quality(-l) MIC (-2) NA
2. As of the beginning and end of this period, how well-maintained is the public appropriation infrastructure?
2a. BEGCONDA(1) Well maintained - excellent working order (2) Moderately well maintained - good working order (1,2) From well to moderately well maintained(3) Some- infrastructure deterioration occurring due to insufficient maintenance (4) Considerable infrastructure deterioration occurring due to poor maintenance (3,4) Some or considerable infrastructure deterioration, insufficient or poor maintenance(5) Considerable infrastructure deterioration, but due to a natural disaster (-l) MIC (-2) NA
2b. ENDCONDA(1) Well maintained - excellent working order (2) Moderately well maintained - good working order (1,2) From well to moderately well maintained(3) Some- infrastructure deterioration occurring due to insufficient maintenance (4) Considerable infrastructure deterioration occurring due to poor maintenance (3,4) Some or considerable infrastructure deterioration, insufficient or poor maintenance(5) Considerable infrastructure deterioration, but due to a natural disaster (-l) MIC (-2) NA
3. As of the beginning and end of this period, how well-maintained is the public distribution infrastructure (if this is different from the appropriation infrastructure)?
3a. BEGCONDD(1) Well maintained - excellent working order (2) Moderately well maintained - good working order (1,2) From well to moderately well maintained(3) Some- infrastructure deterioration occurring due to insufficient maintenance (4) Considerable infrastructure deterioration occurring due to poor maintenance (3,4) Some or considerable infrastructure deterioration, insufficient or poor
3b. ENDCONDD(1) Well maintained - excellent working order (2) Moderately well maintained - good working order (1,2) From well to moderately well maintained(3) Some- infrastructure deterioration occurring due to insufficient maintenance (4) Considerable infrastructure deterioration occurring due to poor maintenance (3,4) Some or considerable infrastructure deterioration, insufficient or poor
MIC=Missing in caseNA=Not available

maintenance(5) Considerable infrastructure deterioration, but due to a natural disaster (-l) MIC (-2) NA
maintenance(5) Considerable infrastructure deterioration, but due to a natural disaster (-l) MIC (-2) NA
4. As of the beginning and end of this period, how well-maintained is the public production infrastructure (if this is different from the appropriation or distributioninfrastructure)?
4a. BEGCONDP(1) Well maintained - excellent working order (2) Moderately well maintained - good working order (1,2) From well to moderately well maintained(3) Some- infrastructure deterioration occurring due to insufficient maintenance (4) Considerable infrastructure deterioration occurring due to poor maintenance (3,4) Some or considerable infrastructure deterioration, insufficient or poor maintenance(5) Considerable infrastructure deterioration, but due to a natural disaster (-l) MIC (-2) NA
4b. ENDCONDP(1) Well maintained - excellent working order (2) Moderately well maintained - good working order (1,2) From well to moderately well maintained(3) Some- infrastructure deterioration occurring due to insufficient maintenance (4) Considerable infrastructure deterioration occurring due to poor maintenance (3,4) Some or considerable infrastructure deterioration, insufficient or poor maintenance(5) Considerable infrastructure deterioration, but due to a natural disaster (-l) MIC (-2) NA
5. For natural resources at the beginning and end of this period, the balance between thequantity of units withdrawn and the number of units available is*:
5a. BEGBLNC(1) Extreme shortage(2) Moderate shortage(1,2) Shortage(3) Apparently balanced(4) Moderately abundant(5) Quite abundant(4,5) Abundant(-l) MIC (-2) NA
5b. ENDBLNC(1) Extreme shortage(2) Moderate shortage(1,2) Shortage(3) Apparently balanced(4) Moderately abundant(5) Quite abundant(4,5) Abundant(-l) MIC (-2) NA
*In fisheries and other biological systems, this is the maximum sustainable number of units.
6. During this period, have the condition of the natural and human-made hard infrastructures improved, remained the same, or worsen due to the appropriators' behavior?
6a. NATINFRACOND(1) Improved(2) Remained the same(3) Worsen(-l) MIC (-2) NA
6b. HUINFRACOND(1) Improved(2) Remained the same(3) Worsen(-l) MIC(-2) NA
MIC=Missing in caseNA=Not available

OUTCOMES: Process of collective choice arrangements
7. As of the beginning and end of this period, how would you characterize the levels of mutual trust described among appropriators?
7a. BEGTRUST(1) Moderate to high level of trust (e.g. oral promises given high credence)(2) Modest levels of trust (e.g. oral promises are used but appropriators may beuncertain about performance)(1,2) From moderate to modest levels of trust(3) Low levels of trust (e.g. oral promises rarely used)(-l) MIC (-2) NA
7b. ENDTRUST(1) Moderate to high level of trust (e.g. oral promises given high credence)(2) Modest levels of trust (e.g. oral promises are used but appropriators may beuncertain about performance)(1,2) From moderate to modest levels of trust(3) Low levels of trust (e.g. oral promises rarely used)(-l) MIC (-2) NA
8. During this period, has the level of trust among appropriators improved, remained the same, or worsen? <TRUSTLEVEL>(1) Improved(2) Remained the same(3) Worsen(-1) MIC
9. Characterize the usual behavior of the appropriators with respect to local operationallevel rules-in-use related to the appropriation process from this resource in years other than extreme shortage: <RULEFOLI>(1) Almost all members follow the rules(2) Most members follow the rules(1,2) More than half of the members follow the rules(3) About half of the members follow the rules(4) Most members do not follow the rules(5) Almost all members do not follow the rules(3,5) Half or less of the members follow the rules(-l) MIC(-2) NA
OUTCOMES: Equity among users
10. Are there any appropriators who have been consistently disadvantaged in this period? <REALOSER>(1) Yes(0) No(-1) MIC(-2) NA
11. Have the relatively worst off been cut out of their benefits from this resource or substantially harmed? <WORSTOFF>(1) Yes(0) No(-1) MIC
MIC=Missing in caseNA=Not available

(-2) NA
12. By the end of the situation, would you characterize the distance between those who arethe least advantaged and those who are the most advantaged as increasing, constant, ordecreasing? <RELEQUTY>(1) Increasing over time(2) Remaining relatively constant over time(3) Decreasing over time(-1) MIC(-2) NA
13. During this period, has the level of equity among appropriators increased, remained the same, or decreased? <EQUITYLEVEL>(1) Increased(2) Remained the same(3) Decreased(-1) MIC
OUTCOMES: Conclusion
14. Determine if this case is a success/failure in governing the common-pool resource. Briefly explain why (e.g. resource overexploitation, inequality, cross-scale interactions…)<SUCCESS>
DESIGN PRINCIPLES: 1A User boundaries
15. Is the set of individuals who have rights to withdraw from this resource well-defined?<WELLDEFN>:
(1) Yes(0) No(-l) MIC(-2) NA
16. The presence of the design principle 1A means that individuals or households who have rights to withdraw resource units from the common-pool resource must be clearly defined. Is this design principle present? <DP1A>(1) Yes(0) No(-l) MIC(-2) NA
DESIGN PRINCIPLES: 1B Resource boundaries
17. The boundary of the resource is primarily a result of: <BOUNDAR2>(1) Natural/constructed attributes which limit entry(2) Natural/constructed attributes which do not limit entry(3) Institutional arrangements(4) Natural/constructed and institutional arrangements which limit entry(5) Natural/constructed and institutional arrangements which do not limit entry
MIC=Missing in caseNA=Not available

18. The presence of the design principle 1B means that the boundaries of the CPR must be well defined. Is this design principle present? <DP1B>(1) Yes(0) No(-l) MIC(-2) NA
DESIGN PRINCIPLES: 2A Congruence with local conditions
19. In your estimation, are the rules-in-use flexible in dealing with times of emergency or unusual problems facing particular members of the group of appropriators? <FLEXIBLE>
(1) Yes(0) No(-1) Don’t Know
20. The presence of design principle 2A means that appropriation rules restricting time, place, technology, and/or quantity of resource units are related to local conditions. Is this design principle present? <DP2A>
(1) Yes(0) No(-l) MIC(-2) NA
DESIGN PRINCIPLES: 2B Appropriation and provision
21. In your estimation, are the rules-in-use perceived by appropriators of appropriators as fair? <FAIR>(1) Yes(0) No(-1) Don’t Know
22. The presence of design principle 2B means that the benefits obtained by users from a CPR, as determined by appropriation rules, are proportional to the amount of inputs required in the form of labor, material, or money, as determined by provision rules. Is this design principle present? <DP2B>
(1) Yes(0) No(-l) MIC(-2) NA
DESIGN PRINCIPLES: 3 Collective-choice arrangements
23. Do the group of appropriators have options* to express their needs and concerns to those official of the group’s organization who make collective choice decision in relation to the resource? <EXPOWN>(1) Yes, at least one of these activities are used(0) No, none of these activities are used(-1) MIC(-2) NA
MIC=Missing in caseNA=Not available
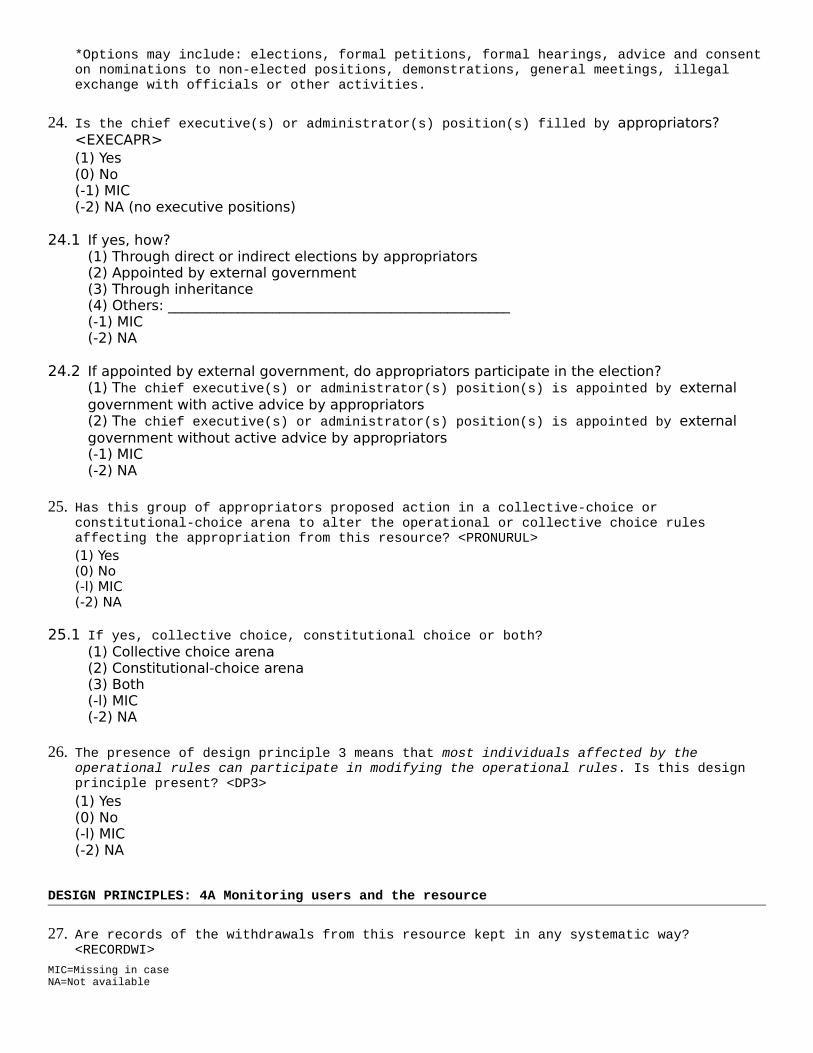
*Options may include: elections, formal petitions, formal hearings, advice and consenton nominations to non-elected positions, demonstrations, general meetings, illegal exchange with officials or other activities.
24. Is the chief executive(s) or administrator(s) position(s) filled by appropriators? <EXECAPR>(1) Yes(0) No(-1) MIC(-2) NA (no executive positions)
24.1 If yes, how? (1) Through direct or indirect elections by appropriators(2) Appointed by external government (3) Through inheritance(4) Others: _________________________________________________(-1) MIC(-2) NA
24.2 If appointed by external government, do appropriators participate in the election? (1) The chief executive(s) or administrator(s) position(s) is appointed by external government with active advice by appropriators(2) The chief executive(s) or administrator(s) position(s) is appointed by external government without active advice by appropriators(-1) MIC(-2) NA
25. Has this group of appropriators proposed action in a collective-choice or constitutional-choice arena to alter the operational or collective choice rules affecting the appropriation from this resource? <PRONURUL>(1) Yes(0) No (-l) MIC(-2) NA
25.1 If yes, collective choice, constitutional choice or both? (1) Collective choice arena(2) Constitutional-choice arena(3) Both(-l) MIC(-2) NA
26. The presence of design principle 3 means that most individuals affected by the operational rules can participate in modifying the operational rules. Is this design principle present? <DP3>(1) Yes(0) No(-l) MIC(-2) NA
DESIGN PRINCIPLES: 4A Monitoring users and the resource
27. Are records of the withdrawals from this resource kept in any systematic way? <RECORDWI>
MIC=Missing in caseNA=Not available

(1) Yes(0) No(-1) MIC
27.1 If yes, how often?
(1) Always(2) Most times(3) Sometimes(-1) MIC
28. Are records of the condition of the resource kept in any systematic way? <RECORDCO>(1) Yes(0) No(-1) MIC
28.1 If yes, how often? (1) Always(2) Most times(3) Sometimes(-1) MIC
29. The presence of design principle 4A means that monitors are present and actively auditCPR conditions and appropriator behavior. Is this design principle present? <DP4A>(1) Yes(0) No(-l) MIC(-2) NA
DESIGN PRINCIPLES: 4B Monitors accountability
30. Do appropriators monitor the appropriation activities of each other apart from the monitoring of any "official" guards? <SELFMON>
(1) Yes(0) No(-1) MIC(-2) NA
31. Does an "official" position of monitor exist (apart from the willingness of all appropriators to monitor)? <GUARD>
(1) Yes(0) No(-1) MIC(-2) NA
31.1 If yes, how is this position selected? (1) Appropriators (not necessarily all) rotate into this position(2) Appropriators are selected by appropriators for this position(3) Local non-appropriators are selected by appropriators for this position(4) Local non-appropriators are selected by a local general purpose government(5) Monitors are employees of an external governmental authority(6) Some are selected by appropriators and some are selected by a local general purpose government
MIC=Missing in caseNA=Not available

(7) Some are selected by appropriators and some are employees of an external government authority(8) Some are selected by a local general purpose government and some are employees of an external government authority(9) Some are selected by appropriators, some are selected by a local general purpose government, and some are employees of an external government authority(10) Others:_______________________________________________(-1) MIC(-2) NA
32. The presence of design principle 4B means that monitors are accountable to or are the appropriators. Is this design principle present? <DP4B>(1) Yes(0) No(-l) MIC(-2) NA
DESIGN PRINCIPLES: 5 Graduated sanctions
33. Is there a gradation of social, physical, and official sanctions that varies with the severity of rule violations? <VARSANCT>
(1) Yes (0) No, little or no variation on sanction(-1) MIC(-2) NA
33.1 If yes, at which range?(1) Considerable range of sanctions are imposed depending on type of rule infractions(2) Moderate range of sanctions are imposed depending on type of rule infractions(1,2) Considerable or moderate range of sanctions are imposed depending on type of rule infractions(3) Limited range of sanctions are imposed depending on type of rule infractions(-1) MIC(-2) NA
34. The presence of design principle 5 means that appropriators who violate operation rules are likely to be assessed graduated sanctions (depending on the seriousness and context of the offense) by other appropriators, officials accountable to these appropriators, or both. Is this design principle present? <DP5>
(1) Yes(0) No(-l) MIC(-2) NA
DESIGN PRINCIPLES: 6 Conflict-resolution mechanisms
35. Are there arenas being used for the exchange of information about conditions of the resource? <ARENAS>(1) Yes(0) No(-1) MIC
MIC=Missing in caseNA=Not available

36. The presence of design principle 6 means that appropriators and their officials have rapid access to low-cost local arenas to resolve conflicts among appropriators or between appropriators and officials. Is this design principle present? <DP6>
(1) Yes(0) No(-l) MIC(-2) NA
DESIGN PRINCIPLES: 7 Minimal recognition of rights to organize
37. Do members of this group of appropriators have the right to participate in the management of this resource? <MANAGE>(1) Yes(0) No(-l) MIC
37.1 If yes, De jure or De facto? (1) De jure(2) De facto(-1) MIC(-2) NA
37.2 If not, are De jure rights present?
(1) Yes(0) No(-1) MIC(-2) NA
38. The presence of design principle 7 means that the rights of appropriators to devise their own institutions are not challenged by external governmental authorities. Is this design principle present? <DP7>
(1) Yes(0) No(-l) MIC(-2) NA
DESIGN PRINCIPLES: 8 Nested enterprises
39. Does the chief executive(s) or administrator(s) report to any external or higher levelauthority? <EXTREP>(1) Yes(0) No(-1) MIC(-2) NA
40. Are the appropriators of this resource part of more than one organization*? <ORGTYPE>(1) Yes(0) No(-1) MIC(-2) NA
*The types of organizations are:
MIC=Missing in caseNA=Not available

General Purpose Government and Communal EnterprisesA = a regular agency of the national governmentB = a regular agency of a regional governmentC = a regular agency of a local governmentD = a local communal enterpriseSector Specific GovernmentE = a specially created national enterpriseF = a specially created regional governmental enterpriseG = a specially created local governmental enterpriseSpecial Organizations Related to ResourceI = an AGO organized as a cooperativeJ = an AGO not organized as a cooperativeK = a group that has achieved coordination without formal organizationGeneral Voluntary and Private AssociationsL = private for profitM = co-ops with broader jurisdiction than resourceN = unionsOthers
41. The presence of design principle 8 means that appropriation, provision, monitoring, enforcement, conflict resolution, and governance activities are organized in multiple layers of nested enterprises. Is this design principle present? <DP8>(1) Yes(0) No(-l) MIC(-2) NA
MIC=Missing in caseNA=Not available

CENTER FOR BEHAVIOR, INSTITUTIONS & THE ENVIRONMENT (CBIE)
Intercoder Reliabilty Testing
Coding Project 2013-2014
For questions please contact Ute Brady at [email protected]

Team vargroup Krippendorff Fleiss Percent Agree
ACH env 0.603 0.602 80.60
ACH soc 0.693 0.692 68.80
ACH success 1.000 1.000 100.00
ACH DP1 0.261 0.256 33.30
ACH DP2 0.327 0.322 37.50
ACH DP3 0.387 0.384 64.30
ACH DP4 0.591 0.590 59.30
ACH DP5 -0.138 -0.149 50.00
ACH DP6 -0.241 -0.258 16.70
ACH DP7 0.389 0.385 50.00
ACH DP8 -0.274 -0.286 33.30
ACU env 0.435 0.432 52.80
ACU soc 0.270 0.265 58.30
ACU success -0.240 -0.312 0.00
ACU DP1 0.536 0.530 66.70
ACU DP2 0.116 0.103 50.00
ACU DP3 0.342 0.337 47.60
ACU DP4 0.341 0.337 51.90
ACU DP5 0.759 0.755 88.90
ACU DP6 0.344 0.325 50.00
ACU DP7 0.696 0.692 75.00
ACU DP8 0.456 0.446 55.60
ADU env 0.156 0.150 54.20
ADU soc 0.221 0.213 31.20
ADU success 0.312 0.250 50.00
ADU DP1 0.325 0.311 25.00
ADU DP2 0.877 0.874 87.50
ADU DP3 0.525 0.519 64.30
ADU DP4 0.921 0.921 94.40
ADU DP5 0.836 0.832 83.30
ADU DP6 0.739 0.727 75.00
ADU DP7 0.633 0.625 75.00
ADU DP8 1.000 100.00
AEN env 0.824 0.823 91.70
AEN soc 0.701 0.701 75.00
AEN success 0.823 0.819 85.70
AEN DP1 0.477 0.474 64.30
AEN DP2 0.784 0.782 82.10
AEN DP3 0.674 0.673 69.40
AEN DP4 0.591 0.590 66.70
AEN DP5 0.715 0.712 76.20
AEN DP6 0.829 0.827 85.70

Team vargroup Krippendorff Fleiss Percent Agree
AEN DP7 0.914 0.914 92.90
AEN DP8 0.746 0.744 81.00
AEU env 0.548 0.547 72.60
AEU soc 0.457 0.455 51.80
AEU success 1.000 1.000 100.00
AEU DP1 0.696 0.694 71.40
AEU DP2 0.784 0.782 78.60
AEU DP3 0.767 0.766 81.60
AEU DP4 0.706 0.705 74.60
AEU DP5 -0.030 -0.039 85.70
AEU DP6 0.595 0.590 64.30
AEU DP7 0.712 0.710 71.40
AEU DP8 0.238 0.232 33.30
AHU env 0.349 0.345 70.80
AHU soc 0.838 0.836 81.20
AHU success -0.100 -0.200 50.00
AHU DP1 0.879 0.876 87.50
AHU DP2 0.713 0.707 75.00
AHU DP3 0.792 0.789 85.70
AHU DP4 0.450 0.445 61.10
AHU DP5 0.803 0.798 83.30
AHU DP6 0.671 0.657 75.00
AHU DP7 0.573 0.564 62.50
AHU DP8 0.781 0.775 83.30
ANU env 0.618 0.615 75.00
ANU soc 0.378 0.371 31.20
ANU success 1.000 1.000 100.00
ANU DP1 0.873 0.870 87.50
ANU DP2 0.386 0.373 50.00
ANU DP3 0.800 0.798 85.70
ANU DP4 0.657 0.654 66.70
ANU DP5 0.836 0.832 83.30
ANU DP6 -0.150 -0.200 50.00
ANU DP7 0.174 0.157 25.00
ANU DP8 0.375 0.357 66.70
CDE env 0.544 0.543 66.70
CDE soc 0.762 0.761 75.00
CDE success 1.000 100.00
CDE DP1 1.000 1.000 100.00
CDE DP2 -0.188 -0.200 50.00
CDE DP3 0.391 0.387 42.90
CDE DP4 0.739 0.737 77.80

Team vargroup Krippendorff Fleiss Percent Agree
CDE DP5 1.000 1.000 100.00
CDE DP6 1.000 100.00
CDE DP7 0.710 0.707 75.00
CDE DP8 0.366 0.357 66.70
CDU env 0.747 0.747 75.00
CDU soc 0.322 0.319 32.50
CDU success 1.000 100.00
CDU DP1 0.914 0.913 95.00
CDU DP2 0.375 0.370 80.00
CDU DP3 0.668 0.667 77.10
CDU DP4 0.714 0.713 73.30
CDU DP5 -0.110 -0.122 0.00
CDU DP6 -0.017 -0.035 90.00
CDU DP7 0.280 0.273 50.00
CDU DP8 0.113 0.103 20.00
CHN env 0.636 0.634 66.70
CHN soc 0.507 0.503 45.80
CHN success -0.063 -0.125 66.70
CHN DP1 0.635 0.630 83.30
CHN DP2 0.584 0.578 66.70
CHN DP3 0.657 0.654 71.40
CHN DP4 0.551 0.548 63.00
CHN DP5 0.802 0.799 88.90
CHN DP6 0.773 0.766 83.30
CHN DP7 0.895 0.893 91.70
CHN DP8 0.438 0.427 55.60
DHN env 0.473 0.473 69.40
DHN soc 0.657 0.656 77.10
DHN success 0.868 0.866 91.70
DHN DP1 0.550 0.549 64.60
DHN DP2 0.535 0.533 58.30
DHN DP3 0.798 0.798 79.80
DHN DP4 0.731 0.730 74.10
DHN DP5 0.496 0.494 55.60
DHN DP6 0.398 0.394 58.30
DHN DP7 0.568 0.567 58.30
DHN DP8 0.757 0.756 80.60
DEU env 0.495 0.493 77.10
DEU soc 0.571 0.569 53.10
DEU success 0.477 0.455 50.00
DEU DP1 0.692 0.688 75.00
DEU DP2 0.578 0.574 62.50

Team vargroup Krippendorff Fleiss Percent Agree
DEU DP3 0.529 0.526 64.30
DEU DP4 0.433 0.430 61.10
DEU DP5 0.817 0.814 83.30
DEU DP6 0.475 0.464 50.00
DEU DP7 0.503 0.498 56.20
DEU DP8 0.222 0.211 33.30
EHU env 0.384 0.381 75.00
EHU soc 0.285 0.280 54.20
EHU success 0.292 0.250 33.30
EHU DP1 0.624 0.618 75.00
EHU DP2 0.560 0.554 66.70
EHU DP3 0.713 0.710 71.40
EHU DP4 0.388 0.384 51.90
EHU DP5 0.350 0.338 33.30
EHU DP6 1.000 1.000 100.00
EHU DP7 0.496 0.489 66.70
EHU DP8 0.408 0.397 44.40

CENTER FOR BEHAVIOR, INSTITUTIONS & THE ENVIRONMENT (CBIE)
Intercoder Reliability Testing: Detailed results for all teams
Coding Project 2013-2014
Team ACH:
Env-var:
Krippendorff's alpha Subjects = 72 Raters = 3 alpha = 0.603
Fleiss' Kappa for m Raters Subjects = 72 Raters = 3 Kappa = 0.602 z = 15.5 p-value = 0
Percentage agreement (Tolerance=0) Subjects = 72 Raters = 3 %-agree = 80.6 Soc-var: Krippendorff's alpha Subjects = 48 Raters = 3 alpha = 0.693 Fleiss' Kappa for m Raters Subjects = 48 Raters = 3 Kappa = 0.692 z = 15.4 p-value = 0 Percentage agreement (Tolerance=0) Subjects = 48 Raters = 3 %-agree = 68.8
Success:
Krippendorff's alpha Subjects = 6 Raters = 3 alpha = 1 Fleiss' Kappa for m Raters

Subjects = 6 Raters = 3 Kappa = 1 z = 4.24 p-value = 2.21e-05 Percentage agreement (Tolerance=0) Subjects = 6 Raters = 3 %-agree = 100 DP1: Krippendorff's alpha Subjects = 24 Raters = 3 alpha = 0.261 Fleiss' Kappa for m Raters Subjects = 24 Raters = 3 Kappa = 0.256 z = 3.54 p-value = 0.000399 Percentage agreement (Tolerance=0) Subjects = 24 Raters = 3 %-agree = 33.3 DP-2: Krippendorff's alpha Subjects = 24 Raters = 3 alpha = 0.327 Fleiss' Kappa for m Raters Subjects = 24 Raters = 3 Kappa = 0.322 z = 3.83 p-value = 0.000129 Percentage agreement (Tolerance=0) Subjects = 24 Raters = 3 %-agree = 37.5 DP-3: Krippendorff's alpha Subjects = 42 Raters = 3 alpha = 0.387

Fleiss' Kappa for m Raters Subjects = 42 Raters = 3 Kappa = 0.384 z = 4.31 p-value = 1.62e-05 Percentage agreement (Tolerance=0) Subjects = 42 Raters = 3 %-agree = 64.3 DP-4: Krippendorff's alpha Subjects = 54 Raters = 3 alpha = 0.591 Fleiss' Kappa for m Raters Subjects = 54 Raters = 3 Kappa = 0.59 z = 11.3 p-value = 0 Percentage agreement (Tolerance=0) Subjects = 54 Raters = 3 %-agree = 59.3 DP-5: Krippendorff's alpha Subjects = 18 Raters = 3 alpha = -0.138 Fleiss' Kappa for m Raters Subjects = 18 Raters = 3 Kappa = -0.149 z = -1.38 p-value = 0.169 Percentage agreement (Tolerance=0) Subjects = 18 Raters = 3 %-agree = 50 DP-6: Krippendorff's alpha Subjects = 12

Raters = 3 alpha = -0.241 Fleiss' Kappa for m Raters Subjects = 12 Raters = 3 Kappa = -0.258 z = -1.91 p-value = 0.0556 Percentage agreement (Tolerance=0) Subjects = 12 Raters = 3 %-agree = 16.7 DP-7: Krippendorff's alpha Subjects = 24 Raters = 3 alpha = 0.389 Fleiss' Kappa for m Raters Subjects = 24 Raters = 3 Kappa = 0.385 z = 3.99 p-value = 6.58e-05 Percentage agreement (Tolerance=0) Subjects = 24 Raters = 3 %-agree = 50 DP-8: Krippendorff's alpha Subjects = 18 Raters = 3 alpha = -0.274 Fleiss' Kappa for m Raters Subjects = 18 Raters = 3 Kappa = -0.286 z = -2.1 p-value = 0.0358 Percentage agreement (Tolerance=0) Subjects = 18 Raters = 3 %-agree = 33.3


Team ACU:
Env-var:
Krippendorff's alpha Subjects = 36 Raters = 3 alpha = 0.435 Fleiss' Kappa for m Raters Subjects = 36 Raters = 3 Kappa = 0.432 z = 8.3 p-value = 0 Percentage agreement (Tolerance=0) Subjects = 36 Raters = 3 %-agree = 52.8 Soc-var: Krippendorff's alpha Subjects = 24 Raters = 3 alpha = 0.27 Fleiss' Kappa for m Raters Subjects = 24 Raters = 3 Kappa = 0.265 z = 3.57 p-value = 0.000357 Percentage agreement (Tolerance=0) Subjects = 24 Raters = 3 %-agree = 58.3 Success: Krippendorff's alpha Subjects = 3 Raters = 3 alpha = -0.24 Fleiss' Kappa for m Raters Subjects = 3 Raters = 3 Kappa = -0.312 z = -1.19 p-value = 0.236 Percentage agreement (Tolerance=0) Subjects = 3

Raters = 3 %-agree = 0 DP1: Krippendorff's alpha Subjects = 12 Raters = 3 alpha = 0.536 Fleiss' Kappa for m Raters Subjects = 12 Raters = 3 Kappa = 0.53 z = 4.94 p-value = 7.65e-07 Percentage agreement (Tolerance=0) Subjects = 12 Raters = 3 %-agree = 66.7 DP2: Krippendorff's alpha Subjects = 12 Raters = 3 alpha = 0.116 Fleiss' Kappa for m Raters Subjects = 12 Raters = 3 Kappa = 0.103 z = 0.792 p-value = 0.429 Percentage agreement (Tolerance=0) Subjects = 12 Raters = 3 %-agree = 50 DP3: Krippendorff's alpha Subjects = 21 Raters = 3 alpha = 0.342 Fleiss' Kappa for m Raters Subjects = 21 Raters = 3 Kappa = 0.337 z = 3.57 p-value = 0.000356

Percentage agreement (Tolerance=0) Subjects = 21 Raters = 3 %-agree = 47.6 DP4: Krippendorff's alpha Subjects = 27 Raters = 3 alpha = 0.341 Fleiss' Kappa for m Raters Subjects = 27 Raters = 3 Kappa = 0.337 z = 3.68 p-value = 0.000236 Percentage agreement (Tolerance=0) Subjects = 27 Raters = 3 %-agree = 51.9 DP5: Krippendorff's alpha Subjects = 9 Raters = 3 alpha = 0.759 Fleiss' Kappa for m Raters Subjects = 9 Raters = 3 Kappa = 0.755 z = 3.92 p-value = 8.83e-05 Percentage agreement (Tolerance=0) Subjects = 9 Raters = 3 %-agree = 88.9 DP6: Krippendorff's alpha Subjects = 6 Raters = 3 alpha = 0.344 Fleiss' Kappa for m Raters Subjects = 6 Raters = 3 Kappa = 0.325 z = 1.38 p-value = 0.168

Percentage agreement (Tolerance=0) Subjects = 6 Raters = 3 %-agree = 50 DP7: Krippendorff's alpha Subjects = 12 Raters = 3 alpha = 0.696 Fleiss' Kappa for m Raters Subjects = 12 Raters = 3 Kappa = 0.692 z = 6.82 p-value = 9.01e-12 Percentage agreement (Tolerance=0) Subjects = 12 Raters = 3 %-agree = 75 DP8: Krippendorff's alpha Subjects = 9 Raters = 3 alpha = 0.456 Fleiss' Kappa for m Raters Subjects = 9 Raters = 3 Kappa = 0.446 z = 3.13 p-value = 0.00173 Percentage agreement (Tolerance=0) Subjects = 9 Raters = 3 %-agree = 55.6

Team ADU:
Env-var:
Krippendorff's alpha Subjects = 24 Raters = 3 alpha = 0.156
Fleiss' Kappa for m Raters Subjects = 24 Raters = 3 Kappa = 0.15 z = 1.94 p-value = 0.0528 Percentage agreement (Tolerance=0) Subjects = 24 Raters = 3 %-agree = 54.2 Soc-var: Krippendorff's alpha Subjects = 16 Raters = 3 alpha = 0.221 Fleiss' Kappa for m Raters Subjects = 16 Raters = 3 Kappa = 0.213 z = 2.76 p-value = 0.00586 Percentage agreement (Tolerance=0) Subjects = 16 Raters = 3 %-agree = 31.2 Success: Krippendorff's alpha Subjects = 2 Raters = 3 alpha = 0.312 Fleiss' Kappa for m Raters Subjects = 2 Raters = 3 Kappa = 0.25 z = 0.612 p-value = 0.54 Percentage agreement (Tolerance=0) Subjects = 2

Raters = 3 %-agree = 50 DP1: Krippendorff's alpha Subjects = 8 Raters = 3 alpha = 0.325 Fleiss' Kappa for m Raters Subjects = 8 Raters = 3 Kappa = 0.311 z = 2.74 p-value = 0.00616 Percentage agreement (Tolerance=0) Subjects = 8 Raters = 3 %-agree = 25 DP2: Krippendorff's alpha Subjects = 8 Raters = 3 alpha = 0.877 Fleiss' Kappa for m Raters Subjects = 8 Raters = 3 Kappa = 0.874 z = 6.04 p-value = 1.53e-09 Percentage agreement (Tolerance=0) Subjects = 8 Raters = 3 %-agree = 87.5 DP3: Krippendorff's alpha Subjects = 14 Raters = 3 alpha = 0.525 Fleiss' Kappa for m Raters Subjects = 14 Raters = 3 Kappa = 0.519 z = 4.4 p-value = 1.06e-05

Percentage agreement (Tolerance=0) Subjects = 14 Raters = 3 %-agree = 64.3 DP4: Krippendorff's alpha Subjects = 18 Raters = 3 alpha = 0.921 Fleiss' Kappa for m Raters Subjects = 18 Raters = 3 Kappa = 0.921 z = 7.57 p-value = 3.69e-14 Percentage agreement (Tolerance=0) Subjects = 18 Raters = 3 %-agree = 94.4 DP5: Krippendorff's alpha Subjects = 6 Raters = 3 alpha = 0.836 Fleiss' Kappa for m Raters Subjects = 6 Raters = 3 Kappa = 0.832 z = 4.97 p-value = 6.8e-07 Percentage agreement (Tolerance=0) Subjects = 6 Raters = 3 %-agree = 83.3 DP6: Krippendorff's alpha Subjects = 4 Raters = 3 alpha = 0.739 Fleiss' Kappa for m Raters Subjects = 4 Raters = 3 Kappa = 0.727 z = 3.39 p-value = 0.00071

Percentage agreement (Tolerance=0) Subjects = 4 Raters = 3 %-agree = 75 DP7: Krippendorff's alpha Subjects = 8 Raters = 3 alpha = 0.633 Fleiss' Kappa for m Raters Subjects = 8 Raters = 3 Kappa = 0.625 z = 3.06 p-value = 0.0022 Percentage agreement (Tolerance=0) Subjects = 8 Raters = 3 %-agree = 75 DP8: Krippendorff's alpha Subjects = 6 Raters = 3 alpha = 1 Fleiss' Kappa for m Raters Subjects = 6 Raters = 3 Kappa = NaN z = NaN p-value = NaN NOTE: all coded values 2 cases/3 var = -1 Percentage agreement (Tolerance=0) Subjects = 6 Raters = 3 %-agree = 100

##Read in environmental coding variable data
Environ<-read.table("EHUenv-var-NA.csv",header=TRUE,sep=",",row.names=1)
##Explore data
Environ ##R will display all the data
names(Environ) ##R will display column headers of data
dim(Environ) ## R will display the number of rows & the number of columns
###Turn dataframe into matrix format and exclude NA values
as.matrix(sapply(Environ, as.numeric))
Environ1<-as.matrix(Environ)
Environ1
# Exclude columns with NA values
Environ1.exclude<-Environ1[ , colSums(is.na(Environ1)) == 0]
Environ1.exclude
##Load irr library
library(irr)
library(lpSolve)
##Calculate Krippendorff's alpha on binary values (0/1)
## first assume the default nominal classification
kripp.alpha(Environ1.exclude,method="nominal")
##Calculate Fleiss' kappa (need to transpose matrix to perform this calculation)
Environ2<-t(Environ1.exclude)
Environ2
kappam.fleiss(as.matrix(Environ2,exact=FALSE,detail=FALSE))
##Calculate simple percent agreement
agree(Environ2) # Simple percentage agreement
##########################################################################################################################
##Read in social coding variable data
Social<-read.table("EHUsoc-var-NA.csv",header=TRUE,sep=",",row.names=1)
##Explore data
Social ##R will display all the data
names(Social) ##R will display column headers of data
dim(Social) ## R will display the number of rows & the number of columns
###Turn dataframe into matrix format and exclude NA values
as.matrix(sapply(Social, as.numeric))
Social1<-as.matrix(Social)
Social1
# Exclude columns with NA values
Social1.exclude<-Social1[ , colSums(is.na(Social1)) == 0]
Social1.exclude
##Load irr library
library(irr)
library(lpSolve)
##Calculate Krippendorff's alpha on binary values (0/1)
## first assume the default nominal classification
kripp.alpha(Social1.exclude,method="nominal")
##Calculate Fleiss' kappa (need to transpose matrix to perform this calculation)
Social2<-t(Social1.exclude)
Social2
kappam.fleiss(as.matrix(Social2,exact=FALSE,detail=FALSE))
##Calculate simple percent agreement
agree(Social2) # Simple percentage agreement
#############################################################################################################################
##Read in success variable coding data
Success<-read.table("EHUsuccess-NA.csv",header=TRUE,sep=",",row.names=1)
##Explore data
Success ##R will display all the data
names(Success) ##R will display column headers of data
dim(Success) ## R will display the number of rows & the number of columns
###Turn dataframe into matrix format and exclude NA values
as.matrix(sapply(Success, as.numeric))
Success1<-as.matrix(Success)
Success1
# Exclude columns with NA values
Success1.exclude<-Success1[ , colSums(is.na(Success1)) == 0]
Success1.exclude

##Load irr library
library(irr)
library(lpSolve)
##Calculate Krippendorff's alpha on binary values (0/1)
## first assume the default nominal classification
kripp.alpha(Success1.exclude,method="nominal")
##Calculate Fleiss' kappa (need to transpose matrix to perform this calculation)
Success2<-t(Success1.exclude)
Success2
kappam.fleiss(as.matrix(Success2,exact=FALSE,detail=FALSE))
##Calculate simple percent agreement
agree(Success2) # Simple percentage agreement
###############################################################################################################################
##Read in DP1 coding variable data
DP1<-read.table("EHU-DP1-NA.csv",header=TRUE,sep=",",row.names=1)
##Explore data
DP1 ##R will display all the data
names(DP1) ##R will display column headers of data
dim(DP1) ## R will display the number of rows & the number of columns
###Turn dataframe into matrix format and exclude NA values
as.matrix(sapply(DP1, as.numeric))
DP11<-as.matrix(DP1)
DP11
# Exclude columns with NA values
DP11.exclude<-DP11[ , colSums(is.na(DP11)) == 0]
DP11.exclude
##Load irr library
library(irr)
library(lpSolve)
##Calculate Krippendorff's alpha on binary values (0/1)
## first assume the default nominal classification
kripp.alpha(DP11.exclude,method="nominal")
##Calculate Fleiss' kappa (need to transpose matrix to perform this calculation)
DP12<-t(DP11.exclude)
DP12
kappam.fleiss(as.matrix(DP12,exact=FALSE,detail=FALSE))
##Calculate simple percent agreement
agree(DP12) # Simple percentage agreement
##############################################################################################################################
##Read in DP2 variable coding data
DP2<-read.table("EHU-DP2-NA.csv",header=TRUE,sep=",",row.names=1)
##Explore data
DP2 ##R will display all the data
names(DP2) ##R will display column headers of data
dim(DP2) ## R will display the number of rows & the number of columns
###Turn dataframe into matrix format and exclude NA values
as.matrix(sapply(DP2, as.numeric))
DP21<-as.matrix(DP2)
DP21
# Exclude columns with NA values
DP21.exclude<-DP21[ , colSums(is.na(DP21)) == 0]
DP21.exclude
##Load irr library
library(irr)
library(lpSolve)
##Calculate Krippendorff's alpha on binary values (0/1)
## first assume the default nominal classification
kripp.alpha(DP21.exclude,method="nominal")
##Calculate Fleiss' kappa (need to transpose matrix to perform this calculation)
DP22<-t(DP21.exclude)
DP22
kappam.fleiss(as.matrix(DP22,exact=FALSE,detail=FALSE))
##Calculate simple percent agreement
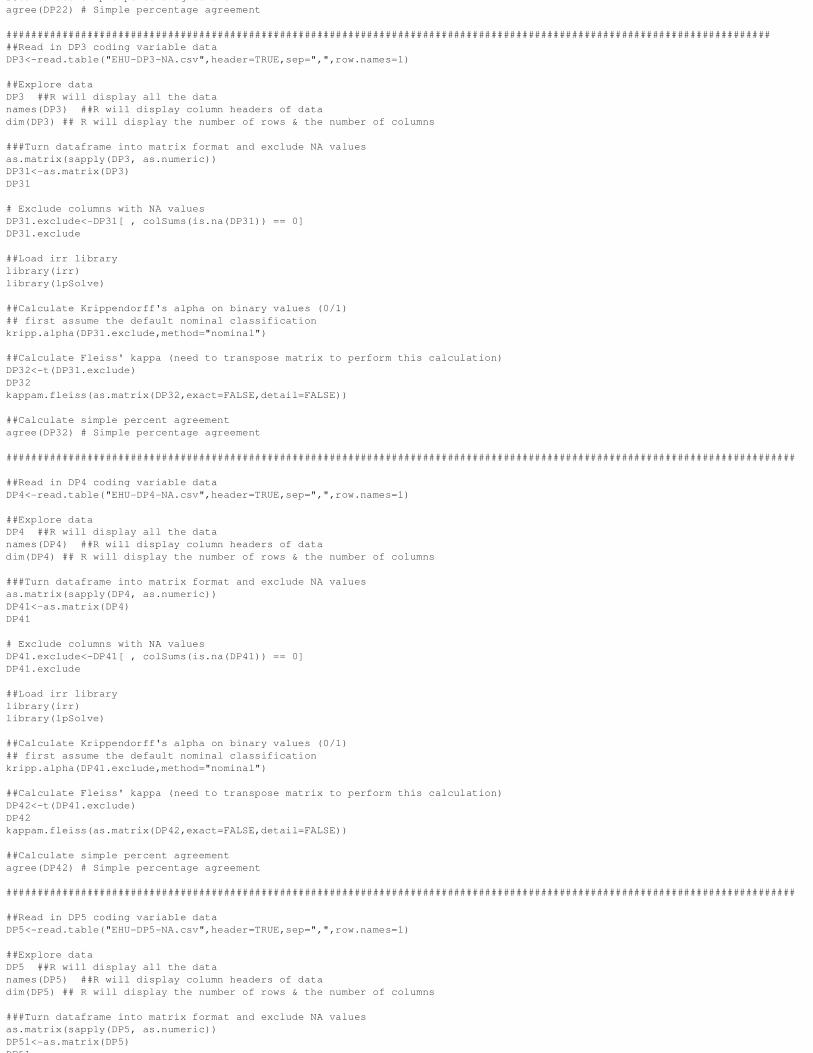
##Calculate simple percent agreement
agree(DP22) # Simple percentage agreement
###########################################################################################################################
##Read in DP3 coding variable data
DP3<-read.table("EHU-DP3-NA.csv",header=TRUE,sep=",",row.names=1)
##Explore data
DP3 ##R will display all the data
names(DP3) ##R will display column headers of data
dim(DP3) ## R will display the number of rows & the number of columns
###Turn dataframe into matrix format and exclude NA values
as.matrix(sapply(DP3, as.numeric))
DP31<-as.matrix(DP3)
DP31
# Exclude columns with NA values
DP31.exclude<-DP31[ , colSums(is.na(DP31)) == 0]
DP31.exclude
##Load irr library
library(irr)
library(lpSolve)
##Calculate Krippendorff's alpha on binary values (0/1)
## first assume the default nominal classification
kripp.alpha(DP31.exclude,method="nominal")
##Calculate Fleiss' kappa (need to transpose matrix to perform this calculation)
DP32<-t(DP31.exclude)
DP32
kappam.fleiss(as.matrix(DP32,exact=FALSE,detail=FALSE))
##Calculate simple percent agreement
agree(DP32) # Simple percentage agreement
###############################################################################################################################
##Read in DP4 coding variable data
DP4<-read.table("EHU-DP4-NA.csv",header=TRUE,sep=",",row.names=1)
##Explore data
DP4 ##R will display all the data
names(DP4) ##R will display column headers of data
dim(DP4) ## R will display the number of rows & the number of columns
###Turn dataframe into matrix format and exclude NA values
as.matrix(sapply(DP4, as.numeric))
DP41<-as.matrix(DP4)
DP41
# Exclude columns with NA values
DP41.exclude<-DP41[ , colSums(is.na(DP41)) == 0]
DP41.exclude
##Load irr library
library(irr)
library(lpSolve)
##Calculate Krippendorff's alpha on binary values (0/1)
## first assume the default nominal classification
kripp.alpha(DP41.exclude,method="nominal")
##Calculate Fleiss' kappa (need to transpose matrix to perform this calculation)
DP42<-t(DP41.exclude)
DP42
kappam.fleiss(as.matrix(DP42,exact=FALSE,detail=FALSE))
##Calculate simple percent agreement
agree(DP42) # Simple percentage agreement
###############################################################################################################################
##Read in DP5 coding variable data
DP5<-read.table("EHU-DP5-NA.csv",header=TRUE,sep=",",row.names=1)
##Explore data
DP5 ##R will display all the data
names(DP5) ##R will display column headers of data
dim(DP5) ## R will display the number of rows & the number of columns
###Turn dataframe into matrix format and exclude NA values
as.matrix(sapply(DP5, as.numeric))
DP51<-as.matrix(DP5)
DP51

DP51
# Exclude columns with NA values
DP51.exclude<-DP51[ , colSums(is.na(DP51)) == 0]
DP51.exclude
##Load irr library
library(irr)
library(lpSolve)
##Calculate Krippendorff's alpha on binary values (0/1)
## first assume the default nominal classification
kripp.alpha(DP51.exclude,method="nominal")
##Calculate Fleiss' kappa (need to transpose matrix to perform this calculation)
DP52<-t(DP51.exclude)
DP52
kappam.fleiss(as.matrix(DP52,exact=FALSE,detail=FALSE))
##Calculate simple percent agreement
agree(DP52) # Simple percentage agreement
###############################################################################################################################
##Read in DP6 coding variable data
DP6<-read.table("EHU-DP6-NA.csv",header=TRUE,sep=",",row.names=1)
##Explore data
DP6 ##R will display all the data
names(DP6) ##R will display column headers of data
dim(DP6) ## R will display the number of rows & the number of columns
###Turn dataframe into matrix format and exclude NA values
as.matrix(sapply(DP6, as.numeric))
DP61<-as.matrix(DP6)
DP61
# Exclude columns with NA values
DP61.exclude<-DP61[ , colSums(is.na(DP61)) == 0]
DP61.exclude
##Load irr library
library(irr)
library(lpSolve)
##Calculate Krippendorff's alpha on binary values (0/1)
## first assume the default nominal classification
kripp.alpha(DP61.exclude,method="nominal")
##Calculate Fleiss' kappa (need to transpose matrix to perform this calculation)
DP62<-t(DP61.exclude)
DP62
kappam.fleiss(as.matrix(DP62,exact=FALSE,detail=FALSE))
##Calculate simple percent agreement
agree(DP62) # Simple percentage agreement
##################################################################################################################################
##Read in DP7 coding variable data
DP7<-read.table("EHU-DP7-NA.csv",header=TRUE,sep=",",row.names=1)
##Explore data
DP7 ##R will display all the data
names(DP7) ##R will display column headers of data
dim(DP7) ## R will display the number of rows & the number of columns
###Turn dataframe into matrix format and exclude NA values
as.matrix(sapply(DP7, as.numeric))
DP71<-as.matrix(DP7)
DP71
# Exclude columns with NA values
DP71.exclude<-DP71[ , colSums(is.na(DP71)) == 0]
DP71.exclude
##Load irr library
library(irr)
library(lpSolve)
##Calculate Krippendorff's alpha on binary values (0/1)
## first assume the default nominal classification
kripp.alpha(DP71.exclude,method="nominal")
##Calculate Fleiss' kappa (need to transpose matrix to perform this calculation)
DP72<-t(DP71.exclude)

DP72<-t(DP71.exclude)
DP72
kappam.fleiss(as.matrix(DP72,exact=FALSE,detail=FALSE))
##Calculate simple percent agreement
agree(DP72) # Simple percentage agreement
################################################################################################################################
##Read in DP8 coding variable data
DP8<-read.table("EHU-DP8-NA.csv",header=TRUE,sep=",",row.names=1)
##Explore data
DP8 ##R will display all the data
names(DP8) ##R will display column headers of data
dim(DP8) ## R will display the number of rows & the number of columns
###Turn dataframe into matrix format and exclude NA values
as.matrix(sapply(DP8, as.numeric))
DP81<-as.matrix(DP8)
DP81
# Exclude columns with NA values
DP81.exclude<-DP81[ , colSums(is.na(DP81)) == 0]
DP81.exclude
##Load irr library
library(irr)
library(lpSolve)
##Calculate Krippendorff's alpha on binary values (0/1)
## first assume the default nominal classification
kripp.alpha(DP81.exclude,method="nominal")
##Calculate Fleiss' kappa (need to transpose matrix to perform this calculation)
DP82<-t(DP81.exclude)
DP82
kappam.fleiss(as.matrix(DP82,exact=FALSE,detail=FALSE))
##Calculate simple percent agreement
agree(DP82) # Simple percentage agreement