Embed Size (px)
Citation preview

Challenges and Opportunities in Capital
Markets for Commercial Real Estate
ULI - Turkey
Istanbul, Turkey
June 22, 2015
Professor Tony Ciochetti
Elmo Burke Jr. Chair of Finance
Chairman, University of Texas, San Antonio
Program in Real Estate Finance and Development

Main Points
• Market overview
• Forms of capital
• Institutional perspective - why global?
• Real estate specific issues (4)
• Take-aways

Perspective
Tokyo
Beijing
Shanghai
Hong Kong
Stockholm
London
Paris
Berlin Frankfurt
Munich
San Francisco
Los Angeles
Chicago
New York D.C.
Istanbul
Bangalore
Mumbai
Delhi Seoul
Helsinki
Boston Portland
Phoenix Miami
Denver
Lisbon Athens
Chennai
Dubai
Abu Dhabi
Shenzhen
Chongqing Seattle
Las Vegas
Kuwait
Nairobi
Monterrey
Bogota
Sydney

Where is the Money Going?

Global Capital Flows Transaction Volumes Q2-2015 - Trailing 12 mo.
Source: RCA

Top 25 Markets - 2014
Source: RCA

Global Transactions - 2014
Source: RCA

Net Change, 2014 vs. 2013
Source: RCA

Cross Border Activity
Source: RCA

Pricing?
Source: RCA

Drivers of Pricing
Source: RCA

Forms of Commercial Real Estate Capital
2014
Debt
(39%)
$3.3 trillion
Equity
(61%)
$5.1 trillion
Private
(83%)
$7.0 trillion
$2.3 trillion $4.7 trillion
Public
(17%)
$1.4 trillion
$1.0 trillion $.91 trillion
Source: Federal Reserve Flow of Funds

The Four Quadrants of
US Commercial Real Estate Markets
Debt (39%)
$3.3 trillion
Equity (61%)
$5.1 trillion
Private
(83%)
$7.0 trillion
$4.7 trillion
Public
(17%)
$1.4 trillion
Source: Federal Reserve Flow of Funds

Direct Real Estate: $4.7 Trillion
• Private investors: 60% - $2.8 trillion
– High net worth investors (HNWI)
– Tax deferred investors (1031)
– Tenants in common (TIC)
– Other private partnerships

Direct Real Estate: $4.7 Trillion
• Institutional investment: ~ 20-25% - $1.0 trillion
– Pension funds - $750 billion
– Endowments, foundations - $250 billion

Direct Real Estate: $4.7 Trillion
• Foreign investment: ~ 7-10% - $329 billion
– Australian
– German
– UK
– Middle East
– Japanese
– Dutch
– Canada
– China

Direct US Foreign Investment
Source: RCA

Direct Real Estate: $4.7 Trillion
• Other investments : 11% - $517 billion
– Life insurance companies
– Commercial banks
– Other private financial institutions
(hedge/opportunity)

The Four Quadrants of
US Commercial Real Estate Markets, 2013
Debt (39%)
$3.3 trillion
Equity (61%)
$5.1 trillion
Private
(83%)
$7.0 trillion
$2.3 trillion
Public
(17%)
$1.4 trillion
Source: Federal Reserve Flow of Funds

Commercial Mortgages: $2.3
Trillion
• Commercial banks: 57% - $1.3 trillion
• Life insurance companies: 21% - $483 billion
• Savings/Thrifts: 12% - $276 billion
• Government agencies: 10% - $230 billion

2nd Mortgage
Lien
on Property
Traditional
Mortgage Second
Mortgage Loan
Mezzanine
Finance
Preferred
Equity
‘B’ Notes
Borrower
Equity
1st
Mortgage
1st
Mortgage
Lien on
borrower
equity
Capital
contribution to
borrower equity
A
Note
Borrower
Equity
Borrower
Equity Borrower
Equity
Borrower
Equity
B Note
Credit support for
A Note
1st
Mortgage
Mezzanine Finance: $115 - $225 Billion
1st
Mortgage

The Four Quadrants of
US Commercial Real Estate Markets
Debt (39%)
$3.3 trillion
Equity (61%)
$5.1 trillion
Private
(83%)
$7.0 trillion
Public
(17%)
$1.4 trillion
$0.91 trillion
Source: Federal Reserve Flow of Funds

REITs?
Debt, equity, hybrid
– 1971 – 34 - $1.4 bn (12 E, 12 D, 10 H)
– 2006 – 183 - $438 bn (138 E, 38 D, 7 H)
– 2008 – 136 - $191 bn (113 E, 20 D, 3 H)
– 2014 – 216 - $907 bn (177 E, 39 D, 0 H)
Company must be in the real estate business
– At least 90% of TI must be distributed annually to shareholders
– At least 75 percent of assets must be real property
– At least 75 percent of GI from rents – less than 30% GI from sales
held less than 4 years
208 companies trade on the NYSE

Players – 2014?

How Have REITs Done?

26
Continued Globalization of REIT Market

The Four Quadrants of
US Commercial Real Estate Markets, 2013
Debt (39%)
$3.3 trillion
Equity (61%)
$5.1 trillion
Private
(83%)
$7.0 trillion
Public
(17%)
$1.4 trillion
$600 billion CMBS
$400 billion REIT
Debt
Source: Federal Reserve Flow of Funds

LOANS
POOL OF
LOANS
SECURITIES/
BONDS
BACKED BY
POOL
HOUSE
CAR
AIRCRAFT
EQUIPMENT
Securitized Loans: Intuition

US CMBS Issuance

CMBS Concept

Impact of Losses on Bonds
14%
12%
9%
5%
3%
2%
0%
AAA
(86%)
AA
(2%)
A
(3%)
BBB
(4%)
BB
(2%)
B
(1%)
UR
(2%)
% Subordination
Average
Loss
Experience
Worst
Cohort Loss
Experience
(1986)
Source: Morgan Stanley, Author
4.9% 8.1%
13.9%
Asset Sale

CMBS Rollover Risk

Unsecured REIT Bonds: $400 bn
• Typical form of financing for REITs
• Similar to unsecured Corporate Debt

Institutional Perspective - Why
Real Estate?
• State Teachers Retirement System of Ohio
– ~ $80 bn
– Equities - 57%
– Cash – 1%
– Fixed – 18%
– Direct RE – 10% (9%) - ~ 55% core, 35% va, 7-10% opp :
$8bn RE
– Alt – 14% (PE/Opptnistic/Funds) : RE $575 mm funds

Attraction of Commercial Real Estate
Source: RCA

Rebound in US Commercial RE Prices
Source: RCA

‘Style’ Metrics for Real Estate Core Core Plus Value Added Opportunistic
General Strategies Equity Investments
in existing assets
with minimal lease-
up or redevelopment
and longer holding
periods.
Equity assets with
mainly "core"
properties taking
minimal leverage,
slight lease-up risk
and minimal
redevelopment risk.
Equity investments in
assets that require
fair redevelopment,
lease-up,
repositioning or
management
improvements.
Typically carries
more leverage than
core or core plus.
Highest risk vehicle
that are usually
structured as
partnerships. There is
often high latitude to
invest in nearly
anything - land,
significant
redevelopment,
vacant buildings,
sector bets or other
niches.
Risk Metric
Return expectations 6-8 (unlevered) 9-13% 12-18% 20%+
% from income 80-100% 60% 50% 20%
Leverage 0-30% 30-50% 50-60% 60-85%
Holding Periods 5-10 years 4-7 years 3-5 years 3-5 years

Why Global - Issues?
International Investors
Look For…
Access to
product Tax / Structures
Transparency
Political Stability
Low Currency
Risk Local
Partners
Availability Of
Finance
Occupier Market Covenant Strength
Exit
Strategy

Going Abroad – For Core Product?

Core Yields - 2015
Source: RCA

Turkey Office Performance – Q1-2015
Source: Cushman & Wakefield

Issues for Core Players
International Investors
Look For…
Access to
product Tax / Structures
Transparency
Political Stability
Low Currency
Risk Local
Partners
Availability Of
Finance
Occupier Market Covenant Strength
Exit
Strategy
For 50 – 100 bps?

What About Opportunistic Investors?
• Much smaller portion of overall portfolio (5-9%), unless
opportunity fund or P/E group
• Typical strategies:
– Conduit investing for one-off development deals (hands-
off)
– Hands on investment/management, one-off deals
– Entity level investment (P/E, opportunistic, hedge)
• 20%+, development risk, 3 – 5 year horizon

What About Opportunistic Investors?
• Challenges include:
– Entry structure
– Placing funds
– Oversight
– Exit
– Repatriation

Foreign Investing 5 Year Rolling Hold Period – USD/Host Country
-70%
-60%
-50%
-40%
-30%
-20%
-10%
0%
10%
20%
30%
2006 2007 2008 2009 2010
Do
lla
r R
isk
Year of Investment
Turkey
India
China
Africa

Don’t Like FX Risk? Hedge
• Kenya – 950 – 1,100 bp/year
• India – 900 – 1,200 bp/year
• Turkey – 800 – 1,000 bp/year
• China? Why bother?

Issues for Opportunistic Players
International Investors
Look For…
Access to
product Tax / Structures
Transparency
Political Stability
Low Currency
Risk Local
Partners
Availability Of
Finance
Occupier Market Covenant Strength
Exit
Strategy
Un-hedged: 20%+ becomes negative (large) ?
Hedged: 20%+ becomes 10% -> ?

Real Estate Fund Activity

Real Estate Funds in 2014 (Core, VA, Opp, Dbt, Eq)
Source: Preqin

Private Equity Fundraising Activity $340 bn AUM - $85 bn ‘dry powder’

Historic Performance - Multiples
Source: Preqin

Net IRR’s
Source: Preqin

Value Add vs Opportunistic
Source: Preqin

Fund Strategies
Source: Preqin

Locational Preferences - 2015
Source: Preqin

Some Real Estate Specific Issues:
1. The ‘Emerging Market’ Story

India (China, Africa, ME, Turkey?)
• Speculators vs consumers
• 2.5% residential yield, no rent growth
• Indian sovereign debt yields: ~9%

Can You Make $ in Real Estate?
Source: Colliers 2014

Gurgaon, NCR

Gurgaon, NCR
• Project: 200 units, 2BHK, ~ 1,500 sq.ft.
– Golf Course Road Extension (GCRE)
• Land : 500 rs/sq.ft.
• Soft cost: 300 rs/sq.ft.
– Consultants, design, approvals
• Construction: 2,400 rs/sq.ft.
• Total development costs: 3,200 rs/sq.ft.

Gurgaon, NCR
• Market for 2 BHK:
– ~ 1,500 sq.ft. 7,500 – 9,000 rs/sq.ft.
• 3 year total development period
• Can we make $$ in development?

Total Development Costs
• Project: 200 units @ 1,500 sq.ft. 300,000 sq.ft.
• Land : 150 mm rs
• Soft cost: 60 mm rs (2 yr)
– Consultants, design, approvals
• Construction: 720 mm rs (1 yr)
• Total development costs: 930 mm rs (3 yr)

Option 1 – Developer Pays
Outflows:
• T0 – buy land for 150 mm rs
• ET1 – soft costs – 30 mm rs
• ET2 – soft costs – 30 mm rs
• T3 - construction – 720 mm rs

Time Frame - Outflows
150 mm 30 mm 30 mm 720mm
t0 t1 t2 t3

Option 1 – Developer Pays
Inflows:
• ET2 – pre-sales (post apprvl) – 50 units @7,500 rs/s.f.
@ 30%
– 168.8 mm rs (393.8 mm rs bal.)
• ET3 – sales – 150 units @ 9,000 rs/s.f.
– 2.025 bn rs + bal. of 393.8 mm from pre-sales
– = 2.42 bn rs

Time Frame - Inflows 2.42 bn rs
IRR= 131%
168.8 mm rs
150 mm 30 mm 30 mm 720mm
t0 t1 t2 t3

Want To Be a Developer?

Not Enough ‘Juice’ ? Let’s ‘Push’
the Deal !
Structure:
• Landowner becomes JV partner, contributes land:
– Option 1 – double your money (150mm->300mm)
– Option 2 – deferral for land (150mm + 15% of gross profits)
• ‘Soft sale’ ET1 – 9 units @ 7,500 rs/s.f. – 30% pmt
• Pre-sale ET2 – 8 units @ 8,000 rs/s.f. – 30% pmt
• Pre-sale BT3 – 50 units @8,250 rs/s.f. – 30% pmt
• Pre-sale MT3 – 50 units @ 8,500 rs/s.f. – 30% pmt
• Sale on completion ET3 (+6 mo) – 83 units @ 9,000 rs/s.f.
– + bal ET1 + bal ET2 + bal BT3 + bal MT3

Project – Cash Flows 1.45 bn
191 mm
185 mm
29 mm
30.4 mm
0 mm 30 mm 30 mm 720mm
t0 t1 t2 t3

Landowner Perspective
• Option 1 – contribute land – double price (300 mm rs)
– IRR = 26%
• Option 2 – contribute land – paid land price (150mm rs) and 15% of gross profits
– IRR = 39%
• Good deal for landowner?
• What about developer?

Project – Cash Flows 1.45 bn
IRR = ∞ %
191 mm
185 mm
29 mm
30.4 mm
0 mm 30 mm 30 mm 720mm
t0 t1 t2 t3

What Can Go Wrong?
• Approvals get held up
• Residents file law suit
• Developer starts F1 team
• Developer buys cricket team
• Developer buys more land

– Country Level Risk • Political, Legal, Economic Factors (FX)
– Market Level Risk • Institutional ( Property, Business Factors)
– Deal Level Risk • The deal itself (structure)
• Local markets, operator/developer
– Transparency, Regulation, Yield Compression Will Change the Game…
Emerging Market Risks

2. Risk Regimes in Real Estate Development
LAND OPTIONING &
ASSEMBLY, PERMITTING, &
DEVLPT DESIGN
CONSTRUCTION
LAND
PURCHASE
“Time 0”
SHELL
COMPLETION
“Time T1”
LEASE-UP &
TENANT FINISHES
STABILIZED
OPERATION
$
C
U
M
U
L
A
T
I
V
E
I
N
V
E
S
T
M
E
N
T
$
DEVLPMT
COMPLETION
“Time T2”
Time
R
I
S
K
A
S
I
N
V
E
R
S
E
O
F
S
U
C
C
E
S
S
VERY
HIGH RISK
e.g.: ?%
OCC
HIGH RISK
e.g.: 16%
OCC
MODERATE RISK
e.g.: 8% OCC
LOW RISK
e.g.: 6% OCC
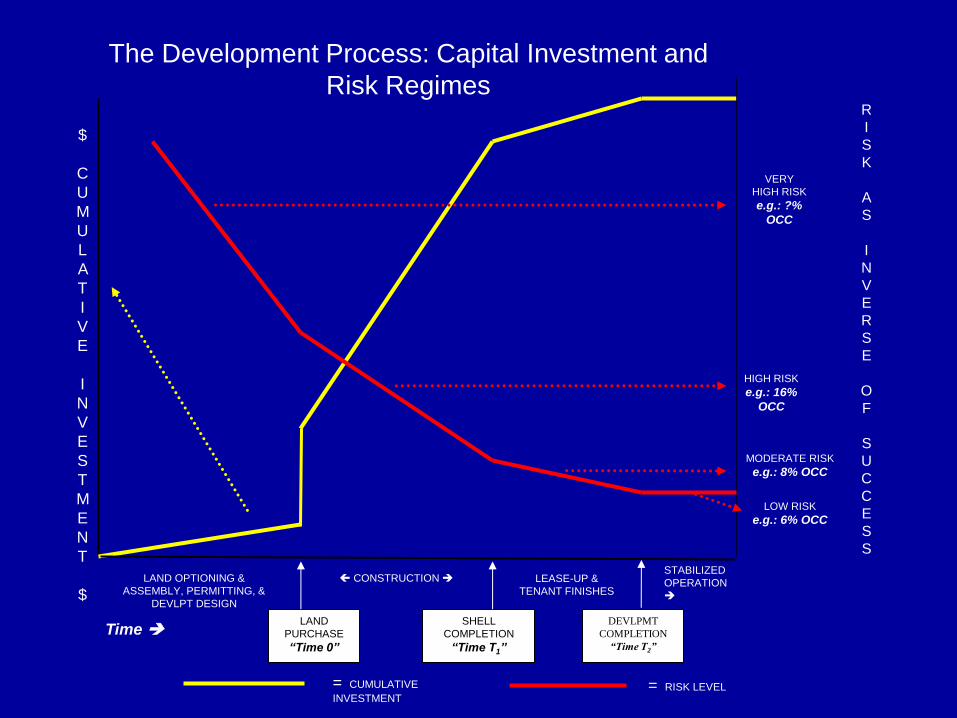
The Development Process: Capital Investment and
Risk Regimes
= CUMULATIVE
INVESTMENT = RISK LEVEL

LAND OPTIONING &
ASSEMBLY, PERMITTING, &
DEVLPT DESIGN
CONSTRUCTION
LEASE-UP &
TENANT FINISHES
STABILIZED
OPERATION
$
C
U
M
U
L
A
T
I
V
E
I
N
V
E
S
T
M
E
N
T
$
Time
R
I
S
K
A
S
I
N
V
E
R
S
E
S
U
C
C
E
S
S
P
R
O
B
VERY HIGH
RISK =
60%
OCC
HIGH RISK
e.g.: 16%
OCC
MODERATE RISK
e.g.: 8% OCC
LOW RISK
e.g.: 6% OCC
Sell - at 6% OCC when stabilized - so 6% * 0% time weight = 0% time weighted IRR (Sum = 0%)
Lease up – 8% OCC, 25% of project time = 8% * 25% = 2% time weighted IRR (Sum = 2%)
Construction – 16% OCC, 50% of project time = 16% * 50% = 8% time weighted IRR (Sum = 10%)
Permitting, due diligence – X% OCC, 25% of project time = X% * 25% needs to equal 15% (25% overall – 10%
weighted total) = 15%/25% = X% OCC
= CUMULATIVE
INVESTMENT = RISK LEVEL
Overall Development Return = 25%

3. Real Estate Analytics – Sensitivity Analysis

How to Deal with Risk in RED?
• ‘Test’ our numbers (assumptions)
• How many of you do this?
• Construction issues….?

Dealing With Uncertainty…
• What do hurricanes have to do with real
estate?
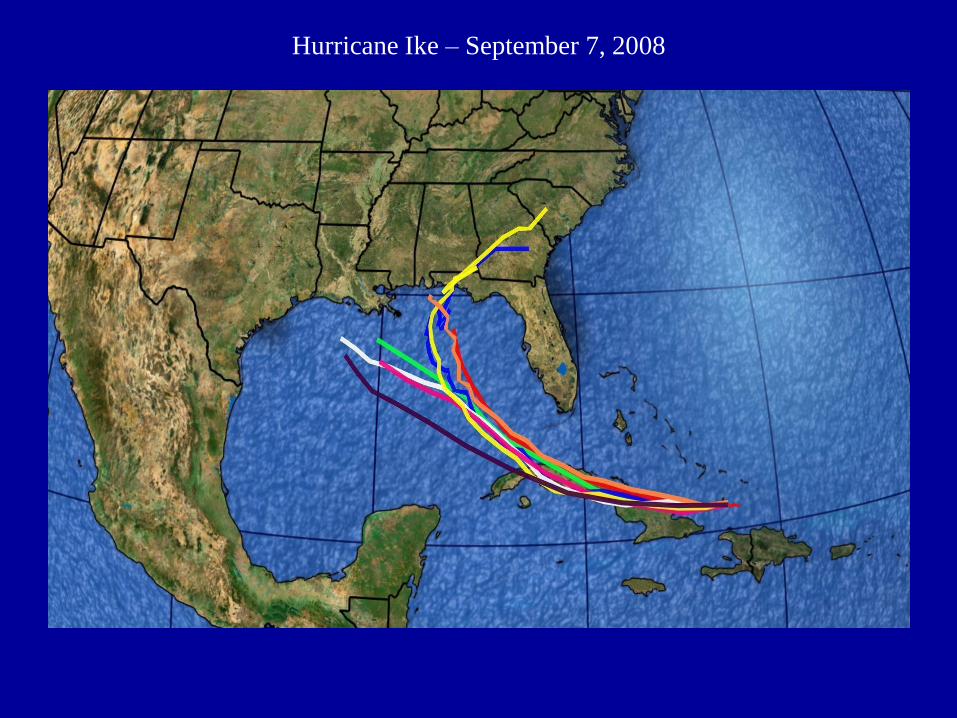
Hurricane Ike – September 7, 2008
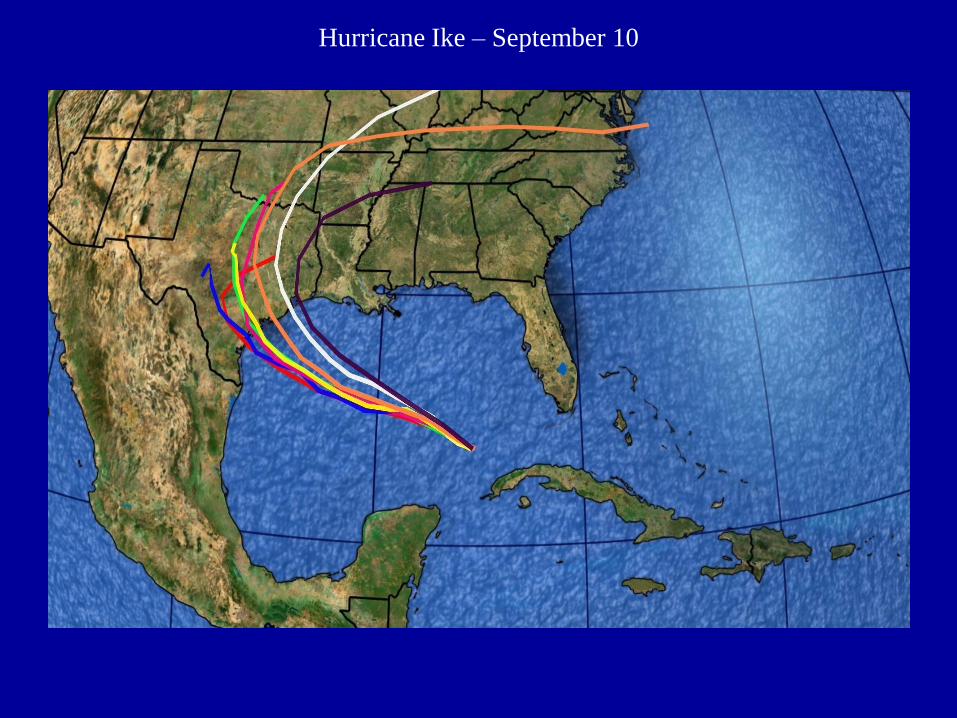
Hurricane Ike – September 10

PE
RF
OR
MA
NC
E
TIME
Expectations – Market

PE
RF
OR
MA
NC
E
TIME
Expectations – Government Deal

Residential Rental Project
• Three Year Analysis
• Rents - $1,100 per unit/month
• Operating Expenses - $2.50 per square foot
• Going out Cap Rate – 9.5%
• How do we test our assumptions? • ‘Typical’ way – cut down trees

Discussion on Rents
$1,125
$1,075
$1,100
$1,050
LEVEL
L
I
K
E
L
I
H
O
O
D

Discussion on Operating Expenses
$2.50
$2.75
$2.30 $3.00
LEVEL
L
I
K
E
L
I
H
O
O
D
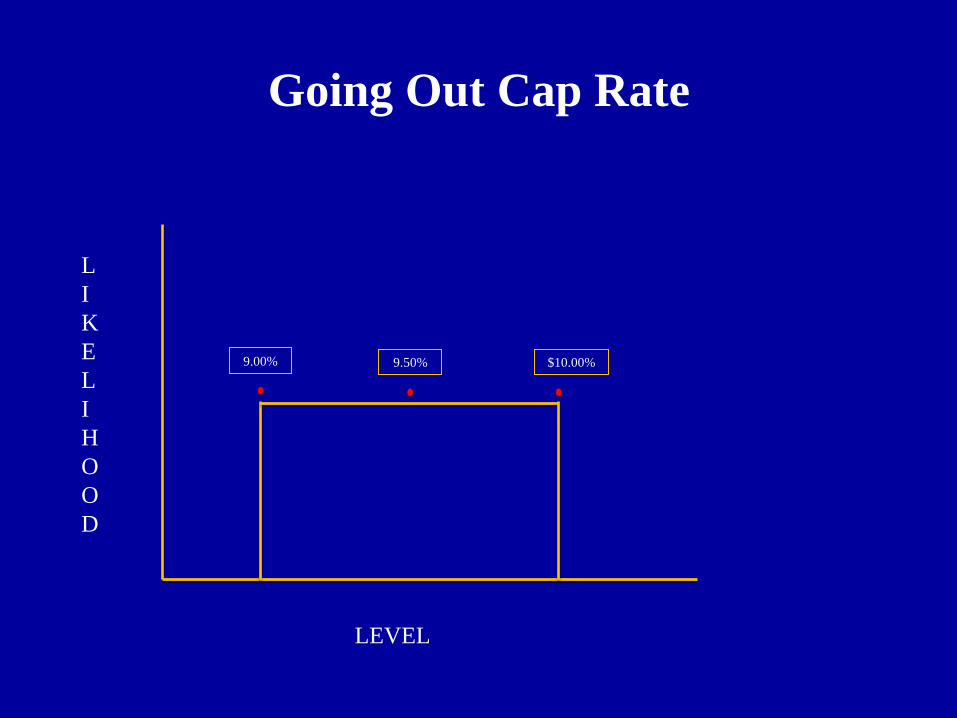
Going Out Cap Rate
9.50% $10.00% 9.00%
LEVEL
L
I
K
E
L
I
H
O
O
D

1 Simulation:
5,000 Iterations

Rents

Operating Expenses

Going-Out Cap Rate

Afer-Tax IRR
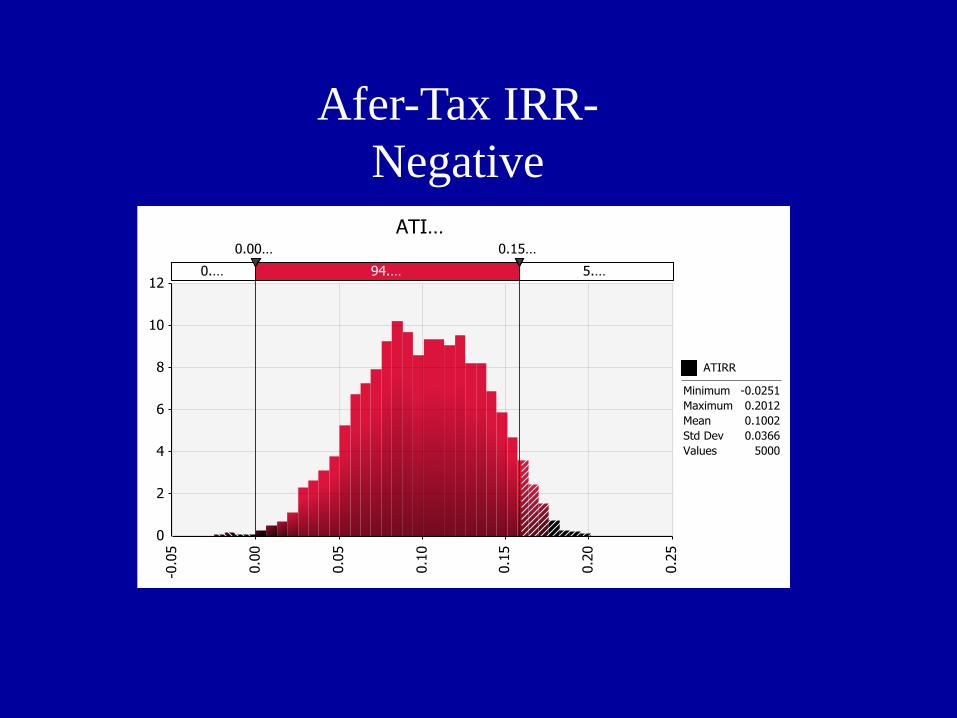
Afer-Tax IRR-
Negative

After-Tax IRR - Preferred

After-Tax IRR - Promote

• Allow us to articulate boundaries of outcomes
• Incorporates more information into model
• Outcomes are now in ‘ranges’, not single expectation
• Healthy discussion of ‘what matters’
Simulation in Real Estate

4. FOMC – Tightening on Horizon?

Impact of Rising Interest Rates on Short-
Term Development Deals
• Long-run 10 year Tsry: 5.1%
• Commercial real estate yield spread: ~ 500 bp
• Assume 10 year Tsry -> 4%
• Cap rates rise ~ 150 bp
• What will this mean?

A New World With Higher Yields
• The Deal:
– Value Added Apartment Deal (200+- units)
– $2,630,000 Equity ($4,540,000 PP)
– 8% preference
– Return of capital
– 75%/25% to an 18% ROI (non-cumulative)
– GP fee
– 50%/50% above
– 7% going out cap rate (today’s number)

Cash Flows
• T=0 ($2,630,000)
• T=1 $29,956
• T=2 $279,677
• T=3 cf $281,242
• T=3 resid 3,705,434
• Annual ROI: 22.9%
• IRR: 20.8%
• Good Deal….?

The New World - Cap Rates +150
• T=0 ($2,630,000)
• T=1 $29,956
• T=2 $279,677
• T=3 cf $281,242
• T=3 resid $2,670,455
• Annual ROI: 8.0%
• IRR: 7.57%
• ‘Opportunity’ becomes ‘Core’….?

Summary From Around the World
• Real Estate has ‘weathered the storm’… by and large
• Most players: concentrate on domestic markets
• Int’l -> specific markets and products
• Emerging markets are maturing – and noticing it….
• Increased capital flows from Asia … wealth is mobile (Latin America, Middle East)
• ‘Safe Haven’ cities continue to remain popular
• Mezzanine and new equity capital will be ‘fully priced’

How Does All of This Relate to Turkey?
• Challenges:
– Political risks
– RE market size
– Institutional stock
– From ‘5th’ gear to ‘3rd’ gear (PWC/ULI 7->20)
– JLL transparency – 31 (semi-transparent)
• Opportunities:
– Demographics, location, culture, re-generation, GDP growth

• Thank You


![Financial Markets in Africa: Opportunities & … Markets in Africa: Opportunities & Challenges Moremi Marwa [27th April 2015] 1 * Preface * Introduction * State of Financial Markets](https://img.pdfslide.us/doc/110x75/5ada6e6c7f8b9aee348cc85e/financial-markets-in-africa-opportunities-markets-in-africa-opportunities.jpg)