Embed Size (px)
Citation preview
Chalfont St PeterResidents Consultation Survey 2009
iDA Consulting Limited
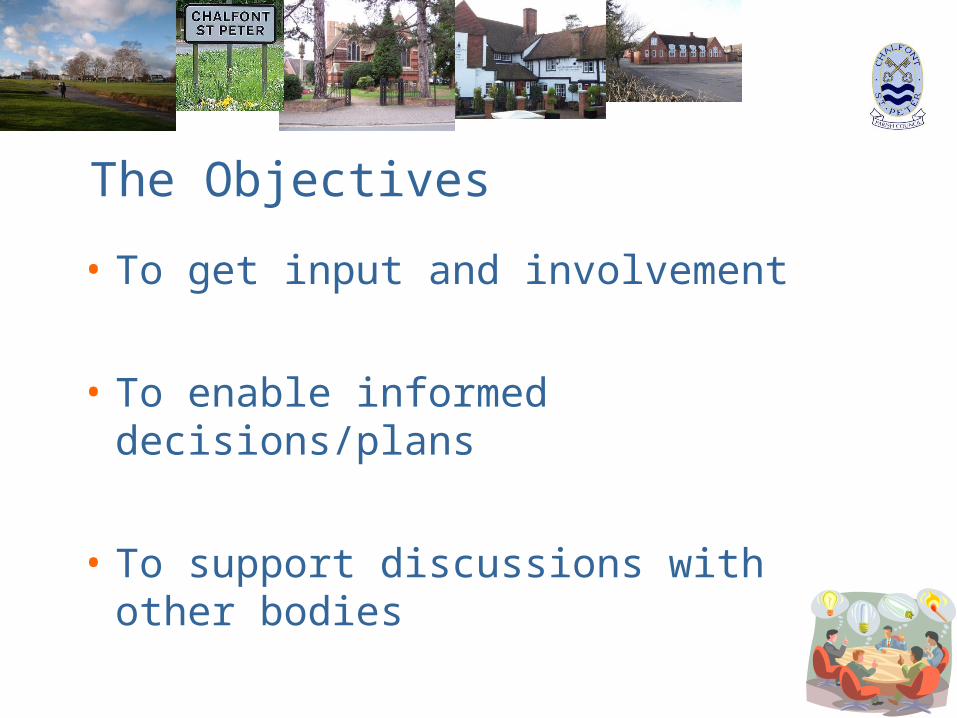
• To get input and involvement
• To enable informed decisions/plans
• To support discussions with other bodies
The Objectives
The consultation process
• Questionnaire design
- consultation
- balance
• Timing
• Methodology
• Tabulations (61,000), and listings
• The report
• This presentation
The analysis:
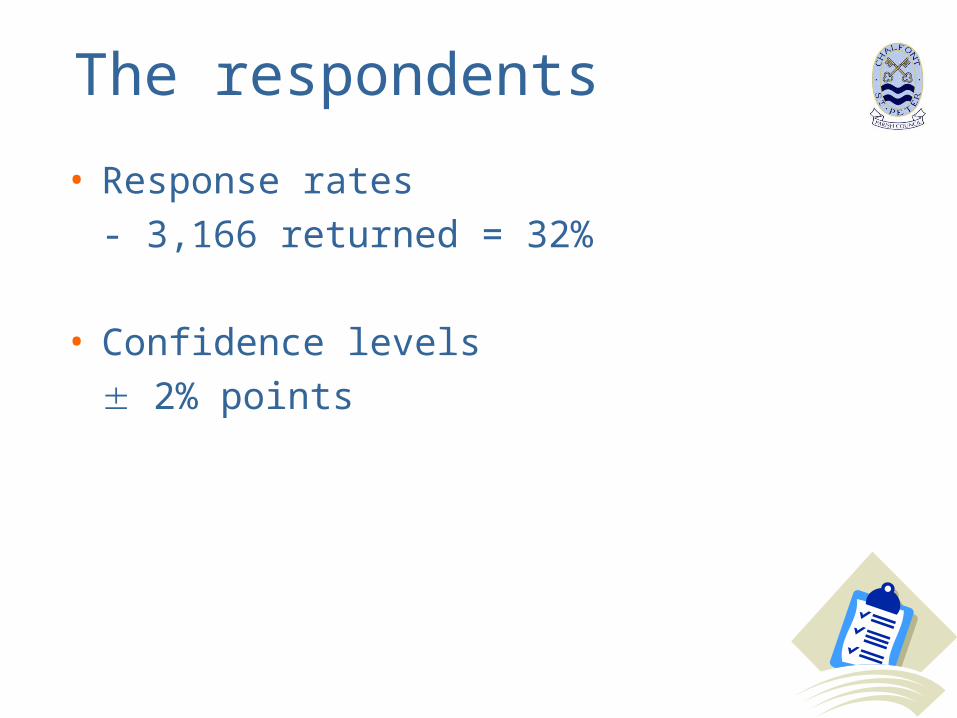
The respondents
• Response rates
- 3,166 returned = 32%
• Confidence levels
2% points
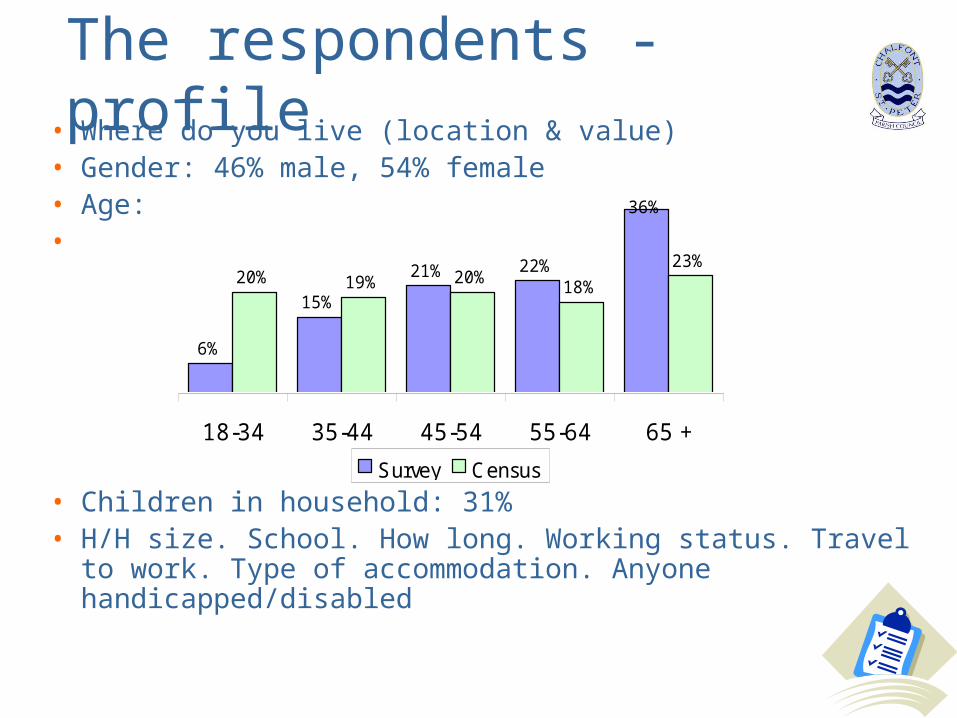
The respondents - profile• Where do you live (location & value)• Gender: 46% male, 54% female• Age:•
• Children in household: 31%• H/H size. School. How long. Working status. Travel to work.
Type of accommodation. Anyone handicapped/disabled
6%
15%
21% 22%
36%
20% 19% 20%18%
23%
18-34 35-44 45-54 55-64 65 +
Survey Census
A: Living in Chalfont St Peter• Why do people live here? What’s
important to them, and how does Chalfont St Peter rate?
• Importance of 9 aspects of living in Chalfont St Peter
• vs ratings of Chalfont St Peter
• Scores/ratings given out of 10
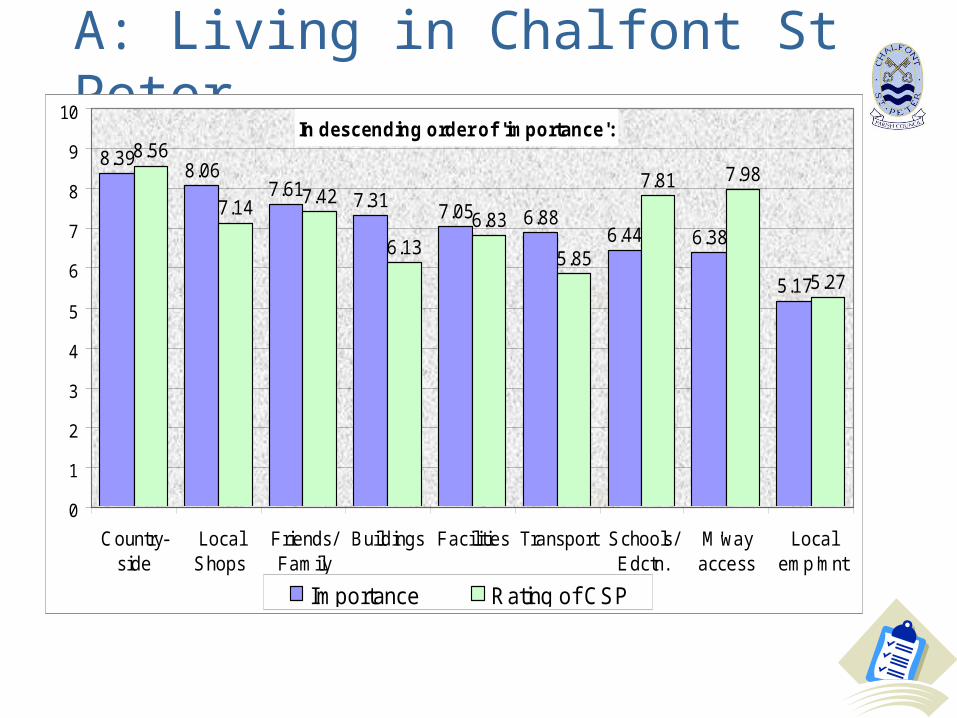
A: Living in Chalfont St PeterIn descending order of 'importance':
8.398.06
7.617.31
7.05 6.886.44 6.38
5.17
8.56
7.147.42
6.136.83
5.85
7.81 7.98
5.27
0
1
2
3
4
5
6
7
8
9
10
Country-side
LocalShops
Friends/Family
Buildings Facilities Transport Schools/Edctn.
M'wayaccess
Localemp'mnt
Importance Rating of CSP
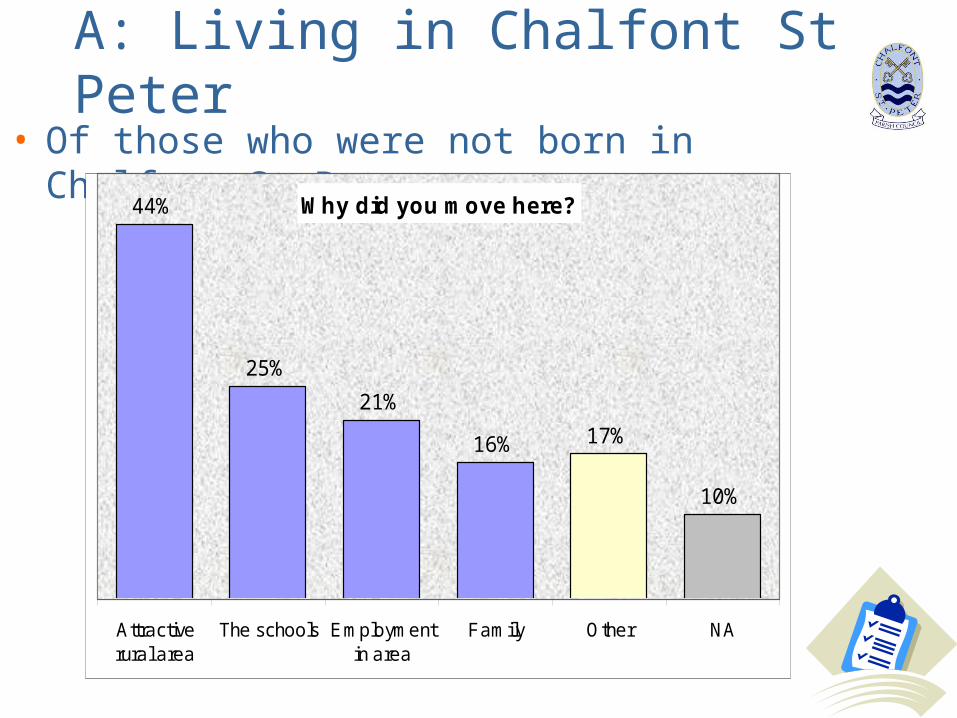
A: Living in Chalfont St Peter• Of those who were not born in Chalfont St Peter:
Why did you move here?44%
25%
21%
16% 17%
10%
Attractiverural area
The schools Employmentin area
Family Other NA
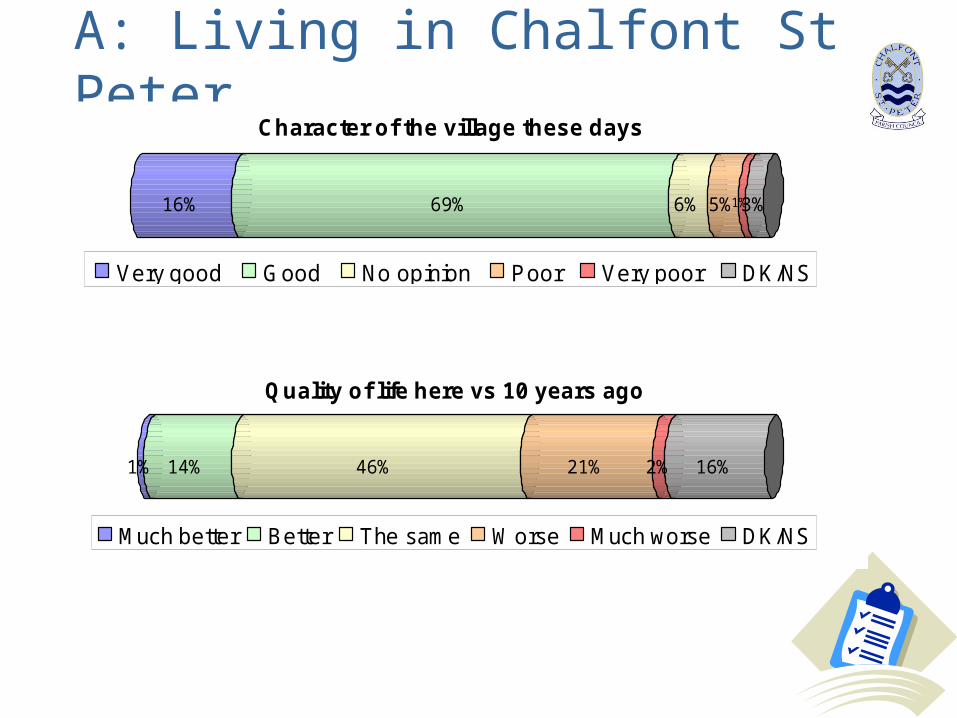
A: Living in Chalfont St Peter
16% 69% 6% 5%1%3%
Character of the village these days
Very good Good No opinion Poor Very poor DK/NS
1% 14% 46% 21% 2% 16%
Quality of life here vs 10 years ago
Much better Better The same Worse Much worse DK/NS
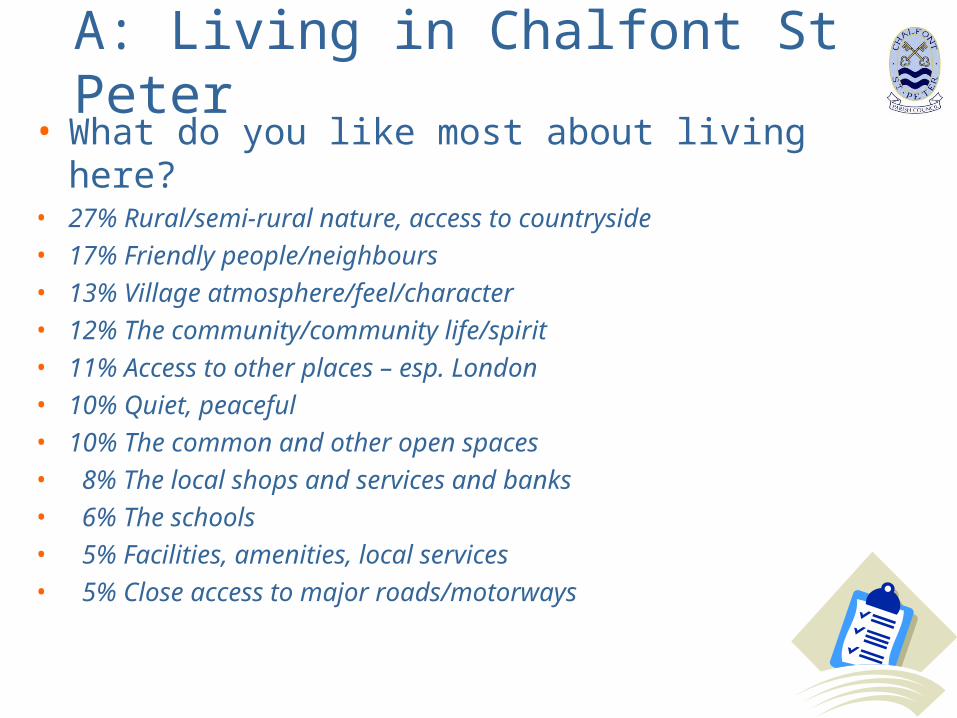
A: Living in Chalfont St Peter• What do you like most about living here?• 27% Rural/semi-rural nature, access to countryside• 17% Friendly people/neighbours• 13% Village atmosphere/feel/character• 12% The community/community life/spirit• 11% Access to other places – esp. London• 10% Quiet, peaceful• 10% The common and other open spaces• 8% The local shops and services and banks• 6% The schools• 5% Facilities, amenities, local services• 5% Close access to major roads/motorways
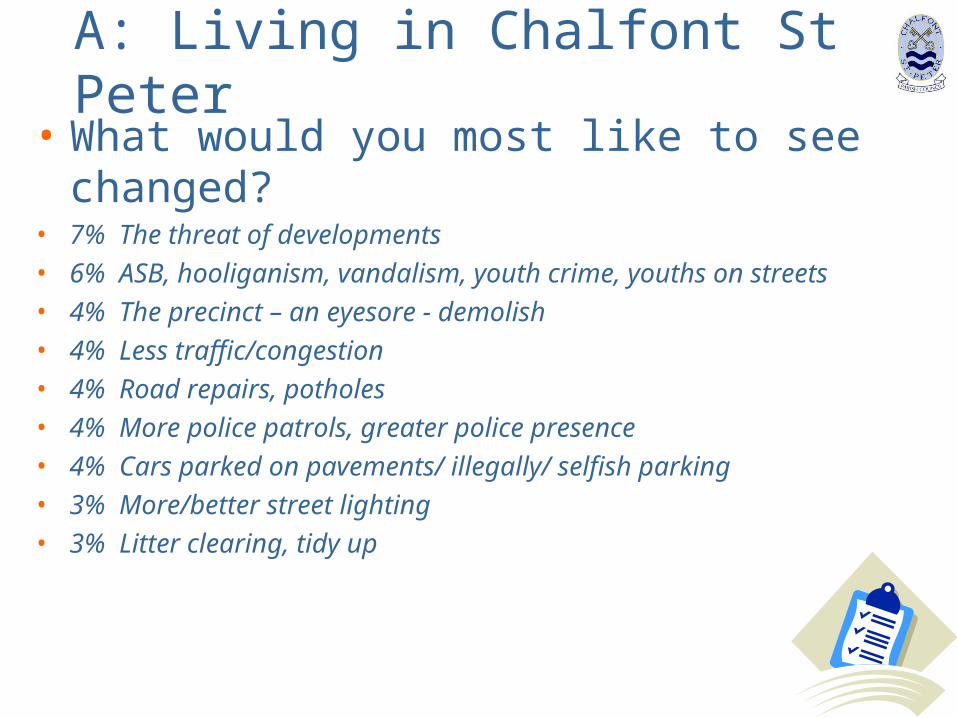
A: Living in Chalfont St Peter• What would you most like to see changed?• 7% The threat of developments• 6% ASB, hooliganism, vandalism, youth crime, youths on streets• 4% The precinct – an eyesore - demolish• 4% Less traffic/congestion• 4% Road repairs, potholes• 4% More police patrols, greater police presence• 4% Cars parked on pavements/ illegally/ selfish parking• 3% More/better street lighting• 3% Litter clearing, tidy up
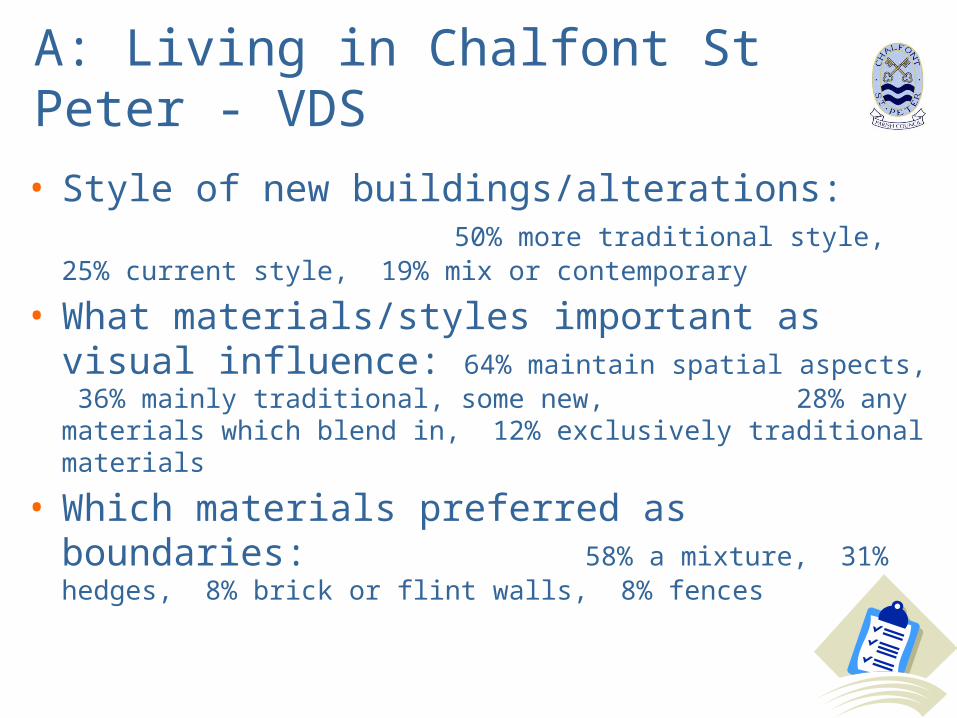
A: Living in Chalfont St Peter - VDS
• Style of new buildings/alterations: 50% more traditional style, 25% current style, 19% mix or contemporary
• What materials/styles important as visual influence: 64% maintain spatial aspects, 36% mainly traditional, some new, 28% any materials which blend in, 12% exclusively traditional materials
• Which materials preferred as boundaries: 58% a mixture, 31% hedges, 8% brick or flint walls, 8% fences
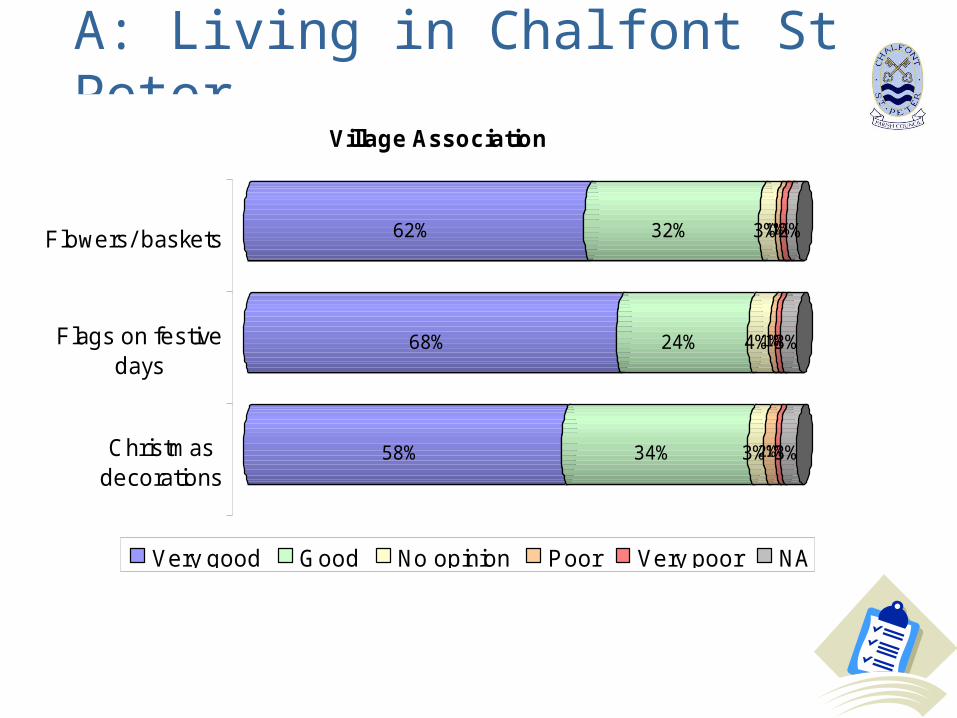
A: Living in Chalfont St Peter
58% 34% 3%2%1%3%
68% 24% 4%1%1%3%
62% 32% 3%1%1%2%Flowers/ baskets
Flags on festivedays
Christmasdecorations
Village Association
Very good Good No opinion Poor Very poor NA
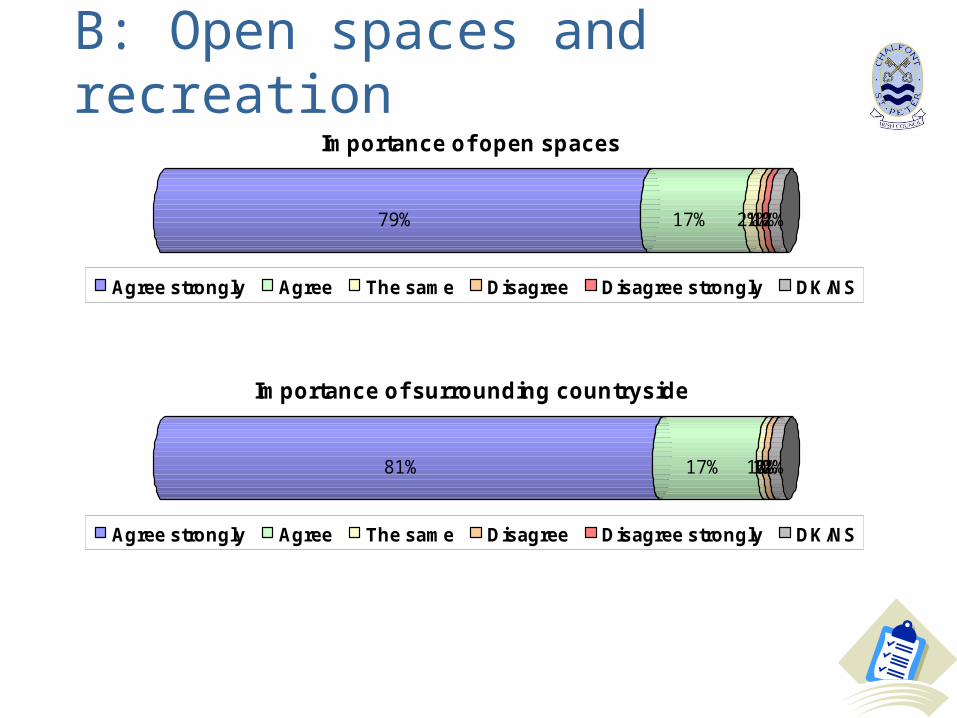
B: Open spaces and recreation
79% 17% 2%1%1%2%
Importance of open spaces
Agree strongly Agree The same Disagree Disagree strongly DK/NS
81% 17% 1%1%0%2%
Importance of surrounding countryside
Agree strongly Agree The same Disagree Disagree strongly DK/NS
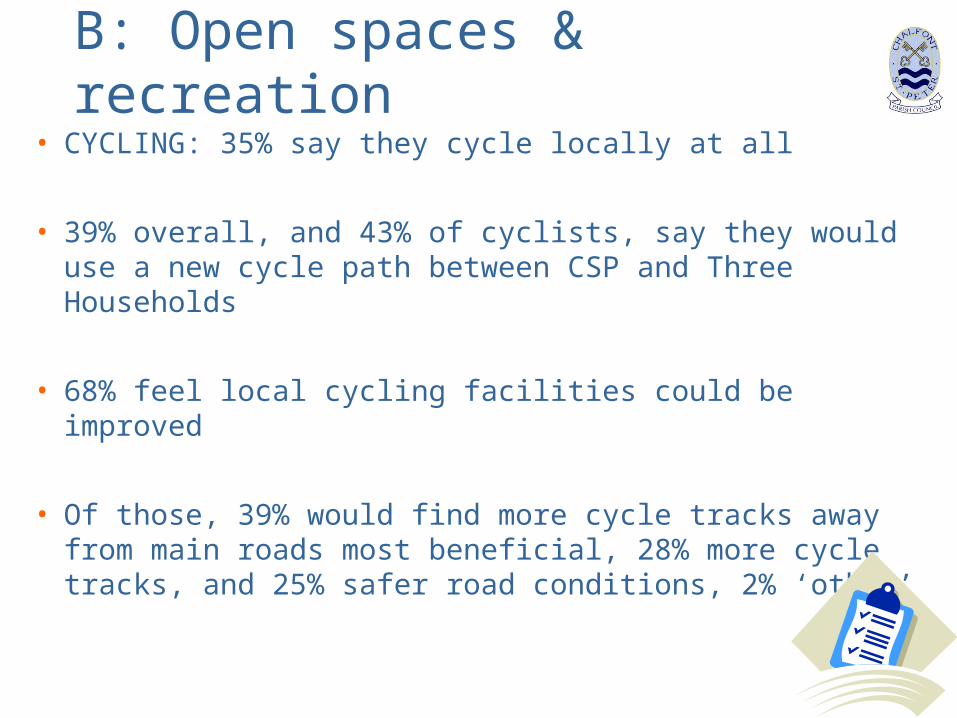
B: Open spaces & recreation
• CYCLING: 35% say they cycle locally at all
• 39% overall, and 43% of cyclists, say they would use a new cycle path between CSP and Three Households
• 68% feel local cycling facilities could be improved
• Of those, 39% would find more cycle tracks away from main roads most beneficial, 28% more cycle tracks, and 25% safer road conditions, 2% ‘other’
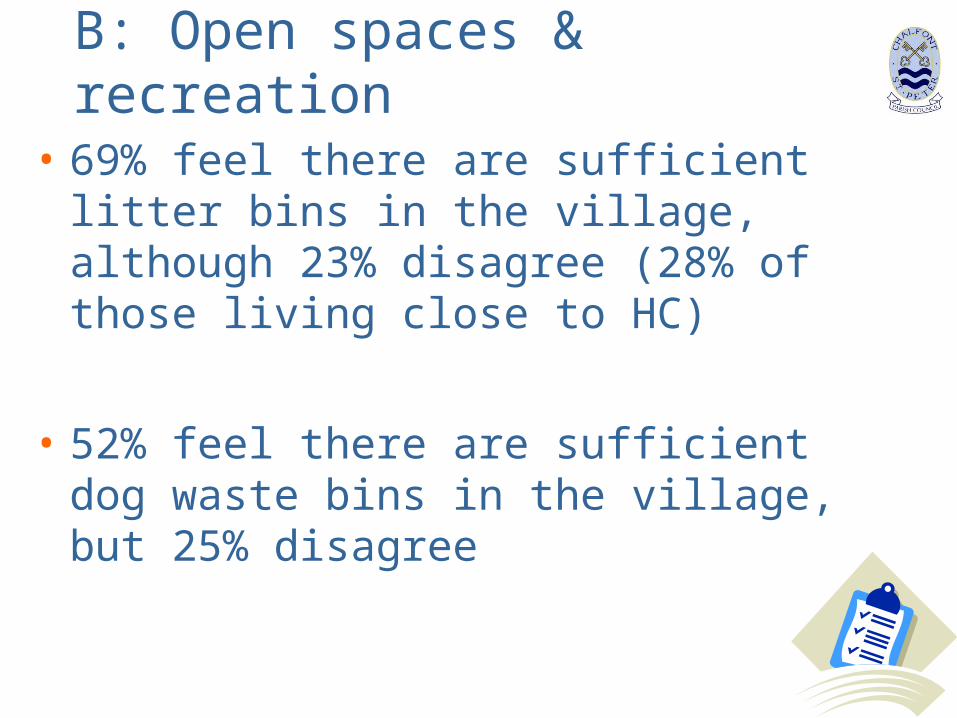
B: Open spaces & recreation
• 69% feel there are sufficient litter bins in the village, although 23% disagree (28% of those living close to HC)
• 52% feel there are sufficient dog waste bins in the village, but 25% disagree
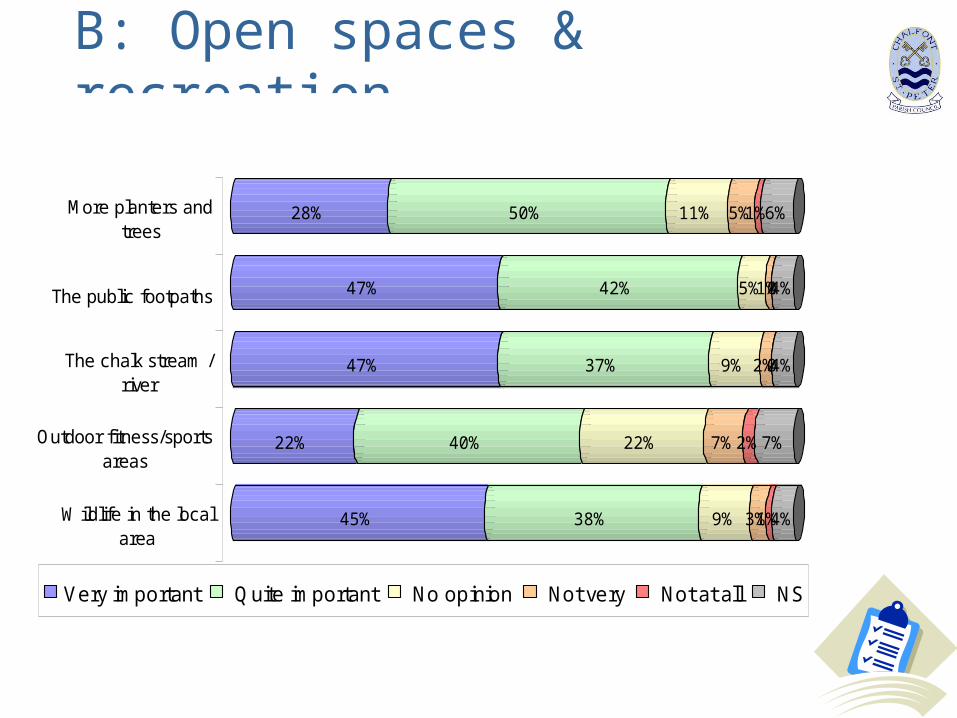
B: Open spaces & recreation
45% 38% 9% 3%1%4%
22% 40% 22% 7%2%7%
47% 37% 9% 2%04%
47% 42% 5%1%04%
28% 50% 11% 5%1%6%More planters andtrees
The public footpaths
The chalk stream /river
Outdoor fitness/sportsareas
Wildlife in the localarea
Very important Quite important No opinion Not very Not at all NS
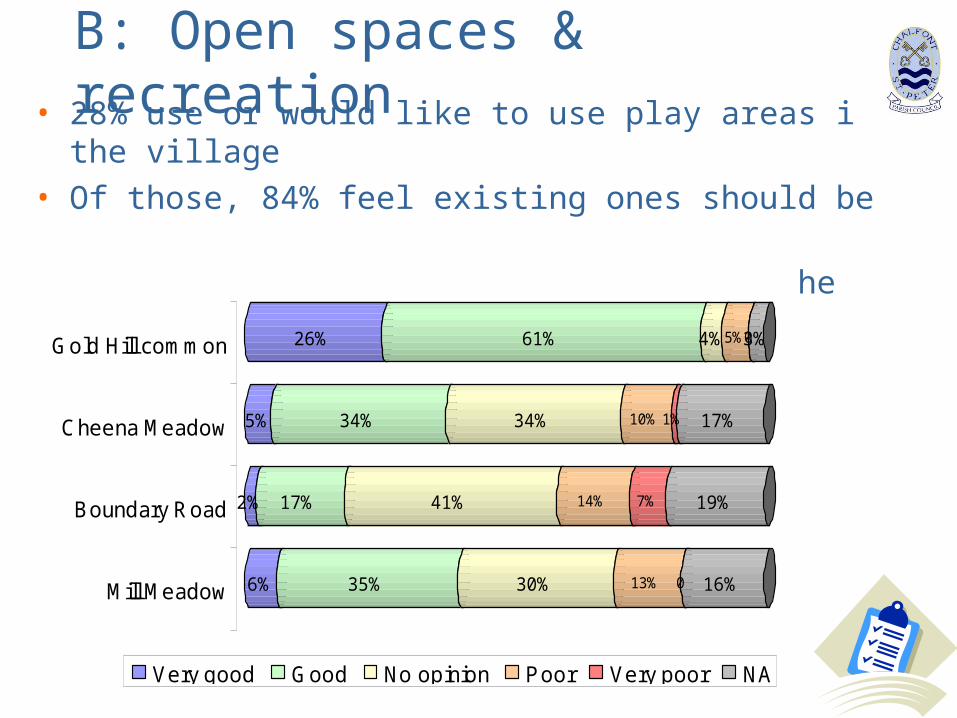
B: Open spaces & recreation• 28% use or would like to use play areas in the village• Of those, 84% feel existing ones should be improved• And 54% drive to playgrounds outside the village
6% 35% 30% 13% 0 16%
2% 17% 41% 14% 7% 19%
5% 34% 34% 10% 1% 17%
26% 61% 4%5%03%Gold Hill common
Cheena Meadow
Boundary Road
Mill Meadow
Very good Good No opinion Poor Very poor NA
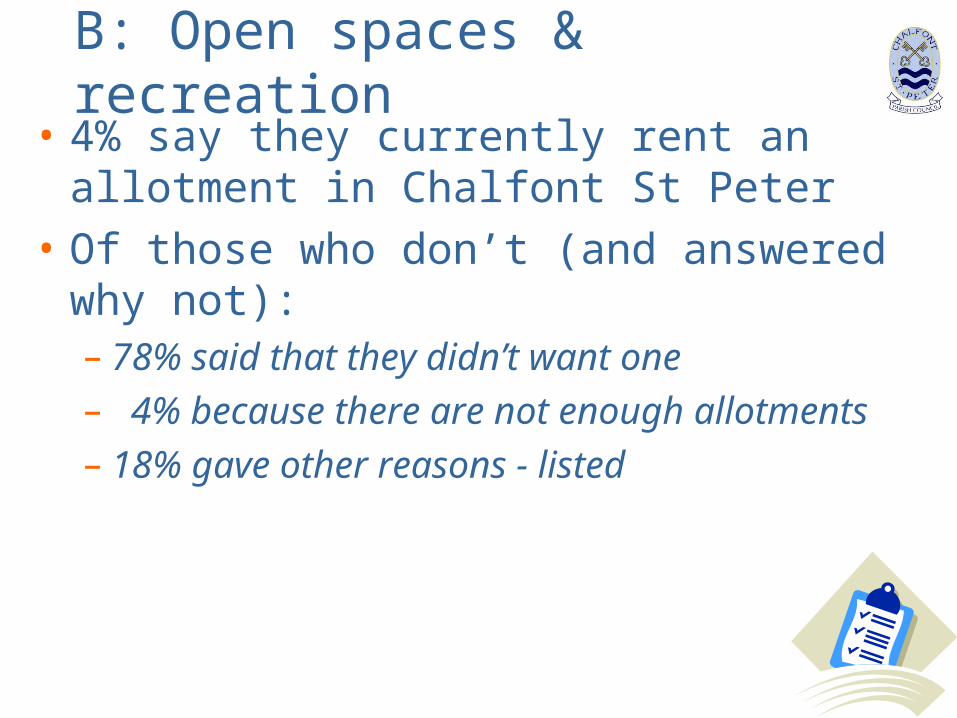
B: Open spaces & recreation• 4% say they currently rent an allotment in
Chalfont St Peter
• Of those who don’t (and answered why not):– 78% said that they didn’t want one– 4% because there are not enough allotments– 18% gave other reasons - listed
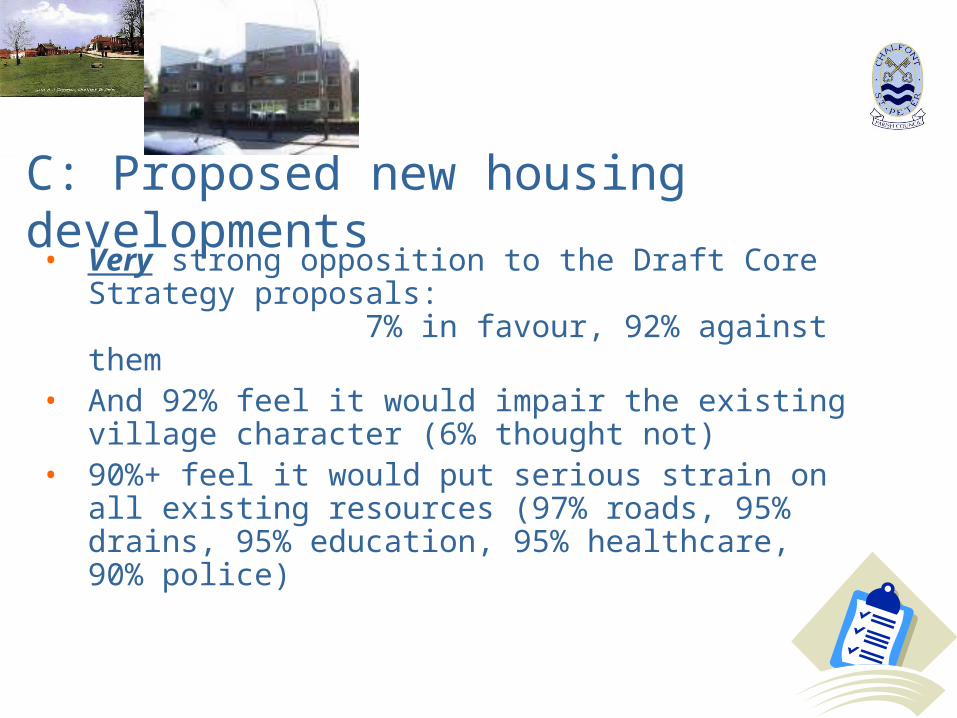
C: Proposed new housing developments• Very strong opposition to the Draft Core
Strategy proposals: 7% in favour, 92% against them
• And 92% feel it would impair the existing village character (6% thought not)
• 90%+ feel it would put serious strain on all existing resources (97% roads, 95% drains, 95% education, 95% healthcare, 90% police)
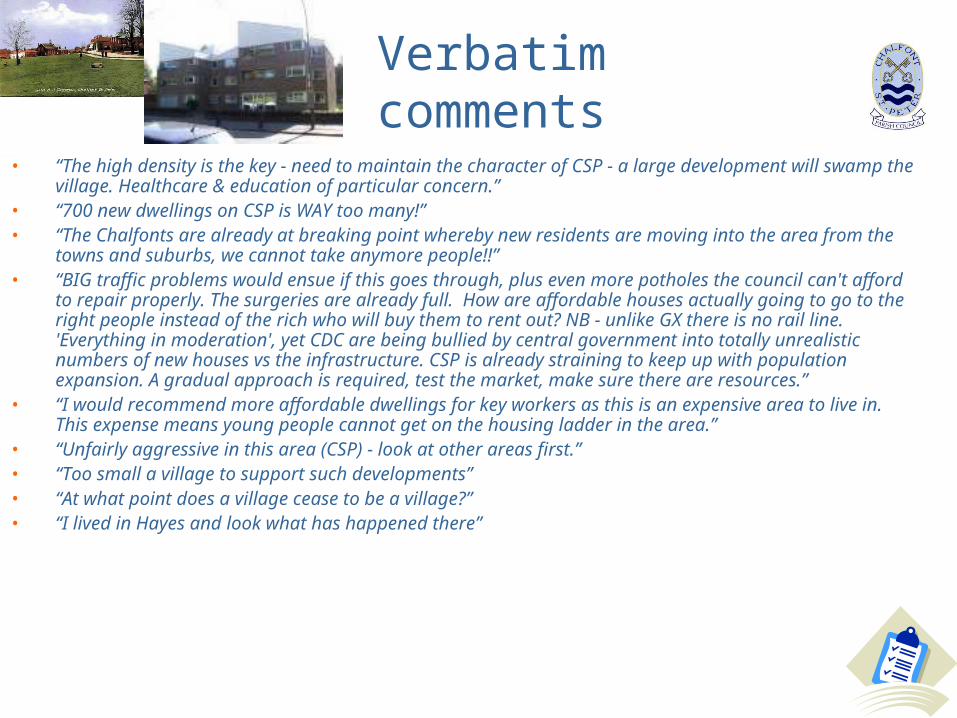
Verbatim comments
• “The high density is the key - need to maintain the character of CSP - a large development will swamp the village. Healthcare & education of particular concern.”
• “700 new dwellings on CSP is WAY too many!”• “The Chalfonts are already at breaking point whereby new residents are moving into the area from
the towns and suburbs, we cannot take anymore people!!”• “BIG traffic problems would ensue if this goes through, plus even more potholes the council can't
afford to repair properly. The surgeries are already full. How are affordable houses actually going to go to the right people instead of the rich who will buy them to rent out? NB - unlike GX there is no rail line. 'Everything in moderation', yet CDC are being bullied by central government into totally unrealistic numbers of new houses vs the infrastructure. CSP is already straining to keep up with population expansion. A gradual approach is required, test the market, make sure there are resources.”
• “I would recommend more affordable dwellings for key workers as this is an expensive area to live in. This expense means young people cannot get on the housing ladder in the area.”
• “Unfairly aggressive in this area (CSP) - look at other areas first.”• “Too small a village to support such developments”• “At what point does a village cease to be a village?”• “I lived in Hayes and look what has happened there”
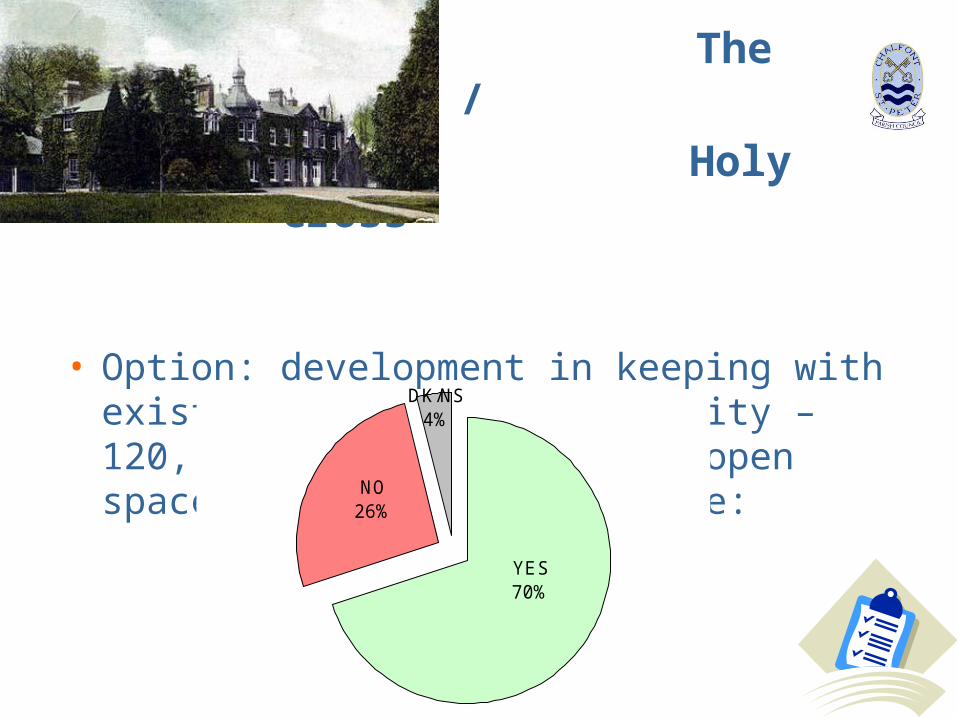
The Grange /
Holy Cross
• Option: development in keeping with existing character and density – 120, some affordable, some open space amenities for everyone:
DK/NS4%
NO26%
YES70%
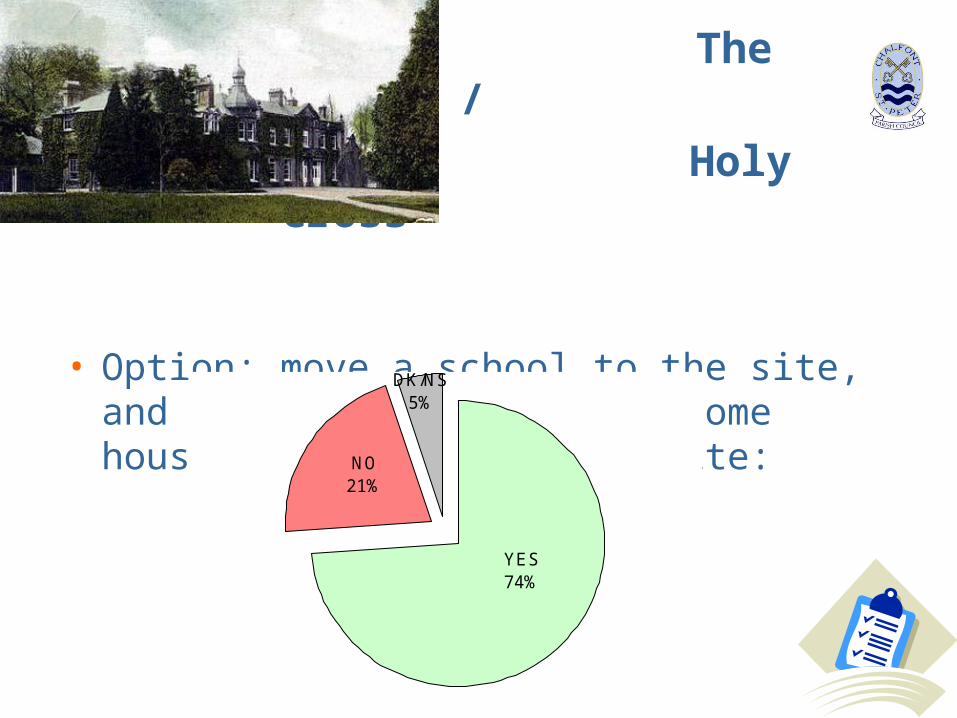
The Grange /
Holy Cross
• Option: move a school to the site, and build few houses, and some houses at the old school site:
DK/NS5%
NO21%
YES74%
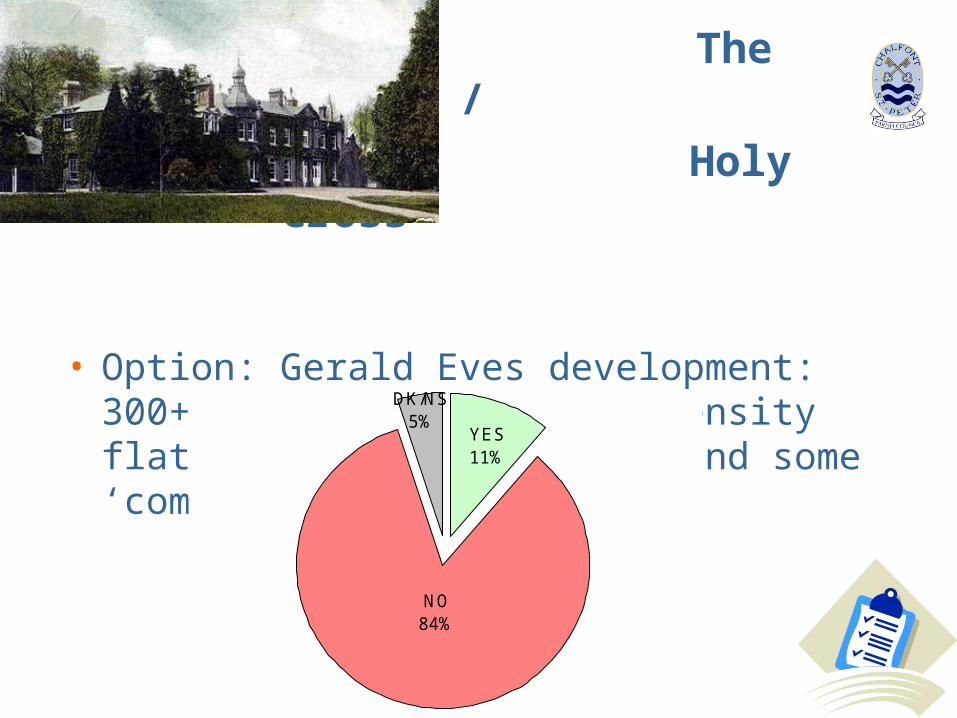
The Grange /
Holy Cross
• Option: Gerald Eves development: 300+ new dwellings, high density flats plus care home (80) and some ‘community use’ building:
DK/NS5%
NO84%
YES11%
C: Affordable housing in CSP
• 45 new (on average) thought to be required• 22% said none needed
• 11% ‘need for affordable housing’
• 65% say there is a need for an Extra Care housing resource in Chalfont St Peter
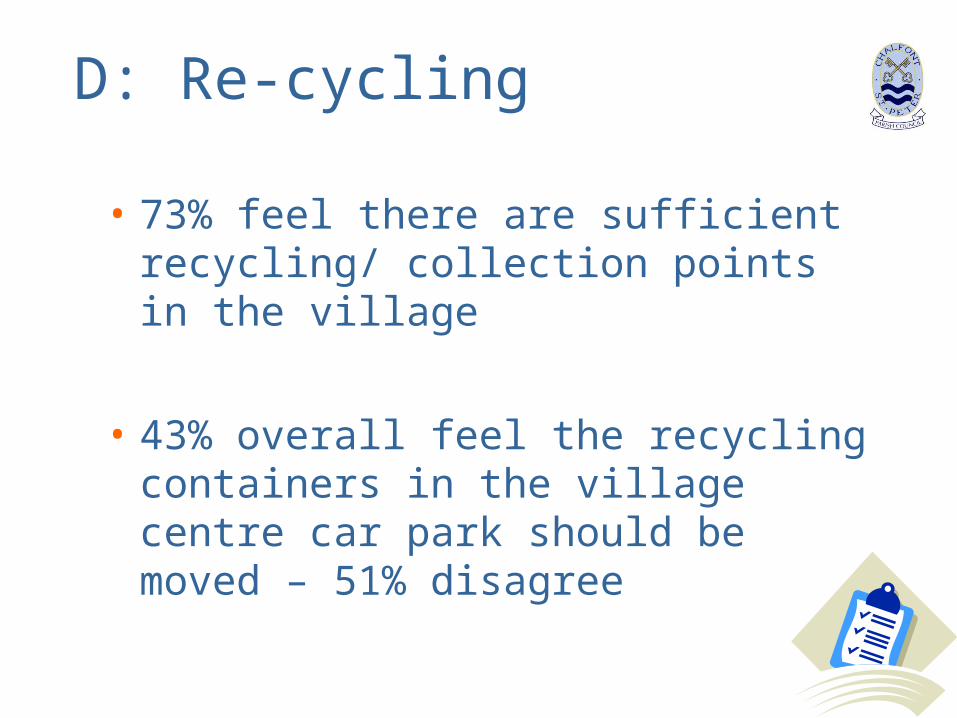
D: Re-cycling
• 73% feel there are sufficient recycling/ collection points in the village
• 43% overall feel the recycling containers in the village centre car park should be moved – 51% disagree
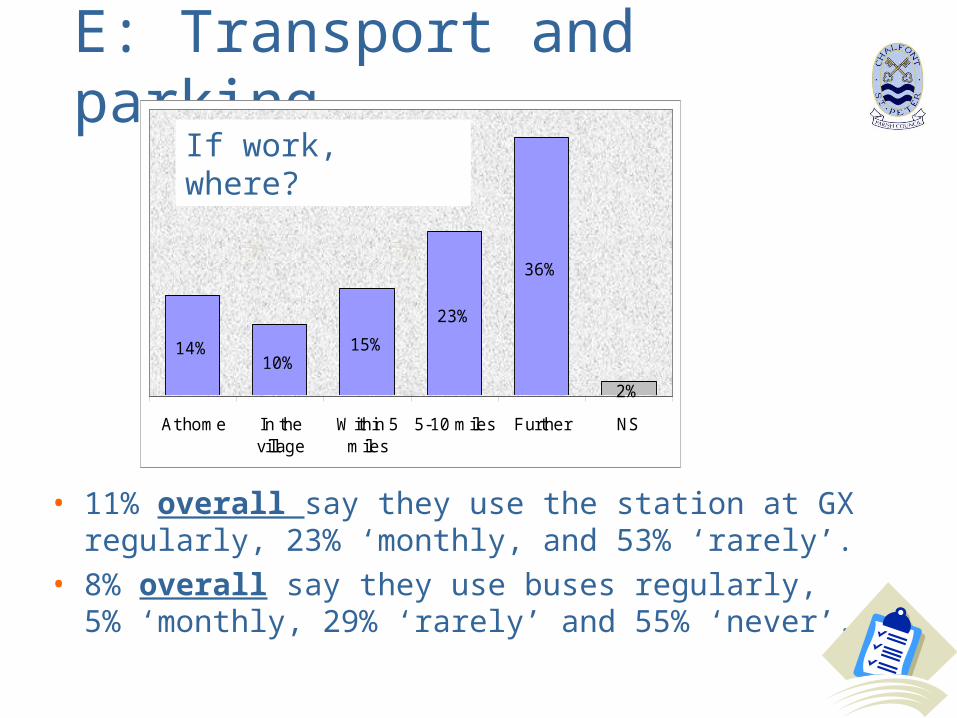
E: Transport and parking
• 11% overall say they use the station at GX regularly, 23% ‘monthly, and 53% ‘rarely’.
• 8% overall say they use buses regularly, 5% ‘monthly, 29% ‘rarely’ and 55% ‘never’.
14%10%
15%
23%
36%
2%
At home In thevillage
Within 5miles
5-10 miles Further NS
If work, where?
E: Transport and parking
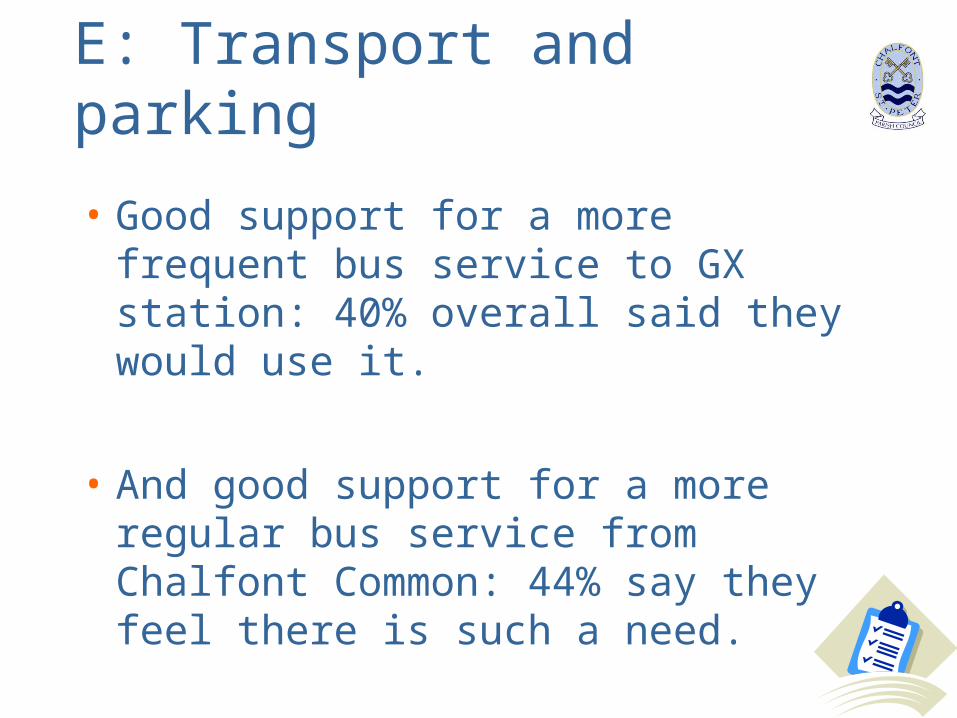
• Good support for a more frequent bus service to GX station: 40% overall said they would use it.
• And good support for a more regular bus service from Chalfont Common: 44% say they feel there is such a need.
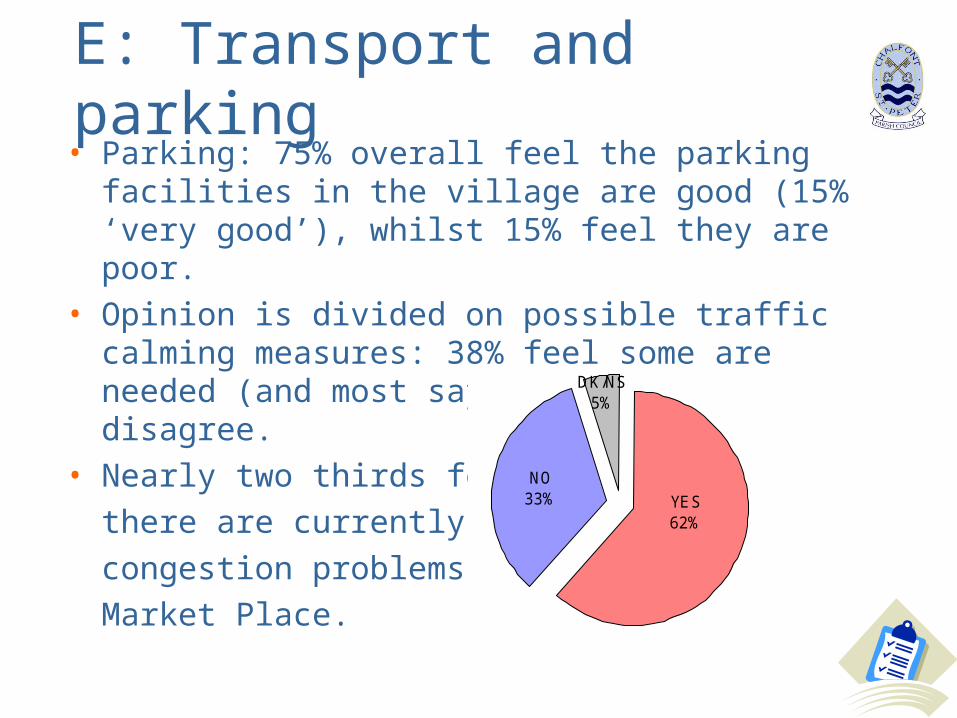
E: Transport and parking• Parking: 75% overall feel the parking facilities in the
village are good (15% ‘very good’), whilst 15% feel they are poor.
• Opinion is divided on possible traffic calming measures: 38% feel some are needed (and most say where), but 52% disagree.
• Nearly two thirds feel
there are currently traffic
congestion problems in
Market Place.
DK/NS5%
NO33% YES
62%
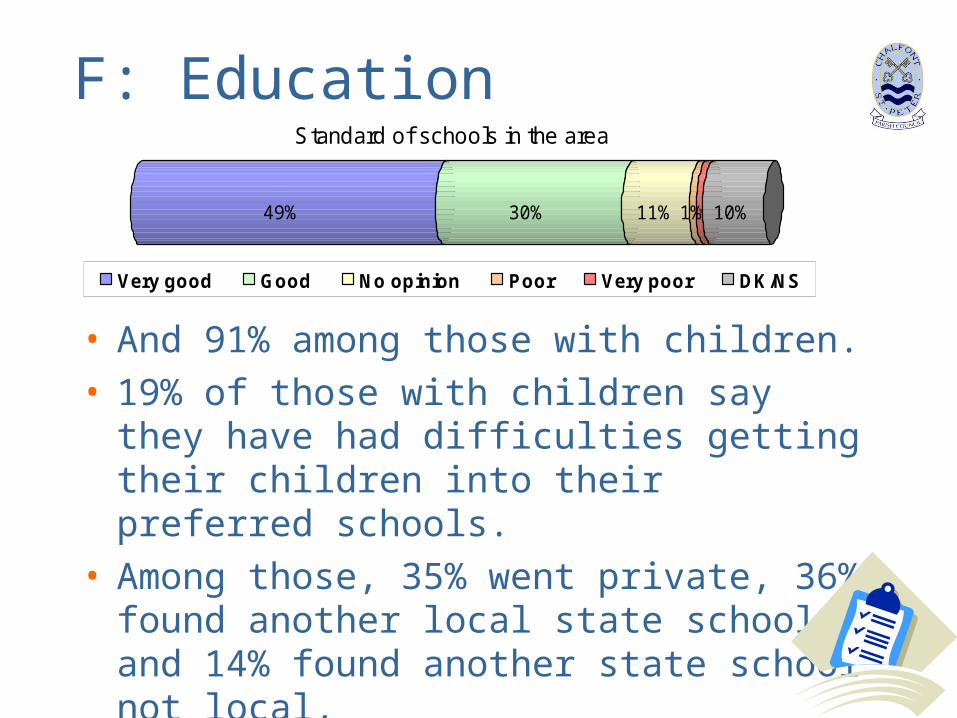
F: Education
• And 91% among those with children.• 19% of those with children say they have had
difficulties getting their children into their preferred schools.
• Among those, 35% went private, 36% found another local state school, and 14% found another state school not local,
49% 30% 11% 1%1% 10%
Standard of schools in the area
Very good Good No opinion Poor Very poor DK/NS
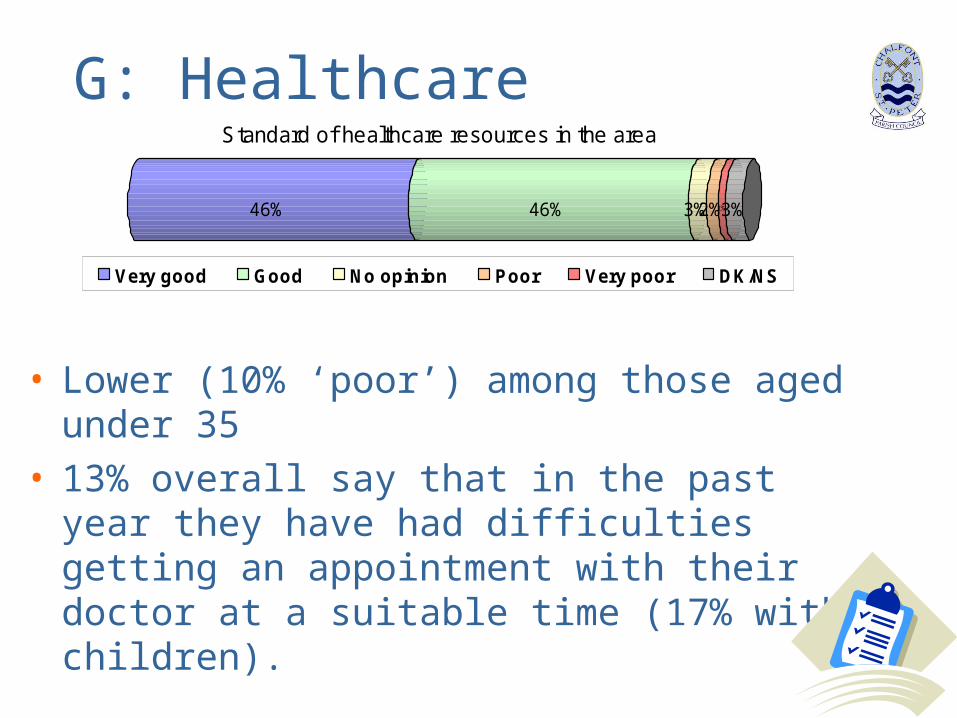
G: Healthcare
• Lower (10% ‘poor’) among those aged under 35• 13% overall say that in the past year they have
had difficulties getting an appointment with their doctor at a suitable time (17% with children).
46% 46% 3%2%1%3%
Standard of healthcare resources in the area
Very good Good No opinion Poor Very poor DK/NS
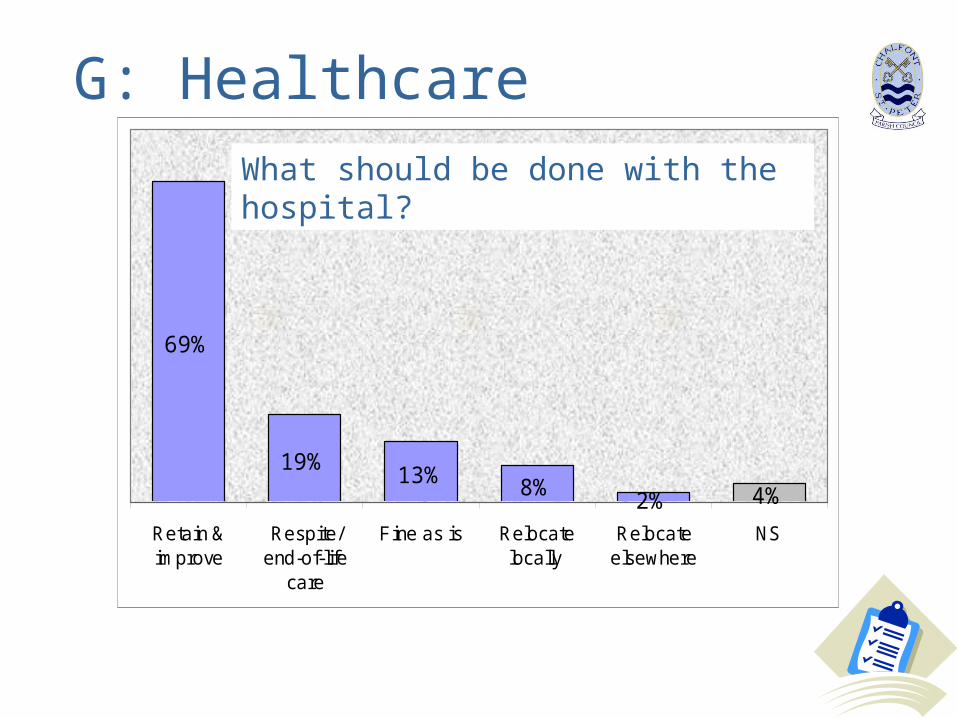
G: Healthcare
69%
19%13% 8%
2% 4%
Retain &improve
Respite/end-of-life
care
Fine as is Relocatelocally
Relocateelsewhere
NS
What should be done with the hospital?
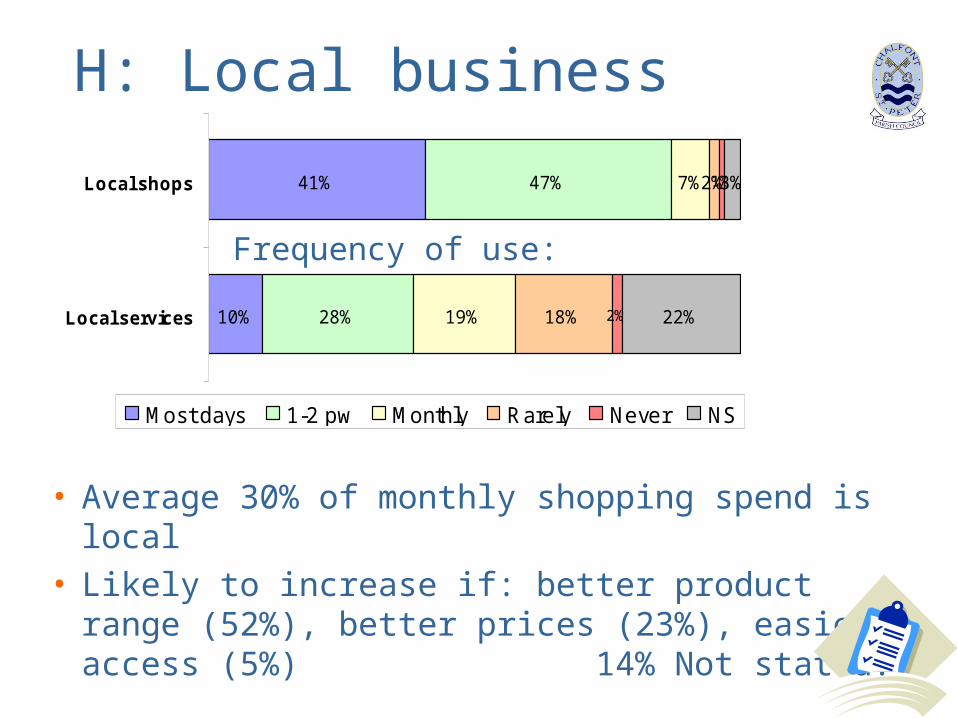
H: Local business
• Average 30% of monthly shopping spend is local• Likely to increase if: better product range (52%),
better prices (23%), easier access (5%) 14% Not stated.
41%
10%
47%
28%
7%
19%
2%
18%
1%
2%
3%
22%
Local shops
Local services
Most days 1-2 pw Monthly Rarely Never NS
Frequency of use:
H: Local business
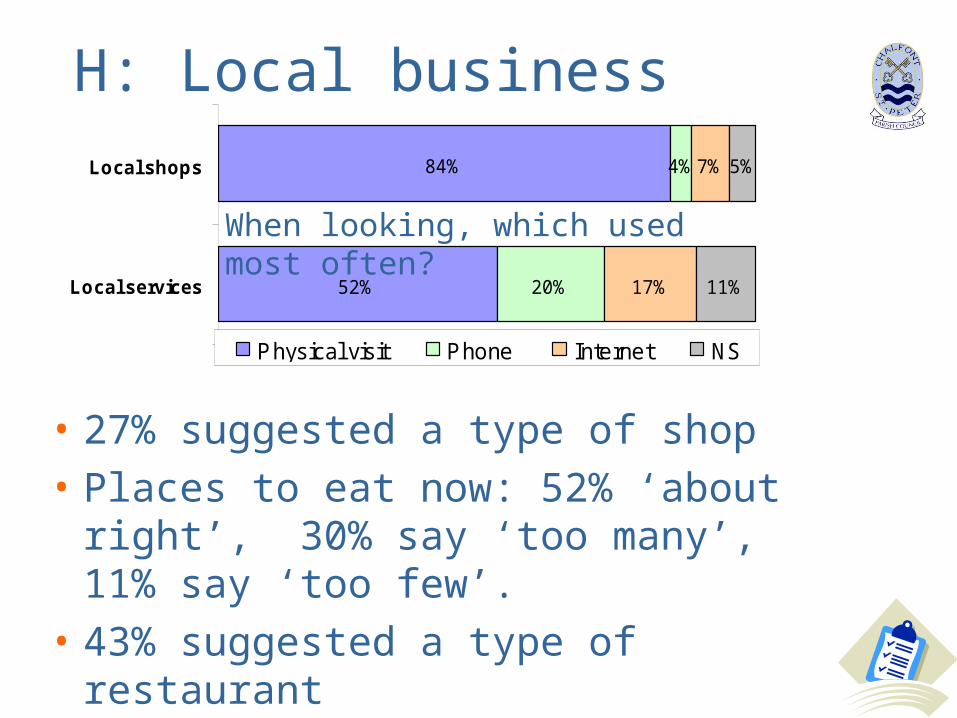
• 27% suggested a type of shop
• Places to eat now: 52% ‘about right’, 30% say ‘too many’, 11% say ‘too few’.
• 43% suggested a type of restaurant
84%
52%
4%
20%
7%
17%
5%
11%
Local shops
Local services
Physical visit Phone Internet NS
When looking, which used most often?
I: Sports & Leisure amenities
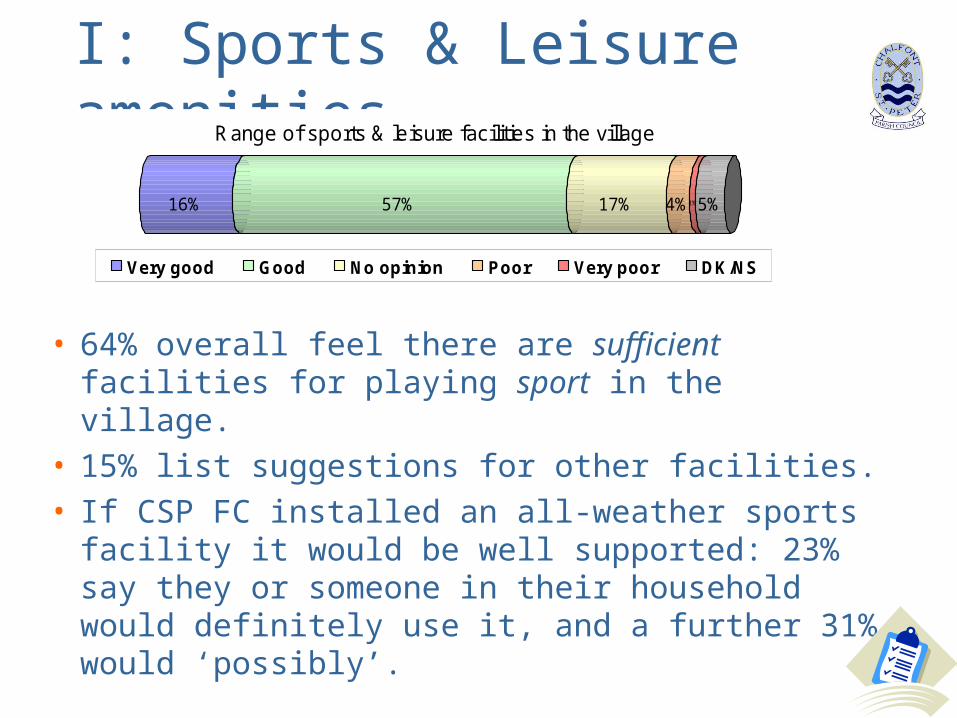
• 64% overall feel there are sufficient facilities for playing sport in the village.
• 15% list suggestions for other facilities.• If CSP FC installed an all-weather sports facility
it would be well supported: 23% say they or someone in their household would definitely use it, and a further 31% would ‘possibly’.
16% 57% 17% 4%1%5%
Range of sports & leisure facilities in the village
Very good Good No opinion Poor Very poor DK/NS
I: Sports & Leisure amenities
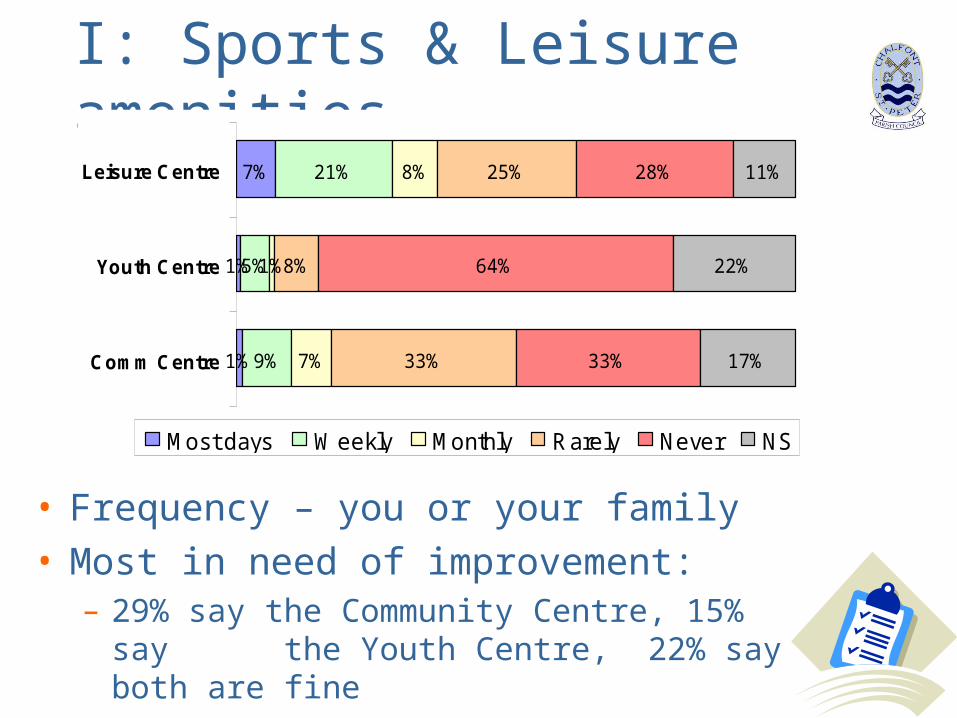
• Frequency – you or your family• Most in need of improvement:
– 29% say the Community Centre, 15% say the Youth Centre, 22% say both are fine
7%
1%
1%
21%
5%
9%
8%
1%
7%
25%
8%
33%
28%
64%
33%
11%
22%
17%
Leisure Centre
Youth Centre
Comm Centre
Most days Weekly Monthly Rarely Never NS
J: Security, crime, and policing
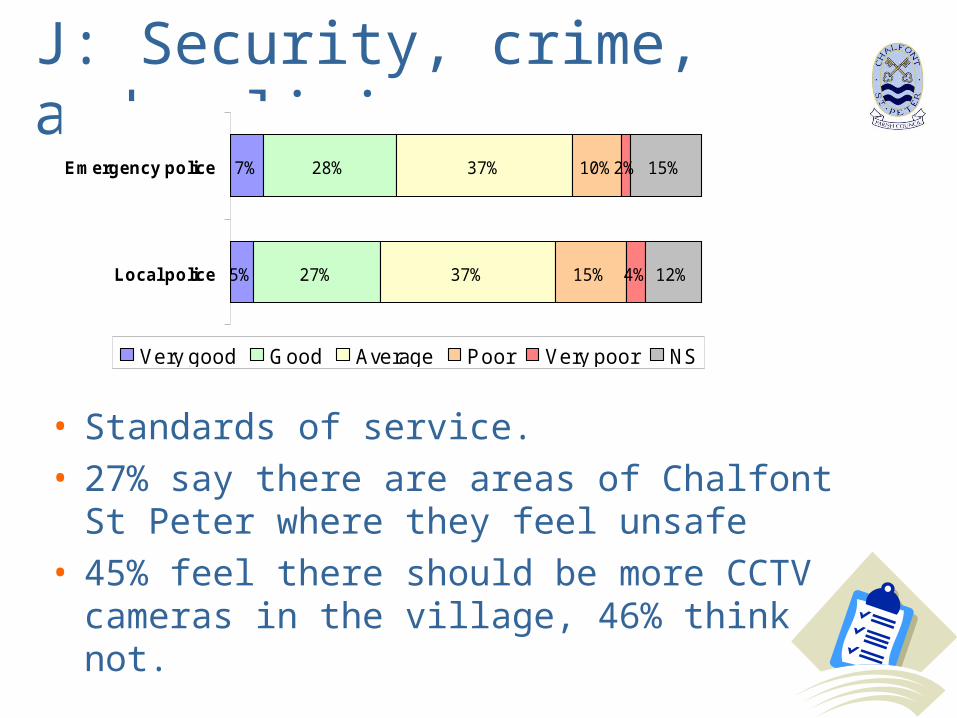
• Standards of service.• 27% say there are areas of Chalfont St Peter
where they feel unsafe• 45% feel there should be more CCTV
cameras in the village, 46% think not.
7%
5%
28%
27%
37%
37%
10%
15%
2%
4%
15%
12%
Emergency police
Local police
Very good Good Average Poor Very poor NS
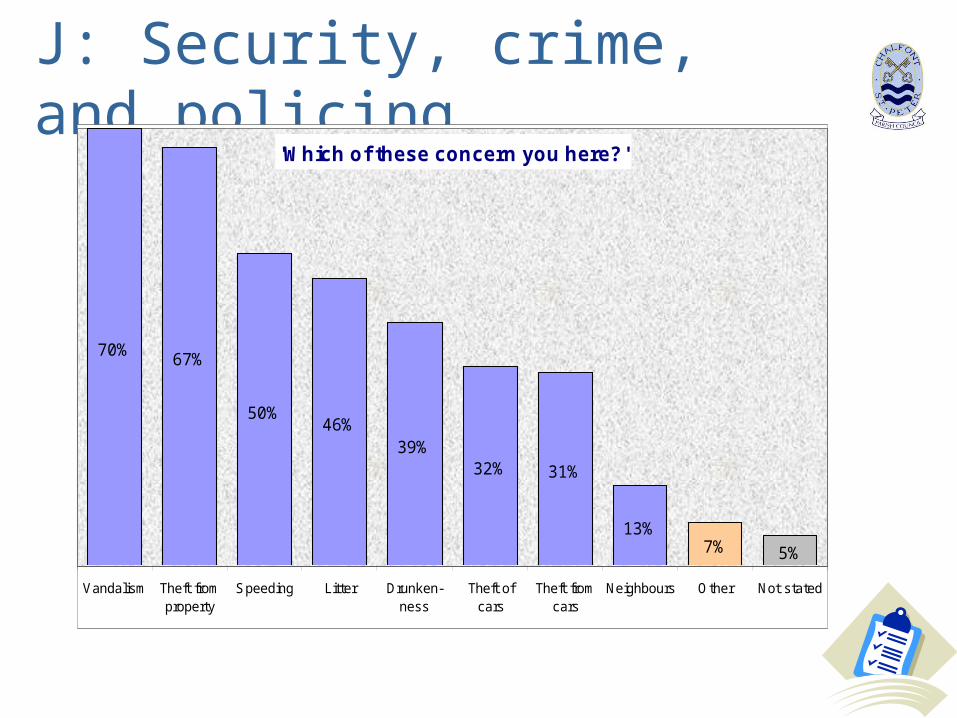
J: Security, crime, and policing
'Which of these concern you here?'
70%67%
50%46%
39%32% 31%
13%7% 5%
Vandalism Theft fromproperty
Speeding Litter Drunken-ness
Theft ofcars
Theft fromcars
Neighbours Other Not stated
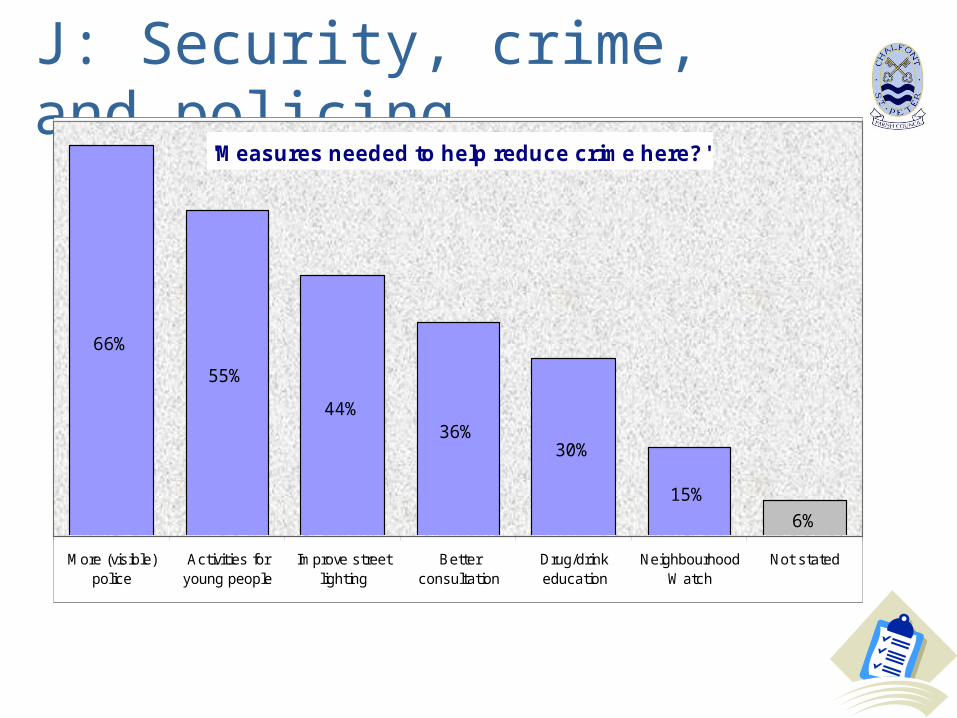
J: Security, crime, and policing
'Measures needed to help reduce crime here?'
66%
55%
44%36%
30%
15%
6%
More (visible)police
Activities foryoung people
Improve streetlighting
Betterconsultation
Drug/drinkeducation
NeighbourhoodWatch
Not stated
Overall
• So, plenty to work on, plenty of detail, lots to feed back to the various groups and working parties.
• Last, but not least, what do residents think of the work the Parish Council is doing?
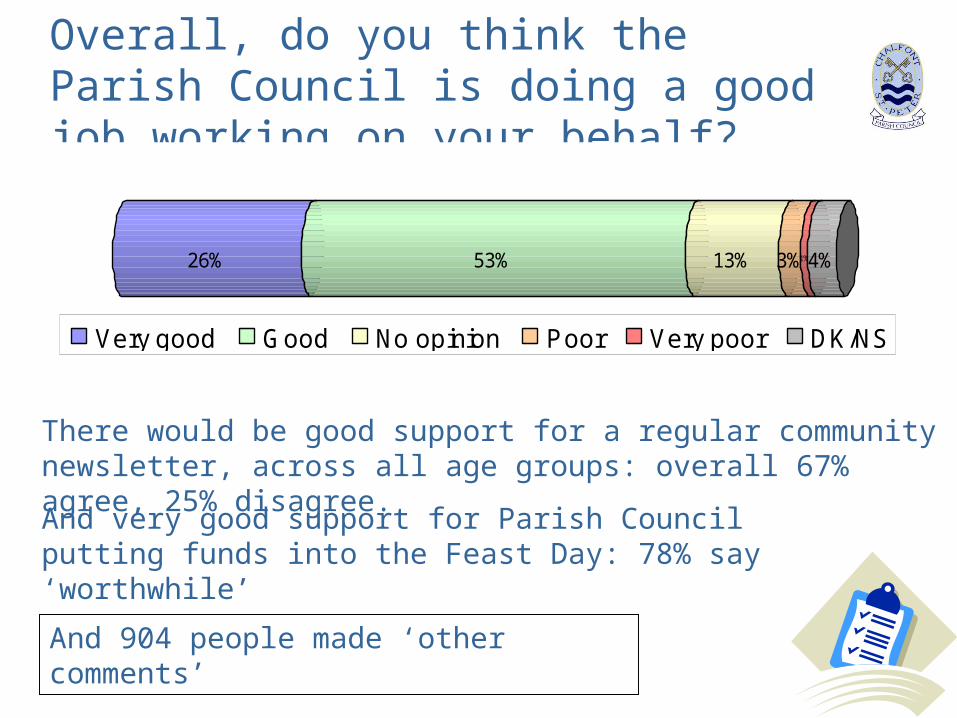
Overall, do you think the Parish Council is doing a good job working on your behalf?
26% 53% 13% 3%1%4%
Very good Good No opinion Poor Very poor DK/NS
There would be good support for a regular community newsletter, across all age groups: overall 67% agree, 25% disagree.
And very good support for Parish Council putting funds into the Feast Day: 78% say ‘worthwhile’
And 904 people made ‘other comments’
So what?
• Have clear, hard, measured data about the opinions, preferences and wishes of the residents of Chalfont St Peter
• To help you make better decisions
What next?• Results in detail• Record e-mail contact details• Read/analyse detailed verbatims• Consider a regular newsletter• Develop a Parish Plan• Use hard data in response to CDC• Advise interested groups• Feedback to the residents