Embed Size (px)
Citation preview
Chemical Geology 382 (2014) 1–13
Contents lists available at ScienceDirect
Chemical Geology
j ourna l homepage: www.e lsev ie r .com/ locate /chemgeo
Chalcophile elemental compositions of MORBs from theultraslow-spreading Southwest Indian Ridge and controls of lithosphericstructure on S-saturated differentiation
Alexandra Yang Yang a, Mei-Fu Zhou b, Tai-Ping Zhao a,⁎, Xi-Guang Deng c, Liang Qi b, Ji-Feng Xu d
a Key Laboratory of Mineralogy and Metallogeny, Guangzhou Institute of Geochemistry, Chinese Academy of Sciences, Guangzhou 510640, Chinab Department of Earth Sciences, The University of Hong Kong, Pokfulam Road, Hong Kong, Chinac Guangzhou Marine Geological Survey, Guangzhou 510760, Chinad State Key Laboratory of Isotope Geochemistry, Guangzhou Institute of Geochemistry, Chinese Academy of Sciences, Guangzhou 510640, China
⁎ Corresponding author. Tel.: +86 20 85290231; fax: +E-mail address: [email protected] (T.-P. Zhao).
http://dx.doi.org/10.1016/j.chemgeo.2014.05.0190009-2541/© 2014 Elsevier B.V. All rights reserved.
a b s t r a c t
a r t i c l e i n f oArticle history:Received 29 August 2013Received in revised form 18 April 2014Accepted 18 May 2014Available online 25 May 2014
Editor: L. Reisberg
Keywords:Mid-ocean ridge basalts (MORBs)Southwest Indian Ridge (SWIR)Platinum-group elements (PGE)Ultra-slow spreading ridgesSulfide globules
Sulfide globules in mid-ocean ridge basalts (MORBs) from the ultra-slow spreading Southwest Indian Ridge(SWIR) are present in olivine crystals and in the matrix glass, indicating S-saturated fractionation during mag-matic evolution. Most of the sulfides were in equilibrium with the magmas based on the Ni contents of the sul-fides. The major element trends of MORBs from Zone C (48–51°E) of the SWIR define two distinct liquid lines ofdescent (LLD), including onewhich is composed of MORBs depleted in HREE. TheMORBs have variable PGE con-centrations with Pd contents ranging from 0.056 to 1.572 ppb. They are PGE-depleted relative to Ni and Cu withhigh Cu/Pd ratios (55,000–1,785,000). Quantitative modeling using Pd vs. Ni correlations yields relatively lowamounts of segregated sulfides for both groups assuming complete equilibration between the sulfides and themelt. However, the correlation of calculated sulfur contents with MgO suggests much higher amounts of segre-gated sulfides, indicating that the segregated sulfides are incompletely equilibrated with the magma.There are no obvious correlations between PGE concentrations and spreading rates for MORBs globally. MORBsfrom the SWIR show slowly decreasing PGE contents during magmatic evolution but exhibit higher sulfide seg-regation rates compared to MORBs from faster-spreading ridges, largely due to the poor equilibration betweenthe segregated sulfides and the magma. Such incomplete equilibration could result from thicker lithosphereand an absence of steady magma chambers and conduits beneath ultra-slow spreading ridges.
© 2014 Elsevier B.V. All rights reserved.
1. Introduction
The Southwest Indian Ridge (SWIR) is an ultraslow-spreading ridgewith a spreading rate of≤18 mm/year (Dick et al., 2003), characterizedby low degrees of volcanismwith thin crust and thick lithosphericman-tle (Dunn and Forsyth, 2007). Mid-ocean ridge basalts (MORBs) fromsuch ridges have high Na8.0 (calculated Na2O contents at 8% MgO,Klein and Langmuir, 1987), and La/Sm ratios, with high REE concentra-tions and low CaO/Al2O3 ratios (White et al., 2001). Thicker lithosphericmantle leads to a shorter melting column and lower degrees of partialmelting (Bown andWhite, 1994), which thus explain the unique chem-ical compositions of MORBs from ultraslow-spreading ridges (e.g.,White et al., 2001). However, only very few studies concern how litho-spheric thickness and the structure of ultra-slow spreading ridgescontrol the magmatic evolution of MORBs (e.g., Yang et al., 2013).
86 20 85290130.
MORBmagmas are S-saturated before eruption and probably also intheir source region (Mathez, 1976; Czamanske and Moore, 1977).Platinum-group elements (PGE) are sensitive to the segregation ofimmiscible sulfide liquids during the evolution of mafic magmas (e.g.,Hamlyn et al., 1985; Brügmann et al., 1993; Keays, 1995; Fleet et al.,1996;Maier et al., 1996; Rehkämper et al., 1999; Song et al., 2006). Dur-ing fractional crystallization of S-undersaturated magmas, the iridium-subgroup of PGE (IPGE: Os, Ir and Ru) commonly behave as compatibleelements but the platinum-subgroup of PGE (PPGE: Rh, Pt and Pd) areincompatible (e.g., Puchtel and Humayun, 2001; Righter et al., 2004).However, if magmas are S-saturated, separation of immiscible sulfideswould produce extremely PGE-depleted magmas (e.g., Peach et al.,1990; Fleet et al., 1996). Rehkämper et al. (1999) and Bézos et al.(2005) published Ir, Ru, Pt and Pd data for 36 MORB samples from thePacific, Atlantic and Indian oceanic ridges and the Red Sea spreadingcenters. These studies showed in a generalway howPGE concentrationsofMORBs are controlled by different degrees of partialmelting and frac-tional crystallization (Rehkämper et al., 1999; Bézos et al., 2005). How-ever, due to the limited high-precision PGE dataset for MORBs globally,
2 A.Y. Yang et al. / Chemical Geology 382 (2014) 1–13
the possible role of variable lithospheric structures on the PGE system-atics of MORBs is not clear.
Organized and funded by the China Ocean Mineral Resources R & DAssociation (COMRA), R/V DaYangYiHao (“Ocean #1”) collected a largenumber of new MORB samples from the eastern SWIR. Utilizing newPGE and sulfide composition data from these samples, this paper dis-cusses the effect of ultra-slow spreading on the silicate fractionationand sulfide saturation history of MORBs.
2. Geological setting and samples
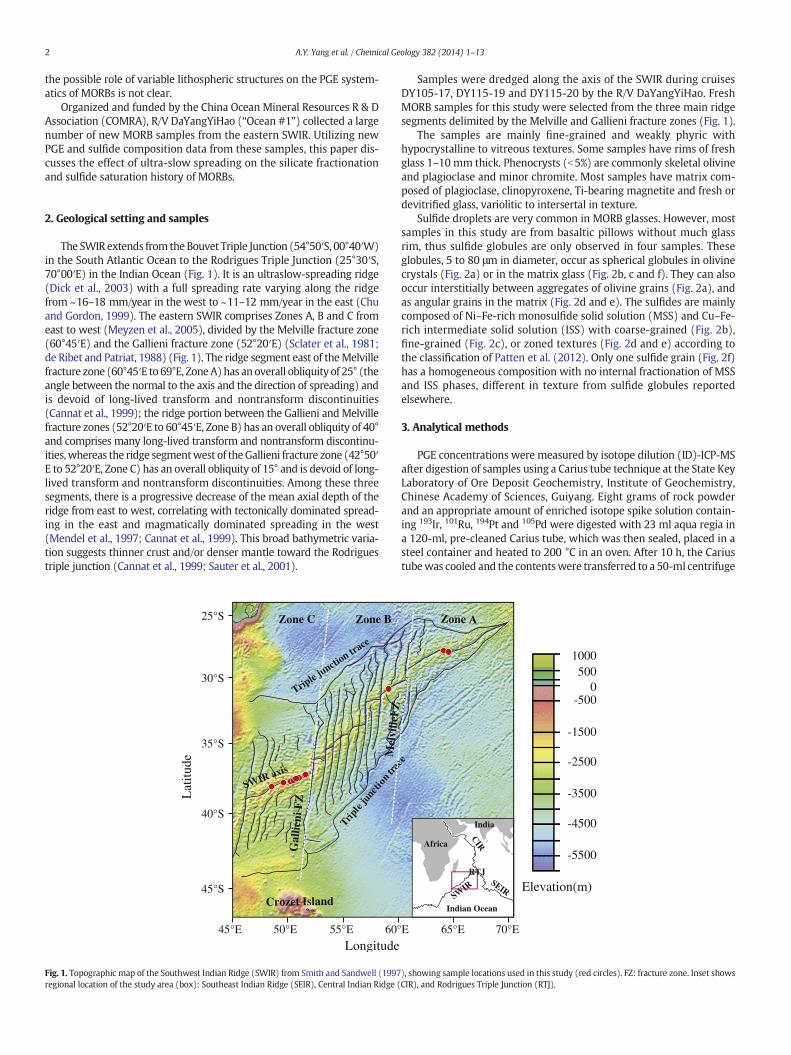
The SWIR extends from theBouvet Triple Junction (54°50′S, 00°40′W)in the South Atlantic Ocean to the Rodrigues Triple Junction (25°30′S,70°00′E) in the Indian Ocean (Fig. 1). It is an ultraslow-spreading ridge(Dick et al., 2003) with a full spreading rate varying along the ridgefrom ~16–18 mm/year in the west to ~11–12 mm/year in the east (Chuand Gordon, 1999). The eastern SWIR comprises Zones A, B and C fromeast to west (Meyzen et al., 2005), divided by the Melville fracture zone(60°45′E) and the Gallieni fracture zone (52°20′E) (Sclater et al., 1981;de Ribet and Patriat, 1988) (Fig. 1). The ridge segment east of theMelvillefracture zone (60°45′E to 69°E, ZoneA)has anoverall obliquity of 25° (theangle between the normal to the axis and the direction of spreading) andis devoid of long-lived transform and nontransform discontinuities(Cannat et al., 1999); the ridge portion between the Gallieni andMelvillefracture zones (52°20′E to 60°45′E, Zone B) has an overall obliquity of 40°and comprises many long-lived transform and nontransform discontinu-ities,whereas the ridge segmentwest of theGallieni fracture zone (42°50′E to 52°20′E, Zone C) has an overall obliquity of 15° and is devoid of long-lived transform and nontransform discontinuities. Among these threesegments, there is a progressive decrease of the mean axial depth of theridge from east to west, correlating with tectonically dominated spread-ing in the east and magmatically dominated spreading in the west(Mendel et al., 1997; Cannat et al., 1999). This broad bathymetric varia-tion suggests thinner crust and/or denser mantle toward the Rodriguestriple junction (Cannat et al., 1999; Sauter et al., 2001).
30°S
40°S
50°E 60°
45°S
35°S
25°S
45°E 55°E
SWIR axis
Gal
lieni
FZ
Mel
ville
Triple
junc
tion tra
Longitude
Lat
itude
Zone BZone C
Crozet Island
Triple j
unction tra
ce
Fig. 1. Topographic map of the Southwest Indian Ridge (SWIR) from Smith and Sandwell (1997regional location of the study area (box): Southeast Indian Ridge (SEIR), Central Indian Ridge (
Samples were dredged along the axis of the SWIR during cruisesDY105-17, DY115-19 and DY115-20 by the R/V DaYangYiHao. FreshMORB samples for this study were selected from the three main ridgesegments delimited by the Melville and Gallieni fracture zones (Fig. 1).
The samples are mainly fine-grained and weakly phyric withhypocrystalline to vitreous textures. Some samples have rims of freshglass 1–10 mm thick. Phenocrysts (b5%) are commonly skeletal olivineand plagioclase and minor chromite. Most samples have matrix com-posed of plagioclase, clinopyroxene, Ti-bearing magnetite and fresh ordevitrified glass, variolitic to intersertal in texture.
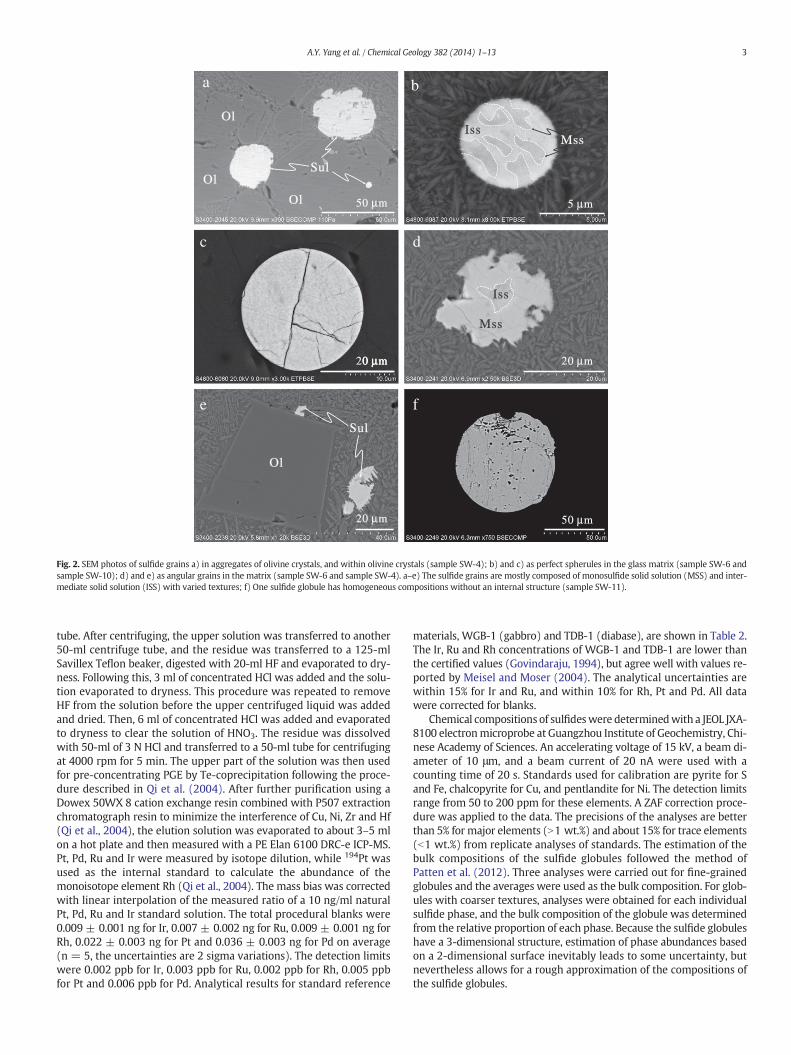
Sulfide droplets are very common in MORB glasses. However, mostsamples in this study are from basaltic pillows without much glassrim, thus sulfide globules are only observed in four samples. Theseglobules, 5 to 80 μm in diameter, occur as spherical globules in olivinecrystals (Fig. 2a) or in the matrix glass (Fig. 2b, c and f). They can alsooccur interstitially between aggregates of olivine grains (Fig. 2a), andas angular grains in the matrix (Fig. 2d and e). The sulfides are mainlycomposed of Ni–Fe-rich monosulfide solid solution (MSS) and Cu–Fe-rich intermediate solid solution (ISS) with coarse-grained (Fig. 2b),fine-grained (Fig. 2c), or zoned textures (Fig. 2d and e) according tothe classification of Patten et al. (2012). Only one sulfide grain (Fig. 2f)has a homogeneous composition with no internal fractionation of MSSand ISS phases, different in texture from sulfide globules reportedelsewhere.
3. Analytical methods
PGE concentrations were measured by isotope dilution (ID)-ICP-MSafter digestion of samples using a Carius tube technique at the State KeyLaboratory of Ore Deposit Geochemistry, Institute of Geochemistry,Chinese Academy of Sciences, Guiyang. Eight grams of rock powderand an appropriate amount of enriched isotope spike solution contain-ing 193Ir, 101Ru, 194Pt and 105Pd were digested with 23 ml aqua regia ina 120-ml, pre-cleaned Carius tube, which was then sealed, placed in asteel container and heated to 200 °C in an oven. After 10 h, the Cariustubewas cooled and the contentswere transferred to a 50-ml centrifuge
E 70°E65°E
FZ
ce
Elevation(m)
Zone A
Indian OceanSW
IRSEIR
CIRAfrica
India
-1500
0
-3500
-5500
-2500
-4500
1000500
-500
RTJ
), showing sample locations used in this study (red circles). FZ: fracture zone. Inset showsCIR), and Rodrigues Triple Junction (RTJ).
50 µm
20 µm
Mss
Iss
Ol
Ol
Ol
a b
Mss
Sul
Iss
5 µm50 µm
20 µm
Ol
Sul
20 µm
c
0 µm
d
e f
Fig. 2. SEM photos of sulfide grains a) in aggregates of olivine crystals, and within olivine crystals (sample SW-4); b) and c) as perfect spherules in the glass matrix (sample SW-6 andsample SW-10); d) and e) as angular grains in the matrix (sample SW-6 and sample SW-4). a–e) The sulfide grains are mostly composed of monosulfide solid solution (MSS) and inter-mediate solid solution (ISS) with varied textures; f) One sulfide globule has homogeneous compositions without an internal structure (sample SW-11).
3A.Y. Yang et al. / Chemical Geology 382 (2014) 1–13
tube. After centrifuging, the upper solution was transferred to another50-ml centrifuge tube, and the residue was transferred to a 125-mlSavillex Teflon beaker, digested with 20-ml HF and evaporated to dry-ness. Following this, 3 ml of concentrated HCl was added and the solu-tion evaporated to dryness. This procedure was repeated to removeHF from the solution before the upper centrifuged liquid was addedand dried. Then, 6 ml of concentrated HCl was added and evaporatedto dryness to clear the solution of HNO3. The residue was dissolvedwith 50-ml of 3 N HCl and transferred to a 50-ml tube for centrifugingat 4000 rpm for 5 min. The upper part of the solution was then usedfor pre-concentrating PGE by Te-coprecipitation following the proce-dure described in Qi et al. (2004). After further purification using aDowex 50WX 8 cation exchange resin combined with P507 extractionchromatograph resin to minimize the interference of Cu, Ni, Zr and Hf(Qi et al., 2004), the elution solution was evaporated to about 3–5 mlon a hot plate and then measured with a PE Elan 6100 DRC-e ICP-MS.Pt, Pd, Ru and Ir were measured by isotope dilution, while 194Pt wasused as the internal standard to calculate the abundance of themonoisotope element Rh (Qi et al., 2004). The mass bias was correctedwith linear interpolation of the measured ratio of a 10 ng/ml naturalPt, Pd, Ru and Ir standard solution. The total procedural blanks were0.009 ± 0.001 ng for Ir, 0.007 ± 0.002 ng for Ru, 0.009 ± 0.001 ng forRh, 0.022 ± 0.003 ng for Pt and 0.036 ± 0.003 ng for Pd on average(n = 5, the uncertainties are 2 sigma variations). The detection limitswere 0.002 ppb for Ir, 0.003 ppb for Ru, 0.002 ppb for Rh, 0.005 ppbfor Pt and 0.006 ppb for Pd. Analytical results for standard reference
materials, WGB-1 (gabbro) and TDB-1 (diabase), are shown in Table 2.The Ir, Ru and Rh concentrations of WGB-1 and TDB-1 are lower thanthe certified values (Govindaraju, 1994), but agree well with values re-ported by Meisel and Moser (2004). The analytical uncertainties arewithin 15% for Ir and Ru, and within 10% for Rh, Pt and Pd. All datawere corrected for blanks.
Chemical compositions of sulfideswere determinedwith a JEOL JXA-8100 electronmicroprobe at Guangzhou Institute of Geochemistry, Chi-nese Academy of Sciences. An accelerating voltage of 15 kV, a beam di-ameter of 10 μm, and a beam current of 20 nA were used with acounting time of 20 s. Standards used for calibration are pyrite for Sand Fe, chalcopyrite for Cu, and pentlandite for Ni. The detection limitsrange from 50 to 200 ppm for these elements. A ZAF correction proce-dure was applied to the data. The precisions of the analyses are betterthan 5% for major elements (N1 wt.%) and about 15% for trace elements(b1 wt.%) from replicate analyses of standards. The estimation of thebulk compositions of the sulfide globules followed the method ofPatten et al. (2012). Three analyses were carried out for fine-grainedglobules and the averages were used as the bulk composition. For glob-ules with coarser textures, analyses were obtained for each individualsulfide phase, and the bulk composition of the globule was determinedfrom the relative proportion of each phase. Because the sulfide globuleshave a 3-dimensional structure, estimation of phase abundances basedon a 2-dimensional surface inevitably leads to some uncertainty, butnevertheless allows for a rough approximation of the compositions ofthe sulfide globules.
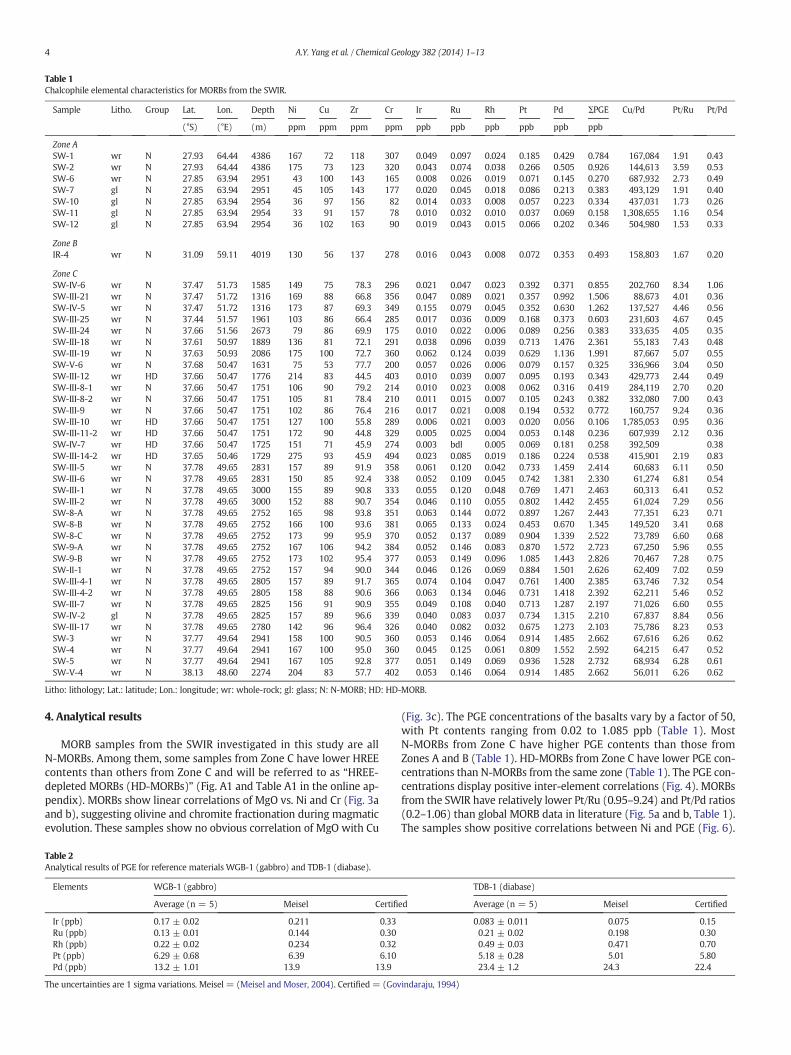
Table 1Chalcophile elemental characteristics for MORBs from the SWIR.
Sample Litho. Group Lat. Lon. Depth Ni Cu Zr Cr Ir Ru Rh Pt Pd ΣPGE Cu/Pd Pt/Ru Pt/Pd
(°S) (°E) (m) ppm ppm ppm ppm ppb ppb ppb ppb ppb ppb
Zone ASW-1 wr N 27.93 64.44 4386 167 72 118 307 0.049 0.097 0.024 0.185 0.429 0.784 167,084 1.91 0.43SW-2 wr N 27.93 64.44 4386 175 73 123 320 0.043 0.074 0.038 0.266 0.505 0.926 144,613 3.59 0.53SW-6 wr N 27.85 63.94 2951 43 100 143 165 0.008 0.026 0.019 0.071 0.145 0.270 687,932 2.73 0.49SW-7 gl N 27.85 63.94 2951 45 105 143 177 0.020 0.045 0.018 0.086 0.213 0.383 493,129 1.91 0.40SW-10 gl N 27.85 63.94 2954 36 97 156 82 0.014 0.033 0.008 0.057 0.223 0.334 437,031 1.73 0.26SW-11 gl N 27.85 63.94 2954 33 91 157 78 0.010 0.032 0.010 0.037 0.069 0.158 1,308,655 1.16 0.54SW-12 gl N 27.85 63.94 2954 36 102 163 90 0.019 0.043 0.015 0.066 0.202 0.346 504,980 1.53 0.33
Zone BIR-4 wr N 31.09 59.11 4019 130 56 137 278 0.016 0.043 0.008 0.072 0.353 0.493 158,803 1.67 0.20
Zone CSW-IV-6 wr N 37.47 51.73 1585 149 75 78.3 296 0.021 0.047 0.023 0.392 0.371 0.855 202,760 8.34 1.06SW-III-21 wr N 37.47 51.72 1316 169 88 66.8 356 0.047 0.089 0.021 0.357 0.992 1.506 88,673 4.01 0.36SW-IV-5 wr N 37.47 51.72 1316 173 87 69.3 349 0.155 0.079 0.045 0.352 0.630 1.262 137,527 4.46 0.56SW-III-25 wr N 37.44 51.57 1961 103 86 66.4 285 0.017 0.036 0.009 0.168 0.373 0.603 231,603 4.67 0.45SW-III-24 wr N 37.66 51.56 2673 79 86 69.9 175 0.010 0.022 0.006 0.089 0.256 0.383 333,635 4.05 0.35SW-III-18 wr N 37.61 50.97 1889 136 81 72.1 291 0.038 0.096 0.039 0.713 1.476 2.361 55,183 7.43 0.48SW-III-19 wr N 37.63 50.93 2086 175 100 72.7 360 0.062 0.124 0.039 0.629 1.136 1.991 87,667 5.07 0.55SW-V-6 wr N 37.68 50.47 1631 75 53 77.7 200 0.057 0.026 0.006 0.079 0.157 0.325 336,966 3.04 0.50SW-III-12 wr HD 37.66 50.47 1776 214 83 44.5 403 0.010 0.039 0.007 0.095 0.193 0.343 429,773 2.44 0.49SW-III-8-1 wr N 37.66 50.47 1751 106 90 79.2 214 0.010 0.023 0.008 0.062 0.316 0.419 284,119 2.70 0.20SW-III-8-2 wr N 37.66 50.47 1751 105 81 78.4 210 0.011 0.015 0.007 0.105 0.243 0.382 332,080 7.00 0.43SW-III-9 wr N 37.66 50.47 1751 102 86 76.4 216 0.017 0.021 0.008 0.194 0.532 0.772 160,757 9.24 0.36SW-III-10 wr HD 37.66 50.47 1751 127 100 55.8 289 0.006 0.021 0.003 0.020 0.056 0.106 1,785,053 0.95 0.36SW-III-11-2 wr HD 37.66 50.47 1751 172 90 44.8 329 0.005 0.025 0.004 0.053 0.148 0.236 607,939 2.12 0.36SW-IV-7 wr HD 37.66 50.47 1725 151 71 45.9 274 0.003 bdl 0.005 0.069 0.181 0.258 392,509 0.38SW-III-14-2 wr HD 37.65 50.46 1729 275 93 45.9 494 0.023 0.085 0.019 0.186 0.224 0.538 415,901 2.19 0.83SW-III-5 wr N 37.78 49.65 2831 157 89 91.9 358 0.061 0.120 0.042 0.733 1.459 2.414 60,683 6.11 0.50SW-III-6 wr N 37.78 49.65 2831 150 85 92.4 338 0.052 0.109 0.045 0.742 1.381 2.330 61,274 6.81 0.54SW-III-1 wr N 37.78 49.65 3000 155 89 90.8 333 0.055 0.120 0.048 0.769 1.471 2.463 60,313 6.41 0.52SW-III-2 wr N 37.78 49.65 3000 152 88 90.7 354 0.046 0.110 0.055 0.802 1.442 2.455 61,024 7.29 0.56SW-8-A wr N 37.78 49.65 2752 165 98 93.8 351 0.063 0.144 0.072 0.897 1.267 2.443 77,351 6.23 0.71SW-8-B wr N 37.78 49.65 2752 166 100 93.6 381 0.065 0.133 0.024 0.453 0.670 1.345 149,520 3.41 0.68SW-8-C wr N 37.78 49.65 2752 173 99 95.9 370 0.052 0.137 0.089 0.904 1.339 2.522 73,789 6.60 0.68SW-9-A wr N 37.78 49.65 2752 167 106 94.2 384 0.052 0.146 0.083 0.870 1.572 2.723 67,250 5.96 0.55SW-9-B wr N 37.78 49.65 2752 173 102 95.4 377 0.053 0.149 0.096 1.085 1.443 2.826 70,467 7.28 0.75SW-II-1 wr N 37.78 49.65 2752 157 94 90.0 344 0.046 0.126 0.069 0.884 1.501 2.626 62,409 7.02 0.59SW-III-4-1 wr N 37.78 49.65 2805 157 89 91.7 365 0.074 0.104 0.047 0.761 1.400 2.385 63,746 7.32 0.54SW-III-4-2 wr N 37.78 49.65 2805 158 88 90.6 366 0.063 0.134 0.046 0.731 1.418 2.392 62,211 5.46 0.52SW-III-7 wr N 37.78 49.65 2825 156 91 90.9 355 0.049 0.108 0.040 0.713 1.287 2.197 71,026 6.60 0.55SW-IV-2 gl N 37.78 49.65 2825 157 89 96.6 339 0.040 0.083 0.037 0.734 1.315 2.210 67,837 8.84 0.56SW-III-17 wr N 37.78 49.65 2780 142 96 96.4 326 0.040 0.082 0.032 0.675 1.273 2.103 75,786 8.23 0.53SW-3 wr N 37.77 49.64 2941 158 100 90.5 360 0.053 0.146 0.064 0.914 1.485 2.662 67,616 6.26 0.62SW-4 wr N 37.77 49.64 2941 167 100 95.0 360 0.045 0.125 0.061 0.809 1.552 2.592 64,215 6.47 0.52SW-5 wr N 37.77 49.64 2941 167 105 92.8 377 0.051 0.149 0.069 0.936 1.528 2.732 68,934 6.28 0.61SW-V-4 wr N 38.13 48.60 2274 204 83 57.7 402 0.053 0.146 0.064 0.914 1.485 2.662 56,011 6.26 0.62
Litho: lithology; Lat.: latitude; Lon.: longitude; wr: whole-rock; gl: glass; N: N-MORB; HD: HD-MORB.
4 A.Y. Yang et al. / Chemical Geology 382 (2014) 1–13
4. Analytical results
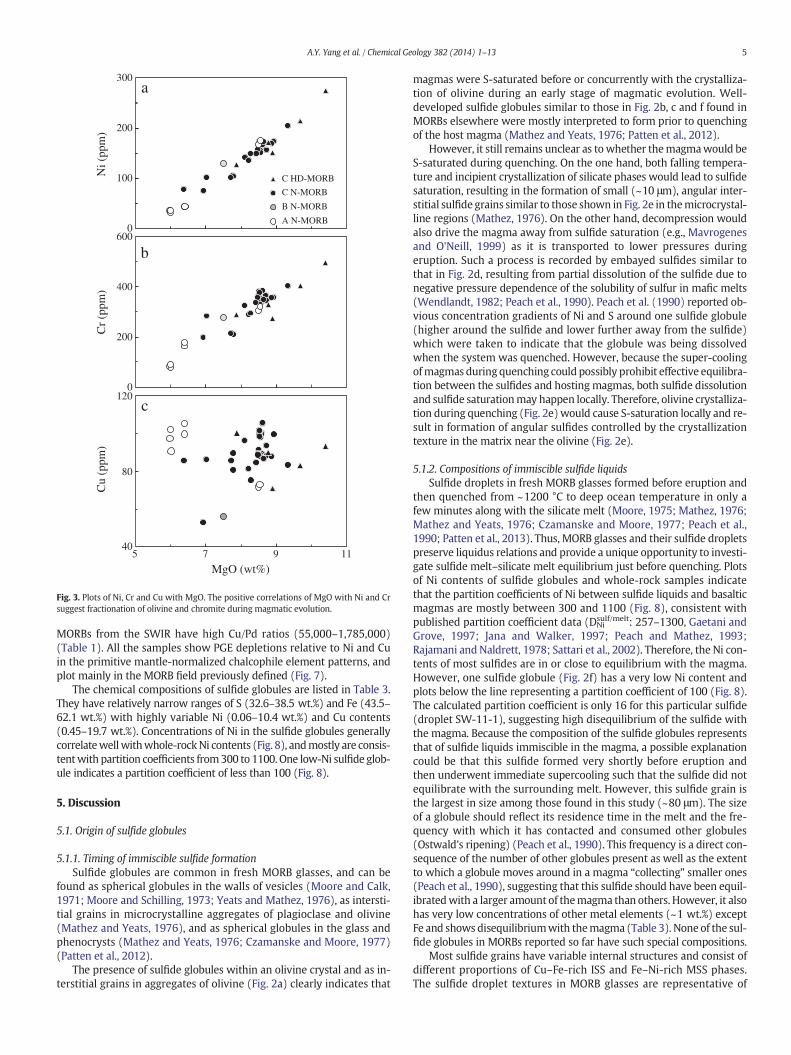
MORB samples from the SWIR investigated in this study are allN-MORBs. Among them, some samples from Zone C have lower HREEcontents than others from Zone C and will be referred to as “HREE-depleted MORBs (HD-MORBs)” (Fig. A1 and Table A1 in the online ap-pendix). MORBs show linear correlations of MgO vs. Ni and Cr (Fig. 3aand b), suggesting olivine and chromite fractionation during magmaticevolution. These samples show no obvious correlation of MgO with Cu
Table 2Analytical results of PGE for reference materials WGB-1 (gabbro) and TDB-1 (diabase).
Elements WGB-1 (gabbro)
Average (n = 5) Meisel Certifi
Ir (ppb) 0.17 ± 0.02 0.211 0.33Ru (ppb) 0.13 ± 0.01 0.144 0.30Rh (ppb) 0.22 ± 0.02 0.234 0.32Pt (ppb) 6.29 ± 0.68 6.39 6.10Pd (ppb) 13.2 ± 1.01 13.9 13.9
The uncertainties are 1 sigma variations. Meisel = (Meisel and Moser, 2004). Certified = (Gov
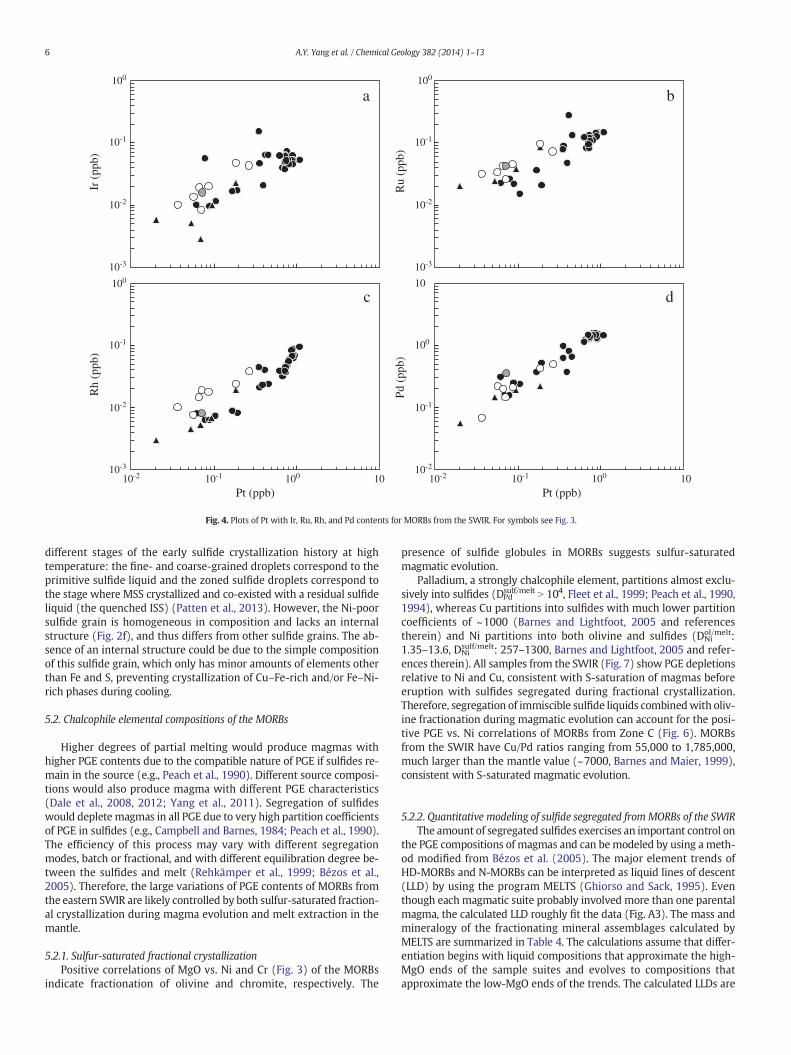
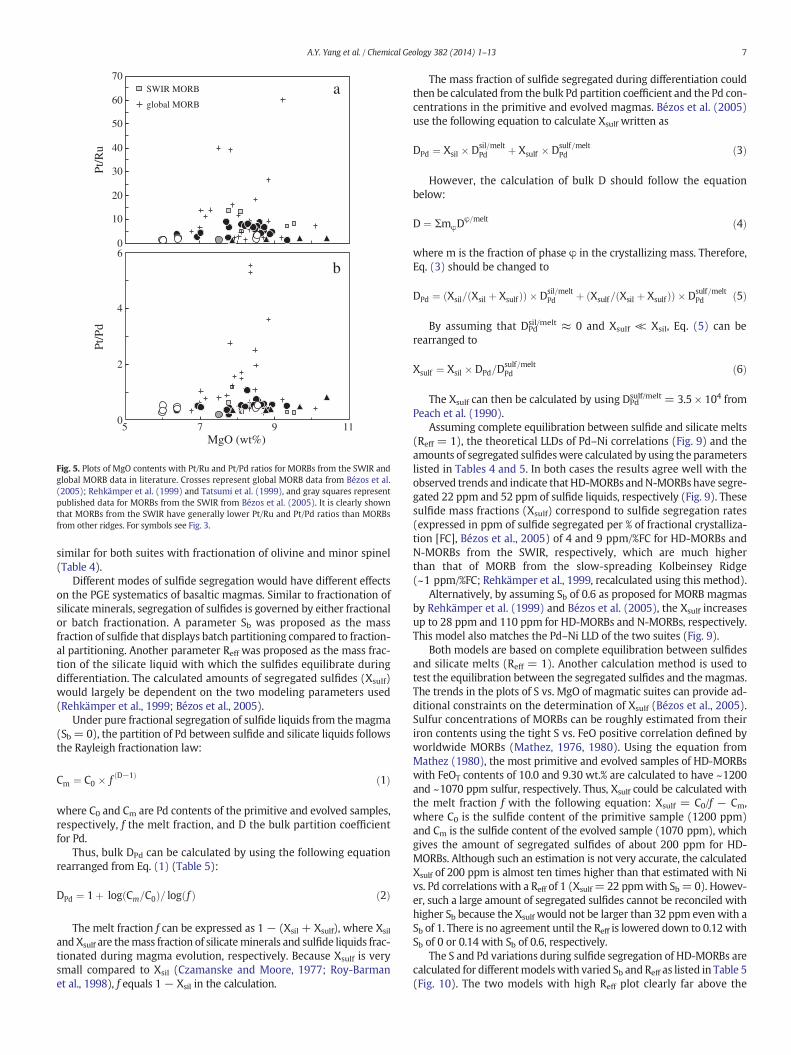
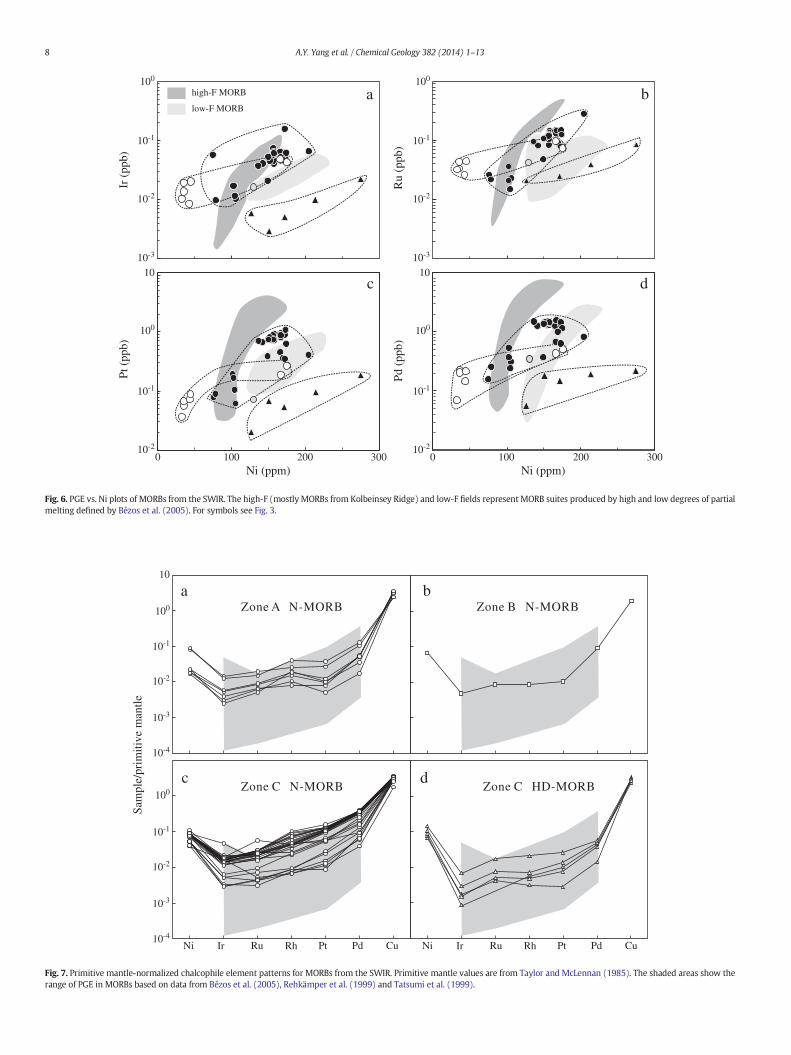
(Fig. 3c). The PGE concentrations of the basalts vary by a factor of 50,with Pt contents ranging from 0.02 to 1.085 ppb (Table 1). MostN-MORBs from Zone C have higher PGE contents than those fromZones A and B (Table 1). HD-MORBs from Zone C have lower PGE con-centrations than N-MORBs from the same zone (Table 1). The PGE con-centrations display positive inter-element correlations (Fig. 4). MORBsfrom the SWIR have relatively lower Pt/Ru (0.95–9.24) and Pt/Pd ratios(0.2–1.06) than global MORB data in literature (Fig. 5a and b, Table 1).The samples show positive correlations between Ni and PGE (Fig. 6).
TDB-1 (diabase)
ed Average (n = 5) Meisel Certified
0.083 ± 0.011 0.075 0.150.21 ± 0.02 0.198 0.300.49 ± 0.03 0.471 0.705.18 ± 0.28 5.01 5.8023.4 ± 1.2 24.3 22.4
indaraju, 1994)
0
400
Cr
(ppm
)
0
100
200
300
Ni (
ppm
)
5 7 9 11
MgO (wt%)
200
a
b
C N-MORB
C HD-MORB
A N-MORB
B N-MORB
600
40
80
120
Cu
(ppm
)
c
Fig. 3. Plots of Ni, Cr and Cu with MgO. The positive correlations of MgO with Ni and Crsuggest fractionation of olivine and chromite during magmatic evolution.
5A.Y. Yang et al. / Chemical Geology 382 (2014) 1–13
MORBs from the SWIR have high Cu/Pd ratios (55,000–1,785,000)(Table 1). All the samples show PGE depletions relative to Ni and Cuin the primitive mantle-normalized chalcophile element patterns, andplot mainly in the MORB field previously defined (Fig. 7).
The chemical compositions of sulfide globules are listed in Table 3.They have relatively narrow ranges of S (32.6–38.5 wt.%) and Fe (43.5–62.1 wt.%) with highly variable Ni (0.06–10.4 wt.%) and Cu contents(0.45–19.7 wt.%). Concentrations of Ni in the sulfide globules generallycorrelatewellwithwhole-rockNi contents (Fig. 8), andmostly are consis-tentwith partition coefficients from300 to 1100. One low-Ni sulfide glob-ule indicates a partition coefficient of less than 100 (Fig. 8).
5. Discussion
5.1. Origin of sulfide globules
5.1.1. Timing of immiscible sulfide formationSulfide globules are common in fresh MORB glasses, and can be
found as spherical globules in the walls of vesicles (Moore and Calk,1971; Moore and Schilling, 1973; Yeats and Mathez, 1976), as intersti-tial grains in microcrystalline aggregates of plagioclase and olivine(Mathez and Yeats, 1976), and as spherical globules in the glass andphenocrysts (Mathez and Yeats, 1976; Czamanske and Moore, 1977)(Patten et al., 2012).
The presence of sulfide globules within an olivine crystal and as in-terstitial grains in aggregates of olivine (Fig. 2a) clearly indicates that
magmas were S-saturated before or concurrently with the crystalliza-tion of olivine during an early stage of magmatic evolution. Well-developed sulfide globules similar to those in Fig. 2b, c and f found inMORBs elsewhere were mostly interpreted to form prior to quenchingof the host magma (Mathez and Yeats, 1976; Patten et al., 2012).
However, it still remains unclear as towhether themagmawould beS-saturated during quenching. On the one hand, both falling tempera-ture and incipient crystallization of silicate phases would lead to sulfidesaturation, resulting in the formation of small (~10 μm), angular inter-stitial sulfide grains similar to those shown in Fig. 2e in themicrocrystal-line regions (Mathez, 1976). On the other hand, decompression wouldalso drive the magma away from sulfide saturation (e.g., Mavrogenesand O'Neill, 1999) as it is transported to lower pressures duringeruption. Such a process is recorded by embayed sulfides similar tothat in Fig. 2d, resulting from partial dissolution of the sulfide due tonegative pressure dependence of the solubility of sulfur in mafic melts(Wendlandt, 1982; Peach et al., 1990). Peach et al. (1990) reported ob-vious concentration gradients of Ni and S around one sulfide globule(higher around the sulfide and lower further away from the sulfide)which were taken to indicate that the globule was being dissolvedwhen the system was quenched. However, because the super-coolingofmagmas duringquenching could possibly prohibit effective equilibra-tion between the sulfides and hosting magmas, both sulfide dissolutionand sulfide saturationmay happen locally. Therefore, olivine crystalliza-tion during quenching (Fig. 2e)would cause S-saturation locally and re-sult in formation of angular sulfides controlled by the crystallizationtexture in the matrix near the olivine (Fig. 2e).
5.1.2. Compositions of immiscible sulfide liquidsSulfide droplets in fresh MORB glasses formed before eruption and
then quenched from ~1200 °C to deep ocean temperature in only afew minutes along with the silicate melt (Moore, 1975; Mathez, 1976;Mathez and Yeats, 1976; Czamanske and Moore, 1977; Peach et al.,1990; Patten et al., 2013). Thus, MORB glasses and their sulfide dropletspreserve liquidus relations and provide a unique opportunity to investi-gate sulfide melt–silicate melt equilibrium just before quenching. Plotsof Ni contents of sulfide globules and whole-rock samples indicatethat the partition coefficients of Ni between sulfide liquids and basalticmagmas are mostly between 300 and 1100 (Fig. 8), consistent withpublished partition coefficient data (DNi
sulf/melt: 257–1300, Gaetani andGrove, 1997; Jana and Walker, 1997; Peach and Mathez, 1993;Rajamani and Naldrett, 1978; Sattari et al., 2002). Therefore, the Ni con-tents of most sulfides are in or close to equilibrium with the magma.However, one sulfide globule (Fig. 2f) has a very low Ni content andplots below the line representing a partition coefficient of 100 (Fig. 8).The calculated partition coefficient is only 16 for this particular sulfide(droplet SW-11-1), suggesting high disequilibrium of the sulfide withthe magma. Because the composition of the sulfide globules representsthat of sulfide liquids immiscible in the magma, a possible explanationcould be that this sulfide formed very shortly before eruption andthen underwent immediate supercooling such that the sulfide did notequilibrate with the surrounding melt. However, this sulfide grain isthe largest in size among those found in this study (~80 μm). The sizeof a globule should reflect its residence time in the melt and the fre-quency with which it has contacted and consumed other globules(Ostwald's ripening) (Peach et al., 1990). This frequency is a direct con-sequence of the number of other globules present as well as the extentto which a globule moves around in a magma “collecting” smaller ones(Peach et al., 1990), suggesting that this sulfide should have been equil-ibratedwith a larger amount of themagma than others. However, it alsohas very low concentrations of other metal elements (~1 wt.%) exceptFe and shows disequilibriumwith themagma (Table 3). None of the sul-fide globules in MORBs reported so far have such special compositions.
Most sulfide grains have variable internal structures and consist ofdifferent proportions of Cu–Fe-rich ISS and Fe–Ni-rich MSS phases.The sulfide droplet textures in MORB glasses are representative of
10-1
10-2
100
c
a b
d
10-3
10-1
10-2
10-2 10-1 100 10
100
10-3
10-1
10-2
100
10-3
10
100
10-1
10-2
Pt (ppb)10-2 10-1 100 10
Pt (ppb)
Ir (
ppb)
Ru
(ppb
)Pd
(pp
b)
Rh
(ppb
)
Fig. 4. Plots of Pt with Ir, Ru, Rh, and Pd contents for MORBs from the SWIR. For symbols see Fig. 3.
6 A.Y. Yang et al. / Chemical Geology 382 (2014) 1–13
different stages of the early sulfide crystallization history at hightemperature: the fine- and coarse-grained droplets correspond to theprimitive sulfide liquid and the zoned sulfide droplets correspond tothe stage where MSS crystallized and co-existed with a residual sulfideliquid (the quenched ISS) (Patten et al., 2013). However, the Ni-poorsulfide grain is homogeneous in composition and lacks an internalstructure (Fig. 2f), and thus differs from other sulfide grains. The ab-sence of an internal structure could be due to the simple compositionof this sulfide grain, which only has minor amounts of elements otherthan Fe and S, preventing crystallization of Cu–Fe-rich and/or Fe–Ni-rich phases during cooling.
5.2. Chalcophile elemental compositions of the MORBs
Higher degrees of partial melting would produce magmas withhigher PGE contents due to the compatible nature of PGE if sulfides re-main in the source (e.g., Peach et al., 1990). Different source composi-tions would also produce magma with different PGE characteristics(Dale et al., 2008, 2012; Yang et al., 2011). Segregation of sulfideswould deplete magmas in all PGE due to very high partition coefficientsof PGE in sulfides (e.g., Campbell and Barnes, 1984; Peach et al., 1990).The efficiency of this process may vary with different segregationmodes, batch or fractional, and with different equilibration degree be-tween the sulfides and melt (Rehkämper et al., 1999; Bézos et al.,2005). Therefore, the large variations of PGE contents of MORBs fromthe eastern SWIR are likely controlled by both sulfur-saturated fraction-al crystallization during magma evolution and melt extraction in themantle.
5.2.1. Sulfur-saturated fractional crystallizationPositive correlations of MgO vs. Ni and Cr (Fig. 3) of the MORBs
indicate fractionation of olivine and chromite, respectively. The
presence of sulfide globules in MORBs suggests sulfur-saturatedmagmatic evolution.
Palladium, a strongly chalcophile element, partitions almost exclu-sively into sulfides (DPd
sulf/melt N 104, Fleet et al., 1999; Peach et al., 1990,1994), whereas Cu partitions into sulfides with much lower partitioncoefficients of ~1000 (Barnes and Lightfoot, 2005 and referencestherein) and Ni partitions into both olivine and sulfides (DNi
ol/melt:1.35–13.6, DNi
sulf/melt: 257–1300, Barnes and Lightfoot, 2005 and refer-ences therein). All samples from the SWIR (Fig. 7) show PGE depletionsrelative to Ni and Cu, consistent with S-saturation of magmas beforeeruption with sulfides segregated during fractional crystallization.Therefore, segregation of immiscible sulfide liquids combinedwith oliv-ine fractionation during magmatic evolution can account for the posi-tive PGE vs. Ni correlations of MORBs from Zone C (Fig. 6). MORBsfrom the SWIR have Cu/Pd ratios ranging from 55,000 to 1,785,000,much larger than the mantle value (~7000, Barnes and Maier, 1999),consistent with S-saturated magmatic evolution.
5.2.2. Quantitative modeling of sulfide segregated fromMORBs of the SWIRThe amount of segregated sulfides exercises an important control on
the PGE compositions of magmas and can bemodeled by using a meth-od modified from Bézos et al. (2005). The major element trends ofHD-MORBs and N-MORBs can be interpreted as liquid lines of descent(LLD) by using the program MELTS (Ghiorso and Sack, 1995). Eventhough each magmatic suite probably involved more than one parentalmagma, the calculated LLD roughly fit the data (Fig. A3). The mass andmineralogy of the fractionating mineral assemblages calculated byMELTS are summarized in Table 4. The calculations assume that differ-entiation begins with liquid compositions that approximate the high-MgO ends of the sample suites and evolves to compositions thatapproximate the low-MgO ends of the trends. The calculated LLDs are
SWIR MORB
global MORB
0
10
20
30
40
50
60
70
0
2
4
6
5 7 9 11MgO (wt%)
Pt/R
uPt
/Pd
a
b
Fig. 5. Plots of MgO contents with Pt/Ru and Pt/Pd ratios for MORBs from the SWIR andglobal MORB data in literature. Crosses represent global MORB data from Bézos et al.(2005); Rehkämper et al. (1999) and Tatsumi et al. (1999), and gray squares representpublished data for MORBs from the SWIR from Bézos et al. (2005). It is clearly shownthat MORBs from the SWIR have generally lower Pt/Ru and Pt/Pd ratios than MORBsfrom other ridges. For symbols see Fig. 3.
7A.Y. Yang et al. / Chemical Geology 382 (2014) 1–13
similar for both suites with fractionation of olivine and minor spinel(Table 4).
Different modes of sulfide segregation would have different effectson the PGE systematics of basaltic magmas. Similar to fractionation ofsilicate minerals, segregation of sulfides is governed by either fractionalor batch fractionation. A parameter Sb was proposed as the massfraction of sulfide that displays batch partitioning compared to fraction-al partitioning. Another parameter Reff was proposed as the mass frac-tion of the silicate liquid with which the sulfides equilibrate duringdifferentiation. The calculated amounts of segregated sulfides (Xsulf)would largely be dependent on the two modeling parameters used(Rehkämper et al., 1999; Bézos et al., 2005).
Under pure fractional segregation of sulfide liquids from themagma(Sb = 0), the partition of Pd between sulfide and silicate liquids followsthe Rayleigh fractionation law:
Cm ¼ C0 � f D−1ð Þ ð1Þ
where C0 and Cm are Pd contents of the primitive and evolved samples,respectively, f the melt fraction, and D the bulk partition coefficientfor Pd.
Thus, bulk DPd can be calculated by using the following equationrearranged from Eq. (1) (Table 5):
DPd ¼ 1þ log Cm=C0ð Þ= log fð Þ ð2Þ
The melt fraction f can be expressed as 1 − (Xsil + Xsulf), where Xsil
and Xsulf are themass fraction of silicateminerals and sulfide liquids frac-tionated during magma evolution, respectively. Because Xsulf is verysmall compared to Xsil (Czamanske and Moore, 1977; Roy-Barmanet al., 1998), f equals 1− Xsil in the calculation.
The mass fraction of sulfide segregated during differentiation couldthen be calculated from the bulk Pd partition coefficient and the Pd con-centrations in the primitive and evolved magmas. Bézos et al. (2005)use the following equation to calculate Xsulf written as
DPd ¼ Xsil � Dsil=meltPd þ Xsulf � Dsulf=melt
Pd ð3Þ
However, the calculation of bulk D should follow the equationbelow:
D ¼ ΣmφDφ=melt ð4Þ
where m is the fraction of phase φ in the crystallizing mass. Therefore,Eq. (3) should be changed to
DPd ¼ Xsil= Xsil þ Xsulfð Þð Þ � Dsil=meltPd þ Xsulf= Xsil þ Xsulfð Þð Þ � Dsulf=melt
Pd ð5Þ
By assuming that DPdsil/melt ≈ 0 and Xsulf ≪ Xsil, Eq. (5) can be
rearranged to
Xsulf ¼ Xsil � DPd=Dsulf=meltPd ð6Þ
The Xsulf can then be calculated by using DPdsulf/melt = 3.5 × 10⁴ from
Peach et al. (1990).Assuming complete equilibration between sulfide and silicate melts
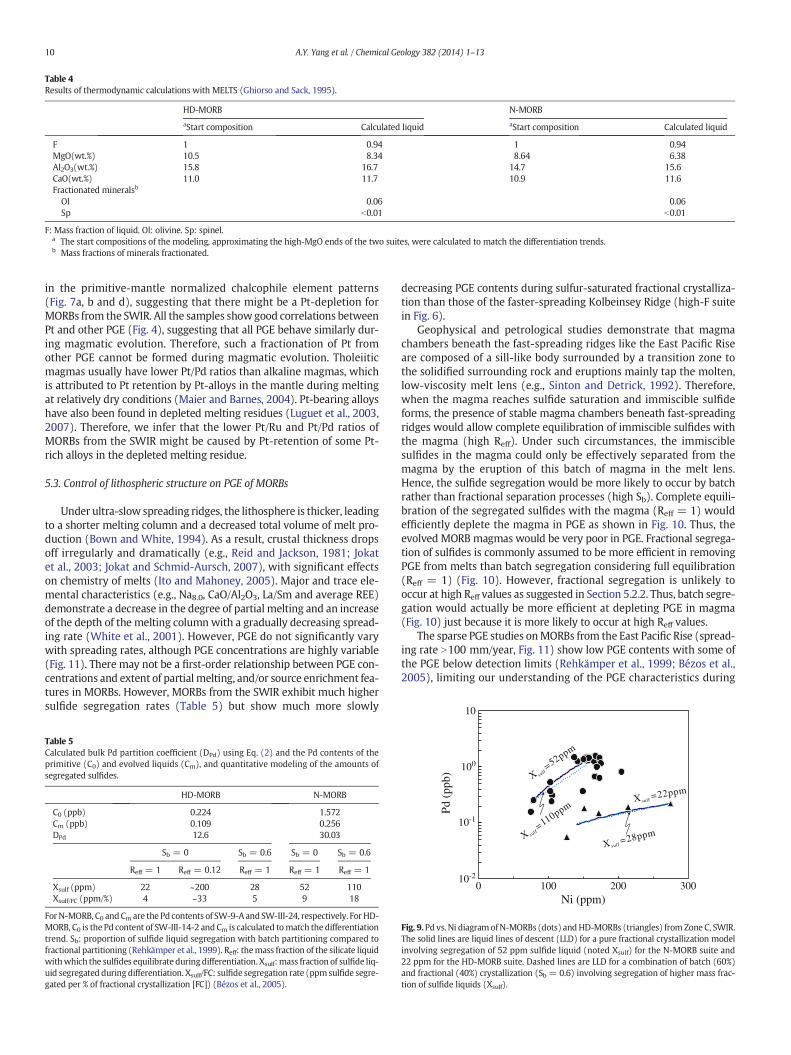
(Reff = 1), the theoretical LLDs of Pd–Ni correlations (Fig. 9) and theamounts of segregated sulfideswere calculated by using the parameterslisted in Tables 4 and 5. In both cases the results agree well with theobserved trends and indicate that HD-MORBs andN-MORBshave segre-gated 22 ppm and 52 ppm of sulfide liquids, respectively (Fig. 9). Thesesulfide mass fractions (Xsulf) correspond to sulfide segregation rates(expressed in ppm of sulfide segregated per % of fractional crystalliza-tion [FC], Bézos et al., 2005) of 4 and 9 ppm/%FC for HD-MORBs andN-MORBs from the SWIR, respectively, which are much higherthan that of MORB from the slow-spreading Kolbeinsey Ridge(~1 ppm/%FC; Rehkämper et al., 1999, recalculated using this method).
Alternatively, by assuming Sb of 0.6 as proposed for MORB magmasby Rehkämper et al. (1999) and Bézos et al. (2005), the Xsulf increasesup to 28 ppm and 110 ppm for HD-MORBs and N-MORBs, respectively.This model also matches the Pd–Ni LLD of the two suites (Fig. 9).
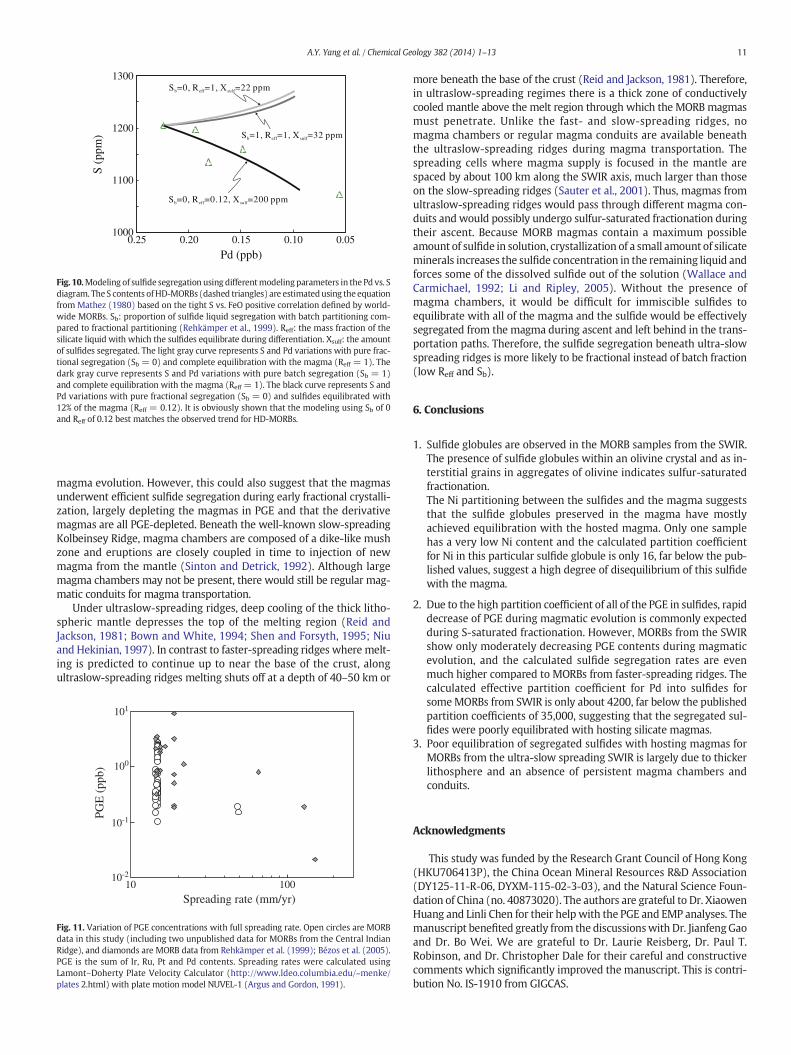
Both models are based on complete equilibration between sulfidesand silicate melts (Reff = 1). Another calculation method is used totest the equilibration between the segregated sulfides and themagmas.The trends in the plots of S vs. MgO of magmatic suites can provide ad-ditional constraints on the determination of Xsulf (Bézos et al., 2005).Sulfur concentrations of MORBs can be roughly estimated from theiriron contents using the tight S vs. FeO positive correlation defined byworldwide MORBs (Mathez, 1976, 1980). Using the equation fromMathez (1980), the most primitive and evolved samples of HD-MORBswith FeOT contents of 10.0 and 9.30 wt.% are calculated to have ~1200and ~1070 ppm sulfur, respectively. Thus, Xsulf could be calculated withthe melt fraction f with the following equation: Xsulf = C0/f − Cm,where C0 is the sulfide content of the primitive sample (1200 ppm)and Cm is the sulfide content of the evolved sample (1070 ppm), whichgives the amount of segregated sulfides of about 200 ppm for HD-MORBs. Although such an estimation is not very accurate, the calculatedXsulf of 200 ppm is almost ten times higher than that estimated with Nivs. Pd correlations with a Reff of 1 (Xsulf = 22 ppmwith Sb= 0). Howev-er, such a large amount of segregated sulfides cannot be reconciled withhigher Sb because the Xsulf would not be larger than 32 ppm even with aSb of 1. There is no agreement until the Reff is lowered down to 0.12 withSb of 0 or 0.14 with Sb of 0.6, respectively.
The S and Pd variations during sulfide segregation of HD-MORBs arecalculated for differentmodels with varied Sb and Reff as listed in Table 5(Fig. 10). The two models with high Reff plot clearly far above the
Zone C N-MORB Zone C HD-MORB
Ni Ir Ru Rh Pt Pd Cu
Zone A N-MORB
10
Sam
ple/
prim
itive
man
tle
Ni Ir Ru Rh Pt Pd Cu
c
a b
d
Zone B N-MORB100
10-1
10-2
10-3
10-4
100
10-1
10-2
10-3
10-4
Fig. 7. Primitive mantle-normalized chalcophile element patterns for MORBs from the SWIR. Primitive mantle values are from Taylor and McLennan (1985). The shaded areas show therange of PGE in MORBs based on data from Bézos et al. (2005), Rehkämper et al. (1999) and Tatsumi et al. (1999).
Ir (
ppb)
Ru
(ppb
)
Pt (
ppb)
Pd (
ppb)
0 100 300Ni (ppm)
100
10
200
high-F MORB
low-F MORB
c
a b
d
10-1
10-2
10-3
100
10-1
10-2
100
10
10-1
10-2
10-3
100
10-1
10-2
0 100 300Ni (ppm)
200
Fig. 6. PGE vs. Ni plots of MORBs from the SWIR. The high-F (mostly MORBs from Kolbeinsey Ridge) and low-F fields represent MORB suites produced by high and low degrees of partialmelting defined by Bézos et al. (2005). For symbols see Fig. 3.
8 A.Y. Yang et al. / Chemical Geology 382 (2014) 1–13
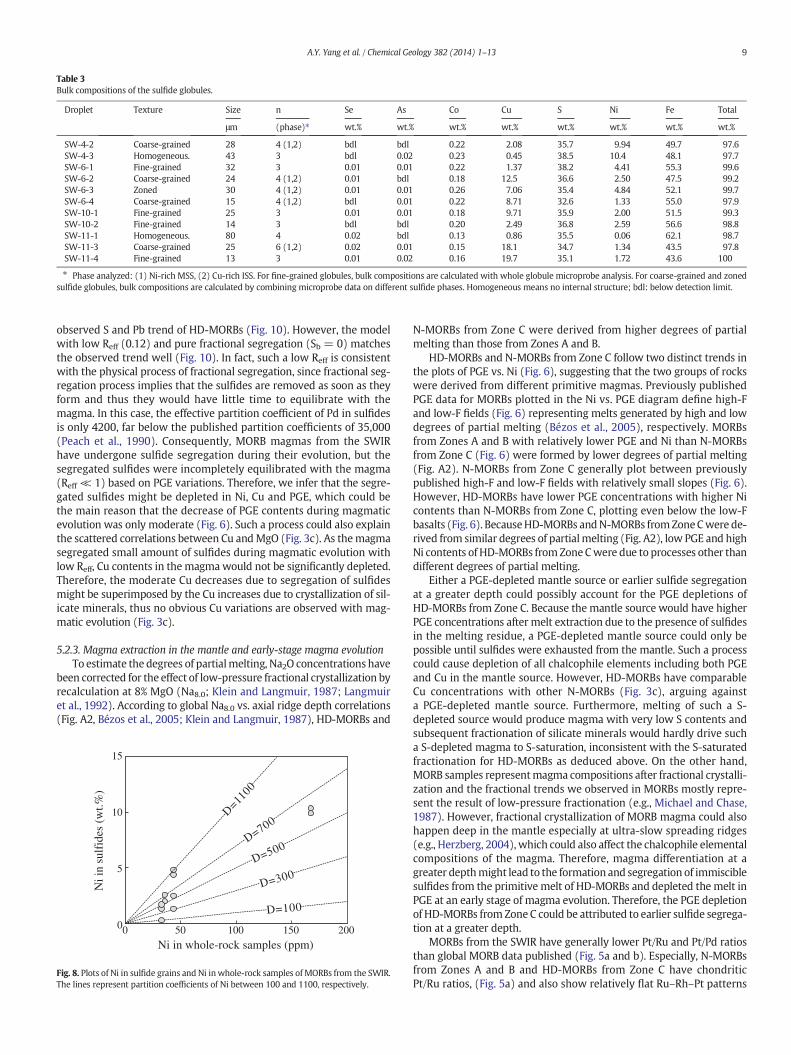
Table 3Bulk compositions of the sulfide globules.
Droplet Texture Size n Se As Co Cu S Ni Fe Total
μm (phase)⁎ wt.% wt.% wt.% wt.% wt.% wt.% wt.% wt.%
SW-4-2 Coarse-grained 28 4 (1,2) bdl bdl 0.22 2.08 35.7 9.94 49.7 97.6SW-4-3 Homogeneous. 43 3 bdl 0.02 0.23 0.45 38.5 10.4 48.1 97.7SW-6-1 Fine-grained 32 3 0.01 0.01 0.22 1.37 38.2 4.41 55.3 99.6SW-6-2 Coarse-grained 24 4 (1,2) 0.01 bdl 0.18 12.5 36.6 2.50 47.5 99.2SW-6-3 Zoned 30 4 (1,2) 0.01 0.01 0.26 7.06 35.4 4.84 52.1 99.7SW-6-4 Coarse-grained 15 4 (1,2) bdl 0.01 0.22 8.71 32.6 1.33 55.0 97.9SW-10-1 Fine-grained 25 3 0.01 0.01 0.18 9.71 35.9 2.00 51.5 99.3SW-10-2 Fine-grained 14 3 bdl bdl 0.20 2.49 36.8 2.59 56.6 98.8SW-11-1 Homogeneous. 80 4 0.02 bdl 0.13 0.86 35.5 0.06 62.1 98.7SW-11-3 Coarse-grained 25 6 (1,2) 0.02 0.01 0.15 18.1 34.7 1.34 43.5 97.8SW-11-4 Fine-grained 13 3 0.01 0.02 0.16 19.7 35.1 1.72 43.6 100
⁎ Phase analyzed: (1) Ni-rich MSS, (2) Cu-rich ISS. For fine-grained globules, bulk compositions are calculated with whole globule microprobe analysis. For coarse-grained and zonedsulfide globules, bulk compositions are calculated by combining microprobe data on different sulfide phases. Homogeneous means no internal structure; bdl: below detection limit.
9A.Y. Yang et al. / Chemical Geology 382 (2014) 1–13
observed S and Pb trend of HD-MORBs (Fig. 10). However, the modelwith low Reff (0.12) and pure fractional segregation (Sb = 0) matchesthe observed trend well (Fig. 10). In fact, such a low Reff is consistentwith the physical process of fractional segregation, since fractional seg-regation process implies that the sulfides are removed as soon as theyform and thus they would have little time to equilibrate with themagma. In this case, the effective partition coefficient of Pd in sulfidesis only 4200, far below the published partition coefficients of 35,000(Peach et al., 1990). Consequently, MORB magmas from the SWIRhave undergone sulfide segregation during their evolution, but thesegregated sulfides were incompletely equilibrated with the magma(Reff ≪ 1) based on PGE variations. Therefore, we infer that the segre-gated sulfides might be depleted in Ni, Cu and PGE, which could bethe main reason that the decrease of PGE contents during magmaticevolution was only moderate (Fig. 6). Such a process could also explainthe scattered correlations between Cu andMgO (Fig. 3c). As themagmasegregated small amount of sulfides during magmatic evolution withlow Reff, Cu contents in themagmawould not be significantly depleted.Therefore, the moderate Cu decreases due to segregation of sulfidesmight be superimposed by the Cu increases due to crystallization of sil-icate minerals, thus no obvious Cu variations are observed with mag-matic evolution (Fig. 3c).
5.2.3. Magma extraction in the mantle and early-stage magma evolutionTo estimate the degrees of partialmelting, Na2O concentrations have
been corrected for the effect of low-pressure fractional crystallization byrecalculation at 8% MgO (Na8.0; Klein and Langmuir, 1987; Langmuiret al., 1992). According to global Na8.0 vs. axial ridge depth correlations(Fig. A2, Bézos et al., 2005; Klein and Langmuir, 1987), HD-MORBs and
0
5
10
15
0 50 100 150 200
Ni in whole-rock samples (ppm)
D=500
D=300
D=100
D=700
Ni i
n su
lfid
es (
wt.%
)
D=1100
Fig. 8. Plots of Ni in sulfide grains and Ni inwhole-rock samples of MORBs from the SWIR.The lines represent partition coefficients of Ni between 100 and 1100, respectively.
N-MORBs from Zone C were derived from higher degrees of partialmelting than those from Zones A and B.
HD-MORBs and N-MORBs from Zone C follow two distinct trends inthe plots of PGE vs. Ni (Fig. 6), suggesting that the two groups of rockswere derived from different primitive magmas. Previously publishedPGE data for MORBs plotted in the Ni vs. PGE diagram define high-Fand low-F fields (Fig. 6) representing melts generated by high and lowdegrees of partial melting (Bézos et al., 2005), respectively. MORBsfrom Zones A and B with relatively lower PGE and Ni than N-MORBsfrom Zone C (Fig. 6) were formed by lower degrees of partial melting(Fig. A2). N-MORBs from Zone C generally plot between previouslypublished high-F and low-F fields with relatively small slopes (Fig. 6).However, HD-MORBs have lower PGE concentrations with higher Nicontents than N-MORBs from Zone C, plotting even below the low-Fbasalts (Fig. 6). BecauseHD-MORBs andN-MORBs fromZoneCwere de-rived from similar degrees of partialmelting (Fig. A2), low PGE and highNi contents of HD-MORBs fromZoneCwere due to processes other thandifferent degrees of partial melting.
Either a PGE-depleted mantle source or earlier sulfide segregationat a greater depth could possibly account for the PGE depletions ofHD-MORBs from Zone C. Because the mantle source would have higherPGE concentrations after melt extraction due to the presence of sulfidesin the melting residue, a PGE-depleted mantle source could only bepossible until sulfides were exhausted from the mantle. Such a processcould cause depletion of all chalcophile elements including both PGEand Cu in the mantle source. However, HD-MORBs have comparableCu concentrations with other N-MORBs (Fig. 3c), arguing againsta PGE-depleted mantle source. Furthermore, melting of such a S-depleted source would produce magma with very low S contents andsubsequent fractionation of silicate minerals would hardly drive sucha S-depleted magma to S-saturation, inconsistent with the S-saturatedfractionation for HD-MORBs as deduced above. On the other hand,MORB samples representmagma compositions after fractional crystalli-zation and the fractional trends we observed in MORBs mostly repre-sent the result of low-pressure fractionation (e.g., Michael and Chase,1987). However, fractional crystallization of MORB magma could alsohappen deep in the mantle especially at ultra-slow spreading ridges(e.g., Herzberg, 2004), which could also affect the chalcophile elementalcompositions of the magma. Therefore, magma differentiation at agreater depthmight lead to the formation and segregation of immisciblesulfides from the primitive melt of HD-MORBs and depleted the melt inPGE at an early stage of magma evolution. Therefore, the PGE depletionof HD-MORBs from Zone C could be attributed to earlier sulfide segrega-tion at a greater depth.
MORBs from the SWIR have generally lower Pt/Ru and Pt/Pd ratiosthan global MORB data published (Fig. 5a and b). Especially, N-MORBsfrom Zones A and B and HD-MORBs from Zone C have chondriticPt/Ru ratios, (Fig. 5a) and also show relatively flat Ru–Rh–Pt patterns
10
Table 4Results of thermodynamic calculations with MELTS (Ghiorso and Sack, 1995).
HD-MORB N-MORB
aStart composition Calculated liquid aStart composition Calculated liquid
F 1 0.94 1 0.94MgO(wt.%) 10.5 8.34 8.64 6.38Al2O3(wt.%) 15.8 16.7 14.7 15.6CaO(wt.%) 11.0 11.7 10.9 11.6Fractionated mineralsb
Ol 0.06 0.06Sp b0.01 b0.01
F: Mass fraction of liquid. Ol: olivine. Sp: spinel.a The start compositions of the modeling, approximating the high-MgO ends of the two suites, were calculated to match the differentiation trends.b Mass fractions of minerals fractionated.
10 A.Y. Yang et al. / Chemical Geology 382 (2014) 1–13
in the primitive-mantle normalized chalcophile element patterns(Fig. 7a, b and d), suggesting that there might be a Pt-depletion forMORBs from the SWIR. All the samples showgood correlations betweenPt and other PGE (Fig. 4), suggesting that all PGE behave similarly dur-ing magmatic evolution. Therefore, such a fractionation of Pt fromother PGE cannot be formed during magmatic evolution. Tholeiiticmagmas usually have lower Pt/Pd ratios than alkaline magmas, whichis attributed to Pt retention by Pt-alloys in the mantle during meltingat relatively dry conditions (Maier and Barnes, 2004). Pt-bearing alloyshave also been found in depleted melting residues (Luguet et al., 2003,2007). Therefore, we infer that the lower Pt/Ru and Pt/Pd ratios ofMORBs from the SWIR might be caused by Pt-retention of some Pt-rich alloys in the depleted melting residue.
5.3. Control of lithospheric structure on PGE of MORBs
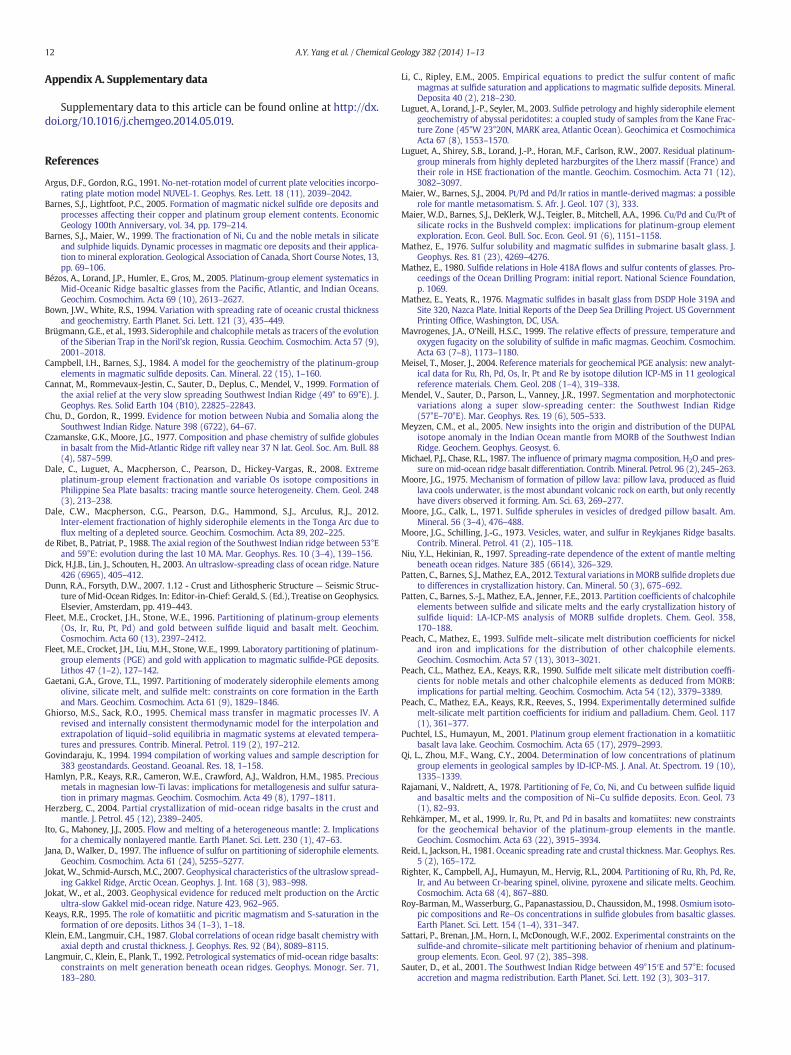
Under ultra-slow spreading ridges, the lithosphere is thicker, leadingto a shorter melting column and a decreased total volume of melt pro-duction (Bown and White, 1994). As a result, crustal thickness dropsoff irregularly and dramatically (e.g., Reid and Jackson, 1981; Jokatet al., 2003; Jokat and Schmid-Aursch, 2007), with significant effectson chemistry of melts (Ito and Mahoney, 2005). Major and trace ele-mental characteristics (e.g., Na8.0, CaO/Al2O3, La/Sm and average REE)demonstrate a decrease in the degree of partial melting and an increaseof the depth of the melting column with a gradually decreasing spread-ing rate (White et al., 2001). However, PGE do not significantly varywith spreading rates, although PGE concentrations are highly variable(Fig. 11). There may not be a first-order relationship between PGE con-centrations and extent of partial melting, and/or source enrichment fea-tures in MORBs. However, MORBs from the SWIR exhibit much highersulfide segregation rates (Table 5) but show much more slowly
Table 5Calculated bulk Pd partition coefficient (DPd) using Eq. (2) and the Pd contents of theprimitive (C0) and evolved liquids (Cm), and quantitative modeling of the amounts ofsegregated sulfides.
HD-MORB N-MORB
C0 (ppb) 0.224 1.572Cm (ppb) 0.109 0.256DPd 12.6 30.03
Sb = 0 Sb = 0.6 Sb = 0 Sb = 0.6
Reff = 1 Reff = 0.12 Reff = 1 Reff = 1 Reff = 1
Xsulf (ppm) 22 ~200 28 52 110Xsulf/FC (ppm/%) 4 ~33 5 9 18
ForN-MORB, C0 andCm are the Pd contents of SW-9-A andSW-III-24, respectively. For HD-MORB, C0 is the Pd content of SW-III-14-2 and Cm is calculated tomatch the differentiationtrend. Sb: proportion of sulfide liquid segregation with batch partitioning compared tofractional partitioning (Rehkämper et al., 1999). Reff: themass fraction of the silicate liquidwithwhich the sulfides equilibrate during differentiation. Xsulf:mass fraction of sulfide liq-uid segregated during differentiation. Xsulf/FC: sulfide segregation rate (ppmsulfide segre-gated per % of fractional crystallization [FC]) (Bézos et al., 2005).
decreasing PGE contents during sulfur-saturated fractional crystalliza-tion than those of the faster-spreading Kolbeinsey Ridge (high-F suitein Fig. 6).
Geophysical and petrological studies demonstrate that magmachambers beneath the fast-spreading ridges like the East Pacific Riseare composed of a sill-like body surrounded by a transition zone tothe solidified surrounding rock and eruptions mainly tap the molten,low-viscosity melt lens (e.g., Sinton and Detrick, 1992). Therefore,when the magma reaches sulfide saturation and immiscible sulfideforms, the presence of stable magma chambers beneath fast-spreadingridges would allow complete equilibration of immiscible sulfides withthe magma (high Reff). Under such circumstances, the immisciblesulfides in the magma could only be effectively separated from themagma by the eruption of this batch of magma in the melt lens.Hence, the sulfide segregation would be more likely to occur by batchrather than fractional separation processes (high Sb). Complete equili-bration of the segregated sulfides with the magma (Reff = 1) wouldefficiently deplete the magma in PGE as shown in Fig. 10. Thus, theevolved MORB magmas would be very poor in PGE. Fractional segrega-tion of sulfides is commonly assumed to be more efficient in removingPGE from melts than batch segregation considering full equilibration(Reff = 1) (Fig. 10). However, fractional segregation is unlikely tooccur at high Reff values as suggested in Section 5.2.2. Thus, batch segre-gation would actually be more efficient at depleting PGE in magma(Fig. 10) just because it is more likely to occur at high Reff values.
The sparse PGE studies onMORBs from the East Pacific Rise (spread-ing rate N100 mm/year, Fig. 11) show low PGE contents with some ofthe PGE below detection limits (Rehkämper et al., 1999; Bézos et al.,2005), limiting our understanding of the PGE characteristics during
Ni (ppm)
Pd (
ppb)
0 100 300200
X sulf
52ppm
X sulf28ppm
Xsulf22ppm
X sulf
110ppm
100
10-1
10-2
Fig. 9.Pd vs. Ni diagramofN-MORBs (dots) andHD-MORBs (triangles) fromZone C, SWIR.The solid lines are liquid lines of descent (LLD) for a pure fractional crystallization modelinvolving segregation of 52 ppm sulfide liquid (noted Xsulf) for the N-MORB suite and22 ppm for the HD-MORB suite. Dashed lines are LLD for a combination of batch (60%)and fractional (40%) crystallization (Sb = 0.6) involving segregation of higher mass frac-tion of sulfide liquids (Xsulf).
0.050.100.150.200.251000
1100
1200
1300
S Rb eff sulf=1, =1, X =32 ppm
S Rb eff sulf=0, =1, X =22 ppm
S Rb eff sulf=0, , X =200 ppm=0.12
Pd (ppb)
S (p
pm)
Fig. 10.Modeling of sulfide segregation using differentmodelingparameters in the Pd vs. Sdiagram. The S contents ofHD-MORBs (dashed triangles) are estimatedusing the equationfrom Mathez (1980) based on the tight S vs. FeO positive correlation defined by world-wide MORBs. Sb: proportion of sulfide liquid segregation with batch partitioning com-pared to fractional partitioning (Rehkämper et al., 1999). Reff: the mass fraction of thesilicate liquid with which the sulfides equilibrate during differentiation. Xsulf: the amountof sulfides segregated. The light gray curve represents S and Pd variations with pure frac-tional segregation (Sb = 0) and complete equilibration with the magma (Reff = 1). Thedark gray curve represents S and Pd variations with pure batch segregation (Sb = 1)and complete equilibration with the magma (Reff = 1). The black curve represents S andPd variations with pure fractional segregation (Sb = 0) and sulfides equilibrated with12% of the magma (Reff = 0.12). It is obviously shown that the modeling using Sb of 0and Reff of 0.12 best matches the observed trend for HD-MORBs.
11A.Y. Yang et al. / Chemical Geology 382 (2014) 1–13
magma evolution. However, this could also suggest that the magmasunderwent efficient sulfide segregation during early fractional crystalli-zation, largely depleting the magmas in PGE and that the derivativemagmas are all PGE-depleted. Beneath the well-known slow-spreadingKolbeinsey Ridge, magma chambers are composed of a dike-like mushzone and eruptions are closely coupled in time to injection of newmagma from the mantle (Sinton and Detrick, 1992). Although largemagma chambers may not be present, there would still be regular mag-matic conduits for magma transportation.
Under ultraslow-spreading ridges, deep cooling of the thick litho-spheric mantle depresses the top of the melting region (Reid andJackson, 1981; Bown and White, 1994; Shen and Forsyth, 1995; Niuand Hekinian, 1997). In contrast to faster-spreading ridges where melt-ing is predicted to continue up to near the base of the crust, alongultraslow-spreading ridges melting shuts off at a depth of 40–50 km or
10 100
PGE
(pp
b)
101
100
10-1
Spreading rate (mm/yr)
10-2
Fig. 11. Variation of PGE concentrations with full spreading rate. Open circles are MORBdata in this study (including two unpublished data for MORBs from the Central IndianRidge), and diamonds are MORB data from Rehkämper et al. (1999); Bézos et al. (2005).PGE is the sum of Ir, Ru, Pt and Pd contents. Spreading rates were calculated usingLamont–Doherty Plate Velocity Calculator (http://www.ldeo.columbia.edu/~menke/plates 2.html) with plate motion model NUVEL-1 (Argus and Gordon, 1991).
more beneath the base of the crust (Reid and Jackson, 1981). Therefore,in ultraslow-spreading regimes there is a thick zone of conductivelycooled mantle above the melt region through which the MORB magmasmust penetrate. Unlike the fast- and slow-spreading ridges, nomagma chambers or regular magma conduits are available beneaththe ultraslow-spreading ridges during magma transportation. Thespreading cells where magma supply is focused in the mantle arespaced by about 100 km along the SWIR axis, much larger than thoseon the slow-spreading ridges (Sauter et al., 2001). Thus, magmas fromultraslow-spreading ridges would pass through different magma con-duits and would possibly undergo sulfur-saturated fractionation duringtheir ascent. Because MORB magmas contain a maximum possibleamount of sulfide in solution, crystallization of a small amount of silicateminerals increases the sulfide concentration in the remaining liquid andforces some of the dissolved sulfide out of the solution (Wallace andCarmichael, 1992; Li and Ripley, 2005). Without the presence ofmagma chambers, it would be difficult for immiscible sulfides toequilibrate with all of the magma and the sulfide would be effectivelysegregated from the magma during ascent and left behind in the trans-portation paths. Therefore, the sulfide segregation beneath ultra-slowspreading ridges is more likely to be fractional instead of batch fraction(low Reff and Sb).
6. Conclusions
1. Sulfide globules are observed in the MORB samples from the SWIR.The presence of sulfide globules within an olivine crystal and as in-terstitial grains in aggregates of olivine indicates sulfur-saturatedfractionation.The Ni partitioning between the sulfides and the magma suggeststhat the sulfide globules preserved in the magma have mostlyachieved equilibration with the hosted magma. Only one samplehas a very low Ni content and the calculated partition coefficientfor Ni in this particular sulfide globule is only 16, far below the pub-lished values, suggest a high degree of disequilibrium of this sulfidewith the magma.
2. Due to the high partition coefficient of all of the PGE in sulfides, rapiddecrease of PGE during magmatic evolution is commonly expectedduring S-saturated fractionation. However, MORBs from the SWIRshow only moderately decreasing PGE contents during magmaticevolution, and the calculated sulfide segregation rates are evenmuch higher compared to MORBs from faster-spreading ridges. Thecalculated effective partition coefficient for Pd into sulfides forsomeMORBs from SWIR is only about 4200, far below the publishedpartition coefficients of 35,000, suggesting that the segregated sul-fides were poorly equilibrated with hosting silicate magmas.
3. Poor equilibration of segregated sulfides with hosting magmas forMORBs from the ultra-slow spreading SWIR is largely due to thickerlithosphere and an absence of persistent magma chambers andconduits.
Acknowledgments
This study was funded by the Research Grant Council of Hong Kong(HKU706413P), the China Ocean Mineral Resources R&D Association(DY125-11-R-06, DYXM-115-02-3-03), and the Natural Science Foun-dation of China (no. 40873020). The authors are grateful to Dr. XiaowenHuang and Linli Chen for their help with the PGE and EMP analyses. Themanuscript benefited greatly from the discussionswith Dr. JianfengGaoand Dr. Bo Wei. We are grateful to Dr. Laurie Reisberg, Dr. Paul T.Robinson, and Dr. Christopher Dale for their careful and constructivecomments which significantly improved the manuscript. This is contri-bution No. IS-1910 from GIGCAS.
12 A.Y. Yang et al. / Chemical Geology 382 (2014) 1–13
Appendix A. Supplementary data
Supplementary data to this article can be found online at http://dx.doi.org/10.1016/j.chemgeo.2014.05.019.
References
Argus, D.F., Gordon, R.G., 1991. No‐net‐rotation model of current plate velocities incorpo-rating plate motion model NUVEL‐1. Geophys. Res. Lett. 18 (11), 2039–2042.
Barnes, S.J., Lightfoot, P.C., 2005. Formation of magmatic nickel sulfide ore deposits andprocesses affecting their copper and platinum group element contents. EconomicGeology 100th Anniversary, vol. 34, pp. 179–214.
Barnes, S.J., Maier, W., 1999. The fractionation of Ni, Cu and the noble metals in silicateand sulphide liquids. Dynamic processes in magmatic ore deposits and their applica-tion to mineral exploration. Geological Association of Canada, Short Course Notes, 13,pp. 69–106.
Bézos, A., Lorand, J.P., Humler, E., Gros, M., 2005. Platinum-group element systematics inMid-Oceanic Ridge basaltic glasses from the Pacific, Atlantic, and Indian Oceans.Geochim. Cosmochim. Acta 69 (10), 2613–2627.
Bown, J.W., White, R.S., 1994. Variation with spreading rate of oceanic crustal thicknessand geochemistry. Earth Planet. Sci. Lett. 121 (3), 435–449.
Brügmann, G.E., et al., 1993. Siderophile and chalcophile metals as tracers of the evolutionof the Siberian Trap in the Noril'sk region, Russia. Geochim. Cosmochim. Acta 57 (9),2001–2018.
Campbell, I.H., Barnes, S.J., 1984. A model for the geochemistry of the platinum-groupelements in magmatic sulfide deposits. Can. Mineral. 22 (15), 1–160.
Cannat, M., Rommevaux-Jestin, C., Sauter, D., Deplus, C., Mendel, V., 1999. Formation ofthe axial relief at the very slow spreading Southwest Indian Ridge (49° to 69°E). J.Geophys. Res. Solid Earth 104 (B10), 22825–22843.
Chu, D., Gordon, R., 1999. Evidence for motion between Nubia and Somalia along theSouthwest Indian Ridge. Nature 398 (6722), 64–67.
Czamanske, G.K., Moore, J.G., 1977. Composition and phase chemistry of sulfide globulesin basalt from the Mid-Atlantic Ridge rift valley near 37 N lat. Geol. Soc. Am. Bull. 88(4), 587–599.
Dale, C., Luguet, A., Macpherson, C., Pearson, D., Hickey-Vargas, R., 2008. Extremeplatinum-group element fractionation and variable Os isotope compositions inPhilippine Sea Plate basalts: tracing mantle source heterogeneity. Chem. Geol. 248(3), 213–238.
Dale, C.W., Macpherson, C.G., Pearson, D.G., Hammond, S.J., Arculus, R.J., 2012.Inter-element fractionation of highly siderophile elements in the Tonga Arc due toflux melting of a depleted source. Geochim. Cosmochim. Acta 89, 202–225.
de Ribet, B., Patriat, P., 1988. The axial region of the Southwest Indian ridge between 53°Eand 59°E: evolution during the last 10 MA. Mar. Geophys. Res. 10 (3–4), 139–156.
Dick, H.J.B., Lin, J., Schouten, H., 2003. An ultraslow-spreading class of ocean ridge. Nature426 (6965), 405–412.
Dunn, R.A., Forsyth, D.W., 2007. 1.12 - Crust and Lithospheric Structure — Seismic Struc-ture ofMid-Ocean Ridges. In: Editor-in-Chief: Gerald, S. (Ed.), Treatise on Geophysics.Elsevier, Amsterdam, pp. 419–443.
Fleet, M.E., Crocket, J.H., Stone, W.E., 1996. Partitioning of platinum-group elements(Os, Ir, Ru, Pt, Pd) and gold between sulfide liquid and basalt melt. Geochim.Cosmochim. Acta 60 (13), 2397–2412.
Fleet, M.E., Crocket, J.H., Liu, M.H., Stone, W.E., 1999. Laboratory partitioning of platinum-group elements (PGE) and gold with application to magmatic sulfide-PGE deposits.Lithos 47 (1–2), 127–142.
Gaetani, G.A., Grove, T.L., 1997. Partitioning of moderately siderophile elements amongolivine, silicate melt, and sulfide melt: constraints on core formation in the Earthand Mars. Geochim. Cosmochim. Acta 61 (9), 1829–1846.
Ghiorso, M.S., Sack, R.O., 1995. Chemical mass transfer in magmatic processes IV. Arevised and internally consistent thermodynamic model for the interpolation andextrapolation of liquid–solid equilibria in magmatic systems at elevated tempera-tures and pressures. Contrib. Mineral. Petrol. 119 (2), 197–212.
Govindaraju, K., 1994. 1994 compilation of working values and sample description for383 geostandards. Geostand. Geoanal. Res. 18, 1–158.
Hamlyn, P.R., Keays, R.R., Cameron, W.E., Crawford, A.J., Waldron, H.M., 1985. Preciousmetals in magnesian low-Ti lavas: implications for metallogenesis and sulfur satura-tion in primary magmas. Geochim. Cosmochim. Acta 49 (8), 1797–1811.
Herzberg, C., 2004. Partial crystallization of mid-ocean ridge basalts in the crust andmantle. J. Petrol. 45 (12), 2389–2405.
Ito, G., Mahoney, J.J., 2005. Flow and melting of a heterogeneous mantle: 2. Implicationsfor a chemically nonlayered mantle. Earth Planet. Sci. Lett. 230 (1), 47–63.
Jana, D., Walker, D., 1997. The influence of sulfur on partitioning of siderophile elements.Geochim. Cosmochim. Acta 61 (24), 5255–5277.
Jokat, W., Schmid-Aursch, M.C., 2007. Geophysical characteristics of the ultraslow spread-ing Gakkel Ridge, Arctic Ocean. Geophys. J. Int. 168 (3), 983–998.
Jokat, W., et al., 2003. Geophysical evidence for reduced melt production on the Arcticultra-slow Gakkel mid-ocean ridge. Nature 423, 962–965.
Keays, R.R., 1995. The role of komatiitic and picritic magmatism and S-saturation in theformation of ore deposits. Lithos 34 (1–3), 1–18.
Klein, E.M., Langmuir, C.H., 1987. Global correlations of ocean ridge basalt chemistry withaxial depth and crustal thickness. J. Geophys. Res. 92 (B4), 8089–8115.
Langmuir, C., Klein, E., Plank, T., 1992. Petrological systematics of mid-ocean ridge basalts:constraints on melt generation beneath ocean ridges. Geophys. Monogr. Ser. 71,183–280.
Li, C., Ripley, E.M., 2005. Empirical equations to predict the sulfur content of maficmagmas at sulfide saturation and applications to magmatic sulfide deposits. Mineral.Deposita 40 (2), 218–230.
Luguet, A., Lorand, J.-P., Seyler, M., 2003. Sulfide petrology and highly siderophile elementgeochemistry of abyssal peridotites: a coupled study of samples from the Kane Frac-ture Zone (45°W 23°20N, MARK area, Atlantic Ocean). Geochimica et CosmochimicaActa 67 (8), 1553–1570.
Luguet, A., Shirey, S.B., Lorand, J.-P., Horan, M.F., Carlson, R.W., 2007. Residual platinum-group minerals from highly depleted harzburgites of the Lherz massif (France) andtheir role in HSE fractionation of the mantle. Geochim. Cosmochim. Acta 71 (12),3082–3097.
Maier, W., Barnes, S.J., 2004. Pt/Pd and Pd/Ir ratios in mantle-derived magmas: a possiblerole for mantle metasomatism. S. Afr. J. Geol. 107 (3), 333.
Maier, W.D., Barnes, S.J., DeKlerk, W.J., Teigler, B., Mitchell, A.A., 1996. Cu/Pd and Cu/Pt ofsilicate rocks in the Bushveld complex: implications for platinum-group elementexploration. Econ. Geol. Bull. Soc. Econ. Geol. 91 (6), 1151–1158.
Mathez, E., 1976. Sulfur solubility and magmatic sulfides in submarine basalt glass. J.Geophys. Res. 81 (23), 4269–4276.
Mathez, E., 1980. Sulfide relations in Hole 418A flows and sulfur contents of glasses. Pro-ceedings of the Ocean Drilling Program: initial report. National Science Foundation,p. 1069.
Mathez, E., Yeats, R., 1976. Magmatic sulfides in basalt glass from DSDP Hole 319A andSite 320, Nazca Plate. Initial Reports of the Deep Sea Drilling Project. US GovernmentPrinting Office, Washington, DC, USA.
Mavrogenes, J.A., O'Neill, H.S.C., 1999. The relative effects of pressure, temperature andoxygen fugacity on the solubility of sulfide in mafic magmas. Geochim. Cosmochim.Acta 63 (7–8), 1173–1180.
Meisel, T., Moser, J., 2004. Reference materials for geochemical PGE analysis: new analyt-ical data for Ru, Rh, Pd, Os, Ir, Pt and Re by isotope dilution ICP-MS in 11 geologicalreference materials. Chem. Geol. 208 (1–4), 319–338.
Mendel, V., Sauter, D., Parson, L., Vanney, J.R., 1997. Segmentation and morphotectonicvariations along a super slow-spreading center: the Southwest Indian Ridge(57°E–70°E). Mar. Geophys. Res. 19 (6), 505–533.
Meyzen, C.M., et al., 2005. New insights into the origin and distribution of the DUPALisotope anomaly in the Indian Ocean mantle from MORB of the Southwest IndianRidge. Geochem. Geophys. Geosyst. 6.
Michael, P.J., Chase, R.L., 1987. The influence of primary magma composition, H2O and pres-sure onmid-ocean ridge basalt differentiation. Contrib. Mineral. Petrol. 96 (2), 245–263.
Moore, J.G., 1975. Mechanism of formation of pillow lava: pillow lava, produced as fluidlava cools underwater, is themost abundant volcanic rock on earth, but only recentlyhave divers observed it forming. Am. Sci. 63, 269–277.
Moore, J.G., Calk, L., 1971. Sulfide spherules in vesicles of dredged pillow basalt. Am.Mineral. 56 (3–4), 476–488.
Moore, J.G., Schilling, J.-G., 1973. Vesicles, water, and sulfur in Reykjanes Ridge basalts.Contrib. Mineral. Petrol. 41 (2), 105–118.
Niu, Y.L., Hekinian, R., 1997. Spreading-rate dependence of the extent of mantle meltingbeneath ocean ridges. Nature 385 (6614), 326–329.
Patten, C., Barnes, S.J., Mathez, E.A., 2012. Textural variations inMORB sulfide droplets dueto differences in crystallization history. Can. Mineral. 50 (3), 675–692.
Patten, C., Barnes, S.-J., Mathez, E.A., Jenner, F.E., 2013. Partition coefficients of chalcophileelements between sulfide and silicate melts and the early crystallization history ofsulfide liquid: LA-ICP-MS analysis of MORB sulfide droplets. Chem. Geol. 358,170–188.
Peach, C., Mathez, E., 1993. Sulfide melt–silicate melt distribution coefficients for nickeland iron and implications for the distribution of other chalcophile elements.Geochim. Cosmochim. Acta 57 (13), 3013–3021.
Peach, C.L., Mathez, E.A., Keays, R.R., 1990. Sulfide melt silicate melt distribution coeffi-cients for noble metals and other chalcophile elements as deduced from MORB:implications for partial melting. Geochim. Cosmochim. Acta 54 (12), 3379–3389.
Peach, C., Mathez, E.A., Keays, R.R., Reeves, S., 1994. Experimentally determined sulfidemelt-silicate melt partition coefficients for iridium and palladium. Chem. Geol. 117(1), 361–377.
Puchtel, I.S., Humayun, M., 2001. Platinum group element fractionation in a komatiiticbasalt lava lake. Geochim. Cosmochim. Acta 65 (17), 2979–2993.
Qi, L., Zhou, M.F., Wang, C.Y., 2004. Determination of low concentrations of platinumgroup elements in geological samples by ID-ICP-MS. J. Anal. At. Spectrom. 19 (10),1335–1339.
Rajamani, V., Naldrett, A., 1978. Partitioning of Fe, Co, Ni, and Cu between sulfide liquidand basaltic melts and the composition of Ni–Cu sulfide deposits. Econ. Geol. 73(1), 82–93.
Rehkämper, M., et al., 1999. Ir, Ru, Pt, and Pd in basalts and komatiites: new constraintsfor the geochemical behavior of the platinum-group elements in the mantle.Geochim. Cosmochim. Acta 63 (22), 3915–3934.
Reid, I., Jackson, H., 1981. Oceanic spreading rate and crustal thickness. Mar. Geophys. Res.5 (2), 165–172.
Righter, K., Campbell, A.J., Humayun, M., Hervig, R.L., 2004. Partitioning of Ru, Rh, Pd, Re,Ir, and Au between Cr-bearing spinel, olivine, pyroxene and silicate melts. Geochim.Cosmochim. Acta 68 (4), 867–880.
Roy-Barman, M.,Wasserburg, G., Papanastassiou, D., Chaussidon,M., 1998. Osmium isoto-pic compositions and Re–Os concentrations in sulfide globules from basaltic glasses.Earth Planet. Sci. Lett. 154 (1–4), 331–347.
Sattari, P., Brenan, J.M., Horn, I., McDonough, W.F., 2002. Experimental constraints on thesulfide-and chromite–silicate melt partitioning behavior of rhenium and platinum-group elements. Econ. Geol. 97 (2), 385–398.
Sauter, D., et al., 2001. The Southwest Indian Ridge between 49°15′E and 57°E: focusedaccretion and magma redistribution. Earth Planet. Sci. Lett. 192 (3), 303–317.

13A.Y. Yang et al. / Chemical Geology 382 (2014) 1–13
Sclater, J.G., Fisher, R.L., Patriat, P., Tapscott, C., Parsons, B., 1981. Eocene to recentdevelopment of the South-west Indian Ridge, a consequence of the evolution of theIndian Ocean Triple Junction. Geophys. J. R. Astron. Soc. 64 (3), 587–604.
Shen, Y., Forsyth, D.W., 1995. Geochemical constraints on initial and final depths ofmelting beneath mid-ocean ridges. J. Geophys. Res. 100 (B2), 2211–2237.
Sinton, J.M., Detrick, R.S., 1992. Mid-ocean ridge magma chambers. J. Geophys. Res. SolidEarth 97 (B1), 197–216.
Smith, W.H.F., Sandwell, D.T., 1997. Global sea floor topography from satellite altimetryand ship depth soundings. Science 277 (5334), 1956–1962.
Song, X.Y., et al., 2006. Geochemistry of the Emeishan flood basalts at Yangliuping,Sichuan, SW China: implications for sulfide segregation. Contrib. Mineral. Petrol.152 (1), 53–74.
Tatsumi, Y., Oguri, K., Shimoda, G., 1999. The behaviour of platinum-group elementsduring magmatic differentiation in Hawaiian tholeiites. Geochem. J. 33, 237–248.
Taylor, S.R., McLennan, S.M., 1985. The continental crust: its composition and evolution.Wallace, P., Carmichael, I.S.E., 1992. Sulfur in basaltic magmas. Geochim. Cosmochim. Acta
56 (5), 1863–1874.
Wendlandt, R.F., 1982. Sulfide saturation of basalt and andesite melts at high pressuresand temperatures. Am. Mineral. 67, 877–885.
White, R., Minshull, T., Bickle, M., Robinson, C., 2001. Melt generation at veryslow-spreading oceanic ridges: constraints from geochemical and geophysical data.J. Petrol. 42 (6), 1171.
Yang, A.Y., Zhao, T.P., Qi, L., Yang, S.H., Zhou, M.F., 2011. Chalcophile elemental constraintson sulfide-saturated fractionation of Cenozoic basalts and andesites in SE China.Lithos 127 (1), 323–335.
Yang, A.Y., Zhao, T.-P., Zhou, M.-F., Deng, X.-G., Wang, G.-Q., Li, J., 2013. Os isotopiccompositions of MORBs from the ultra-slow spreading Southwest Indian Ridge:constraints on the assimilation and fractional crystallization (AFC) processes. Lithos179, 28–35.
Yeats, R.S., Mathez, E., 1976. Decorated vesicles in deep‐sea basalt glass, eastern Pacific. J.Geophys. Res. 81 (23), 4277–4284.

![QOMMEROLAL MA TTER& Acnnnt..About Fa] o'e'eak yes ¬ terday momiugJohn Ruv.dn\.r of.-tage No. Mlof the BeMMp and(irand-.-lteet line, wa-ceinmg BbWfl](https://img.pdfslide.us/doc/110x75/5ccdae0488c993fb7c8b87b9/qommerolal-ma-tter-acnnntabout-fa-oeeak-yes-terday-momiugjohn-ruvdnr.jpg)


![The Alaska citizen. (Fairbanks, Alaska). 1916-02-21 [p ]. · i.entb men ot the (irand duty now in session, this article is written especially tor you. You have a sworn duty to perfi](https://img.pdfslide.us/doc/110x75/5fcc511d7ad4c66b7d148c03/the-alaska-citizen-fairbanks-alaska-1916-02-21-p-ientb-men-ot-the-irand.jpg)