Embed Size (px)
Citation preview

1
HUDSON SANDLER FOR BRAMMER
PRESS RELEASE: 8 March 2016
Brammer plc
(“Brammer” or the “Group”)
PRELIMINARY RESULTS
2015 WAS A CHALLENGING YEAR. ESTABLISHED GROWTH DRIVER STRATEGY SUPPLEMENTED WITH KEY SELF-HELP ACTIONS FOR 2016 Brammer, the leading pan-European added value distributor of industrial maintenance, repair and overhaul products, today announces its preliminary results for the year ended 31 December 2015.
Year ended 31 December 2015 2014 Change
Constant currency change**
Organic change***
Underlying*
Sales £717.3m £723.6m -0.9% +5.3% +1.5%
Operating profit £33.9m £41.2m -17.7% -11.9% -14.4%
Profit before tax £27.6m £35.1m -21.4% -15.1% -18.2%
EPS 15.1p 20.7p -27.1%
Dividend 10.7p 10.7p -
Reported
Operating profit £19.8m £23.8m
Profit before tax £13.5m £17.7m
EPS 7.3p 9.2p Highlights
Total Group revenue up 5.3% at constant currency exchange rates (“CER”) to £717.3 million; down 0.9% at reported rates
Gross margin down 80 basis points to 30.9% (2014: 31.7%): improvement programme initiated in the second quarter with encouraging progress to date
Underlying* profit before tax reduced by 15.1% at CER to £27.6 million (2014: £35.1 million)
Underlying* EPS reduced by 27.1% to 15.1p (2014: 20.7p)

2
Cost reduction and restructuring programme completed saving £5 million in the year, incurring an exceptional charge of £11.1 million
Net debt at 31 December 2015 of £104.3 million (2014: £85.3 million); increased focus on cash generation to reduce the Group’s net debt, including a stock reduction programme underway to reduce inventory by £30 million during 2016
Dividend maintained at 10.7p (2014: 10.7p), reflecting continuing confidence in the outlook for the business
Good performance in Continental Europe insufficient to offset a disappointing performance in UK and Nordic regions. Management action plan commenced to improve performance of UK business, and Brammer growth drivers introduced into Scandinavia
Two new Executive Director appointments; Duncan Magrath and Steve Ashmore
Continued focus on execution of organic growth driver strategy
Acceleration of InvendTM programme, with 1,305 vending machines installed at year-end in 16 countries at 475 customer locations
Key Account SPWD growth of 5.2%, with pan-European Key Account sales growing 13.0%
Insite™ sales growth of 3.8%, with a net 66 new locations established
Strong revenue growth in T&GM products, up 11.1% overall
* pre amortisation of acquired intangibles, acquisition related costs and exceptional items ** at constant currency *** at constant currency including incremental growth of acquisitions Current Trading and Outlook Ian Fraser, Chief Executive said: “Financial year 2015 was tough for Brammer with particularly weak market conditions in the UK and Nordic regions exacerbated by execution problems in our UK business. 2016 has started in similar vein to the final quarter of 2015, with good performance on the continent being offset by continuing difficulties in the UK and Nordic regions. In response to these challenges we initiated a number of actions during 2015, which should lead to improved performance over the course of the current year. We have made management changes in our UK business and expect to see a turnaround during 2016. In our Nordic business we have accelerated the implementation of core growth drivers to help offset the declines in the offshore oil and gas business. Our margin improvement programme is proceeding well, with the underlying margin on an upward trend. Our stock reduction programme has progressed well with a reduction of £6.5 million in the first two months. Whilst we expect to make progress in each of these initiatives in the current year, the positive effect of these on the Group’s earnings will be offset by the one-off impact of the focus on inventory reduction.” Enquiries: Brammer plc 01565 756801
Bill Whiteley, Chairman Ian Fraser, Chief Executive Paul Thwaite, Finance Director Issued: Hudson Sandler 0207 796 4133 Andrew Hayes Katie Matthews

3
BRAMMER PLC
PRELIMINARY ANNOUNCEMENT OF FINAL RESULTS FOR YEAR ENDED 31 DECEMBER 2015
INTRODUCTION 2015 was a challenging year for the Group, with a good performance in our Continental European businesses in tough market conditions failing to offset a disappointing performance in the UK and Nordic region. Despite this, we continued to gain market share in most of our territories and to invest in our growth drivers which we believe will drive future revenue and profit growth in a difficult macroeconomic environment. We remain committed to our growth driver strategy and have continued to invest in future business development opportunities, especially in Tools & General Maintenance (T&GM) and Industrial Vending. Key operational priorities have been identified for 2016 which, alongside the Group’s well-established growth drivers, will improve the performance and position of the business. 2015 PERFORMANCE REVIEW Trading
Revenue
Underlying Operating Profit
2015 2014 Variance %
2015 2014 Variance %
£m £m Reported CER*
£m £m Reported CER*
UK 278.1 282.1 -1.4% -1.3%
12.6 15.8 -20.3% -20.3%
Germany 118.0 121.7 -3.0% 7.2%
7.5 7.5 - 10.3%
France 85.3 86.7 -1.6% 8.7%
3.2 4.8 -33.3% -27.3%
Spain 53.7 49.4 8.7% 20.1%
6.3 6.0 5.0% 14.5%
Benelux 51.9 53.1 -2.3% 8.1%
2.7 2.6 3.8% 17.4%
Nordic 45.4 54.4 -16.5% -4.0%
-1.3 2.3 -156.5% -172.2% Eastern Europe & Other 84.9 76.2 11.4% 20.3%
2.9 2.2 31.8% 52.6%
Total Group 717.3 723.6 -0.9% 5.3%
33.9 41.2 -17.7% -11.9% *At constant currency (CER) of £1:€1.375 Overall Group revenues increased by 5.3% at CER to £717.3 million for the year ended 31 December 2015. At reported exchange rates, Group revenues decreased by 0.9%. At CER, Continental Europe (excluding Nordic region) revenues and operating profits increased by 11.9% and 8.1% respectively, continuing the growth momentum from 2014. This performance reflects our ability to leverage our growth driver strategy ahead of underlying market growth as well as the positive impact of recent bolt-on acquisitions. However, as previously highlighted, the performance of our UK business suffered with revenue decreasing by 1.4% and operating profit by 20.3% as a result of a decline in T&GM spend with certain customers in the Aerospace and Steel sectors and operational issues arising from the merger of the UK and Buck & Hickman operations last year. Whilst the resulting service issues impeded both sales development and the realisation of operational synergies, we have made the necessary management and organisational changes to ensure the UK business performance improves during 2016. Revenue in the Nordic region decreased by 4.0% at CER and the business reported an operating loss, reflecting further deterioration in the Oil and Gas sectors during the year. We continue to believe in the long term opportunity for Brammer in the region and have invested to accelerate our development of Key Account and InsiteTM growth drivers thereby increasing our resilience in the face of market weakness.

4
Overall Group sales per working day (“SPWD”) grew by 4.9% at CER, with an increase of 11.4% in Continental Europe (excluding Nordic region) and a decrease of 1.3% in the UK and 7.0% in the Nordic region. Group organic SPWD growth (including incremental growth from our acquisitions in 2014) at CER was 1.0% overall, with Continental Europe up 5.6% and the UK and Nordic region down 2.3% and 13.3% respectively. Gross margin decreased by 80 basis points compared with last year to 30.9% (2014: 31.7%). This was partly due to the dilutive effect of an increasing proportion of lower margin T&GM and Key Account revenues, but the main factor was insufficient focus on margin by our commercial teams. Underlying Group operating profit (profit before amortisation of acquired intangibles and acquisition related costs and exceptional items) decreased by 17.7% to £33.9 million (2014: £41.2 million), reflecting foreign exchange headwinds and the effect of the reduction in the gross margin. At CER, underlying operating profit decreased by 11.9%. Following a slower than anticipated start to the year, a major cost reduction and restructuring programme was completed during the period. This resulted in a reduction in headcount of 239 employees and saved £5 million of costs compared with the prior year. At the same time we continued to maintain tight control of underlying operating costs. The costs of the restructuring activity totalling £11.1 million are shown as an exceptional item. Sales, distribution, and administrative costs (“SDA”) (excluding amortisation, acquisition related costs and exceptional items) decreased by £0.5 million to £188.2 million, including a £10.9 million beneficial foreign exchange impact and a £6.9 million impact from prior year acquisitions. In 2015, our investment to build our Industrial T&GM and Vending capability represented a drag on profitability of around £2 million. We expect this to ease significantly in 2016 as these initiatives mature. The underlying operating return on sales of 4.7% was 100 basis points below last year (2014: 5.7%). Underlying basic earnings per share were down 27.1% to 15.1 pence per share (2014: 20.7 pence per share). Key Performance Indicators and other measures
2015 2014 Group sales growth** 5.3% 14.6%
Organic+ SPWD growth** 1.0% 6.8%
Key Account SPWD growth** 5.2% 8.7%
Return on Capital employed 20.9% 27.2%
Net debt to EBITDA 2.38:1 1.82:1 Interest cover 6.8x 7.9x
Stock turn 3.4x 3.8x **at constant currency + including incremental growth of 2014 acquisitions
2016 OPERATIONAL PRIORITIES In light of the Group’s recent trading results, the Board has reviewed the operational and financial performance of the business, including cash generation, debt levels and forecasting, and identified a number of key operational priorities for 2016. The successful delivery of these actions, alongside the Group’s well-established growth drivers, will improve the financial performance and position of the business and provide the platform for increasing shareholder value. The priorities are as follows: Reduction in net debt Over the last three years, net debt has increased as the Group has executed its growth driver strategy, invested in working capital and completed a number of bolt-on acquisitions to build out its pan-European platform. Net debt at 31 December 2015 was £104.3 million (2014: £85.3 million), representing a net debt/EBITDA ratio of 2.38 times which is higher than our internal target. Whilst the Group has adequate headroom against its financial covenants, we recognise the importance of

5
reducing the Group’s net debt to a level which results in a net debt/EBITDA ratio of 1.5 times and supports the continued investment in growth drivers such as Vending as well as funding dividends to shareholders. Accordingly, the Group intends to reduce its net debt significantly during 2016 through an increased focus on cash generation across the business and in working capital management in particular. Stock reduction programme Whilst underlying stock turns have reduced in the last three years reflecting continued investment to support the T&GM and Vending growth drivers, it is clear that general inventory levels are excessive for current levels of trading activity. Following the rollout of a new centralised stock holding database, we are now able to analyse inventory levels for individual lines by country, but also aggregated at a group level. This tool has now enabled us to identify slower moving stock which can be quickly sold in another territory as well as calculating optimum re-order levels on a group level. Accordingly, we have initiated a stock reduction programme across the business to optimise the Group’s inventory levels, with a reduction target of £30 million by the end of September 2016, turning stock into cash. We are confident that this target can be achieved given the nature and quality of the surplus stock, much of which is bearings which can be readily sold, and our previous similar stock reduction programme in 2009 which was achieved without the analytical tools we now have available. Alongside this specific stock reduction programme, we will be focused on improving our overall working capital management and increasing stock turn from its current 3.4 times in 2015 to 4.5 times, on a sustainable basis, over time. Improvement in our UK business Given the importance of the UK business to the Group, we are focused on improving its performance and returning the operation to revenue and profit growth after a period of some disruption. We have therefore made the necessary management and organisational changes to the UK business, including the appointment of Steve Ashmore who will join the board and will be Regional Managing Director responsible for UK, Ireland and Iceland. He joins us from Wolseley plc, where he was UK Managing Director and has an excellent track record in strategic and operational delivery. The priority is to restore service levels and operational efficiency which were impacted by the consolidation of the Buck & Hickman NDC. Whilst it will take time to turn the business around fully, service levels are now stable and we expect to see evidence of an improved performance during 2016 and further significant progress thereafter. Improvement in gross margin Between 2014 and 2015 Group gross margin has declined from 31.7% to 30.9%. Whilst some of this reduction reflects the growth of our T&GM product range which is inherently lower margin, our increased number of Key Accounts and continued geographical expansion into certain lower margin territories, it is clear that we can improve our overall gross margin through better focus and commercial execution. We are therefore concentrating management attention on this important Key Performance Indicator, although we do not expect a significant improvement in the current year as our actions will be offset by the reduction in supplier rebates as a consequence of our planned stock reduction programme. Our Market Brammer is the leading pan-European added value distributor of high quality industrial maintenance, repair and overhaul products.
We are the authorised distributor of many of the world’s leading engineering component manufacturers. We supply Bearings, Mechanical Power Transmission components, Fluid Power, and T&GM products, together with engineering and associated industrial services, to the maintenance, repair and overhaul (“MRO”) market across Europe. With an estimated share of less than 2% in a highly fragmented market, we have major potential for consolidation and growth.

6
Growth drivers and capabilities underpinning our performance Vending Our InvendTM programme is gaining momentum. During 2015 we built our capability in UK, Germany, France, Spain, Poland, and the Netherlands and are now able to service demand in most of our key territories. We have 124 employees supporting the InvendTM initiative and at year end, have 1,305 machines installed with an order book for a further 327 machines across 16 countries. We continue to believe Industrial Vending represents a major opportunity in the European market and accelerated the rollout of our InvendTM programme. We are confident that we now have the most developed offering for Industrial Vending in Europe, giving us a significant competitive advantage. We are therefore convinced that, given the overall market potential and the high level of interest currently shown by our existing customer base, InvendTM will be the most significant growth driver for Brammer in the near to medium term. Investment in our InvendTM growth driver in 2015 was £6 million (2014: £4 million) in SDA costs. We intend to continue to invest at this level in the short to medium term which will enable us to scale up our operations and capitalise on this market opportunity. With our existing branch and NDC network we already have the infrastructure and economies of scale required to have a comprehensive and cost effective Europe-wide replenishment capability. Our relatively recent entry into the European T&GM market ensures that we are not cannibalising existing revenues with sales through vending machines and our existing growth drivers and value proposition help us to maximise cross-selling opportunities for indirect sales. Based on an average installed machine cost of approximately €9,500, each machine is capable of delivering an incremental Return on Capital Employed (“ROCE”) of approximately 30%. The indirect sales volumes continue to increase in the second year of installation and beyond, resulting in a higher ROCE in future years. The rate of growth in sales to customers with a vending machine installed significantly exceeded overall group growth; we exited the year with a fourth quarter growth rate of 26.5% from these customers, accounting for 7.7% of total sales in the quarter. Total account sales (for accounts with vending machines) increased from £7.7 million in the first quarter to £13.6 million in the fourth quarter. We now have more than 18 months of reliable data over a statistically significant number of installations. We expect growth rates for InvendTM customers to continue in a similar fashion, and remain significantly higher than growth in the wider market. We are reporting our InvendTM progress by reference to the following performance measures:

7
Quarter on quarter update – Machine numbers
Machines Signed1 Q1 Q2 Q3 Q4 2015 235 299 249 261 2014 134 91 106 183 2013 11 34 28 86
Machines Installed2 Q1 Q2 Q3 Q4 2015 157 187 217 243 2014 63 100 93 130 2013 1 13 30 71
Machines Live Q1 Q2 Q3 Q4 2015 658 845 1,062 1,305 2014 178 278 371 501 2013 1 14 44 115 Installations by Geography UK 501 Germany 192 France 186 Spain 175 Benelux 87 Eastern Europe & Other 164 Group 1,305
Quarter on quarter update – Revenue Total Account sales3 (for accounts with vending machines)
InvendTM Customer growth rates
Q1 Q2 Q3 Q4 Q1 Q2 Q3 Q4 2015 7,711 9,276 10,308 13,573 2015 37.2% 24.7% 20.5% 26.5% 2014 2,385 3,587 5,021 6,130 2014 74.0% 47.5% 62.1% 48.4% 2013 6 98 452 766 2013 - 243.2% 35.9% 106.5%
1Net of cancellations 2Net of machines removed from customers 3In £’000 at constant currency €1.375:£1
Key Accounts and Base Business Our value-added service offering for Key Accounts proved more resilient than our base business. Key Accounts grew 5.4% with growth in all product sectors whilst base business declined 3.2% organically. Bearing sales to Key Account customers increased by 6.9% but only 2.3% in base business. Our relatively large market share in bearings means that we are more sensitive to general market conditions. Excluding the full year effect of 2014 acquisitions, underlying bearing sales to base business customers declined by 8.6%. Non-bearing sales increased by 5.9% overall. This result was underpinned by sales of T&GM product ranges continuing to capture market share, growing by 11.1% overall, and 34.9% in base business. The following table shows the product group split in our Base business and our Key Account business at constant exchange rates.

8
Revenue by business area and customer type at CER (£m) At €1.375:£1
2015 2014 Change
Organic6 Acqns Total Total Total Organic6
Total Group 690.8 26.5 717.3 680.9 5.3% 1.5%
Base business
Bearings1 113.1 13.5 126.6 123.7 2.3% -8.6% Power transmission2 65.7 1.6 67.3 72.8 -7.7% -9.8% Fluid Power3 45.5 2.0 47.5 41.9 13.4% 8.6% T&GM4 43.8 8.0 51.8 38.4 34.9% 14.1% General Consumables5 33.5 1.4 34.9 34.9 - -4.0%
Total Base Business 301.6 26.5 328.1 311.7 5.3% -3.2%
Key Accounts
Bearings1 72.8 - 72.8 68.1 6.9% 6.9% Power transmission2 66.9 - 66.9 64.1 4.4% 4.4% Fluid Power3 73.6 - 73.6 67.1 9.7% 9.7% T&GM4 108.4 - 108.4 105.7 2.6% 2.6% General Consumables5 67.5 - 67.5 64.2 5.3% 5.1%
Total Key Accounts 389.2 - 389.2 369.2 5.4% 5.4% 1 Includes Linear Motion & Seals 2 Includes Gearboxes, Motors & Industrial Automation
3 Includes Process 4 Includes Personal Protective Equipment (“PPE”)
5 Includes Fasteners, Chemicals, Services and other products
6 Includes incremental sales growth from 2014 acquisitions
Key Accounts
Key Account Sales Performance
£m at CER (€1.1.375 : £1)
Status Scope 2015 2014 Growth
Tier 1 EU contract Part EU Group 161.6 143.0 13.0%
Tier 2 National contract Part EU Group 144.3 140.7 2.6%
Tier 3 No contract Part EU Group 19.5 20.3 -3.9%
Tier 4 National contract National Group 63.8 65.2 -2.1%
Total Key Accounts
389.2 369.2 5.4%
Key Account sales grew at 5.4% at CER, 5.2% in SPWD. A further nine pan-European contracts were won during the year representing potential annual revenues of up to €51 million. The pipeline remains strong. Our value proposition and consistent service levels continue to be attractive to our Tier 1 group of pan-European Key Accounts, resulting in growth of 13.0%. Overall Key Account growth continues to be affected by a small number of underperforming national UK Key Accounts and, accordingly, the national contract tiers of Key Accounts experienced lower growth rates. During 2015 a Strategic Contracts Group was established in the UK. Led by senior operational management, this team has been formed to address the specific complex requirements for various large key UK contracts, augment the Key Account teams and manage contract performance to achieve their maximum potential. Modest overall growth of 0.6% was experienced in National key accounts (Tiers 2-4) this year; however, excluding the UK, robust double digit growth continued at 13.1% in Continental Europe. Our Key Account total now stands at 906 accounts across the business, with 83 pan-European Key Accounts.

9
Product Range Extension Increasing growth in non-bearings product sales provides significant opportunities, given that our lower market share is not a constraint to growth. We continued to focus on T&GM sales development with growth of 11.1% for the group overall. Despite operational headwinds in the UK, our underlying product and service offering remains good. Our new PPE and health and safety brand called Q-Safe was launched into the market in 2015. Q-Safe provides fully compliant PPE and represents real value for money. The launch has been well received and approximately 4,000 customers in 14 countries are now buying Q-Safe products. Sales through vending machines account for 14% of Q-Safe sales. Growth of our hand tools, cutting tools and tool storage brand, Roebuck, remains robust, with sales more than doubling in Continental Europe. In 2015 we extended the product range by over a third, including a new range of air tools. Growth in own brand products represents a significant margin enhancing opportunity. Insites™ At CER, Insite™ sales grew by 3.8%, with a net 66 new InsitesTM opening this year. The Group operated a total of 493 Insites™ at year end, a number which has increased every year since the introduction of the InsiteTM growth driver over ten years ago. During the year, our Nordic segment opened a further three InsitesTM at an accelerating rate of implementation. We are now able to provide the full product service offering in the Nordic region, and many of our existing Key Account customers are showing keen interest in our InsiteTM solution offering for their production plants in the region. Market segmentation Our focus on market segmentation as a growth driver, utilising our detailed understanding of our customers’ industry specific needs, helps maximise our growth opportunities. Our market share increased in Food and Drink with growth of 10.4%, Automotive grew by 11.5% and Pharmaceuticals were up 69%. However, tough European industrial markets adversely affected some sectors, with sales to Aerospace customers declining by 6.8% and Petroleum down 8.4%. Customer service Customer service underpins everything we do, with the success of our growth drivers depending on successful delivery of customer service excellence. During the year, we conducted our fifth annual pan-European customer satisfaction survey. This annual survey targeted over 115,000 customer contacts across Europe, creating a powerful tool to gain insight into how our customers currently perceive us and our performance. Brammer achieved valuable feedback on all key areas, and we have embedded this feedback into action plans on both country and business-wide levels in order to drive our “Excellence in Customer Service” programme, our framework to deliver a consistent and excellent customer experience in all of our territories. Providing real validated cost savings to our customers is a key part of Brammer’s value proposition and finding more cost saving opportunities each year is ‘hard wired’ into the ‘DNA’ of the business. During the year we delivered over £55 million of signed-off cost savings to our customers. Our new InvendTM growth driver is already demonstrably delivering significant savings to our customers, helping them reduce stock losses and optimising working capital levels.

10
Capabilities and Costs Technology 2015 saw further development in our group technology capability, particularly in our rapidly growing e-commerce capability. This included the launch of a major new e-commerce channel, Brammer Order Management, which fills the space between our smaller trade account system Brammer Online and our highly successful large account, Brammer eProcurement system. Our master data management system (MDM) provides clean, quality controlled product data as a robust platform for our e-commerce capability. This capability was further enhanced by the roll-out of a new product creation tool, providing much improved control over data quality, vital for effective on-line trading. We also moved parts of our e-commerce sites into “the Cloud” this year and in doing so won an industry award from the Corporate IT Forum for innovative use of “the Cloud”. Consequently, it is pleasing to note an accelerating rate of adoption of our e-commerce channels particularly from our large customers and suppliers. We are seeing ever increasing demand for online trading with our larger customers moving rapidly towards integration of the systems with us in order to reduce the back office costs associated with procurement activities. We have invested in additional cyber security measures and established a dedicated function to manage activities such as compliance monitoring, policy implementation and penetration testing. Our People Paul Thwaite, our Group Financial Director will stand down from the Board on 31 March 2016. Paul has worked alongside me for 14 years at Brammer and he has been an integral part of the success and significant growth of the Group over this period. I am indebted to Paul for his contribution and wish him well in his future endeavours. After a process run by a leading external executive search firm, today we are pleased to announce that Duncan Magrath will succeed Paul Thwaite as Group Finance Director. Duncan has been a non-executive director of Brammer for nearly four years and will join us today on a full time basis. He will have a short handover with Paul before taking up the position of Group Finance Director on 31 March 2016. Duncan was appointed to our board as a Non-Executive Director in March 2012. He has been the chairman of our Audit Committee and so is already very familiar with our finances, processes and systems. After graduating with an Engineering degree from Cambridge, he joined Price Waterhouse, where he qualified as an accountant. He then held various finance roles in both the UK and USA over a thirteen year period within Ocean group and its successor amalgamated group Exel plc, one of the largest logistics companies in the world. He left Exel to join Balfour Beatty plc, spending nine years there and finishing as Group Finance Director. We are delighted to have him on board in a full time capacity. We are also pleased to announce the appointment of Steve Ashmore to the Board as Regional Managing Director responsible for the UK, Ireland and Iceland. Steve has considerable operational and commercial experience and has held a variety of leadership positions throughout his career including, most recently, Managing Director of Wolseley UK, the UK operating company of Wolseley plc, having been appointed to that the role in 2010. Before joining Wolseley, Steve spent over 11 years with Exel plc, the supply chain and third party logistics provider. Between 2003 and 2005 he was Managing Director, Europe of Exel’s Industrial Division, covering logistics and supply chain management for the capital goods, utilities and processing industries. Prior to that, he was Managing Director, Continental Europe comprising Exel businesses in Spain, France, Germany and Portugal. Before joining Exel, Steve was a consultant for management consulting firm A. T. Kearney. He is a proven business leader with an impressive track record of business improvement performance and we are delighted to have him on board.

11
Operating Segments UK
Segment performance 2015 2014 Change Constant currency change**
Organic change***
Revenue £278.1m £282.1m -1.4% -1.3% -2.3%
SPWD growth -1.4% -2.5% 1.1% -1.3% -2.3%
Underlying operating profit* £12.6m £15.8m -20.3% -20.3% -23.6%
Operating return on sales* 4.5% 5.6% -1.1%
% of Group revenue 38.8% 39.0%
* pre amortisation of acquired intangibles, acquisition related costs and exceptional items ** at constant currency *** at constant currency, including incremental impact of acquisitions
The UK (including Ireland and Iceland) is our largest operation, contributing 38.8% to total Group revenue. Sales declined by £4.0 million overall, representing a SPWD decline of 1.4% compared to the 2.5% decline in the equivalent period in 2014. The continued year on year decline reflects several factors, including continued down-trading from several large T&GM National Key Accounts, most notably in the Aerospace and Steel sectors, but also the effects of poor operational execution. Restructuring activities continued in 2015, following the closure of the Buck & Hickman NDC and consolidation of the supply chain organisations in 2014. However, during the integration and re-organisation we experienced execution issues resulting in operational inefficiencies. Delays in implementing corrective actions meant that this restructuring did not deliver expected levels of revenue growth and gross margin levels. Consequently, financial performance was disappointing, especially in T&GM, and while bearings sales continued to grow 1.5% overall, T&GM sales declined by 4.2% in the year. Following a change in management, these operational issues are being addressed and focus has returned to improving growth and margins. Operating profit decreased by 20.3%, to £12.6 million, reflecting the decline in sales as well as some gross margin reduction. Operating return on sales decreased by 1.1 ppt to 4.5%, although cost saving measures undertaken in the first half supported a slight improvement of 0.2 ppt in the second half.

12
Germany Segment performance 2015 2014 Change Constant
currency change**
Organic change***
Revenue £118.0m £121.7m -3.0% 7.2% 5.7%
SPWD growth -3.8% 2.7% -6.5% 6.3% 4.9%
Underlying operating profit* £7.5m £7.5m -% 10.3% 8.7%
Operating return on sales* 6.4% 6.2% 0.2%
% of Group revenue 16.5% 16.8%
* pre amortisation of acquired intangibles, acquisition related costs and exceptional items ** at constant currency *** at constant currency, including incremental impact of acquisitions
Germany, our second largest segment contributed £118.0 million to revenue, 16.5% of the Group total. SPWD decreased by 3.8% year on year, but increased by 6.3% at CER. This growth reflects successful market share gains following a focus on our growth drivers, together with a 1.4% contribution from the bolt-on acquisition made last year. Following management changes and targeted restructuring actions in the first half, organic SPWD growth accelerated from 4.3% in the first half to 5.5% in the second half, achieving overall growth of 4.9%. Bearings sales grew by 1.3%, while non-bearings sales grew by 12.8% driven by strong T&GM sales, up 39.3% from last year. T&GM products now represent 12.8% of segment revenue (2014: 9.8%). Growth activities included the personal delivery of over 10,000 catalogues to our customers by our sales force, each one providing an opportunity for our employee to represent Brammer to the customer. Operating profit has increased by 10.3% at CER, mainly reflecting higher trading levels in the year allied with an increase in gross margin.

13
France Segment performance 2015 2014 Change Constant
currency change**
Organic change***
Revenue £85.3m £86.7m -1.6% 8.7% 6.1%
SPWD growth -2.0% 3.1% -5.1% 8.3% 5.7%
Underlying operating profit* £3.2m £4.8m -33.3% -27.3% -28.7%
Operating return on sales* 3.8% 5.5% -1.7%
% of Group revenue 11.9% 12.0%
* pre amortisation of acquired intangibles, acquisition related costs and exceptional items ** at constant currency *** at constant currency, including incremental impact of acquisitions
France, our third largest segment contributed £85.3 million to revenue, 11.9% of the Group total. SPWD increased by 8.3% at CER reflecting 5.7% organic growth together with a 2.6% contribution from the bolt-on acquisition made last year. Bearings sales remained broadly flat, and growth was driven by product range extension, with T&GM growth of 39.4%, now representing 13.0% of segment revenue. More than 1,300 new customers bought T&GM products from us in 2015 and, with continuing marketing initiatives complementing the InvendTM programme roll-out, strong growth is set to continue. Operating profit has decreased by 27.3% at CER, as the benefit from increased sales was offset by a gross margin reduction consistent with the overall Group along with cost investment to drive future InsiteTM and InvendTM growth. Margins are now on an improving trend and our investment in vending and T&GM growth has borne fruit. Our December exit growth rate was 11.6% in SPWD.

14
Spain Segment performance 2015 2014 Change Constant
currency change**
Organic change***
Revenue £53.7m £49.4m 8.7% 20.1% 11.8%
SPWD growth 8.7% 9.5% -0.8% 20.1% 11.8%
Underlying operating profit* £6.3m £6.0m 5.0% 14.5% 10.8%
Operating return on sales* 11.7% 12.1% -0.4%
% of Group revenue 7.5% 6.8%
* pre amortisation of acquired intangibles, acquisition related costs and exceptional items ** at constant currency *** at constant currency, including incremental impact of acquisitions
Pleasing growth continued in Spain with progress in all growth drivers combining to generate good growth in a weak market. At CER, sales grew by 20.1% overall representing organic growth of 11.8% and the benefit of a full year contribution from two bolt-on acquisitions in 2014. Significant market share gains were achieved from product range extension, especially T&GM, which grew by 98%. T&GM is now the second largest product category in Spain and 117 people received training to ensure that our workforce has full knowledge of the product range and strategy, to enable them to realise future growth opportunities. Operating profit has increased by 14.5% at CER, lower than sales growth mainly reflecting gross margin reductions.

15
Benelux Segment performance 2015 2014 Change Constant
currency change**
Organic change***
Revenue £51.9m £53.1m -2.3% 8.1% 4.8%
SPWD growth -2.2% -0.3% -1.8% 8.1% 5.0%
Underlying operating profit* £2.7m £2.6m 3.8% 17.4% 9.5%
Operating return on sales* 5.2% 4.9% 0.3%
% of Group revenue 7.2% 7.4%
* pre amortisation of acquired intangibles, acquisition related costs and exceptional items ** at constant currency *** at constant currency, including incremental impact of acquisitions
SPWD in the Benelux countries increased by 8.1% at CER reflecting growth through product range extension and cross selling, with a 3.1% contribution from the bolt-on acquisition made last year. Product range extension also supported growth with non-bearings growth of 12.1% compared to bearings growth of 3.5%. T&GM growth of 20.7% was supported by the full launch of the Q-Safe brand while a focus on Fluid Power resulted in 18.7% growth, mostly with non Key Account customers. Operating profit has increased by 17.4% to £2.7 million at CER, above sales growth, reflecting the increase in trading, along with synergies from the combination of some operational functions across Belgium and Netherlands and the integration of last year’s acquisition.

16
Nordic Segment performance 2015 2014 Change Constant
currency change**
Organic change***
Revenue £45.4m £54.4m -16.5% -4.0% -10.4%
SPWD growth -19.2% n/a n/a -7.0% -13.3%
Underlying operating profit* -£1.3m £2.3m -156.5% -172.2% -116.7%
Operating return on sales* -2.9% 4.2% -7.1%
% of Group revenue 6.3% 7.5%
* pre amortisation of acquired intangibles, acquisition related costs and exceptional items ** at constant currency *** at constant currency, including incremental impact of acquisitions
The Nordic segment comprises our businesses in Norway, Sweden, Finland and Denmark which contributed £45.4 million to revenue, 6.3% of the Group total. Trading performance suffered from reduced demand from the weakness in the Oil and Gas sector, and recessionary pressure in the region such that SPWD at CER declined by -7.0%, and -13.3% organically. However, the decrease in organic SPWD slowed from -16.3% in the first half to -10.3% in the second half as our self-help drivers began to underpin an improvement in sales performance. We are already trading with 11 Key Accounts with a further 11 in the pipeline. The growth potential from Key Accounts is significant as many existing Brammer accounts have indicated a strong interest for us to support their Nordic operations. We are now operating four InsitesTM. Sales of the recently introduced product ranges of Fluid Power and T&GM sales almost doubled in the year from a low base although this did not fully offset the large 18.5% decline in power transmission product sales (mainly motors, gearboxes and inverters – the traditional product range of our acquired business). Although the Brammer growth drivers will continue to gain traction, it will be some time before we will be able to offset the effect of the downturn in the Oil and Gas sector. During the year, a new regional NDC was opened in Gothenburg which now enables the full product range to be supplied to the Nordic region. This represents a key milestone in building the infrastructure necessary to support the planned growth in Key Accounts and InsitesTM by having the capacity to supply our customers with the products they request in line with the expected service levels. In time our developing capabilities will also enable us to rollout a full InvendTM programme in the region. The Nordic segment reported a loss of £1.3 million in the year, reflecting the decline in revenue but also strategic cost investment in building capacity to implement the Brammer growth drivers.

17
Eastern Europe and Other Segment performance 2015 2014 Change Constant
currency change**
Organic change***
Revenue £84.9m £76.2m 11.4% 20.3% 3.7%
SPWD growth 10.2% 31.3% -21.2% 19.4% 3.0%
Underlying operating profit* £2.9m £2.2m 31.8% 52.6% 7.5%
Operating return on sales* 3.4% 2.9% 0.5%
% of Group revenue 11.8% 10.5%
* pre amortisation of acquired intangibles, acquisition related costs and exceptional items ** at constant currency *** at constant currency, including incremental impact of acquisitions
Our Eastern European and other businesses (comprising Poland, the Czech Republic and Slovakia, Hungary, Italy and our InsiteTM in Saudi Arabia) contributed £84.9 million to revenue, 11.8% of the Group total. SPWD increased by 19.4% at CER reflecting 3.0% organic growth together with the annualised contribution from the bolt-on acquisitions made last year. Key Accounts grew by 11.2%, reflecting strong growth in several countries, particularly in Hungary, Poland and Italy. Seventeen new InsitesTM were implemented in 2015 including seven in Italy. We have lower market share in the countries reported in this segment and bearings growth of 19.5% represented strong market share gains. A focus on cross-selling and product extension also delivered pleasing growth in T&GM revenue, up 59.6% and Fluid Power up 27.4%. Integration of prior year bolt-on acquisitions is progressing well and we are beginning to realise the associated operational benefits. Operating profit at CER has increased by 52.6% and 7.5% organically as sales increases generate profitable growth.

18
Financial review
Operating Performance and Key Performance Indicators
We use the following key performance indicators (KPIs) to measure and track performance. Each KPI relates directly to our long term strategy.
2015 2014 £m £m Revenue 717.3 723.6 Gross margin % 30.9% 31.7% Gross profit 221.6 229.4 Sales, Distribution and Administration costs* (187.7) (188.2) Operating profit* 33.9 41.2 Operating return on sales* 4.7% 5.7% Finance expense – net (6.3) (6.1) Profit before tax* 27.6 35.1 Cash generated from operations 17.1 13.7 Earnings per share* 15.1p 20.7p Dividend per share 10.7p 10.7p
*before amortisation, acquisition related costs and exceptional items
Revenue Revenue decreased by 0.9%. At constant exchange rates, revenue for the Group increased by 5.3% compared to the prior year. Sales per Working Day Group organic SPWD growth (including incremental growth from our acquisitions in 2014) was 1.0% overall. Growth in the Nordic and UK segments was disappointing, whilst Continental Europe grew at 5.6%, accelerating by 0.4% between the first and second half. SPWD growth rates by half at CER
SPWD Growth
SPWD Sales
H1 H2 Full
Year Organic* % % % £’k £’m
Continental Europe 5.4% 5.8% 5.6% 1,488 373.2 UK -0.2% -4.5% -2.3% 1,101 275.2 Nordic -16.3% -10.3% -13.3% 170 42.4
Group- Organic 1.5% 0.5% 1.0% 2,759 690.8
Acquisitions
105 26.5
Group- Total 7.0% 2.7% 4.9% 2,864 717.3 * Including incremental growth from 2014 acquisitions

19
SPWD
2015 2015
CER organic CER*
UK -1.3% -2.3% Germany 6.3% 4.9% France 8.3% 5.7% Spain 20.1% 11.8% Benelux 8.1% 5.0% Nordic -7.0% -13.3% Eastern Europe & Other 19.4% 3.0% Total Group 4.9% 1.0%
*Including incremental growth from 2014 acquisitions Growth rates are as measured against the equivalent period in the prior year 2015 average number of working days was 251 days (2014: 250 days)
Revenue by business area Cross-selling continued to contribute to the Group’s growth and the proportion of non-bearings sales grew to 72.2% (2014: 71.3%). At CER, bearing sales grew by 4.0% while non-bearing sales grew by 5.9% overall. This growth was driven by T&GM sales, up 11.1%, and Fluid Power sales up 11.1%. Revenue by business area (£m)
2015
% of Group revenue 2014
% of Group revenue
Constant currency change6
Constant currency Organic6,7
Bearings1 199.4 27.8% 208.0 28.7% 4.0% -3.1% Power transmission2
134.2 18.7% 148.1 20.5% -2.0% -3.1% Fluid Power3 121.1 16.9% 116.1 16.0% 11.1% 9.3% T&GM4
160.2 22.3% 148.3 20.5% 11.1% 5.6% General Consumables5
102.4 14.3% 103.1 14.2% 3.3% 1.9% Total Group 717.3 100% 723.6 100% Exchange effect - (42.7) - Total Group – at CER6 717.3 100% 680.9 100% 5.3% 1.5%
1 Includes Linear Motion & Seals 2 Includes Gearboxes, Motors & Industrial Automation
3 Includes Process 4 Includes Personal Protective Equipment (“PPE”)
5 Includes Fasteners, Chemicals, Services and other products 6 Constant currency at €1.375:€1
7 Includes incremental sales growth from 2014 acquisitions
Trading during the year Profit from operations before amortisation, exceptional items and acquisition related costs, interest and tax (“underlying operating profit”) decreased by 17.7% to £33.9 million (2014: £41.2 million), of which £17.2 million was delivered in the first half and £16.7 million in the second half (see table below). First half Second half Full year 2015 £m £m £m Revenue 365.6 351.7 717.3 Gross profit 111.5 110.1 221.6 Underlying operating profit* 17.2 16.7 33.9

20
First half Second half Full year 2014 £m £m £m Revenue 364.1 359.5 723.6 Gross profit 114.0 115.4 229.4 Underlying operating profit* 20.6 20.6 41.2 * profit from operations before amortisation, exceptional items and acquisition related costs, interest and tax. In the first half, revenue increased by £1.5 million reflecting the full period contribution from the 2014 acquisitions along with continued strong organic growth in Continental Europe driven by Key Accounts, product segmentation and Vending growth drivers. However, this growth was offset by significant currency headwinds and sales declines in the Nordic and UK segments reflecting tough market conditions, especially in the Oil and Gas and Aerospace sectors, but also with execution and management issues affecting performance levels in the UK following the merger and restructuring activities in 2014. Underlying operating profit decreased by £3.4 million reflecting exchange headwinds, but also a decrease in gross margins of 80 basis points during the first half, partially offset by a cost reduction programme commenced in the first quarter. In the second half, revenue declined by £7.8 million and underlying operating profit decreased by £3.9 million, reflecting continued currency headwinds, worsening economic conditions, especially in the Nordic markets along with the stabilisation of the gross margin decline. For the full year, exchange rates had an adverse impact on the year’s results, reducing reported growth in revenue by 6.2% and underlying operating profit by 5.8%. Gross profit The gross profit for the year was £221.6 million (2014: £229.4 million), with gross margin decreasing by 80 basis points to 30.9% (2014: 31.7%). Margins declined by 80 basis points in the first half compared to the first half of last year reflecting insufficient commercial focus. This decline stabilised in the second half reflecting management actions put in place to improve the margin. Sales, Distribution and Administrative Expense Total reported SDA costs decreased by £3.8 million to £201.8 million (2014: £205.6 million). Excluding amortisation of acquired intangibles (“amortisation”), exceptional items and acquisition related costs, the decrease was 0.3% to £187.7 million (2014: £188.2 million). Underlying SDA at constant currency increased by 5.9% reflecting the full year contribution from acquisitions in 2014 and continuing investment in strategic growth drivers, offset by the beneficial effect of cost saving actions taken during the year. A total expenditure of £8.0 million was incurred in 2015 on strategic growth initiatives. Operating profit Operating profit decreased by £4.0 million to £19.8 million (2014: £23.8 million). Underlying operating profit decreased by £7.3 million to £33.9 million (2014: £41.2 million) reflecting currency headwinds of £2.7 million and the margin headwinds experienced this year. Underlying return on sales decreased to 4.7% (2014: 5.7%). Interest The net finance expense for the year was £6.3 million (2014: £6.1 million), which included £1.3 million (2014: £1.1 million) interest expense relating to the retirement benefit liability. £2.6 million (2014: £2.6 million) interest payable arises on long-term loan notes and £1.7 million (2014: £1.6 million) relates to loan interest. Underlying operating profit covers interest by 6.8 times (2014: 7.9 times). Profit before tax Profit before tax from continuing operations for the year was £13.5 million (2014: £17.7 million). Underlying profit before tax, but after finance expense was £27.6 million (2014: £35.1 million).

21
Tax The overall tax charge for the year of £4.0 million (2014: £6.2 million) consisted primarily of the current year charge of £4.0 million. Current year tax represents an effective tax rate of 29.6% which is higher than the expected rate of 20.25% primarily as a result of the release of deferred tax attributable to share scheme awards no longer expected to vest of £0.4 million, adjustments arising from tax losses in the year on which no benefit was recognised of £1.0 million, and miscellaneous tax adjustments of £0.4 million, offset by credits arising from adjustments to earn-out payments which did not attract tax of £0.5 million. Earnings per share Basic earnings per share decreased by 1.9p to 7.3p (2014: 9.2p) reflecting lower profit after tax and a full year impact of the effect of the share placing in 2014 on the weighted average number of shares. Underlying earnings per share decreased by 27.1% to 15.1p (2014: 20.7p) as a result of lower underlying profit and the full year weighting of the share placing in 2014. Amortisation of acquired intangibles and acquisition related costs Amortisation of acquired intangibles totalled £3.9 million (2014: £1.8 million) including a full year charge from the amortisation of intangibles arising from the acquisitions made in 2014. Acquisition related costs reflect adjustments to the assessment of deferred consideration from the prior year acquisitions, resulting in a net credit of £1.7 million. A lower level of acquisition activity resulted in decreased acquisition related costs of £0.5 million (2014: £3.0 million costs). The remaining £0.3 million (£0.1 million) relates to adjustments to previously estimated earn-outs. Exceptional items A pre-tax operating exceptional charge of £11.1 million recognised in arriving at operating profit comprises headcount and related restructuring costs, together with the costs of relocating the NDC in France and other supply chain restructuring costs. The headcount and restructuring actions reflect the Group’s continuous monitoring of its operating cost base in response to the challenging market conditions, as well as remedial actions taken in the UK, being actions required to embed operational changes to optimise the effectiveness of sales and operations organisation. In 2014, a pre-tax operating exceptional charge of £12.6 million was recognised. This included headcount, property and other restructuring costs of £5.0 million related to the closure of the Buck & Hickman NDC. A further £4.5 million charge was recognised reflecting restructuring activities in continental Europe following acquisitions during the year. Other exceptional costs comprised a goodwill impairment charge of £3.6 million in respect of the Czech business and a £0.5 million profit arising on the disposal of our remaining investment in Livingston Group Limited. Dividend Given the Board’s confidence in the Group’s proven strategy, the Board is now proposing a final dividend of 7.1 pence per share, resulting in total dividends for 2015 of 10.7 pence per share, the same as 2014 and covered 1.4 times by earnings. Subject to shareholder approval, the final dividend will be paid on 3 July 2016 to shareholders on the register at close of business on 10 June 2016. Goodwill and acquired intangible assets Goodwill in the balance sheet stands at £107.3 million at the end of the year (2014 restated: £112.0 million). This represents a decrease of £4.7 million, with adverse exchange movements of £5.2 million due to goodwill held in foreign currencies which offset additions of £0.5 million related to a small bolt on acquisition made during the year. In respect of 2014 acquisitions made in the second half of 2014 the exercise to separately identify the intangible assets acquired was completed, together with the final determination of the fair values of assets and liabilities acquired. The resulting decrease of £6.5 million has been reflected as a restating of comparative information at 31 December 2014. Impairment reviews have been performed in accordance with IAS 36 and no impairment has been identified. Acquired intangible assets in the balance sheet stand at £26.2 million at the end of the year (2014 restated: £31.0 million). This represents a decrease of £4.8 million reflecting a £3.9 million amortisation charge and a £1.0 million exchange movement on intangible assets held in foreign currencies. The 2014 comparative has been restated following the finalisation of the fair value exercise to separately identify the intangible assets acquired for the acquisitions made in the second half of 2014 resulting in an increase of £7.4 million to the opening balance.

22
Working capital There has been some decrease in underlying stock turns reflecting continued investment to support the T&GM, and Vending growth drivers, but also reflecting inventory levels that are higher than the optimum for current trading levels. As outlined above, we are targeting a £30 million inventory reduction programme during 2016. Reduced working capital from increased utilisation of factoring without recourse was used to accelerate payments to trade creditors. Return on operating capital employed The return on operating capital employed, based on underlying operating profit, was 20.9% (2014: 27.2%) mainly reflecting reduced profitability, but also an increase in the Group’s operating capital employed. Cash flow
2015 2014 £m £m
Cash inflow from operating activities before working capital change 30.6 37.2 Working capital increase (13.5) (23.5)
Cash inflow from operating activities 17.1 13.7
Cash inflow from operating activities before exceptional items and acquisition related costs 25.9 20.6 Cash outflow from acquisition related costs (0.5) (3.0) Cash outflow from exceptional items (8.3) (3.9)
Cash inflow from operating activities 17.1 13.7
Net capital expenditure (purchases net of disposals) (13.5) (16.0)
Operational cash generation/(absorption) 3.6 (2.3) Acquisitions (including net debt acquired) (0.4) (57.5) Deferred consideration and earn out on prior year acquisitions - (0.3) Tax (2.2) (7.8) Interest, dividends, pension obligations & other (21.2) (19.8) Purchase of own shares (1.9) (1.6) Net proceeds from issue of shares - 52.4
Increase in net debt (22.1) (36.9) Opening net debt (85.3) (52.9) Exchange 3.1 4.5
Closing net debt* (104.3) (85.3)
* total borrowings net of cash and cash equivalents. Net cash inflow from operating activities of £17.1 million (2014: £13.7 million) increased by £3.4 million. This inflow is after £0.5 million outflow (2014: £3.0 million) of acquisition related costs, and £8.3 million outflow (2014: £3.9 million) from exceptional items and reflects £13.5 million (2014: £23.5 million) increase in working capital, reflecting strategic investment to support T&GM and Vending during the year but also reflecting inventory levels that are higher than the optimum for current trading levels. The operating cash inflow funded the payment of £2.2 million of taxation payments and £21.2 million for dividends, interest and pension obligations. Net capital expenditure decreased by £2.5 million as levels of infrastructure investment for the UK NDC and Nordic headquarters reduced, which offset increased expenditure on InvendTM machines due to higher installation rates this year. Net debt increased by £19.0 million to £104.3 million (2014: £85.3 million). At the year end, net debt/EBITDA stood at 2.38:1 times (2014: 1.8:1 times) which is higher than our internal target. The stock reduction programme in 2016 will result in an improvement in our gearing ratio, as well as delivering the planned operational benefits.

23
Pensions The net pension liability relating to the defined benefit pension schemes decreased by £11.4 million to £27.2 million (2014: £38.6 million). The principal factors contributing to this decrease were a £9.7 million net actuarial gain on the schemes and £3.8 million of employer contributions. The principal reason for the decrease in the liabilities is the change in financial assumptions, in particular the increase in the discount rate. The main financial assumptions used for the UK scheme were a discount rate of 3.85% (2014: 3.6%), a 3.1% (2014: 3.0%) rate of increase for pensions in payment and a 2.35% (2014: 2.4%) rate of increase for pensions in deferment. The charge recognised in the income statement increased to £2.2 million (2014: £2.1 million) including a £0.2 million higher net interest charge. Financing and Covenants The Group’s operations are financed by a €120 million floating rate revolving credit facility and a $175 million (or currency equivalent) private placement shelf facility. The revolving credit facility can be drawn until it expires on 29 April 2020. In addition to the revolving credit facility, £11.3 million of undrawn overdraft facilities are available. The amount drawn under the revolving credit facility as at 31 December 2015 was £22.2 million (€30.1 million). The $175 million (or currency equivalent) private placement shelf facility was initially established in 2013. As at 31 December 2015 €115.4 million of notes had been issued under this facility. The final remaining tranche of €23 million notes were issued on 7 January 2016. All the issued notes are unsecured, bear interest at fixed rates with maturity dates ranging between 2021 and 2025.
The facilities require, among other matters, compliance with three financial covenant ratios. These requirements are (1) consolidated total net borrowings shall not exceed 3.0 times consolidated EBITDA; (2) consolidated net worth shall be not less than £50.0 million; (3) the ratio of consolidated EBITDA to consolidated net interest payable shall not be less than 4.5:1; in addition, the guarantor subsidiaries must account for more than 75% of the Group’s total gross assets, turnover and pre-tax profit. EBITDA is a measure of liquidity and is defined in the finance facilities.

24
The Future Financial year 2015 was tough for Brammer with particularly weak market conditions in the UK and Nordic regions exacerbated by execution problems in our UK business. 2016 has started in similar vein to the final quarter of 2015, with good performance on the continent being offset by continuing difficulties in the UK and Nordic regions. In response to these challenges we initiated a number of actions during 2015, which should lead to improved performance over the course of the current year. We have made management changes in our UK business and expect to see a turnaround during 2016. In our Nordic business we have accelerated the implementation of core growth drivers to help offset the declines in the offshore business. Our margin improvement programme is proceeding well, with the underlying margin on an upward trend. Our stock reduction programme has progressed well with a reduction of £6.5 million in the first two months. Whilst we expect to make progress in each of these initiatives in the current year, the positive effect of these on the Group’s earnings will be offset by the one-off impact of the focus on inventory reduction. Ian Fraser 8 March 2016

25
Brammer Preliminary results announcement
Consolidated income statement for the year ended 31 December 2015
Year to 31 December
Year to 31 December
2015 2014 Note £m £m Continuing operations Revenue 2 717.3 723.6 Cost of sales (495.7) (494.2)
Gross profit 221.6 229.4
Distribution costs (198.8) (200.8) Amortisation of acquired intangibles (“amortisation”) and acquisition related costs
(3.0) (4.8)
Total sales, distribution and administrative costs
(201.8) (205.6)
Operating profit 2 19.8 23.8
Operating profit before amortisation, acquisition related costs and exceptional items
33.9 41.2
Amortisation and acquisition related costs (3.0) (4.8) Exceptional items 4 (11.1) (12.6)
Operating profit 2 19.8 23.8
Finance expense (6.4) (6.3) Finance income 0.1 0.2
Profit before tax 13.5 17.7
Profit before tax before amortisation, acquisition related costs and exceptional items
27.6 35.1
Amortisation and acquisition related costs (3.0) (4.8) Exceptional items 4 (11.1) (12.6)
Profit before tax 13.5 17.7
Taxation (4.0) (6.2)
Profit for the year attributable to equity shareholders
2 9.5 11.5
Earnings per share - total 3 Basic 7.3p 9.2p Diluted 7.2p 8.9p
Earnings per share – pre amortisation, acquisition related costs and exceptional items
3
Basic 15.1p 20.7p Diluted 14.8p 20.2p

26
Brammer Consolidated statement of comprehensive income for the year ended 31 December 2015
2015 2014
£m £m
Profit for the year 9.5 11.5
Other comprehensive expense
Items that are not subsequently reclassified to the income statement
Actuarial gains/(losses) on pension schemes 7.7 (10.0)
Items that may be subsequently reclassified to the income statement
Net exchange differences on translating foreign operations (9.0) (11.5)
Effective portion of changes in fair value of cash flow hedges 0.1 -
(8.9) (11.5)
Other comprehensive expense for the year, net of tax (1.2) (21.5)
Total comprehensive income/(expense) for the year 8.3 (10.0)
Items in the statement above are disclosed net of tax. .
27
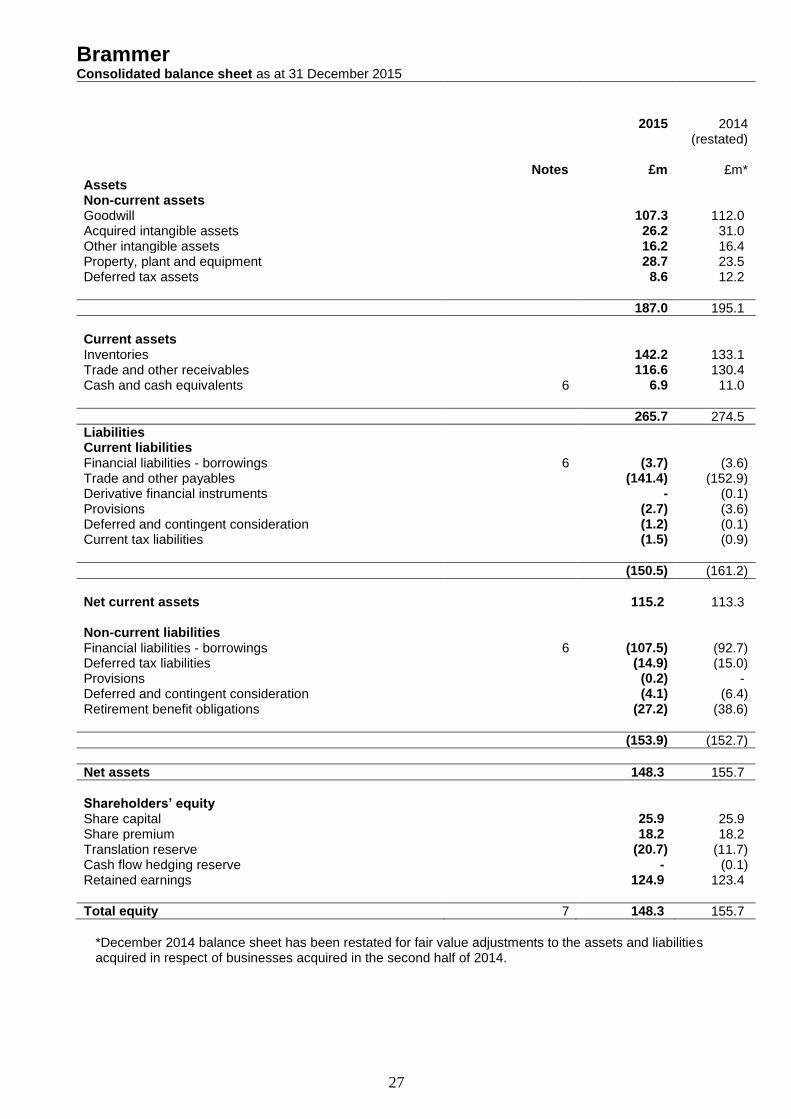
Brammer Consolidated balance sheet as at 31 December 2015
2015 2014 (restated)
Notes £m £m* Assets Non-current assets Goodwill 107.3 112.0 Acquired intangible assets 26.2 31.0 Other intangible assets 16.2 16.4 Property, plant and equipment 28.7 23.5 Deferred tax assets 8.6 12.2
187.0 195.1
Current assets Inventories 142.2 133.1 Trade and other receivables 116.6 130.4 Cash and cash equivalents 6 6.9 11.0
265.7 274.5
Liabilities Current liabilities Financial liabilities - borrowings 6 (3.7) (3.6) Trade and other payables (141.4) (152.9) Derivative financial instruments - (0.1) Provisions (2.7) (3.6) Deferred and contingent consideration (1.2) (0.1) Current tax liabilities (1.5) (0.9)
(150.5) (161.2)
Net current assets 115.2 113.3 Non-current liabilities Financial liabilities - borrowings 6 (107.5) (92.7) Deferred tax liabilities (14.9) (15.0) Provisions (0.2) - Deferred and contingent consideration (4.1) (6.4) Retirement benefit obligations (27.2) (38.6)
(153.9) (152.7)
Net assets 148.3 155.7
Shareholders’ equity Share capital 25.9 25.9 Share premium 18.2 18.2 Translation reserve (20.7) (11.7) Cash flow hedging reserve - (0.1) Retained earnings 124.9 123.4
Total equity 7 148.3 155.7
*December 2014 balance sheet has been restated for fair value adjustments to the assets and liabilities acquired in respect of businesses acquired in the second half of 2014.

28
Brammer Consolidated statement of changes in equity for the year ended 31 December 2015
Share Share Treasury Cash flow Translation Retained
Capital Premium Shares Hedging Reserve
Reserve Earnings Total
£m £m £m £m £m £m £m
Balance at 1 January 2014 23.6 18.2 (0.2) (0.1) (0.2) 87.9 129.2
Profit for the year - - - - - 11.5 11.5
Other comprehensive expense - - - - (11.5) (10.0) (21.5)
Total comprehensive expense - - - - (11.5) 1.5 (10.0)
Transactions with owners
Shares issued in respect of the placing
2.3 - - - - 50.1 52.4
Purchase of own shares - - (1.6) - - - (1.6)
Transfer on vesting of own shares
- - 1.3 - - (1.3) -
Share-based payments - - - - - 0.1 0.1
Tax credit on share performance plans
- - - - - (0.8) (0.8)
Dividend equivalents paid under share performance plans
(0.2) (0.2)
Dividends - - - - - (13.4) (13.4)
Total transactions with owners 2.3 - (0.3) - - 34.5 36.5
Movement in year 2.3 - (0.3) - (11.5) 36.0 26.5
At 31 December 2014 25.9 18.2 (0.5) (0.1) (11.7) 123.9 155.7
Profit for the year - - - - - 9.5 9.5
Other comprehensive expense - - - 0.1 (9.0) 7.7 (1.2)
Total comprehensive income - - - 0.1 (9.0) 17.2 8.3
Transactions with owners
Purchase of own shares - - (1.9) - - - (1.9)
Transfer on vesting of own shares
- - 0.6 - - (0.6) -
Share based payments - - - - - 0.8 0.8
Tax charge on share performance plans
- - - - - (0.8) (0.8)
Dividends - - - - - (13.8) (13.8)
Total transactions with owners - - (1.3) - - (14.4) (15.7)
Movement in year - - (1.3) 0.1 (9.0) 2.8 (7.4)
At 31 December 2015 25.9 18.2 (1.8) - (20.7) 126.7 148.3
29
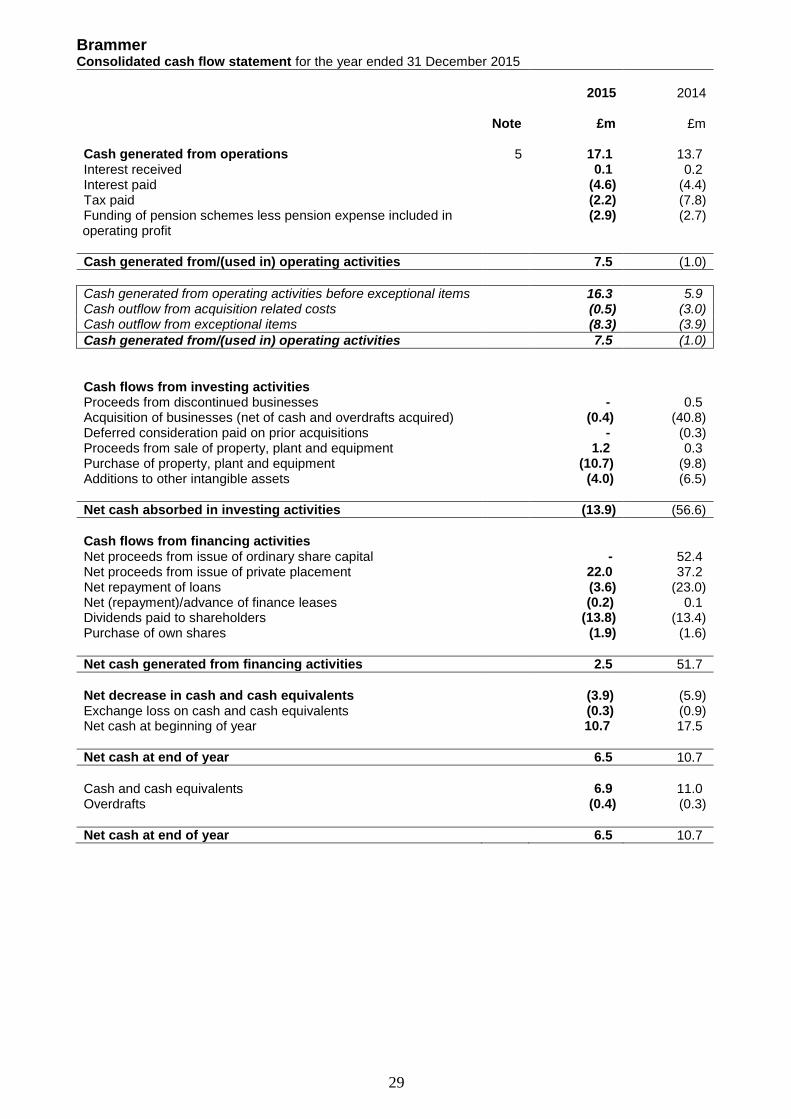
Brammer Consolidated cash flow statement for the year ended 31 December 2015
2015 2014 Note £m £m Cash generated from operations 5 17.1 13.7 Interest received 0.1 0.2 Interest paid (4.6) (4.4) Tax paid (2.2) (7.8) Funding of pension schemes less pension expense included in operating profit
(2.9) (2.7)
Cash generated from/(used in) operating activities 7.5 (1.0)
Cash generated from operating activities before exceptional items 16.3 5.9 Cash outflow from acquisition related costs (0.5) (3.0) Cash outflow from exceptional items (8.3) (3.9)
Cash generated from/(used in) operating activities 7.5 (1.0)
Cash flows from investing activities Proceeds from discontinued businesses - 0.5 Acquisition of businesses (net of cash and overdrafts acquired) (0.4) (40.8) Deferred consideration paid on prior acquisitions - (0.3) Proceeds from sale of property, plant and equipment 1.2 0.3 Purchase of property, plant and equipment (10.7) (9.8) Additions to other intangible assets (4.0) (6.5)
Net cash absorbed in investing activities (13.9) (56.6)
Cash flows from financing activities Net proceeds from issue of ordinary share capital - 52.4 Net proceeds from issue of private placement 22.0 37.2 Net repayment of loans (3.6) (23.0) Net (repayment)/advance of finance leases (0.2) 0.1 Dividends paid to shareholders (13.8) (13.4) Purchase of own shares (1.9) (1.6)
Net cash generated from financing activities 2.5 51.7
Net decrease in cash and cash equivalents (3.9) (5.9) Exchange loss on cash and cash equivalents (0.3) (0.9) Net cash at beginning of year 10.7 17.5
Net cash at end of year 6.5 10.7
Cash and cash equivalents 6.9 11.0 Overdrafts (0.4) (0.3)
Net cash at end of year 6.5 10.7

30
Brammer Accounting policies
General information
Brammer plc is a public limited company incorporated and domiciled in the UK, and listed on the London Stock Exchange. The address of the registered office is disclosed in note 8 below. The consolidated financial statements comprise the company and its subsidiaries (together referred to as the “Group”) and were approved for issue by a duly appointed and authorised committee of the Board on 8 March 2016. The statements are presented in UK sterling. Basis of preparation
The financial information set out in this Preliminary Results announcement does not comprise the Group’s statutory financial statements for the years ending 31 December 2015 and 2014 within the meaning of Section 434 of the Companies Act 2006. These consolidated financial statements have been prepared in accordance with International Financial Reporting Standards as adopted by the European Union (IFRSs as adopted by the EU), IFRIC interpretations and the Companies Act 2006 applicable to companies reporting under IFRS. The financial statements have been prepared on a going concern basis under the historical cost convention, as modified by financial assets and financial liabilities (including derivative instruments) at fair value through profit or loss under IFRS. The independent auditors’ report on these accounts is unqualified, does not contain an emphasis of matter paragraph, and does not contain any statements under section 498 (2) or (3) of the Companies Act 2006. Accounting policies
New standards, amendments to standards or interpretations
No standards have been early adopted by the Group. There has been no material impact on the Group’s consolidated financial statements from the application of new standards which are mandatory for the first time for the financial year ended 31 December 2015, or from amendments to standards or interpretations of existing standards.

31
Brammer notes to the accounts
1. COMPARATIVE RESULTS
Comparative figures for the year ended 31 December 2014 are taken from the company's statutory accounts which were delivered to the Registrar of Companies with an unqualified audit report. Copies of the 2015 Annual Report and the 2015 Interim Report are available on the company's website (www.brammer.biz).
2. SEGMENTAL ANALYSIS
The Board has been identified as the chief operating decision-maker. The Board reviews the group’s internal reporting as the basis for assessing performance and allocating resources. Management has determined the operating segments based on these reports. The group is primarily controlled on a country by country basis, in line with the legal structure. The group’s internal reporting is primarily based on performance reports run at ‘constant currency’ exchange rates. Accordingly the segment information below shows last year’s results at this year’s exchange rates with the exchange effect being a reconciling item between the segment results and the totals reported in the financial statements at actual exchange rates. The Board assesses the performance of the operating segments based on their underlying operating profit, which comprises profit before interest and taxation, excluding amortisation of acquired intangibles, acquisition related costs, and non-recurring or exceptional items such as restructuring costs and impairments when the impairment is the result of an isolated, non-recurring event. Segment assets include property, plant and equipment, other intangible assets, inventories, and trade and other receivables. All inter-segmental trading is on an arms-length basis.
UK Germany France Spain Benelux Nordic Eastern Europe &
Other
Total
£m £m £m £m £m £m £m £m Year ended 31 December 2015 Continuing operations Revenue Total revenue 280.0 121.2 88.7 54.9 52.9 45.5 85.8 729.0 Inter-company sales (1.9) (3.2) (3.4) (1.2) (1.0) (0.1) (0.9) (11.7)
Sales to external customers 278.1 118.0 85.3 53.7 51.9 45.4 84.9 717.3
Underlying operating profit 12.6 7.5 3.2 6.3 2.7 (1.3) 2.9 33.9
Amortisation of acquired intangibles (3.9) Acquisition related costs 0.9 Exceptional operating items (11.1)
Total operating profit 19.8 Finance expense (6.4) Finance income 0.1
Profit before tax 13.5 Tax (4.0)
Profit for the year 9.5
Segment assets 108.4 44.2 39.4 24.8 23.5 21.4 42.0 303.7
Goodwill 107.3 Acquired intangibles 26.2 Cash 6.9 Deferred tax 8.6
Total assets 452.7

32
2. SEGMENTAL ANALYSIS (continued) UK Germany France Spain Benelux Nordic Eastern
Europe & Other
Total
£m £m £m £m £m £m £m £m Other segment items Continuing operations Capital expenditure - other intangible assets 0.2 0.2 0.2 0.1 0.1 0.1 3.1 4.0 - property, plant and equipment 5.2 0.8 1.2 0.7 0.7 0.8 1.3 10.7
Total capital expenditure 14.7
Amortisation/depreciation - other intangible assets (0.3) (0.3) (0.1) (0.1) (0.2) (0.1) (2.8) (3.9) - property, plant and equipment (1.5) (0.4) (0.5) (0.4) (0.6) (0.3) (0.7) (4.4)
Total amortisation/depreciation (8.3)
UK Germany France Spain Benelux Nordic Eastern Europe
& Other
Total
£m £m £m £m £m £m £m Year ended 31 December 2014 Continuing operations Revenue Total revenue 283.5 112.9 80.4 46.4 49.0 48.0 71.5 691.7 Inter company sales (1.8) (2.8) (1.9) (1.7) (1.0) (0.7) (0.9) (10.8)
Sales to external customers 281.7 110.1 78.5 44.7 48.0 47.3 70.6 680.9
Exchange effect 42.7
Total sales to external customers 723.6
Underlying operating profit 15.8 6.8 4.4 5.5 2.3 1.8 1.9 38.5
Exchange effect 2.7
Total underlying operating profit 41.2 Amortisation of acquired intangibles (1.8) Acquisition related costs (3.0) Exceptional operating items (12.6)
Total operating profit 23.8 Finance expense (6.3) Finance income 0.2
Profit before tax 17.7 Tax (6.2)
Profit for the year 11.5
Segment assets 117.9 39.6 38.5 23.8 22.2 18.1 33.5 293.6
Exchange effect 9.8 303.4 Goodwill 112.0 Acquired intangibles 31.0 Cash 11.0 Deferred tax 12.2
Total assets 469.6
Other segment items Continuing operations Capital expenditure - other intangible assets 1.1 0.3 0.3 0.4 0.3 0.1 3.9 6.4 - property, plant and equipment 5.9 0.7 0.7 0.7 0.4 0.4 0.8 9.6 Exchange effect 0.3
Total capital expenditure 16.3
Amortisation/depreciation - other intangible assets (0.2) (0.3) (0.1) (0.1) (0.2) (0.1) (2.6) (3.6) - property, plant and equipment (1.9) (0.3) (0.3) (0.3) (0.5) (0.2) (0.7) (4.2) Exchange effect (0.1)
Total amortisation/depreciation (7.9)
The operating segment of Scandinavia was renamed as Nordic for management reporting with effect from 1 January 2015. The table below details the actual exchange rates used for the primary exchange rate of Sterling to Euro for the year and the comparative year:
2015 2014 Actual average rate €1.375 €1.244
Year end rate €1.357 €1.289

33
3. EARNINGS PER SHARE
2015
Earnings per share
Earnings Basic Diluted £m Weighted average number of shares in issue (‘000) 129,404 132,622
Total Profit for the financial year 9.5 7.3p 7.2p
Amortisation of acquired intangibles (“amortisation”) and acquisition related costs 3.0 Exceptional items 11.1 Tax on exceptional items (2.8) Tax on amortisation and acquisition related costs (1.2)
Earnings before amortisation, acquisition related costs and exceptional items 19.6 15.1p 14.8p
The weighted average number of shares for the year reflects the impact of shares issued as a result of the placing in April 2014 (11,300,407 ordinary shares issued). 2014
Earnings per share
Earnings Basic Diluted £m Weighted average number of shares in issue (‘000) 125,554 128,943 Total Profit for the financial year 11.5 9.2p 8.9p Amortisation and acquisition related costs 4.8 Impairment of goodwill 3.6 Exceptional items (excluding impairment of goodwill) 9.0 Tax on exceptional items (2.1) Tax on amortisation and acquisition related costs (0.8)
Earnings before amortisation, acquisition related costs and exceptional items 26.0 20.7p 20.2p
4. EXCEPTIONAL ITEMS
2015 2014
£m £m Included in operating profit: Headcount and other restructuring costs made during the year 6.4 4.5 Distribution Centre and supply chain restructuring costs 4.7 5.0 Impairment of Czech goodwill - 3.6 Proceeds from discontinued business - (0.5)
Total exceptional items 11.1 12.6
The exceptional charge of £11.1 million recognised in arriving at operating profit comprises headcount and related restructuring costs, together with the costs of relocating the National Distribution Centre in France and other supply chain restructuring costs. The headcount and restructuring actions reflect the group’s monitoring of its operating cost base in response to the challenging market conditions in which the Group operates, in order to optimise performance and headcount and continue to realise operational benefits across the Group. 2014
A total pre-tax operating exceptional charge of £12.6 million was recognised in 2014. This included the following charges arising from the final phase of integrating the Buck & Hickman business: a £2.5 million charge for property related costs upon the closure of the Buck & Hickman National Distribution Centre in Coventry and the merger of all supply chain operations in the UK, including an onerous lease provision charge of £1.2 million. A further £2.5 million charge relates to headcount restructuring from the merger of the UK supply chain and finance support functions during the year. Following the acquisitions made during the year, other restructuring activities in continental Europe resulted in further headcount and other restructuring costs of £4.5 million being incurred and recognised as an exceptional charge. These actions were taken in order to optimise our operations and realise identified synergies from the acquisitions including branch mergers, office re-locations, headcount rationalisation and charges arising from the reprofiling of stock, brands and product lines on combined stockholdings. A goodwill impairment charge of £3.6 million was made in the year in respect of the Czech business. A credit of £0.5 million was recognised relating to the profit on disposal of the remaining investment in Livingston Group Limited which had previously been fully written down. 5. CASH FLOW FROM OPERATING ACTIVITIES

34
2015 2014
£m £m
Profit for the year attributable to equity shareholders 9.5 11.5
Taxation 4.0 6.2
Depreciation/amortisation of tangible and intangible assets 12.2 9.7
Share options – value of employee services 0.8 0.1
Reduction of earn-outs relating to prior year acquisitions (1.7) -
Impairment of goodwill - 3.6
Gain on sale of property, plant and equipment and intangible assets (0.5) -
Financing expense – net 6.3 6.1
Movement in working capital (excluding the effect of exchange movements and fair value adjustments)
(13.5) (23.5)
Cash generated from operations 17.1 13.7
6. CLOSING NET DEBT
2015 2014
£m £m
Borrowings – current (3.7) (3.6)
Borrowings – non-current (107.5) (92.7)
Cash and cash equivalents 6.9 11.0
Closing net debt (104.3) (85.3)
7. CHANGES IN SHAREHOLDERS’ EQUITY
The statement of changes in shareholders’ equity is shown as a primary statement. The number of ordinary 20p shares in issue at 31 December 2015 was 129,404,481 (31 December 2014: 129,404,481). Dividends
A dividend, amounting to £9.2 million, which related to 2014 was paid on 2 July 2015 (2014: £8.8 million). An interim dividend amounting to £4.6 million (2014: £4.6 million) was paid on 5 November 2015. The directors propose a final dividend of 7.1p per share (2014: 7.1p) payable on 8 July 2016. This final dividend amounting to £9.2 million (2014: £9.2 million) has not been recognised as a liability in these financial statements. 8. PRELIMINARY ANNOUNCEMENT
A copy of the preliminary announcement is available for inspection at the registered office of the company, St Ann’s House, 1 Old Market Place, Knutsford, Cheshire, WA16 6PD and the offices of Hudson Sandler Limited, 29 Cloth Fair, London, EC1A 7NN. It will also be available on the company’s website www.brammer.biz from 8 March 2016. 9. FINAL DIVIDEND
Relevant dates concerning the payment of the final dividend are:
Annual general meeting 13 May 2016 Record date 10 June 2016 Payment date 8 July 2016
10. STATUTORY ACCOUNTS
This preliminary announcement is taken from the full audited statutory accounts which will be filed with the Registrar of Companies following the company’s annual general meeting. The statutory accounts have received an unqualified report by the auditors and do not contain any statements under section 498 (2) or (3) of the Companies Act 2006.