Embed Size (px)
Citation preview

Supporting Information
Title: Simultaneously Enhance the Molecular Planarity and the
Solubility for Non-Fullerene Acceptors: Effect of Aliphatic Side-
Chain Substitution on Photovoltaic Performance
Zhe Zhang, Miao Li, Yahui Liu, Jicheng Zhang, Shiyu Feng, Xinjun Xu,* Jinsheng
Song, * and Zhishan Bo *
Experimental Part
1. Materials and Instruments.
The catalyst precursor Pd(PPh3)4 was prepared according to the literature procedure
and stored in a Schlenk tube under nitrogen atmosphere. Unless otherwise noted, all
chemicals were purchased from Aldrich or Acros and used without further
purification. Tetrahydrofuran (THF) and toluene were distilled over sodium and
benzophenone under nitrogen atmosphere. All reactions were performed under an
atmosphere of nitrogen and monitored by thin layer chromatography (TLC) with
silica gel 60 F254 (Merck, 0.2 mm). Column chromatography was carried out on
silica gel (200-300 mesh). 1H and 13C NMR spectra were recorded on a Bruker
DM300 or AV 400 spectrometer in CDCl3. The gel permeation chromatography
(GPC) measurements were performed at 80 oC on a PL-220 (Polymer Laboratories)
chromatography connected to a differential refractometer with chlorobenzene as an
eluent. The electrochemical behavior of the compounds was investigated using cyclic
voltammetry (CHI 630A Electrochemical Analyzer) with a standard three-electrode
electrochemical cell in a 0.1 M tetrabutylammonium tetrafluoroborate solution in
acetonitrile at room temperature under an atmosphere of nitrogen with a scanning rate
of 30 mV/s. A Pt plate working electrode, a Pt wire counter electrode, and an
Ag/AgNO3 (0.01 M in CH3CN) reference electrode were used. The experiments were
calibrated with the standard ferrocene/ferrocenium (Fc) redox system and assumption
Electronic Supplementary Material (ESI) for Journal of Materials Chemistry A.This journal is © The Royal Society of Chemistry 2017

that the energy level of Fc is 4.8 eV below vacuum. UV-visible absorption spectra
were obtained on a PerkinElmer UV-vis spectrometer model Lambda 750. The
thickness of the blend films was determined by a Dektak 6 M surface profilometer.
Elemental analyses were performed on a Flash EA 1112 analyzer. Thermal
gravimetric analysis (TGA) measurements were performed on a Pyris 1 TGA
instrument under a nitrogen atmosphere at a heating rate of 10 oC/min to record the
TGA curves. DSC measurements were carried out on a DSC8000 (Perkin Elmer)
instrument with indium and zinc employed for the temperature calibration. Samples of
ca. 2.0 mg were sealed in aluminum pans, and a nitrogen gas purge with a flux of ca.
20 mL/min was used to prevent oxidative degradation of samples during the
temperature scan. The samples were heated at a rate of 10 oC/min. Atomic force
microscopy (AFM) measurements were performed under ambient conditions using a
Digital Instrument Multimode Nanoscope IIIA operating in the tapping mode and the
bright-field transmission electron microscope (TEM) images were obtained from a
TEM, Tecnai F20, FEI instrument with an accelerating voltage of 200 kV. The X-ray
diffraction (XRD) patterns were collected using a PANalytical X’Pert PRO MPD
diffractometer with Cu KR radiation.
2. Charge mobilities of blend films measured by SCLC
Hole mobilities were measured in a device configuration of ITO/PEDOT: PSS
/polymer:PC71BM/Au. The conductivity of ITO was 20 C/square. PEDOT:PSS is
Baytron Al 4083 from H. C. Starck and was filtered with a 0.45 μm polyvinylidene
difluoride (PVDF) film before use. A thin layer of PEDOT:PSS was spin-coated on
top of cleaned ITO substrate at 3000 rpm/s for 60 s and dried subsequently at 130 oC
for 15 min on a hotplate before transferred into a glove box. The thickness of the
PEDOT:PSS layer was about 40 nm. The blend of polymers and small molecules was
dissolved in DCB containing DIO in a concentration of 4 mg/mL (polymer) with the
corresponding additives, heated at 100 °C overnight to ensure the sufficient
dissolution, and then spin-coated onto PEDOT:PSS layer. The top electrode was
thermally evaporated with a 100 nm of gold at a pressure of 10-4 Pa through a shadow
mask. Dark Current-voltage characteristics were recorded using an Agilent B2902A

Source in a dark circumstance in a range of 0 V to 10.0 V. The temperature while
measuring the dark J-V curves was approximately 25 oC. The hole mobilities was
calculated according to the Mott-Gurney equation: J = 9εoεrµV2/8L3, in which d is the
thickness of active layer, εo is the vacuum dielectric constant, εris the relative
dielectric constant of polymer. Electron mobilities were measured in a device
configuration of FTO/active layer /Al. The other processes are same with hole
mobilities.
3. Polymer Solar Cell Fabrication and Characterization
PSCs were fabricated with the device configuration of (ITO) /ZnO/active
layer/MoO3/Ag. The conductivity of ITO was 20 Ω/. The ITO-coated glass substrates
were thoroughly cleaned by deionized water, acetone, and isopropanol twice
successively at first. After the substrates were dried at 150 ˚C for 15 minutes, thin
layers of sol-gel ZnO (30 nm) were spin-coated on them and then annealed at 200 ˚C
for 1 hour in the air. The blend of polymers and small molecule was dissolved in DCB
with DIO with the polymer concentration of 4 mg ml-1, and heated at 110 oC at least 5
h to ensure a sufficient dissolution, and then spin-coated onto ZnO modified glass
substrates. Followed 10 nm thick MoO3 film and 100 nm thick Al layer were
deposited sequentially to complete the inverted device. Six cells were fabricated on
one substrate with an effective area of 0.04 cm2. Current-voltage characteristics were
recorded using an Enli Technology Ltd., Taiwan (SS-F53A) AAA class solar
simulator under AM 1.5G with an intensity of 100 mW cm-2 as the white light source
and the intensity was calibrated with a standard single crystal Si photovoltaic cell. The
temperature while measuring the J-V curves was approximately 25 oC. The EQE
measurements of PSCs were performed by the solar cell spectral response
measurement system QE-R3011 (Enli Technology Ltd., Taiwan), which was
calibrated by monocrystalline silicon solar cell in advance.
4. Synthesis of polymer and small molecules
Synthesis of polymer
The donor polymer PBDB-T was synthesized according to the reported procedure.[S 2]
Synthesis of compound 1

Compound 1 was synthesized according to the reported procedure.[S 3]
Synthesis of compound 2
In a dry three-necked round-bottomed flask, compound 1 (521 mg, 0.57 mmol) was
dissolved in anhydrous THF (25 mL). The mixture was deoxygenated with argon for
30 min. At -78 °C, a solution of n -butyllithium (2.4 M in hexane, 0.59 mL, 1.42
mmol) was added dropwise. After 1 h of stirring at -78 °C, anhydrous DMF (0.18
mL) was added to this solution. The mixture was warmed to room temperature and
stirred overnight. Water (10 mL) was added and the mixture was extracted with
dichloromethane (3 × 50 mL). The organic phase was dried over anhydrous MgSO4
and filtered. After the solvent had been removed from the filtrate, the residue was
purified by column chromatography on silica gel using petroleum
ether/dichloromethane (1:1) as eluent, yielding a yellow solid (422 mg, 76%). 1 H
NMR (500 MHz, CDCl3): δ 9.94 (s, 2H), 7.68 (s, 4H), 7.49 (s, 2H), 2.07-2.11 (m, 8H),
1.95-1.98 (m, 4H), 1.05-1.45(m,56H), 0.80-0.95 (m, 18H).
Synthesis of FTIC-C8C6
Compound 2 (340 mg, 0.35 mmol) and INCN (1.02 g, 3.50 mmol) were dissolved in
dry CHCl3 (50 mL). The mixture was deoxygenated with argon gas for 30 min, and
then 1 ml pyridine were added. The mixture stirred at room temperature for 24h under
argon gas. Then, the mixture was poured into water (20 mL) and extracted with
dichloromethane (3 × 100 mL). The organic layer was washed with water, and then
dried over anhydrous MgSO4. After removing the solvent, the residue was purified
using column chromatography on silica gel employing petroleum ether/CH2Cl2 (1:1)
as an eluent, yielding a dark blue solid (370 mg, 78%). 1H NMR (500 MHz, CDCl3):
δ 9.05 (s, 2H), 8.72-8.74 (m, 2H), 7.95-7.97 (m, 2H), 7.78-7.80 (m, 4H), 7.76 (s, 2H),
7.72 (s, 2H), 7.65 (s, 2H), 2.10-2.14 (m, 8H), 1.98-2.08 (m, 4H), 1.07-1.22 (m, 56H),
0.75-0.96 (m, 18H). 13C NMR (100 MHz, CDCl3): δ 188.40, 161.97, 160.92, 156.71,
156.34, 152.31, 142.47, 140.38, 139.98, 138.70, 138.20, 136.96, 136.71, 134.96,
134.34, 125.25, 123.64, 121.23, 116.15, 115.05, 114.96, 114.49, 68.22, 54.71, 54.23,
40.45, 39.17, 31.77, 31.49, 29.93, 29.92, 29.59, 29.22, 24.36, 23.88, 22.59, 22.55,

14.07, 13.99. Anal. Calcd for: C89H102N4O2S2: N 4.23, C 80.74, H 7.77. Found: N
4.03, C 80.70, H 7.74.
Compound FTIC-C6C6 and FTIC-C6C8 were synthesized by following the same
procedure as FTIC-C8C6, yielding red-black solid (83%, 87%), respectively.
References
S 1 M. J. Frisch, G. W. Trucks, H. B. Schlegel, G. E. Scuseria, M. A. Robb, J. R.
Cheeseman, G. Scalmani, V. Barone, B. Mennucci, G. A. Petersson, H. Nakatsuji,
M. Caricato, X. Li, H. P. Hratchian, A. F. Izmaylov, J. Bloino, G. Zheng, J. L.
Sonnenberg, M. Hada, M. Ehara, K. Toyota, R. Fukuda, J. Hasegawa, M. Ishida,
T. Nakajima, Y. Honda, O. Kitao, H. Nakai, T. Vreven, J. A. J. Montgomery, J.
E. Peralta, F. Ogliaro, M. Bearpark, J. J. Heyd, E. Brothers, K. N. Kudin, V. N.
Staroverov, R. Kobayashi, J. Normand, K. Raghavachari, A. Rendell, J. C.
Burant, S. S. Iyengar, J. Tomasi, M. Cossi, N. Rega, J. M. Millam, M. Klene, J. E.
Knox, J. B. Cross, V. Bakken, C. Adamo, J. Jaramillo, R. Gomperts, R. E.
Stratmann, O. Yazyev, A. J. Austin, R. Cammi, C. Pomelli, J. W. Ochterski, R. L.
Martin, K. Morokuma, V. G. Zakrzewski, G. A. Voth, P. Salvador, J. J.
Dannenberg, S. Dapprich, A. D. Daniels, O. Farkas, J. B. Foresman, J. V. Ortiz, J.
Cioslowski and G. D. J. Fox, Gaussian 09W, Revision D.01; Gaussian, Inc.,
Wallingford, CT, 2013.
S 2 D. Qian, L. Ye, M. Zhang, Y. Liang, L. Li, Y. Huang, X. Guo, S. Zhang, Z. Tan
and J. Hou, Macromolecules, 2012, 45, 9611-9617.
S 3 C. Y. Chang, Y. J. Cheng, S. H. Hung, J. S. Wu, W. S. Kao, C. H. Lee and C. S.
Hsu, Adv. Mater., 2012, 24, 549-553.


Fig. S1 1H and 13C NMR spectras in CDCl3.
100 200 300 400 500 600
405060708090
100
Wei
ght (
%)
Temperature (oC)
FTIC-C8C6 FTIC-C6C6 FTIC-C6C8
Fig. S2 Thermogravimetric analysis plot of three small molecules.

100 150 200 250 300
-4
-2
0
2
4
Temperatrue(oC)
Heat
floa
t(mW
/g)
FTIC-C8C6 FTIC-C6C6 FTIC-C6C8
Fig.S3 DSC curves of three small molecules powdery samples.
Fig. S4 Films XRD curves of PBDB-T, three small molecules and blend films.

300 400 500 600 700 8000.0
0.5
1.0
1.5
2.0
2.5
Wavelength (nm)
Abso
rptio
n
FTIC-C6C6 FTIC-C8C6 FTIC-C6C8
Fig. S5 UV-visible absorption spectra of FTIC-C8C6, FTIC-C6C6 and FTIC-C6C8 in
chloroform.
Fig. S6 Photoluminescence spectra (excitation wavelength 654 nm): (a) FTIC-C8C6,
(b) FTIC-C6C6, (c) FTIC-C6C8, (d) PBDB-T, (e) PBDB-T:FTIC-C8C6, (f) PBDB-
T:FTIC-C6C6 and (g)PBDB-T: FTIC-C6C8.
Fig. S7 Cyclic voltammetry plots of FTIC-C8C6, FTIC-C6C6 and FTIC-C6C8 thin
films (a) and PBDB-T thin film (b)

400 600 8000.0
0.2
0.4
0.6
0.8
1.0
1.2
Nor
mal
ized
Wavelength / nm
Exp. data of 66 FTIC-TD
0
1
2
3
4
Osc
. str
engt
h
Fig. S8 Normalized optical absorption spectra of FTIC-2 in chloroform solution:
measured spectra (dash line); spectra computed within the TD-DFT/PCM approaches
based on B3LYP (red solid line).
Fig. S9 J-V (a) and EQE (b) curves of FTIC-C8C6, FTIC-C6C6 and FTIC-C6C8
based devices without PFN-Br interlayer.

400 500 600 700 800
0.0
0.2
0.4
0.6
0.8
1.0
Wavelength(nm)No
rmal
ized
abso
rban
ce(a
.u.)
FTIC-C6C6 FTIC-C8C6 FTIC-C6C8
Fig. S10 UV-vis spectra of the blend films of PBDB-T with FTIC-C8C6, FTIC-C6C6
and FTIC-C6C8.
2.0 2.5 3.0 3.5 4.0 4.5 5.020
30
40
50
60
J1/2
A1/2
m-1
V / V
FTIC-C8C6 FTIC-C6C6 FTIC-C6C8
a
1.5 2.0 2.5 3.0 3.55
10
15
20
25
30 FTIC-C8C6 FTIC-C6C6 FTIC-C6C8
J1/2
A1/2
m-1
V / V
b
Fig. S11 ln(J1/2/A1/2) vs (V) plot of the blends for the hole mobility (a) and electronic
mobility (b) by SCLC method.
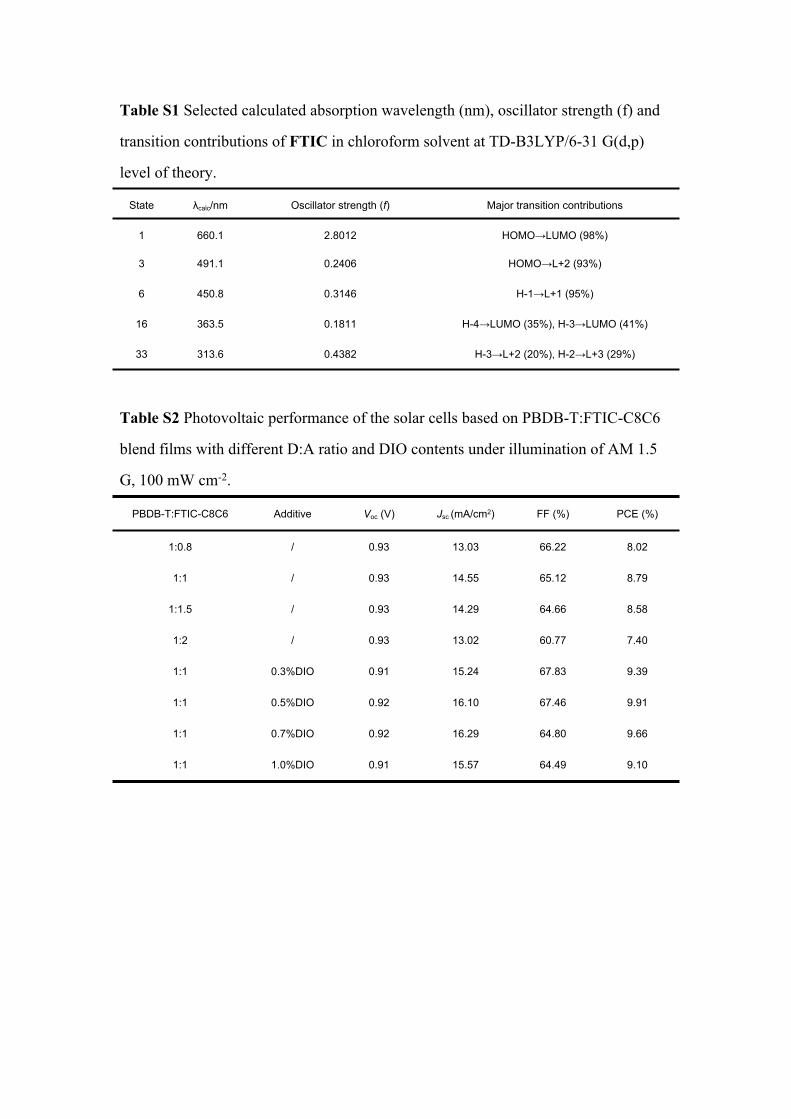
Table S1 Selected calculated absorption wavelength (nm), oscillator strength (f) and
transition contributions of FTIC in chloroform solvent at TD-B3LYP/6-31 G(d,p)
level of theory.
State λcalc/nm Oscillator strength (f) Major transition contributions
1 660.1 2.8012 HOMO→LUMO (98%)
3 491.1 0.2406 HOMO→L+2 (93%)
6 450.8 0.3146 H-1→L+1 (95%)
16 363.5 0.1811 H-4→LUMO (35%), H-3→LUMO (41%)
33 313.6 0.4382 H-3→L+2 (20%), H-2→L+3 (29%)
Table S2 Photovoltaic performance of the solar cells based on PBDB-T:FTIC-C8C6
blend films with different D:A ratio and DIO contents under illumination of AM 1.5
G, 100 mW cm-2.
PBDB-T:FTIC-C8C6 Additive Voc (V) Jsc (mA/cm2) FF (%) PCE (%)
1:0.8 / 0.93 13.03 66.22 8.02
1:1 / 0.93 14.55 65.12 8.79
1:1.5 / 0.93 14.29 64.66 8.58
1:2 / 0.93 13.02 60.77 7.40
1:1 0.3%DIO 0.91 15.24 67.83 9.39
1:1 0.5%DIO 0.92 16.10 67.46 9.91
1:1 0.7%DIO 0.92 16.29 64.80 9.66
1:1 1.0%DIO 0.91 15.57 64.49 9.10

Table S3 Photovoltaic performance of the solar cells based on PBDB-T:FTIC-C6C6
blend films with different D:A ratio and DIO contents under illumination of AM 1.5
G, 100 mW cm-2.
PBDB-T:FTIC-C6C6 Additive Voc (V) Jsc (mA/cm2) FF (%) PCE (%)
1:0.8 / 0.91 14.92 61.72 8.37
1:1 / 0.91 14.80 65.58 8.84
1:1.5 / 0.92 15.25 60.93 8.52
1:2 / 0.92 13.08 62.98 7.55
1:1 0.1%DIO 0.91 15.76 63.04 9.09
1:1 0.3%DIO 0.91 16.03 63.17 9.18
1:1 0.5%DIO 0.91 15.77 63.99 9.14
1:1 0.7%DIO 0.90 16.26 59.68 8.77
Table S4 Photovoltaic performance of the solar cells based on PBDB-T:FTIC-C6C8
blend films with different D:A ratio and DIO contents under illumination of AM 1.5
G, 100 mW cm-2.
PBDB-T:FTIC-C6C8 Additive Voc (V) Jsc (mA/cm2) FF (%) PCE (%)
1:0.8 / 0.92 15.88 52.03 7.60
1:1 / 0.94 14.73 65.18 9.02
1:1.5 / 0.94 14.89 61.36 8.56
1:2 / 0.94 14.54 59.24 8.13
1:1 0.3%DIO 0.92 17.17 62.86 9.86
1:1 0.5%DIO 0.92 17.44 64.10 10.26
1:1 0.7%DIO 0.91 16.54 63.36 9.58
1:1 1.0%DIO 0.90 16.50 61.72 9.20

Table S5 The optimized photovoltaic parameters of devices based on PBDB-T and
other state-of-the-art NFAs under the illumination of AM 1.5G, 100 mW cm-2.
Acceptors Additive Voc (V) Jsc (mA/cm2) FF (%) PCEmax (%)
/ 0.87 15.80 63.78 8.73a)
ITIC0.5% DIO 0.86 19.00 61.30 10.04a)
FDICTF 0.3% DIO 0.940.01 15.840.28 661 10.06b)
IT-M 1% DIO 0.94 17.44 73.5 12.05c)
a) Tested in our laboratary.
b) Data obtained from Ref. 40 (Adv. Mater., 2016, DOI: 10.1002/adma.2016049644).
c) Data obtained from Ref. 15 (Adv. Mater., 2016, 28, 9423).


![and Effective Antibacterial Activity Electronic Supplementary ... · maleate]∙AgNO3, AgNO3 and PVM/MA were prepared with LB broth in the 15 mL of cultivation tubes. Then, 5 L of](https://img.pdfslide.us/doc/110x75/6074391d9303e76b8015f624/and-effective-antibacterial-activity-electronic-supplementary-maleateaagno3.jpg)