Embed Size (px)
Citation preview

Abstraction & Application 8 (2013) 6-17 UADY
Chagas Parasites Detection throughGaussian Discriminant Analysis
Vıctor Uc-Cetina1, Carlos Brito-Loeza1, Hugo Ruiz-Pina2
1Facultad de Matematicas, UADY2Centro de Investigaciones Regionales Dr. Hideyo Noguchi, UADY
[email protected], [email protected], [email protected]
Abstract
Visual detection of Chagas parasites through microscopic inspection is a tedious and time-consuming
task. In this paper we provide an algorithm based on Gaussian discriminant analysis for the task of
Chagas parasites detection in blood sample images. We give details of the algorithm and our experimental
results. With this method we obtained a true-positive rate of 0.9833 and a false-positive rate of 0.1563.
1 Introduction
According to the World Health Organization [18], Chagas disease, also known as American trypanosomiasis,is a potentially life-threatening illness caused by the protozoan parasite, Trypanosoma cruzi (T. cruzi). It isfound mainly in Latin America, where it is mostly transmitted to humans by the faeces of triatomine bugs,known as ’kissing bugs’ , among other names, depending on the geographical area. An estimated 10 millionpeople are infected worldwide, mostly in Latin America where Chagas disease is endemic. More than 25million people are at risk of the disease. It is estimated that in 2008 Chagas disease killed more than 10,000people.
Some of the key factors of the Chagas disease are: 1) An estimated 10 million people are infectedwith Trypanosoma cruzi worldwide, mostly in Latin America, 2) Chagas disease is curable if treatment isinitiated soon after infection, and 3) Blood screening is vital to prevent infection through transfusion andorgan transplantation.
Chagas disease presents itself in two phases. The initial acute phase lasts for about two months afterinfection. During the acute phase, a high number of parasites circulate in the blood. In most cases, symptomsare absent or mild, but can include fever, headache, enlarged lymph glands, pallor, muscle pain, difficultyin breathing, swelling and abdominal or chest pain. In less than 50% of people bitten by a triatomine bug,characteristic first visible signs can be a skin lesion or a purplish swelling of the lids of one eye. During thechronic phase, the parasites are hidden mainly in the heart and digestive muscle. Up to 30% of patientssuffer from cardiac disorders and up to 10% suffer from digestive (typically enlargement of the oesophagusor colon), neurological or mixed alterations. In later years the infection can lead to sudden death or heartfailure caused by progressive destruction of the heart muscle.
1998 ACM Computing Classication System. I.5.1 [Pattern Recognition] Models.Keywords and phrases : Classification, Gaussian discriminant analysis.
6

V. Uc-Cetina, C. Brito-Loeza, H. Ruiz-Pina 7
1.1 The Chagas parasite detection problem
Depending on the phase of the disease some tests can be useful for making a diagnosis. According to [10] themost typical tests used for the diagnosis of the Chagas disease are: blood culture, chest x-ray echocardiogram,electrocardiogram (ECG), enzyme-linked immunoassay (ELISA), and peripheral blood smears.
Among these methods, we are interested in the peripheral blood smears. A peripheral blood smearis basically a glass microscope slide coated on one side with a thin layer of venous blood. The slide isstained with a dye, usually Wrights stain, and examined under a microscope. Visual detection of theChagas parasite through microscopic inspection of peripheral blood smears is a time-consuming and laboriousprocess, however it is the most widely used technique for parasitemia determination.
1.2 Previous work
Up to date, one of the most effective ways of detecting the Chagas disease in its initial phase is through theELISA test. However, some other methods have been shown to work with very high accuracy as well. InPonce et al. [12] the Chagas Stat-Pak rapid immunochromatographic test is introduced. Such rapid methodwas tested on 5,998 serum samples taken from Central America. This method showed 0.996 and 0.999sensitivity and specificity, respectively, which is a performance comparable to that obtained with ELISA.
On the other hand, Chagas detection using machine learning and automatic image analysis is, to thebest of our knowledge, not yet formally studied as it can be deduced from the lack of publications on thistopic. However, some studies relating machine learning methods and the T. Cruzi parasite have been done,as reported by Gonzalez et al. in [6]. In this work different machine learning methods were trained andused to automatically classify coding gene sequences based on their functional roles as adhesins, a type ofprotein. In such research work the feature vector employed for the machine learning algorithms consisted of a47-dimensional vector of features extracted from nuclear protein sequences. Therefore, they never employeddigital images or features extracted from digital images for their machine learning classification methodology.Alternatively Romero et al. [13] introduced an off-axis holographic microscope calibrated to automate thetask of detecting the presence of Trypanosoma cruzi in blood through the measurement of the phase shiftproduced by such microorganisms on the transmitted wave front. The detection method is based on temporaldifferences between digital holograms and none machine learning method is employed. A similar work forthe automated detection of Trypanosoma cruzi based also on temporal differences is given in [1].
Although none studies using machine learning and computer vision methods have been reported yet forthe detection of the Chagas parasite, they have been extensively used for the detection of the Malaria parasite[9, 4, 16, 7, 3, 14, 15]. In [9] an image classification system is designed to identify malaria parasites present inthin blood smears and differentiate the species of malaria. Morphological and threshold selection techniquesare used to identify erythrocytes and possible parasites present on microscopic slides. Image features basedon color, texture and the geometry of the cells and parasites are generated, as well as features that mimicfeatures used by human technicians. A two-stage tree classifier using back propogation feed forward neuralnetworks distinguishes between true and false positives, and then diagnoses the species of the infection.
The study provided in [4] presents a method for quantification and classification of erythrocytes in stainedthin blood films infected with Plasmodium falciparum (malaria parasite). The proposed approach is com-posed of three main phases: a preprocessing step, which corrects luminance differences. A segmentationstep that uses the normalized RGB color space for classifying pixels either as erythrocyte or backgroundfollowed by an Inclusion-Tree representation that structures the pixel information into objects, from whicherythrocytes are found. Finally, a two step classification process identifies infected erythrocytes and differen-tiates the infection stage, using a trained bank of classifiers. Additionally, user intervention is allowed whenthe approach cannot make a proper decision. Four hundred fifty malaria images were used for training andevaluating the method. Automatic identification of infected erythrocytes showed a specificity of 0.997 anda sensitivity of 0.94. The infection stage was determined with an average sensitivity of 0.788 and averagespecificity of 0.912.
In [16] the images acquired from Giemsa-stained peripheral blood samples are transformed to match
8 Chagas Parasites Detection through Gaussian Discriminant Analysis
a reference image color characteristics. Then, a parasite detector is built using a Bayesian pixel classifierthat marks stained pixels. The class conditional probability density functions of the stained and the non-stained classes are estimated using the non-parametric histogram method. The stained pixels are furtherprocessed to extract features (histogram, Hu moments, relative shape measurements, color auto-correlogram)for a parasite or non-parasite classifier. A distance weighted K-nearest neighbour classifier is trained withthe extracted features achieving 0.74 sensitivity, 0.98 specificity, 0.88 positive prediction, and 0.95 negativeprediction values for the Malaria parasite detection.
Another technique is proposed in [7], based on pattern matching with parameter optimization and cross-validation against the expected biological characteristics of red blood cells. In a final stage, the parasitaemiameasurement is carried out by partitioning the uninfected and infected cells using an unsupervised method.The obtained estimates were analyzed with respect to manually acquired results from professionals. Redblood cells detection resulted in precision and recall rates of 0.80 - 0.88 and 0.92 - 0.98, respectively. Byusing a training-based method, the precision and recall rates were improved to 0.92 and 0.95, respectively.
The first aim of the system presented in [3] is to detect malaria parasites by means of an automaticthresholding based on a morphological approach. A major requirement of the whole system is an efficientmethod to segment cell images. The methods employed make use of knowledge of the red blood cell structure,that is not used in other existing watershed-based algorithms. Two different classification methods areprovided, one based on morphological operators and another one based on color histogram similarity.
In [15] a software called MalariaCount is presented. It automatically generates parasitemias from imagesof Giemsa-stained blood smears. The potential application and robustness of MalariaCount was tested innormal and drug-treated in vitro cultures of Plasmodium falciparum. The results showed a tight correlationbetween MalariaCount and manual count parasitemia values. These findings suggest that MalariaCountcan potentially be used as a tool to provide rapid and accurate determination of parasitemia in researchlaboratories where frequent, large-scale, efficient determination of parasitemia is required.
In addition to detection algorithms, some authors have developed complete automated systems. In [8] anautomated system to identify and analyze parasite species on thick blood films by image analysis techniques ispresented. The system comprises two main components: (1) Image acquisition unit and (2) Image analysismodule. The authors have developed an image acquisition system that can be easily mounted on mostconventional light microscopes. It automatically controls the movement of the microscope in 3-directionalplanes. The vertical adjustment (focusing) can be made in a nanometer range (7-9 nm). Images are acquiredwith a digital camera that is installed at the top of microscope. The captured images are analyzed by animage analysis software which utilizes the state-of-the-art algorithms to detect and identify malaria parasites.
Other works related to the application of pattern recognition methods for images taken with microscopesare those used for the detection of special types of cells such as cancerous cells [17] and cervical cells [11]. Inthe first work the authors used the shape, size and texture of the cells to perform a classification, meanwhilein the second work a K-means clustering algorithm for designing binary tree classifiers is used, along withthe Bhattacharyya distance metric.
2 Materials and methods
The results we provide in this paper were obtained using a typical pattern recognition methodology [2], usingtraining and testing sets of images. We had available for our study a total of 120 color images of size 256×256.60 of these images were specially selected to contain a Chagas parasite. Meanwhile the other 60 remainingimages were selected to contain none parasites. Using these images we performed machine learning to getour basic classifier algoritm, which was then used for the more general Chagas parasite detection process. Inthe next section we provide the details of the Chagas detection process, leaving the details of the machinelearning training and testing part for the next section.

V. Uc-Cetina, C. Brito-Loeza, H. Ruiz-Pina 9
2.1 Method overview
Our image analysis and detection process involves two main stages: (1) the image preprocessing and (2) aprocess for the detection of Chagas parasites.
1. Preprocessing the image consists in converting the original 256 × 256 RGB (Red-Green-Blue) imagesto 256× 256 images formed exclusively with the information provided by the green component of theoriginal image, resulting in what we call green-channel images.
2. The process of detecting Chagas parasites is the main contribution of this paper and it requires thespecification of three procedures:
(a) One procedure is needed for extracting features which are good at representing important char-acteristics of a set of pixels, relevant to the parasite detection problem.
(b) A second procedure is required for classifying a set of pixels represented by a feature vector, asbeing a parasite or a non-parasite.
(c) The third and last procedure is used to guide the search for parasites in the green-channel images.
2.2 Image acquisition
A group of mice were infected with an inoculation of 5 blood trypomastigotes of T. cruzi via intraperitoneal.Once the mice were infected, the parasitaemia detection started in average between 11 and 15 days afterwards.At this time the blood smears were prepared and stained using Wright stain, which allows the observation ofthe morphology of different blood cells, as well as parasites such as T. Cruzi, Leishmania sp., Plasmodiumsp., etc. After the staining process the blood smears were placed vertically and were left to dry. Finally,an optical Nikon Eclipse E600 microscope was used to take images under typical laboratory illuminationconditions. First at 10X and then at 100X, with a resulting size increase of 1000 times. Note that the imagesreceived no special treatment other than their conversion to RGB format.
2.3 Feature extraction
Feature extraction is an essential preprocessing step to pattern recognition and machine learning problems.It consists in transforming some input data into a reduced set of features, also called features vector. If thefeatures extracted are carefully chosen it is expected that the features set will extract the relevant informationfrom the input data in order to perform the pattern recogniton task using this reduced representation insteadof the full size input.
The issue of choosing the features to be extracted was guided mainly by the following two concerns:
� the features should carry enough information about the image and should not require any domain-specific knowledge for their extraction.
� they must be easy to compute in order for the approach to be feasible for a large image collection andrapid computation.
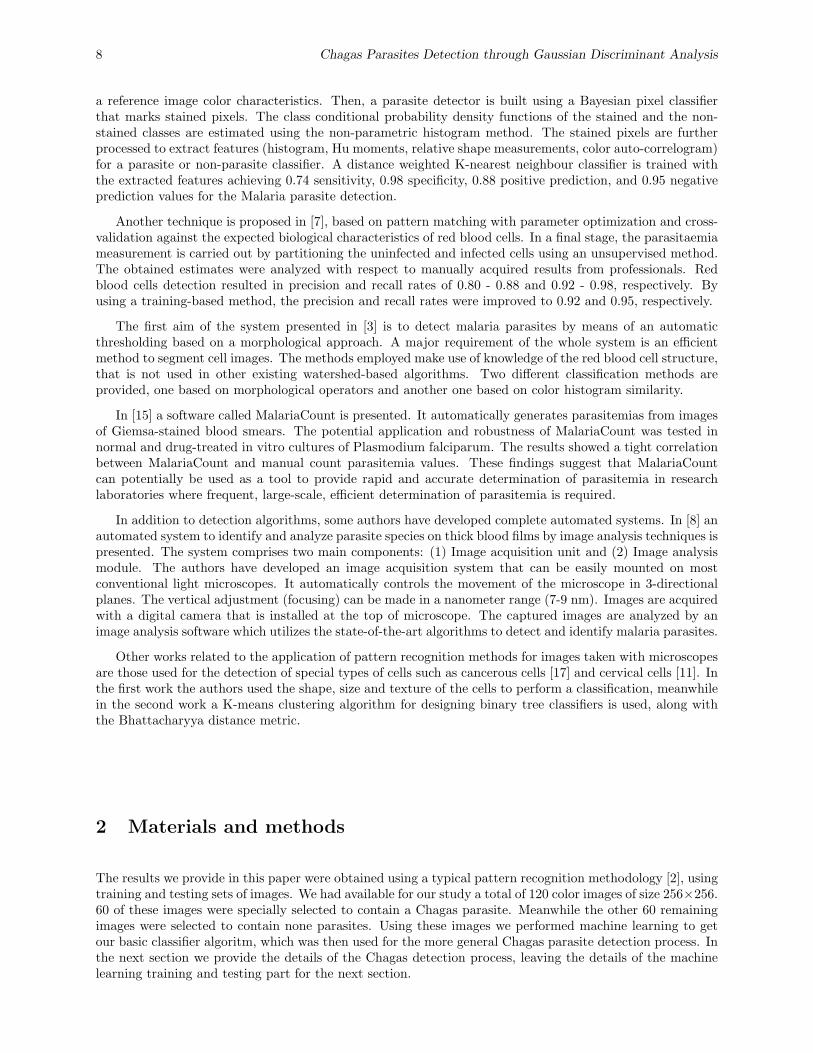
Based on these premises, we focused our attention on one dark spot of pixels appearing in all parasites’bodies. This spot which is shown in Fig. 1a, corresponds to an accumulation of DNA of the Chagas parasite.With a closely observation, we can see that it has one particular shape, shown as a surface in Fig. 1b. Tocapture this particular shape we decided to take a matrix of 11× 11 pixels, centered around the pixel withthe lowest value. Then this matrix is converted into a 121-dimensional vector by taking every row of it,transposing them and attaching one after the other. Such a vector of size 121 was used as our featuresvector. Figures 1c and 1d illustrate the DNA characteristical spot of two other parasites.

10 Chagas Parasites Detection through Gaussian Discriminant Analysis
(a) (b)
(c) (d)
Figure 1: (a) Dark spot of pixels generated by an accumulation of DNA. (b, c, d) Three DNA spotscorresponding to different parasites, seen as surfaces of 11× 11 pixels.
V. Uc-Cetina, C. Brito-Loeza, H. Ruiz-Pina 11
2.4 Classification
Consider a classification problem in which we want to distinguish between a set of pixels corresponding toa Chagas parasite (y = 1) and a set of pixels that does not correspond to a Chagas parasite (y = 0), basedon some features of such set of pixels. In Gaussian discriminant analysis first we need to build a model ofwhat a Chagas parasite looks like and what something that is not a Chagas parasite looks like. Finally, toclassify a new set of pixels in parasite or non-parasite we just need to match the new set of pixels with ourtwo models, to see whether it looks more like a parasite or more like the non-parasites we have seen in thetraining set. Our algorithm try to model p(x|y) and p(y). For instance, if y indicates whether a example isa parasite (y = 1) or a non-parasite (y = 0), then p(x|y = 1) models the distribution of parasites’ features,and p(x|y = 0) models the distribution of non-parasites’ features. After modeling p(y) and p(x|y), which arecalled the class priors, our algorithm can then use the Bayes rule to derive the posterior distribution on ygiven x:
p(y|x) = p(x|y)p(y)p(x)
. (2.1)
Here, the denominator is given by p(x) = p(x|y = 1)p(y = 1) + p(x|y = 0)p(y = 0). However, if we arecalculating p(y|x) in order to make a prediction, then we do not actually need to calculate the denominator,since
argmaxy
p(y|x) = argmaxy
p(x|y)p(y)p(x)
(2.2)
= argmaxy
p(x|y)p(y). (2.3)
In our model we assume that p(x|y) is distributed according to a multivariate normal distribution. Sucha strong assumption is later shown to provide quite good results for our data. It is well known in machinelearning that choosing an optimal model for a given data set can become sometimes more an art than ascience, depending on the chosen algorithm. However, it is widely accepted the use of cross-validation as arobust way to measure the performance of machine learning methods.
The multivariate normal distribution in n-dimensions is parameterized by a mean vector µ ∈ Rn and acovariance matrix Σ ∈ Rn×n where its density is given by:
p(x;µ,Σ) =1
(2π)n/2|Σ|1/2e−
12 (x−µ)TΣ−1(x−µ). (2.4)
Then, writing out the distributions for each class of target, parasite or non-parasite, we have:
p(x|y = 0) =1
(2π)n/2|Σ|1/2e−
12 (x−µ0)
TΣ−1(x−µ0). (2.5)
p(x|y = 1) =1
(2π)n/2|Σ|1/2e−
12 (x−µ1)
TΣ−1(x−µ1). (2.6)
To estimate the parameters µ0, µ1 and Σ we compute:
µ0 =
∑mi=1 1{y(i) = 0}x(i)∑m
i=1 1{y(i) = 0}, (2.7)

12 Chagas Parasites Detection through Gaussian Discriminant Analysis
µ1 =
∑mi=1 1{y(i) = 1}x(i)∑m
i=1 1{y(i) = 1}, (2.8)
and
Σ =1
m
m∑i=1
(x(i) − µy(i))(x(i) − µy(i))T , (2.9)
where m is the number of training examples. At this point we know how to compute p(x|y), now we justneed to compute p(y), which is done as follows. For the prior probability of finding a Chagas parasite wecompute:
p(y = 1) =1
m
m∑i=1
1{y(i) = 1}, (2.10)
and for the prior probability of finding a non-parasite we do:
p(y = 0) =1
m
m∑i=1
1{y(i) = 0} = 1− p(y = 1). (2.11)
Once we have computed the 4 probabilities: p(x|y = 0), p(x|y = 1), p(y = 0) and p(y = 1), we just needto evaluate the Bayesian models given by equation (2.3), in order to make a classification of a features vectoras being a parasite or a non-parasite.
2.5 Search
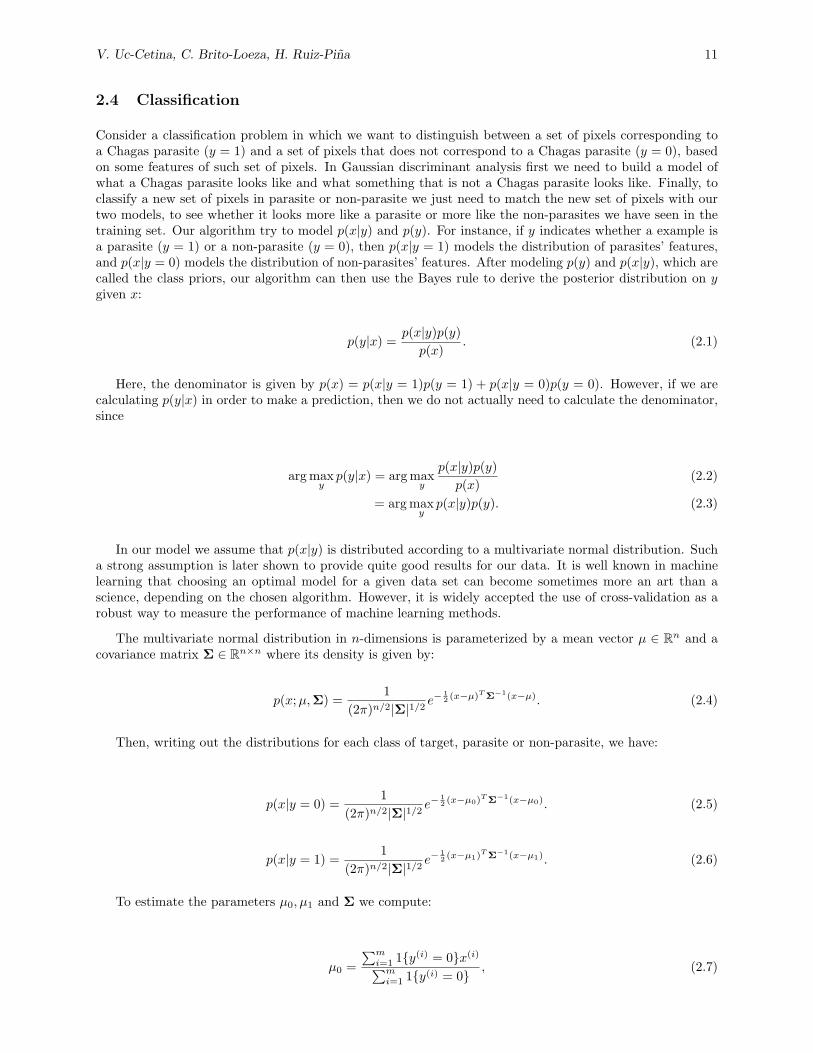
After a visual examination of several images containing parasites, we realized that in many cases the DNAspot was the darkest point in the image, meaning that if we view each green-channel image as a surfacecreated from its pixels’ values, the DNA spots were very often local minima, sometimes they were actuallythe global minimum, as it is the case in the surface provided in Fig. 2. Therefore it is very convenient tostart looking for parasites in places of the image where dark points exist, i.e. local minima. Our searchalgorithm is given next.
1. Find the global mimimum x.
2. Compute evaluation with the parasite model.
3. Compute evaluations with the non-parasite model.
4. Make classification.
5. If x is classified as a parasiteprint ’I have found a parasite’ and stop.
elseeliminate current global minimum.
6. If the upper search limit has been reachedprint ’I have not found a parasite’ and stop.
elsego to step 1.

V. Uc-Cetina, C. Brito-Loeza, H. Ruiz-Pina 13
Figure 2: A green-channel image plotted as a surface. The global minimum of this image corresponds to theDNA spot of the Chagas parasite.
It is important to mention that the size of the feature vector x was originally 121, and then it wasreduced to 10 through the use of Principal Component Analysis (PCA) [5]. Moreover, the upper search limitis a threshold value of pixel intensities which is computed experimentally from the training set. For ourexperimental work this threshold was defined as 100. The main bottleneck of the search algorithm, in termsof performance, is its sequential implementation. The time complexity is mainly a function of the numberN of local minima found below the upper search limit, this is O(N).
3 Experimental results
Three different setups were used to experimentally validate our classification algorithm and in all three ofthem we applied the cross-validation approach. The experiments were run in a computer with an Intel Corei5 processor (3.20 GHz) and 4GB of RAM. The time to scan a whole image of 256×256 pixels ranged between30 and 180 seconds, depending on the number of existing local minima. In other words, images with manydark regions, contain many low-frequency pixels and therefore the search algorithm requires more time tocheck each of them until a parasite is found or the upper search limit is reached. The search algorithm canbe implemented to be run in parallel hardware, such as GPUs, in order to obtain a substantial improvementin the processing time, however the work reported in this article is focused on finding an optimal machinelearning model and a functional feature vector.
Cross-validation is one of several approaches to estimating how well the model we have just learned fromsome training data is going to perform on future unseen data, in this work we used n-fold cross-validation.In n-fold cross-validation the examples in the input data are randomly divided into n equal partitions orsets; n− 1 partitions are used for training, and the remaining 1 partition is used for testing. The process isrepeated n times, with a different partition being used for testing in each iteration. Thus, each partition isused at least once in training and once in testing, and the average results are reported.
In the first setup each training example was a 121-dimensional vector, containing the features explainedin the previous section. There were two Gaussian models, one model for what a parasite looks like andanother for what something that is not a parasite looks like. Results are shown in Table 1.

14 Chagas Parasites Detection through Gaussian Discriminant Analysis
Test 1 Test 2 Test 3 Test 4 Mean
True positive 0.9333 1.0000 0.8666 0.8666 0.9166False positive 0.4666 0.4000 0.0666 0.2666 0.2999True negative 0.5333 0.6000 0.9333 0.7333 0.6999False negative 0.0600 0.0000 0.1333 0.13330 0.0833
Table 1: Cross validation results using 4 partitions. Each partition with 15 positive and 15 negative examples.The input feature vector is in dimension 121.
In the second experimental setup we reduced the dimensions of the features vector from 121 to 10 by theapplication of PCA. We kept the use of two models, one for parasites and one for non-parasites. Results areshown in Table 2.
Test 1 Test 2 Test 3 Test 4 Mean
True positive 1.0000 1.0000 0.9333 1.0000 0.9833False positive 0.2000 0.0000 0.2000 0.1333 0.1333True negative 0.8000 1.0000 0.8000 0.8666 0.8666False negative 0.0000 0.0000 0.0666 0.0000 0.0166
Table 2: Cross validation results using 4 partitions. Each partition with 15 positive and 15 negative examples.The input feature vector was reduced to 10 dimensions through the use of PCA. Results in this table wereobtained using two Gaussian models, one for parasites and one for non-parasites.
For the last series of experiments we kept the reduced size of the features vector, but instead of using twoGaussian models, we added one more. The third model introduced allowed us to make the strong assumptionthat those things appearing in the images and that are not parasites, could be clustered in two differentgroups, non-parasites type A and non-parasites type B. Results are shown in Table 3.
Test 1 Test 2 Test 3 Test 4 Mean
True positive 1.0000 1.0000 1.000 1.000 1.000False positive 0.2500 0.3055 0.5000 0.0833 0.2847True negative 0.7500 0.6944 0.5000 0.9166 0.7152False negative 0.0000 0.0000 0.0000 0.0000 0.0000
Table 3: Cross validation results using 4 partitions. Each partion with 15 positive and 15 negative examples.The input feature vector is in dimension 10. Three Gaussian models were used, one for parasites and twofor non-parasites.
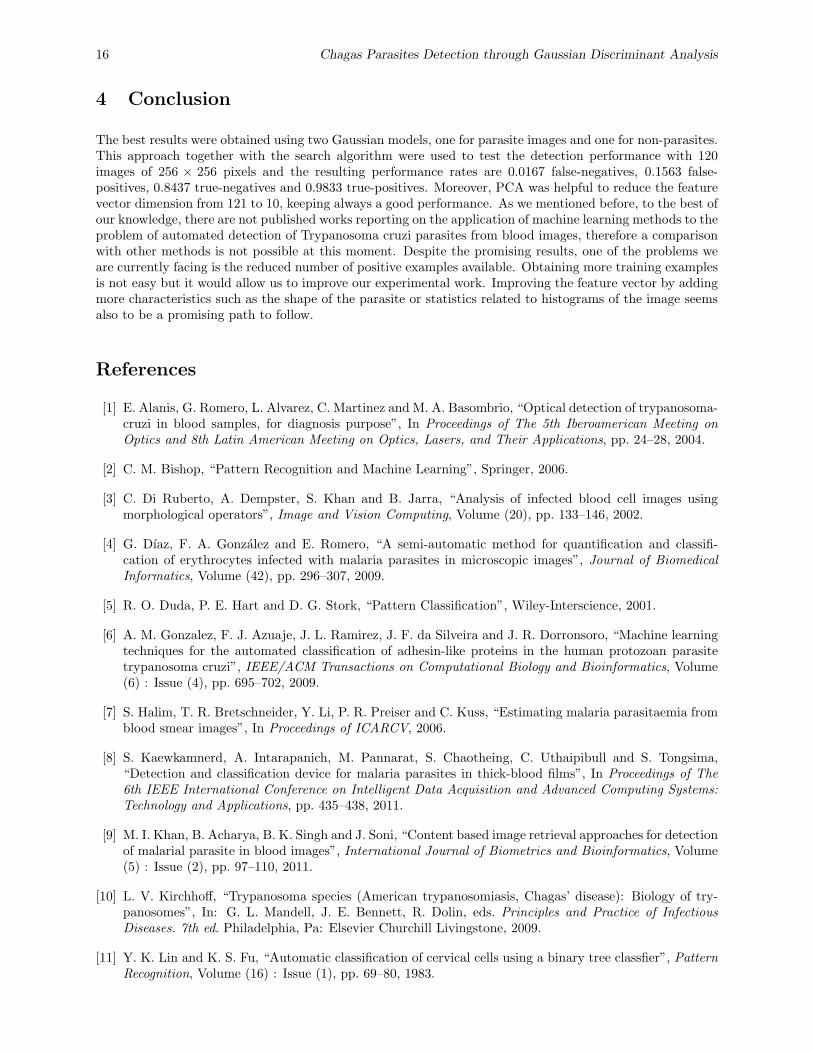
Among the three different ways of implementing our classifier model, the best one is given by the secondexperimental setup. This approach was tested with all 120 images available and the results are given in Table4. Negatives are those situations when the algorithm finds none parasite in the image. Positive means thatthe algorithm found a parasite in the image. False means that the algorithm made a mistake in its detectionand true means that the algorithm is right in its detection. The most important performance is given bythe false-negatives, because is the percentage of images that the algorithm failed to find a parasite when ithad one. In Fig. 3 we provide four sample images that illustrate the detection results of our algorithm.
False TrueNegatives 0.0167 0.8437Positives 0.1563 0.9833
Table 4: Final detection performance.

V. Uc-Cetina, C. Brito-Loeza, H. Ruiz-Pina 15
(a) (b)
(c) (d)
(e) (f)
(g) (h)
Figure 3: Results of the Chagas parasite detection algorithm with a sample of images.
16 Chagas Parasites Detection through Gaussian Discriminant Analysis
4 Conclusion
The best results were obtained using two Gaussian models, one for parasite images and one for non-parasites.This approach together with the search algorithm were used to test the detection performance with 120images of 256 × 256 pixels and the resulting performance rates are 0.0167 false-negatives, 0.1563 false-positives, 0.8437 true-negatives and 0.9833 true-positives. Moreover, PCA was helpful to reduce the featurevector dimension from 121 to 10, keeping always a good performance. As we mentioned before, to the best ofour knowledge, there are not published works reporting on the application of machine learning methods to theproblem of automated detection of Trypanosoma cruzi parasites from blood images, therefore a comparisonwith other methods is not possible at this moment. Despite the promising results, one of the problems weare currently facing is the reduced number of positive examples available. Obtaining more training examplesis not easy but it would allow us to improve our experimental work. Improving the feature vector by addingmore characteristics such as the shape of the parasite or statistics related to histograms of the image seemsalso to be a promising path to follow.
References
[1] E. Alanis, G. Romero, L. Alvarez, C. Martinez and M. A. Basombrio, “Optical detection of trypanosoma-cruzi in blood samples, for diagnosis purpose”, In Proceedings of The 5th Iberoamerican Meeting onOptics and 8th Latin American Meeting on Optics, Lasers, and Their Applications, pp. 24–28, 2004.
[2] C. M. Bishop, “Pattern Recognition and Machine Learning”, Springer, 2006.
[3] C. Di Ruberto, A. Dempster, S. Khan and B. Jarra, “Analysis of infected blood cell images usingmorphological operators”, Image and Vision Computing, Volume (20), pp. 133–146, 2002.
[4] G. Dıaz, F. A. Gonzalez and E. Romero, “A semi-automatic method for quantification and classifi-cation of erythrocytes infected with malaria parasites in microscopic images”, Journal of BiomedicalInformatics, Volume (42), pp. 296–307, 2009.
[5] R. O. Duda, P. E. Hart and D. G. Stork, “Pattern Classification”, Wiley-Interscience, 2001.
[6] A. M. Gonzalez, F. J. Azuaje, J. L. Ramirez, J. F. da Silveira and J. R. Dorronsoro, “Machine learningtechniques for the automated classification of adhesin-like proteins in the human protozoan parasitetrypanosoma cruzi”, IEEE/ACM Transactions on Computational Biology and Bioinformatics, Volume(6) : Issue (4), pp. 695–702, 2009.
[7] S. Halim, T. R. Bretschneider, Y. Li, P. R. Preiser and C. Kuss, “Estimating malaria parasitaemia fromblood smear images”, In Proceedings of ICARCV, 2006.
[8] S. Kaewkamnerd, A. Intarapanich, M. Pannarat, S. Chaotheing, C. Uthaipibull and S. Tongsima,“Detection and classification device for malaria parasites in thick-blood films”, In Proceedings of The6th IEEE International Conference on Intelligent Data Acquisition and Advanced Computing Systems:Technology and Applications, pp. 435–438, 2011.
[9] M. I. Khan, B. Acharya, B. K. Singh and J. Soni, “Content based image retrieval approaches for detectionof malarial parasite in blood images”, International Journal of Biometrics and Bioinformatics, Volume(5) : Issue (2), pp. 97–110, 2011.
[10] L. V. Kirchhoff, “Trypanosoma species (American trypanosomiasis, Chagas’ disease): Biology of try-panosomes”, In: G. L. Mandell, J. E. Bennett, R. Dolin, eds. Principles and Practice of InfectiousDiseases. 7th ed. Philadelphia, Pa: Elsevier Churchill Livingstone, 2009.
[11] Y. K. Lin and K. S. Fu, “Automatic classification of cervical cells using a binary tree classfier”, PatternRecognition, Volume (16) : Issue (1), pp. 69–80, 1983.

V. Uc-Cetina, C. Brito-Loeza, H. Ruiz-Pina 17
[12] C. Ponce, E. Ponce, E. Vinelli, A. Montoya, V. de Aguilar, A. Gonzalez, B. Zingales, R. Rangel-Aldao,M. J. Levin, J. Esfandiari, E. S. Umezawa, A. O. Luquetti, and J. F. da Silveira, “Validation of a rapidand reliable test for diagnosis of Chagas disease by detection of Trypanosoma cruzi-specific antibodiesin blood of donors and patients in Central America”, Journal of Clinical Microbiology, Volume (43) :Issue (10), pp. 5065–5068, 2005.
[13] C. G. Romero, A. C. Monaldi and E. E. Alanis, “Digital holographic microscopy for detection oftrypanosoma cruzi parasites in fresh blood mounts”, Optics Communications, Volume (285), 2012.
[14] N. E. Ross, C. J. Pritchard, D. M. Rubin and A. G. Duse, “Automated image processing method forthe diagnosis and classification of malaria on thin blood smears”, Medical and Biological Engineeringand Computing, Volume(44) , pp. 427–436, 2006.
[15] S. W. S. Sio, W. Sun, S. Kumar, W. Z. Bin, S. S. Tan, S. H. Ong, H. Kikuchi, Y. Oshima and K. S. W.Tan, “MalariaCount: An image analysis-based program for the accurate determination of parasitemia”,Journal of Microbiological Methods, Volume (68), pp. 11–18, 2007.
[16] F. B. Tek , A. G. Dempster and I. Kale, “Malaria parasite detection in peripheral blood images”, InProceedings of The British Machine Vision Conference, pp. 347–356, 2006.
[17] J. P. Thiran and B. Macq, “Morphological feature extraction for the classification of digital imagesof cancerous tissues”, IEEE Transactions on Biomedical Engineering, Volume (43) : Issue (10), pp.1011–1020, 1996.
[18] World Health Organization. Chagas disease (American trypanosomiasis). Fact sheet number 340, June2010. http://www.who.int/mediacentre/factsheets/fs340/en/