Embed Size (px)
Citation preview

Research Methodology
CHAPTER-5

CHAPTER 5 Research Methodology
PhD Thesis Sunita Guru Page Number 110
5.1 Introduction
Research is any organized inquiry carried out to provide information for solving
problems. Marketing research is a systematic inquiry that provides information to
guide marketing decisions. The American Marketing Association defines
marketing research as “Marketing research is the function that links the consumer,
customer and public to the marketer through information – information used to
identify and define marketing opportunities and problems –generate , refine and
evaluate marketing actions ; monitor marketing performance ; and improve
understanding of marketing as a process”. Marketing research specifies the
information required to address these issues, designs the method for collecting
information, manage and implements the data collection process, analyzes the
results and communicates the findings and their implications1.
In other words, marketing research is the systematic and objective identification,
collection, analysis, dissemination and use of information for the purpose of
improving decision making related to the identification and solution of problems
and opportunities in marketing. Thus marketing research links the consumers to
marketers by providing information that can be used in making marketing
decisions. As marketing research is a systematic inquiry, it involves systematic
planning at all the stages. Each stage of the procedure is methodologically sound,

CHAPTER 5 Research Methodology
PhD Thesis Sunita Guru Page Number 111
well documented and as much as possible planned. Thus the following six steps of
marketing research process have been carried out in this study which is systematic
and conceptually sound:
Problem Identification
Approach to the problem
Research Design
Fieldwork or Data collection
Data Preparation and Analysis
Report preparation and presentation 2
5.2 Problem Identification
The growth of Internet and its user base in recent years has been truly
phenomenal. Despite the phenomenal growth of the Internet over the past few
years, the vast potential of conducting business over the Internet remains
largely untapped. This study is designed to provide suggestions to online
marketers and e-vendors regarding barriers to online shopping. There are
several questions that need to be answered so that internet users do online
shopping without any risk fear or lack of trust. Moreover demographic
characteristics like income and education are also anticipated to influence
online purchase decision. This study was undertaken to provide solution to
the above mentioned problems.

CHAPTER 5 Research Methodology
PhD Thesis Sunita Guru Page Number 112
5.3 Development of an approach to the problem
Development of an approach to the problem includes formulating an objective or
theoretical framework, analytical models, research questions and hypothesis and
identifying the information needed3.
Present study basically focuses on trust and risk factor acting as barriers to online
shopping. The study also aims to explore the product categories people intend to
spend, risk perceptions in conventional shopping versus online shopping and other
reasons for reluctance to online shopping apart from perceived risk and lack of
trust.
5.3.1 Rational of the study
The literature review has revealed that most of the studies have mainly
concentrated on trust and risk independently. There have been hardly any
studies which take into account the relationship between perceived risk and
trust. Since the concept of trust is intimately related to (and often confused
with) the concept of risk, an understanding of trust that does not examine its
relationships with risk is incomplete. Whether and how trust affects perceived
risk (or vice versa) in the Internet shopping context is still very much an open
issue.

CHAPTER 5 Research Methodology
PhD Thesis Sunita Guru Page Number 113
Moreover, on detailed search the researchers have not found any substantial
literature available in the Indian context delving on perceived risk and the various
components of the same. From literature study it can be seen that all these studies
have been done in non –Indian context. Through this research, the researchers
expect to find the different ways in which shoppers perceive risk, which is
understood as a function of culture, in Indian context. Moreover the relationship
between intension to shop and perceived risk will also be studied i.e. in what
product categories people intend to spend more and how much amount they intend
to spend.
Under the above context, I realize the need for an extensive and intensive
study to analysis the study of relationship between perceived risk and trust
and their interactions.
5.3.2 Objectives of the study
To explore whether and how trust affects perceived risk in the online
shopping context and vice versa.
To determine the different perceived risks involved in online shopping in
Indian context.
To understand elements of each perceived risk in online shopping.

CHAPTER 5 Research Methodology
PhD Thesis Sunita Guru Page Number 114
To understand risk perceptions in conventional shopping versus online
shopping.
To determine in what product categories people intend to spend more in
case of online shopping.
To find out reasons for reluctance to online shopping.
5.3.3 Hypothesis of the study
Considering the above objectives the following hypothesis was tested
There is no relationship between Income level of people and trust in
online shopping.
Trust in online shopping is independent of Education level of
customers.
Shopping convenience in online shopping does not attract younger and
older customers.
The nature of product does not affect the acceptance of online
shopping.
5.3.4 Area of Information
With the above objectives in mind the following information was soughted.

CHAPTER 5 Research Methodology
PhD Thesis Sunita Guru Page Number 115
Demographics:
Age
Gender
Occupation
Marital status
Income
Family type
Ownership of durables, computer and internet line at home
Internet usage
Place of using Internet:
At a cyber cafe
Office
Home
School/College/Institute
Friends / Relatives/Neighbor’s
Through Mobile
Purpose of Internet Usage:
Communications
Interactive communication
Information search

CHAPTER 5 Research Methodology
PhD Thesis Sunita Guru Page Number 116
Online bill payment
On-line shopping
Pattern of internet usage
Average per day hours for which internet is used
Types of sites visited
Frequency of online visit
Online shopping – usage
Category of products/ services purchased through online shopping
Highest amount ever spent on online shopping
Average per month amount spent on online shopping
Online shopping – purchase behavior
o From information gathering to final purchase
Places from where online shopping is done
Benefits derived from online shopping
Different Perceived Risk
Financial risk
Time risk
Social risk
Physical risk

CHAPTER 5 Research Methodology
PhD Thesis Sunita Guru Page Number 117
Psychological risk
Source risk
Privacy risk
Intention to purchase
Intention to purchase
o Type of product/brand
o Intention to recommend
5.4 Research Design
A research design is a framework or blueprint for conducting the scientific
inquiry. It details the procedures necessary for obtaining the information needed to
structured or solve marketing research problem4 . The purpose of the research
design is to provide the plan for answering the research question or testing the
hypothesis. In other words, a basic aspect of research design is to set up the
research so as to allow logical inferences to be drawn. Research design may be
broadly classified as exploratory or conclusive (Descriptive research and Causal
research).
The research design for this study is descriptive in nature and both qualitative and
quantitative research methodologies are used. In this two stage research design,

CHAPTER 5 Research Methodology
PhD Thesis Sunita Guru Page Number 118
first stage of the research design is exploratory. Output of the exploratory is used
in the second stage of the research. Qualitative output was used for the
formulation of questionnaire especially for item construction for the scale to
measure risk and trust. Semi structured questionnaire was used for the second
stage quantitative research. A semi structured questionnaire was designed and was
pre-tested before using as a final instrument for collecting the data.
5.4.1 Scope of the Study
The study was confined to Gujarat state which has 5 geographic regions namely
North Gujarat, South Gujarat, Central Gujarat, Saurashtra and Kutch. Since they
are geographically distant, they are also socio-economic difference. A pilot study
was conducted in Ahmedabad (Central Gujarat), Mehasana (North Gujarat), South
Gujarat (Vapi), Jamnagar (Saurashtra), and Kutch (Gandhidham) for the
formulation of questionnaire for item construction for the scale to measure risk
and trust. Data through survey was collected for this study from Ahmedabad and
Anand (Central Gujarat), Mehasana and Patan (North Gujarat), Surat and Vapi
(South Gujarat), Rajkot, Bhavnagar and Jamanager (Saurashtra) and Bhuj and
Adipur (Kutch) during the period of June 2010-to December -2010
CHAPTER 5 Research Methodology
PhD Thesis Sunita Guru Page Number 119
5.4.2 Primary and Secondary Data
Secondary data was collected in form of literature reviewed from various national
and international Journals, Websites, Books, Online Databases and Reports. The
Major International Journals reviewed are Journal of Advertising Research,
Marketing Management Journal, Journal of Consumer Research, Journal of
Management Information Systems, Journal of Interactive Marketing, Journal of
Service Industry Management, Marketing Intelligence and Planning, International
Journal of Retail & Distribution Management, TQM and Business Excellence,
Journal of Fashion Marketing and Management, International Journal of Research
in Marketing, Industrial Management & Data Systems, Journal of Internet
Commerce, Communication World, Journal of Marketing Research, Journal of
Business Research, Marketing and Technology, Journal of Interactive Marketing,
European Journal of Marketing, Journal of Organizational and End User
Computing, Journal of Marketing Management, International Journal of
Information Management, Journal of Marketing, Service Journal, Marketing
Management Journal, Business and Society Review, Communications of the
ACM, Journal of Marketing, Journal of Consumer Behavior, International Journal
of Bank Marketing, Journal of Computer Mediated Communication, Information
Technology and Management, Journal of Applied Psychology, Journal of
Consumer Marketing, Journal of services marketing, Family and Consumer
Sciences Research Journal, Journal of Business ethics, International Marketing

CHAPTER 5 Research Methodology
PhD Thesis Sunita Guru Page Number 120
Review, International Journal of Electronic Commerce, Information Management
& Computer Security, Journal of Food Products Marketing, Academy of
Management Review, Information Systems Research, Management Decision,
Journal of Consumer Affairs, International Journal of Service Industry
Management, Journal of Computer Mediated Communication, Human Systems
and Management, American Psychologist, Journal of Internet Commerce, Journal
of Personality and Social Psychology, Journal of International Consumer
Marketing, Journal of International Consumer Marketing, Journal of the Academy
of Marketing Science, Multinational Business Review, Sloan Management
Review, Marketing Health Services, Journal of Interactive Marketing, Journal of
the Association for Information Systems. Primary data was collected using a semi
structured questionnaire. After scanning various secondary data sources, primary
data was collected to meet the objectives of the present study.
5.4.3 Sampling Plan
Sampling is defined as the selection of some part of an aggregate or totality on the
basis of which a judgment or inference about the aggregate or totality is made5. In
other words, it is the process of obtaining information about an entire population
by examining only a part of it. A sampling design is a definite plan for obtaining a
sample from the sampling frame. It refers to the technique or the procedure the
researcher would adopt in selecting some sampling units from which inferences

CHAPTER 5 Research Methodology
PhD Thesis Sunita Guru Page Number 121
about the population is drawn6. Sampling design incorporates population and
sampling unit, determining the sampling techniques and sampling size.
The Population
A population is the aggregate of all the elements that share some common set of
characteristics and that comprise the universe for the purpose of the marketing
research problem. In other words, population represents the total set of things
under consideration about which some information is desired7.
The state of Gujarat has 5 geography regions namely North Gujarat, South
Gujarat, Central Gujarat, Saurashtra and Kutch. The study is carried out in ten
cities in the state of Gujarat from different cultural regions. Moreover only urban
dwellers are covered here as the internet penetration in rural area is almost
negligible. Thus the population for the present study is all the urban internet users
of the ten selected cities.
Sampling Unit
A sampling unit is an element, or a unit containing the element, that is available
for selection at some stage of the sampling process8. From the above population,
all the internet users who are either aware of online shopping or have done online

CHAPTER 5 Research Methodology
PhD Thesis Sunita Guru Page Number 122
shopping were identified as sampling unit for the purpose of the study. Those
internet users who had no idea or were not aware of online shopping were
excluded from the study.
Sampling techniques
Sampling techniques may be broadly classified as non-probability and probability.
Non-probability relies on the personal judgment of the researcher rather than
chance to select sample elements. In probability sampling, sampling units are
selected by chance. Commonly used non-probability sampling techniques are
Convenience Sampling, Judgment Sampling, Quota Sampling, and Snowball
Sampling. Probability sampling includes simple random sampling, Systematic
Sampling, Stratified Sampling, Cluster Sampling, and other sampling techniques9.
In the present study, Quota sampling has been adopted. Quota sampling may be
viewed as two-stage restricted judgmental sampling. The first stage consists of
developing control categories, of population elements. To develop these quotas
the researcher lists relevant control characteristics and determines the distribution
of these characteristics in the target population10. In the second stage, sample
elements are selected based on convenience and judgment.
The sample of the present study, represented the population with respect to

CHAPTER 5 Research Methodology
PhD Thesis Sunita Guru Page Number 123
demographic dimensions i.e. gender, age, income, and education. Care was taken
to make the sample representative of the actual population.
Size of the Sample
The five cities selected for the exploratory study are Ahmedabad, Mehsana, Vapi,
Jamnagar and Adipur. From each of these cities, four online shoppers’ were
selected for in-depth interviews. In all, 20 in-depth interviews were conducted for
the study.
Table 5.1: City –wise Sample size for in-depth interviews
Region City Number of
DIs (Men)
Number of DIs
(Women)
Central Gujarat Ahmedabad 2 2
North Gujarat Mehasana 2 2
South Gujarat Vapi 2 2
Saurashtra Jamnagar 2 2
Kutch Gandhidham 2 2
The in-depth interview was conducted with the help of guideline. During the
interview, the following themes were explored through open-ended discussion:
Motivations for online shopping
Barriers to online shopping- especially risk associated with online shopping

CHAPTER 5 Research Methodology
PhD Thesis Sunita Guru Page Number 124
Amount spent in online shopping
Products purchased through online shopping
The in-depth interviews were recorded, transcribed and content analysed. For
content analysis, each transcript was repeatedly read and a content analysis table
was prepared using Excel sheet. In the Excel sheet, each vertical column
represented one respondent and each horizontal row represented one research
question. The content analysis table helped to map all the respondents
simultaneously, looking for emerging patterns and insights.
From the earlier research work on online marketing and trust in online marketing,
the respondent’s responses were quick and positive. This led to an anticipation of
a sample size of nearly 1520 respondents for the present work. As the work
progressed it was realized that though the initial response rate was net high,
respondents were difficult to come by in numbers and interest to respond. To
avoid poor response due to lack of interest it was decided to limit the sample size
to 650.
Total 650 questionnaires were received out of which 23 were rejected due to
incomplete responses. Thus final valid respondents for the study were 627. The
sample consisted of respondents from the cities selected for the study. City wise
break of respondents are as follows-
CHAPTER 5 Research Methodology
PhD Thesis Sunita Guru Page Number 125
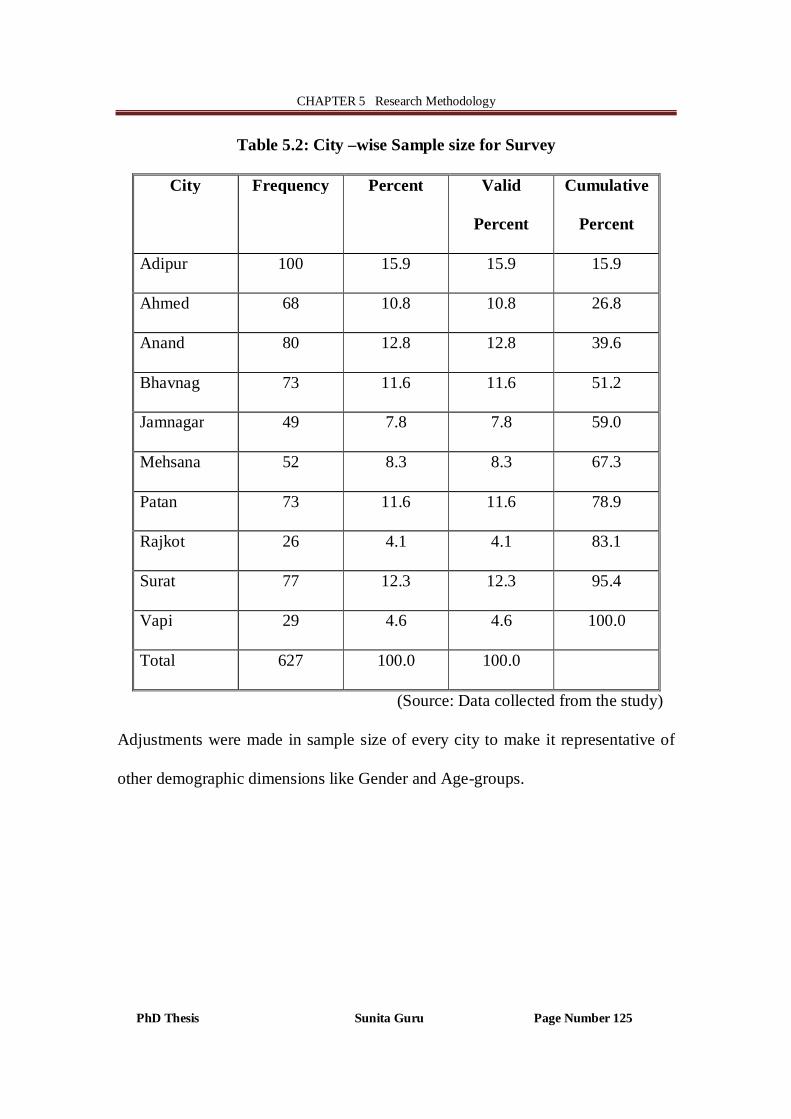
Table 5.2: City –wise Sample size for Survey
City Frequency Percent Valid
Percent
Cumulative
Percent
Adipur 100 15.9 15.9 15.9
Ahmed 68 10.8 10.8 26.8
Anand 80 12.8 12.8 39.6
Bhavnag 73 11.6 11.6 51.2
Jamnagar 49 7.8 7.8 59.0
Mehsana 52 8.3 8.3 67.3
Patan 73 11.6 11.6 78.9
Rajkot 26 4.1 4.1 83.1
Surat 77 12.3 12.3 95.4
Vapi 29 4.6 4.6 100.0
Total 627 100.0 100.0
(Source: Data collected from the study)
Adjustments were made in sample size of every city to make it representative of
other demographic dimensions like Gender and Age-groups.

CHAPTER 5 Research Methodology
PhD Thesis Sunita Guru Page Number 126
5.4.4 Instrument for data collection
Exploratory research through pilot study was conducted in selected cities. The
objective of the exploratory research is to explore or search through a problem or
situation to provide insights and understanding11. Output of the exploratory is used
for the formulation of questionnaire for item construction for the scale to measure
risk and trust. Survey as an approach to study has advantage of coverage of large
number of dimensions pertaining to the study. For data collection a survey using a
structured questionnaire was used to collect data from respondents. For getting
qualitative information a few open-ended questions were also included in the
questionnaire.
5.5 Fieldwork and Data Collection
Data was collected from ten cities of Gujarat during the period of Jun 2010 to Dec
2010. Data was collected after checking the respondent’s awareness of online
shopping.
5.6 Data Analysis
Data preparation included the editing, coding, transcription, and verification of
data. After editing the data, a number code was assigned to each response to each

CHAPTER 5 Research Methodology
PhD Thesis Sunita Guru Page Number 127
question. A data sheet was prepared containing all the variables and responses for
each question in a code form with the help of datasheets.
Analysis of data is the process by which data is converted into useful information.
Raw data as collected from questionnaires cannot be used unless it is processed in
some way to make it amenable to drawing conclusions. For the purpose of
advanced statistical analysis different datasheets were used. The collected data
was then subjected to suitable statistical analysis including
One Way ANOVA - multiple comparison tests
ANOVA or Analysis of Variance is used to compare the means of more than two
populations12. It uncovers the main and interaction effects of classification or
independent variables on one or more dependent variables. ANOVA uses
the F-statistic, which tests if the means of the groups, formed by one independent
variables or a combination of independent variables, are significantly different13.
An F-ratio equal to or less than one indicates that there is no significant difference
between groups and the null hypothesis is correct. If the null hypothesis is correct,
then we conclude that the independent variables did not have an effect on the
dependent variable. However, if the F-test proves the null hypothesis to be wrong,
multiple comparison tests are used to further explore the specific relationships
among different groups.

CHAPTER 5 Research Methodology
PhD Thesis Sunita Guru Page Number 128
The criterion that is used for accepting or rejecting a null hypothesis is called
significance of p-value14. A p-value of 0.05 means that there is only 5% chance
that you would be wrong in concluding that the populations are different or 95%
confident of making a right decision. Rejection of the null hypothesis in ANOVA
only tells us that all population means are not equal. Multiple comparison are used
to assess which group means differ from which other, once the overall F-test
shows that at least one difference exists 15. Many tests are listed under “Post Hoc”
in SPSS. Post Hoc analysis involves hunting through data for some significance16.
Tukey HSD (honestly significant difference) test is one of the most conservative
and commonly used tests17.
Here ANOVA is used to find significant relations between
Perceived reasons of purchasing online by online buyers and their
demographic characteristics.
Criteria for choosing product online by online buyers and their
demographic characteristics.
Trust in online shopping by online buyers and their demographic
characteristics.

CHAPTER 5 Research Methodology
PhD Thesis Sunita Guru Page Number 129
Chi-square test
Chi Square is one of the very popular methods for testing hypotheses on discrete
data18. Chi-square is used for finding significant relations19.It is used to determine
if categorical data shows dependency or the two classifications are independent.
This test can also be used to make comparisons between theoretical populations
and actual data when categories are used. A small chi-square statistic indicates
that the null hypothesis is correct and that the two variables are independent of
each other20.
Here Chi-Square is used to find significant relations between
Products/Services bought online by online buyers and their demographic
characteristics
Normally adopted payment mode and their demographic characteristics
Types of online buyers and their demographic characteristics
Factor Analysis
Factor analysis is a statistical approach that can be used to analyze
interrelationships among a large number of variables and to explain these
variables in terms of their common underlying dimensions (factors)21. The
objective is to find a way of condensing the information contained in a number of

CHAPTER 5 Research Methodology
PhD Thesis Sunita Guru Page Number 130
original variables into a smaller set of variables (factors) with a minimal loss of
information22.
Meanings of terminologies related with factor analysis are given below:
Bartlett’s test of sphericity is significant if its associated probability is less
than 0.05.
Kaiser-Meyer-Olkin (KMO) measures the sampling adequacy which
should be greater than 0.5 for a statistical factor analysis to proceed.
Screen plot are used to decide the number of underlying factors after
extraction. Screen plot is a graphical presentation of eigenvalues of all of
the factors initially considered for extraction23.
Community gives the variance accounted for a particular variable by all the
factors24.
Varimax is the most commonly used rotation technique.
The Cronbach alpha coefficient is an indicator of internal consistency of
the scale25. A high value of Cronback alpha above 0.70 can be used as a
reasonable test of scale reliability.
Factor analysis is used here for the reduction of elements of online risk into the
factors.

CHAPTER 5 Research Methodology
PhD Thesis Sunita Guru Page Number 131
5.7 Report Preparation and Presentation
Reports help to present the study in a systematic manner. Research problem,
current scenario and future directions can be effectively presented in form of
report. A Research reports typically contain Literature Survey and identification
of knowledge Gaps, Nature and Scope of study, Methodology, analysis of data,
findings and conclusion. This report is also organized on a similar framework. The
report is organized in eight chapters.

CHAPTER 5 Research Methodology
PhD Thesis Sunita Guru Page Number 132
References
1. Naresh K. Malhotra,, Marketing Research – An Applied Orientation, Pearson Education
Asia, 2001, p.83 2. K.R. Sharma, Research Methodology national Publishing House, New Delhi, p.40. 3. C.R. Kothari, Research Methodology – Methods & Techniques, New Age International
Publishers, New Delhi, 2004, p.54. 4. Naresh K. Malhotra,, Marketing Research – An Applied Orientation, Pearson Education
Asia, 2001, p.328
5. K.R. Sharma, Research Methodology national Publishing House, New Delhi, p.40 6. Naresh K. Malhotra,, Marketing Research – An Applied Orientation, Pearson Education
Asia, 2001, p.330 7. Naresh K. Malhotra,, Marketing Research – An Applied Orientation, Pearson Education
Asia, 2001, p.334
8. Naresh K. Malhotra,, Marketing Research – An Applied Orientation, Pearson Education Asia, 2001, p.336
9. Alvin C. Burns and Ronald F. Bush, Marketing Research, Prentice-Hall International,
INC, New Jersey, 1998, p.379 10. Naresh K. Malhotra,, Marketing Research – An Applied Orientation, Pearson Education
Asia, 2001, p.336 11. K.R. Sharma, Research Methodology national Publishing House, New Delhi, p.40 12. Gaur A.S and Gaur S.S (2006) , Statistical Methods for Practice and Research : A guide
to data analysis using SPSS, Sage Publications 13. Ibid, 68 14. Ibid, 35 15. Ibid, 70 16. Gupta, S.L. and Gupta, H (2011). , SPSS 17.0 for researchers, International Book
House Pvt. Ltd 17. Gaur A.S and Gaur S.S (2006) , Statistical Methods for Practice and Research : A guide
to data analysis using SPSS, Sage Publications

CHAPTER 5 Research Methodology
PhD Thesis Sunita Guru Page Number 133
18. Ibid 19. Gupta, S.L. and Gupta, H (2011). , SPSS 17.0 for researchers, International Book
House Pvt. Ltd 20. Gaur A.S and Gaur S.S (2006) , Statistical Methods for Practice and Research : A guide
to data analysis using SPSS, Sage Publications, 92 21. Gupta, S.L. and Gupta, H (2011). , SPSS 17.0 for researchers, International Book
House Pvt. Ltd 22. Gupta, S.L. and Gupta, H (2011). , SPSS 17.0 for researchers, International Book
House Pvt. Ltd, 142 23. Gaur A.S and Gaur S.S (2006) , Statistical Methods for Practice and Research : A guide
to data analysis using SPSS, Sage Publications, 92 24. Gaur A.S and Gaur S.S (2006) , Statistical Methods for Practice and Research : A guide
to data analysis using SPSS, Sage Publications,, 133 25. Ibid, 92