Embed Size (px)
Citation preview


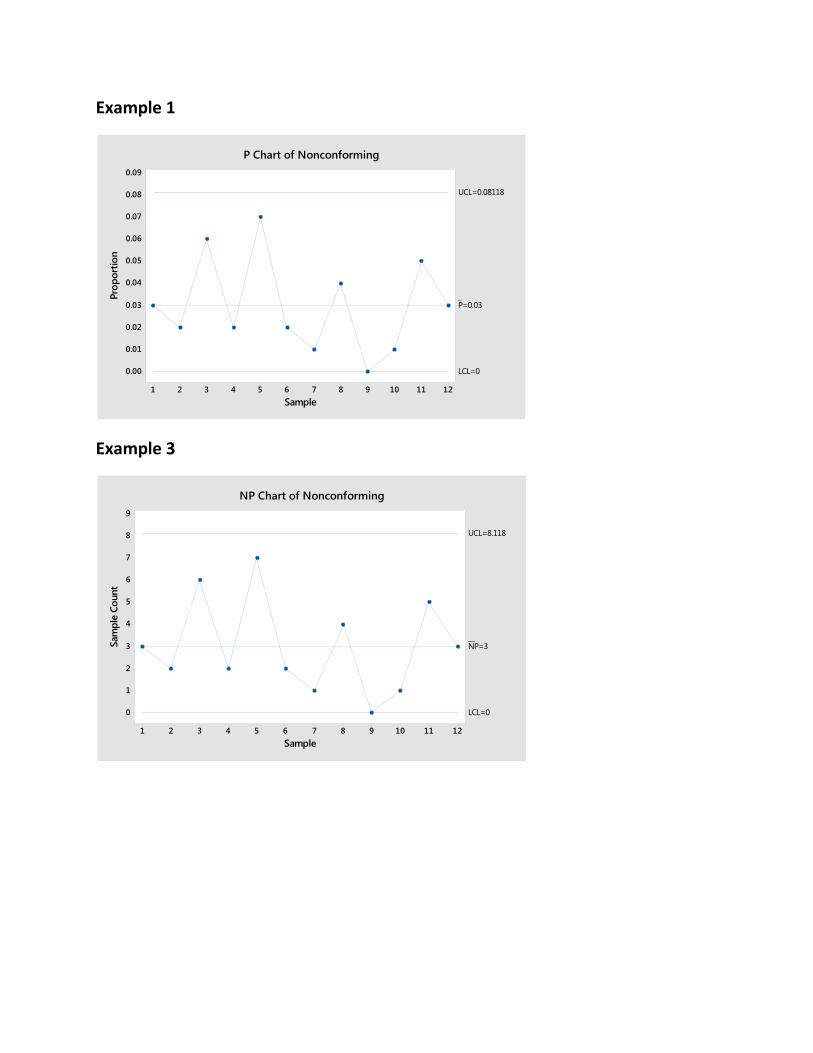
Example 1
Example 3
121110987654321
0.09
0.08
0.07
0.06
0.05
0.04
0.03
0.02
0.01
0.00
Sample
Pro
po
rtio
n
_P=0.03
UCL=0.08118
LCL=0
P Chart of Nonconforming
121110987654321
9
8
7
6
5
4
3
2
1
0
Sample
Sam
ple
Co
unt
__NP=3
UCL=8.118
LCL=0
NP Chart of Nonconforming

Example 4 - c chart
Example 4 - u chart
252219161310741
40
35
30
25
20
15
10
Sample
Sam
ple
Co
unt
_C=22.44
UCL=36.66
LCL=8.23
C Chart of Nonconformity
252219161310741
0.40
0.35
0.30
0.25
0.20
0.15
0.10
Sample
Sam
ple
Co
unt
Per
Unit
_U=0.2244
UCL=0.3666
LCL=0.0823
U Chart of Nonconformity