Embed Size (px)
DESCRIPTION
process control
Citation preview
Process Capability and Statistical Process Control
1
Chapter 3
Lecture Outline
• Basics of Statistical Process Control• Control Charts• Control Charts for Attributes• Control Charts for Variables• Control Chart Patterns• SPC with Excel and OM Tools• Process Capability
Copyright 2011 John Wiley & Sons, Inc. 3-2
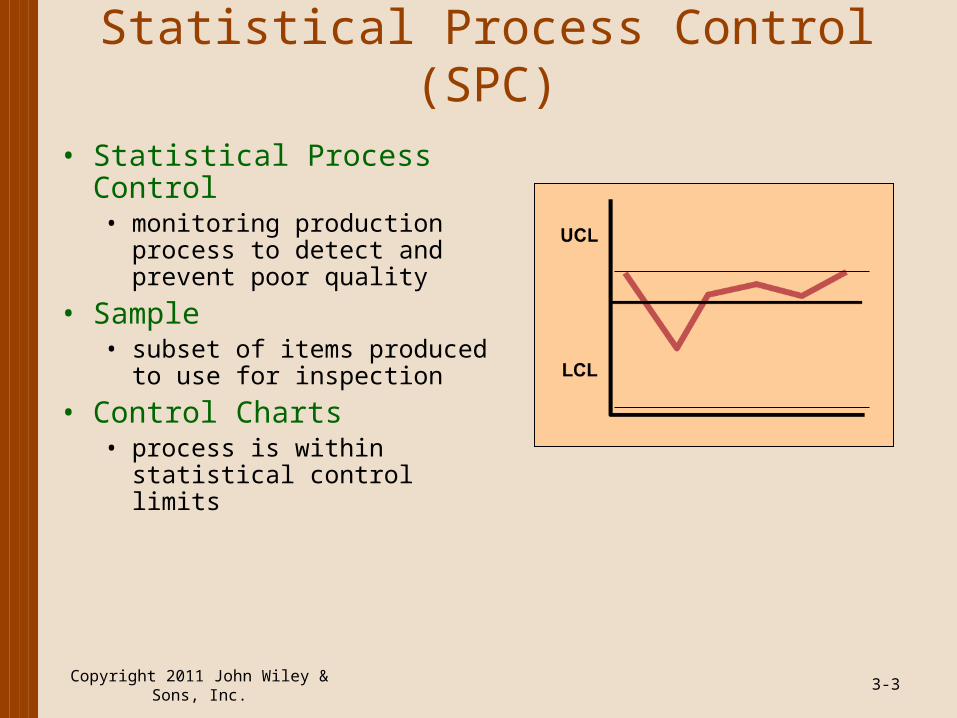
Statistical Process Control (SPC)
• Statistical Process Control• monitoring production process
to detect and prevent poor quality
• Sample• subset of items produced to
use for inspection
• Control Charts• process is within statistical
control limits
Copyright 2011 John Wiley & Sons, Inc. 3-3
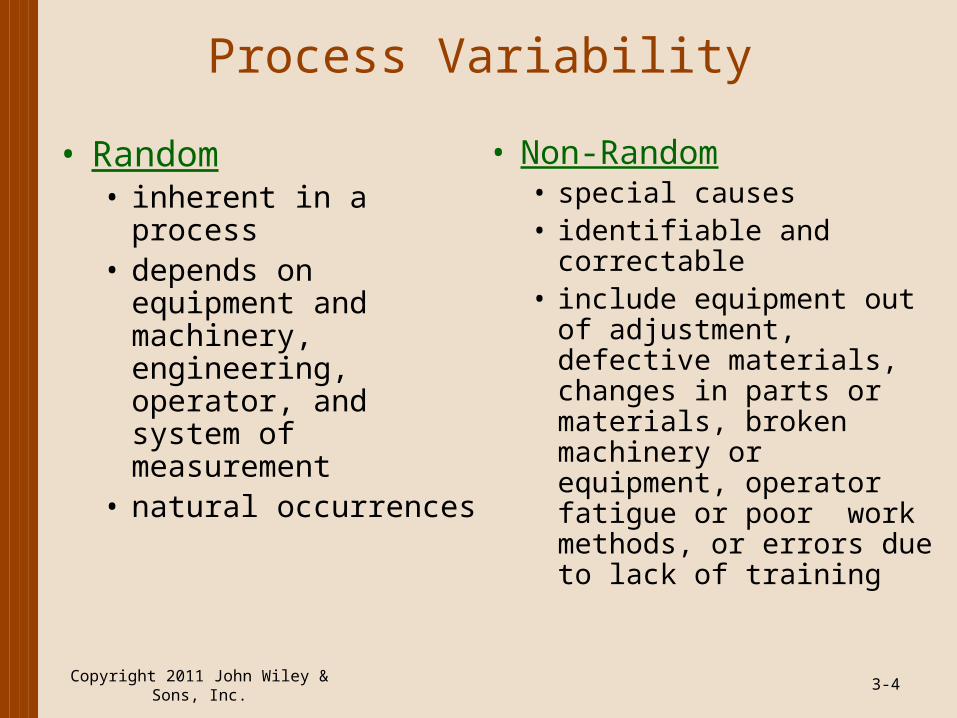
Process Variability
• Random• inherent in a process• depends on equipment
and machinery, engineering, operator, and system of measurement
• natural occurrences
• Non-Random• special causes• identifiable and
correctable• include equipment out of
adjustment, defective materials, changes in parts or materials, broken machinery or equipment, operator fatigue or poor work methods, or errors due to lack of training
Copyright 2011 John Wiley & Sons, Inc. 3-4
SPC in Quality Management
• SPC uses• Is the process in control?• Identify problems in order to make
improvements• Contribute to the TQM goal of continuous
improvement
Copyright 2011 John Wiley & Sons, Inc. 3-5
Quality Measures:Attributes and Variables
• Attribute• A characteristic which is evaluated with a
discrete response• good/bad; yes/no; correct/incorrect
• Variable measure• A characteristic that is continuous and can be
measured• Weight, length, voltage, volume
Copyright 2011 John Wiley & Sons, Inc. 3-6
SPC Applied to Services
• Nature of defects is different in services• Service defect is a failure to meet customer
requirements• Monitor time and customer satisfaction
Copyright 2011 John Wiley & Sons, Inc. 3-7
SPC Applied to Services
• Hospitals• timeliness & quickness of care, staff responses to requests,
accuracy of lab tests, cleanliness, courtesy, accuracy of paperwork, speed of admittance & checkouts
• Grocery stores• waiting time to check out, frequency of out-of-stock items, quality
of food items, cleanliness, customer complaints, checkout register errors
• Airlines• flight delays, lost luggage & luggage handling, waiting time at
ticket counters & check-in, agent & flight attendant courtesy, accurate flight information, cabin cleanliness & maintenance
Copyright 2011 John Wiley & Sons, Inc. 3-8
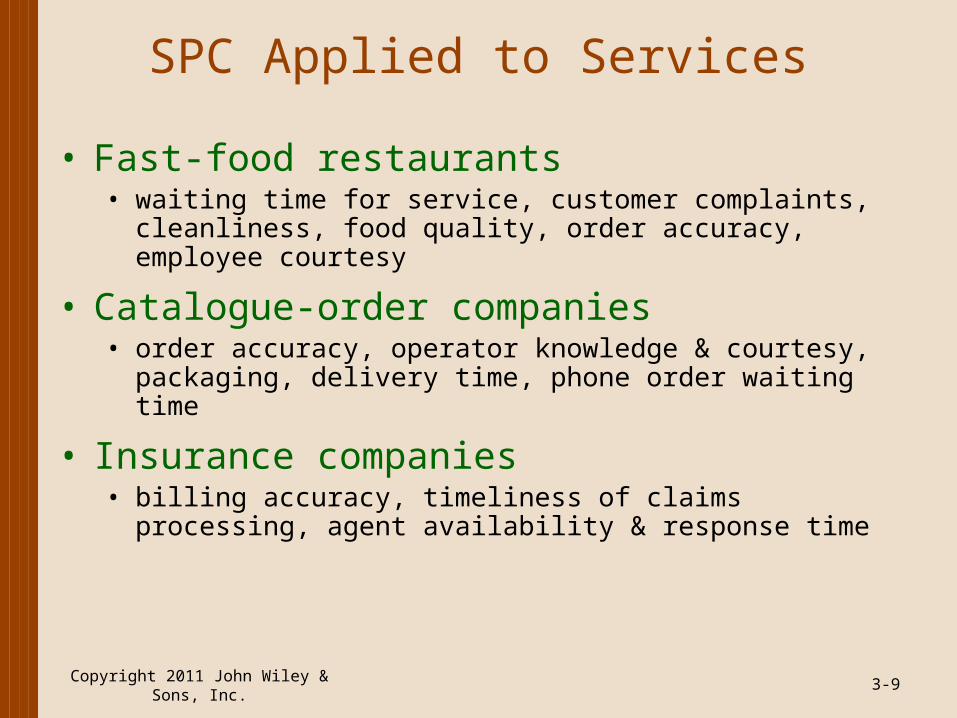
SPC Applied to Services
• Fast-food restaurants• waiting time for service, customer complaints, cleanliness, food
quality, order accuracy, employee courtesy
• Catalogue-order companies• order accuracy, operator knowledge & courtesy, packaging,
delivery time, phone order waiting time
• Insurance companies• billing accuracy, timeliness of claims processing, agent
availability & response time
Copyright 2011 John Wiley & Sons, Inc. 3-9
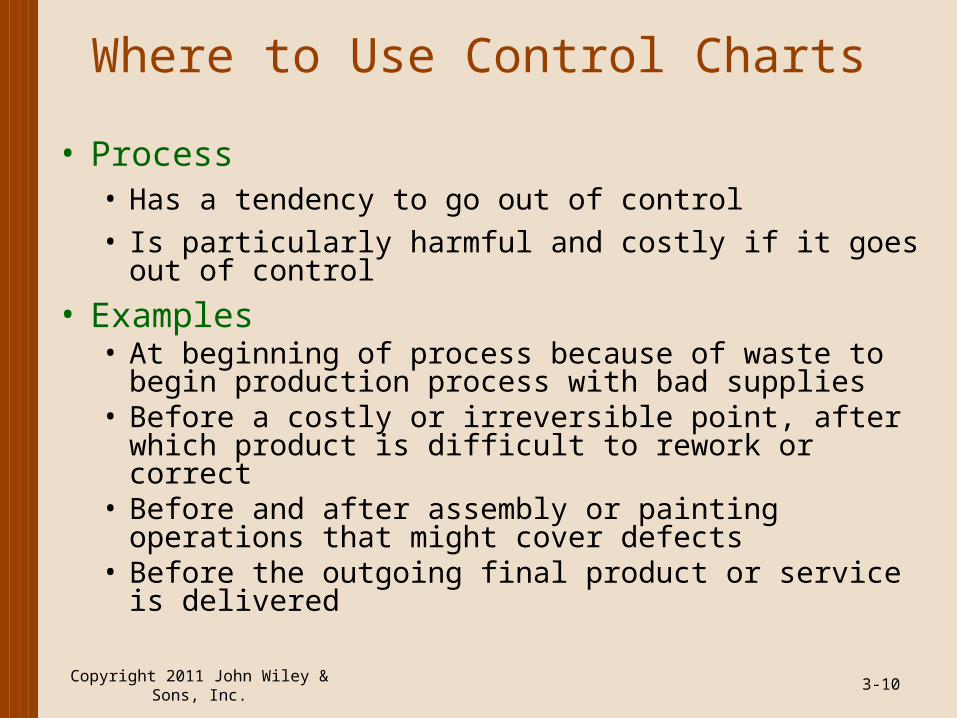
Where to Use Control Charts
• Process • Has a tendency to go out of control
• Is particularly harmful and costly if it goes out of control
• Examples• At beginning of process because of waste to begin
production process with bad supplies• Before a costly or irreversible point, after which product is
difficult to rework or correct• Before and after assembly or painting operations that
might cover defects• Before the outgoing final product or service is delivered
Copyright 2011 John Wiley & Sons, Inc. 3-10
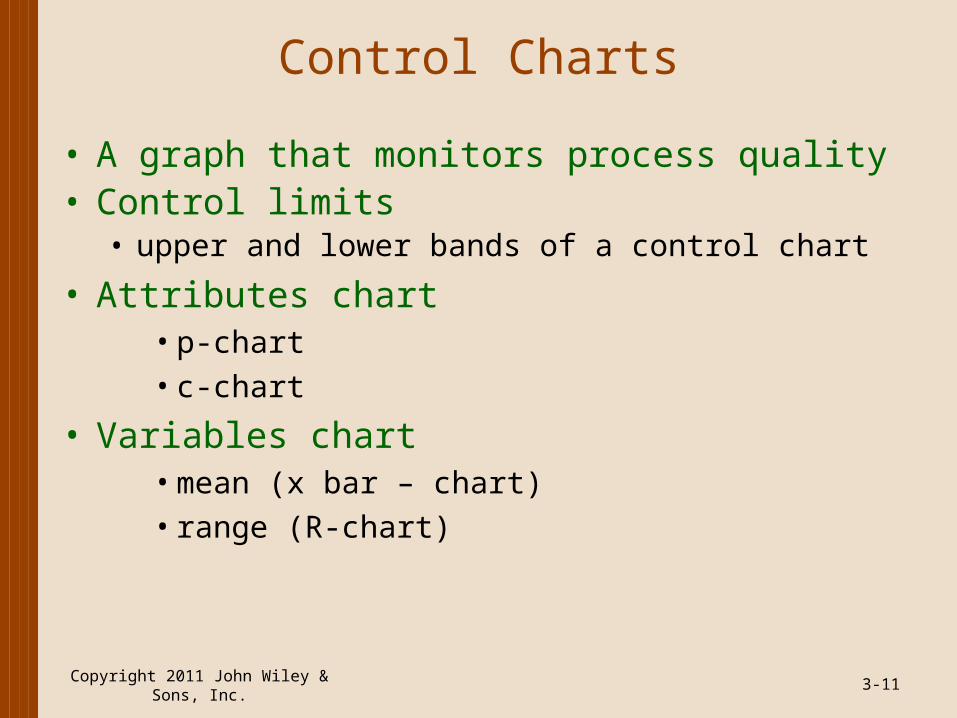
Control Charts
• A graph that monitors process quality• Control limits
• upper and lower bands of a control chart
• Attributes chart• p-chart• c-chart
• Variables chart• mean (x bar – chart)• range (R-chart)
Copyright 2011 John Wiley & Sons, Inc. 3-11
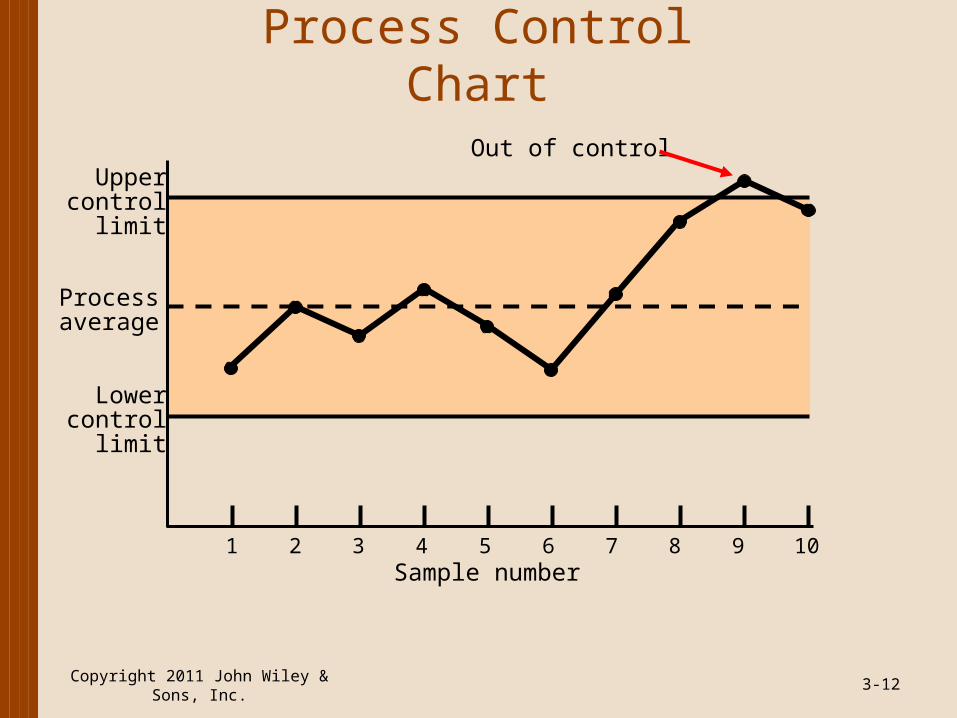
Process Control Chart
Copyright 2011 John Wiley & Sons, Inc. 3-12
1 2 3 4 5 6 7 8 9 10Sample number
Uppercontrol
limit
Processaverage
Lowercontrol
limit
Out of control
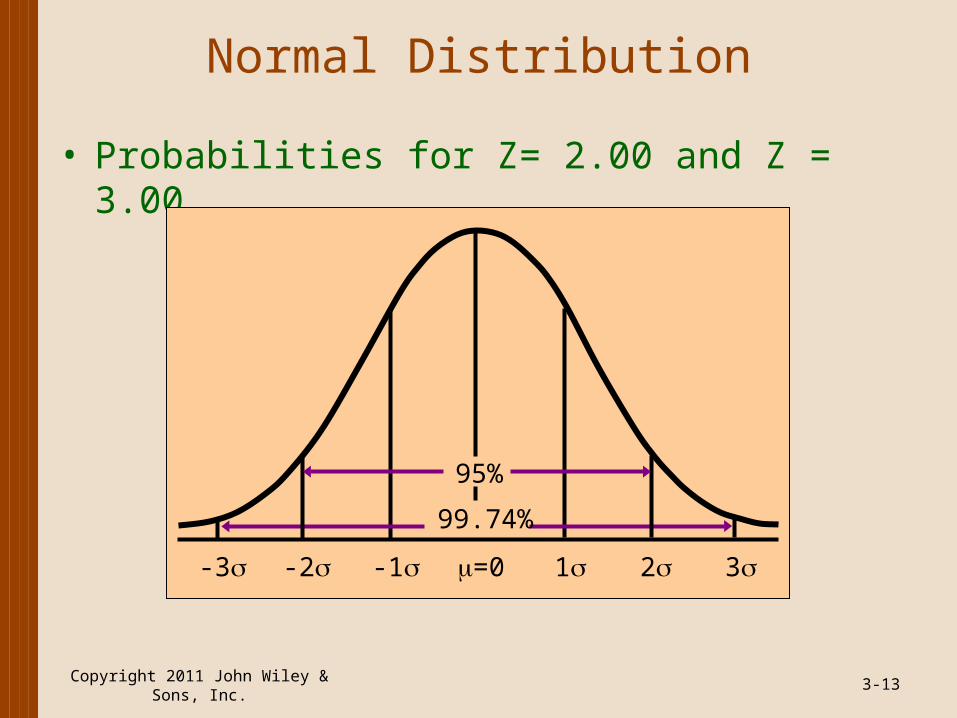
Normal Distribution
• Probabilities for Z= 2.00 and Z = 3.00
Copyright 2011 John Wiley & Sons, Inc. 3-13
=0 1 2 3-1-2-3
95%
99.74%
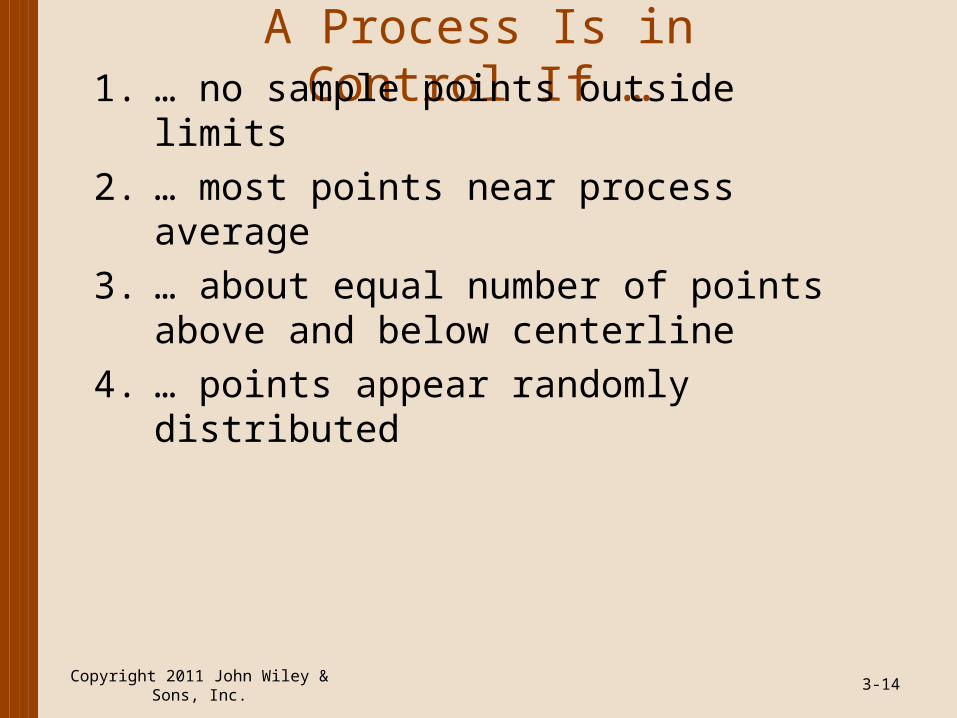
A Process Is in Control If …
Copyright 2011 John Wiley & Sons, Inc. 3-14
1. … no sample points outside limits
2. … most points near process average
3. … about equal number of points above and below centerline
4. … points appear randomly distributed
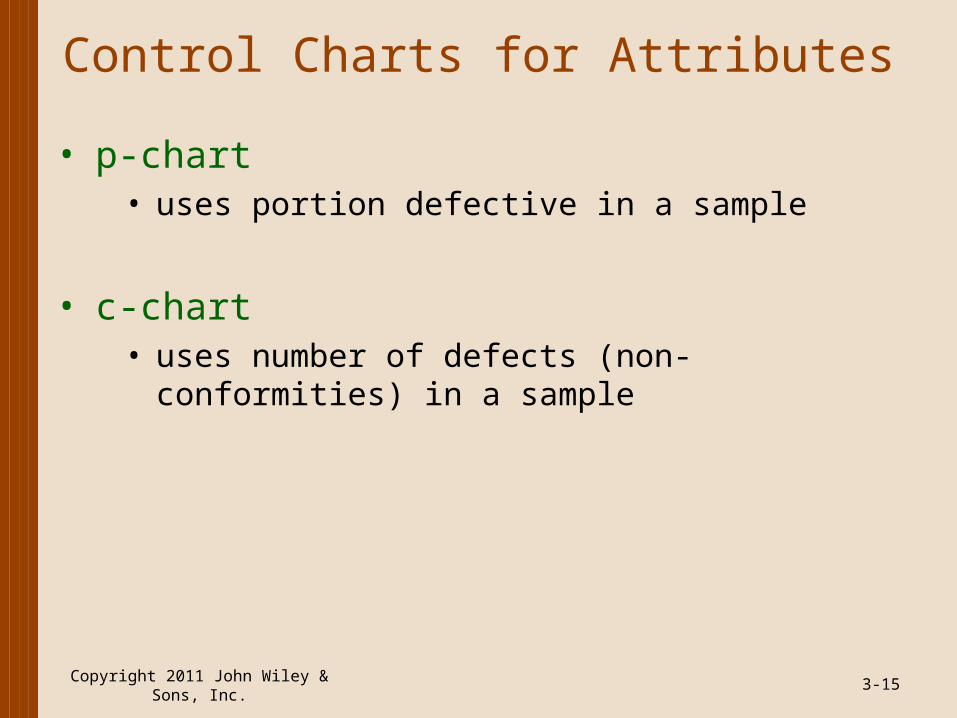
Control Charts for Attributes
• p-chart• uses portion defective in a sample
• c-chart• uses number of defects (non-conformities) in a
sample
Copyright 2011 John Wiley & Sons, Inc. 3-15
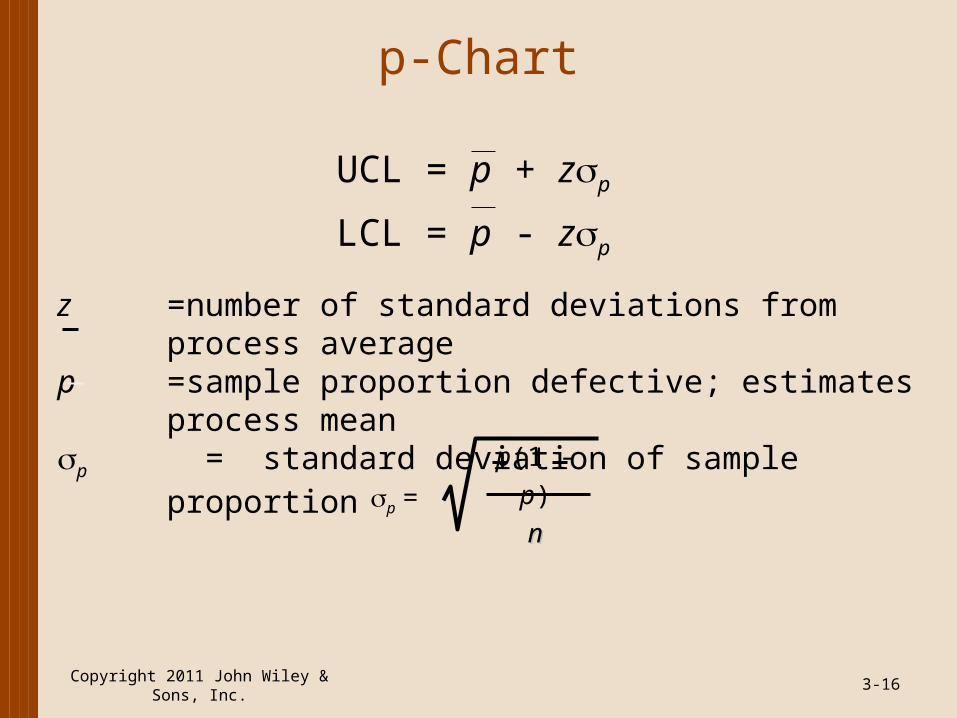
p-Chart
Copyright 2011 John Wiley & Sons, Inc. 3-16
UCL = p + zp
LCL = p - zp
z =number of standard deviations from process average
p =sample proportion defective; estimates process mean
p = standard deviation of sample proportionp =
p(1 - p)
nn
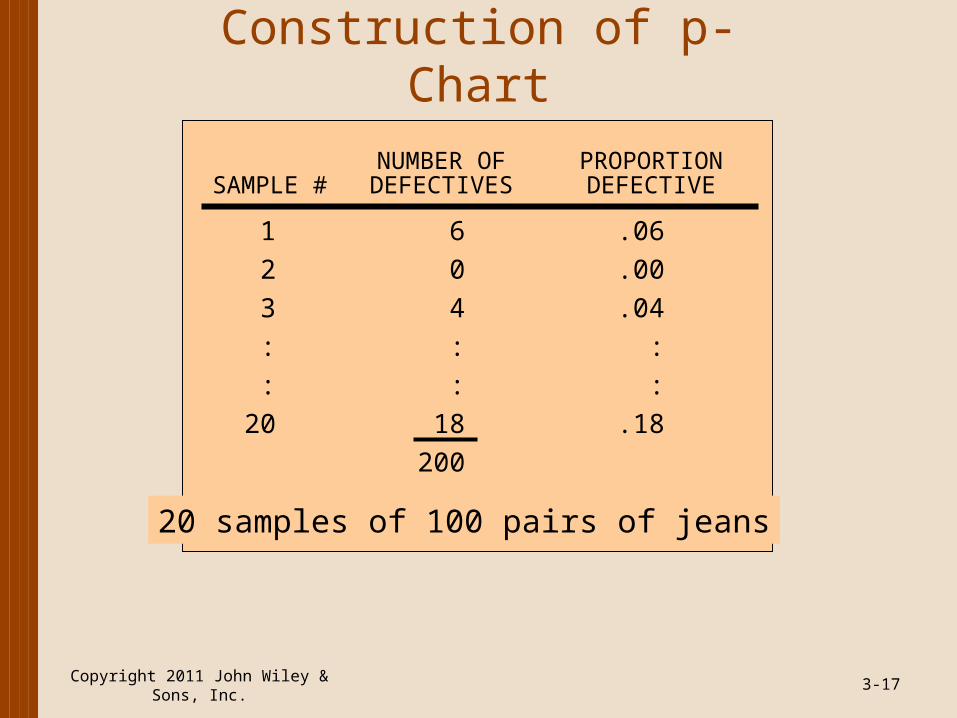
Construction of p-Chart
Copyright 2011 John Wiley & Sons, Inc. 3-17
20 samples of 100 pairs of jeans
NUMBER OF PROPORTIONSAMPLE # DEFECTIVES DEFECTIVE
1 6 .06
2 0 .00
3 4 .04
: : :
: : :
20 18 .18
200
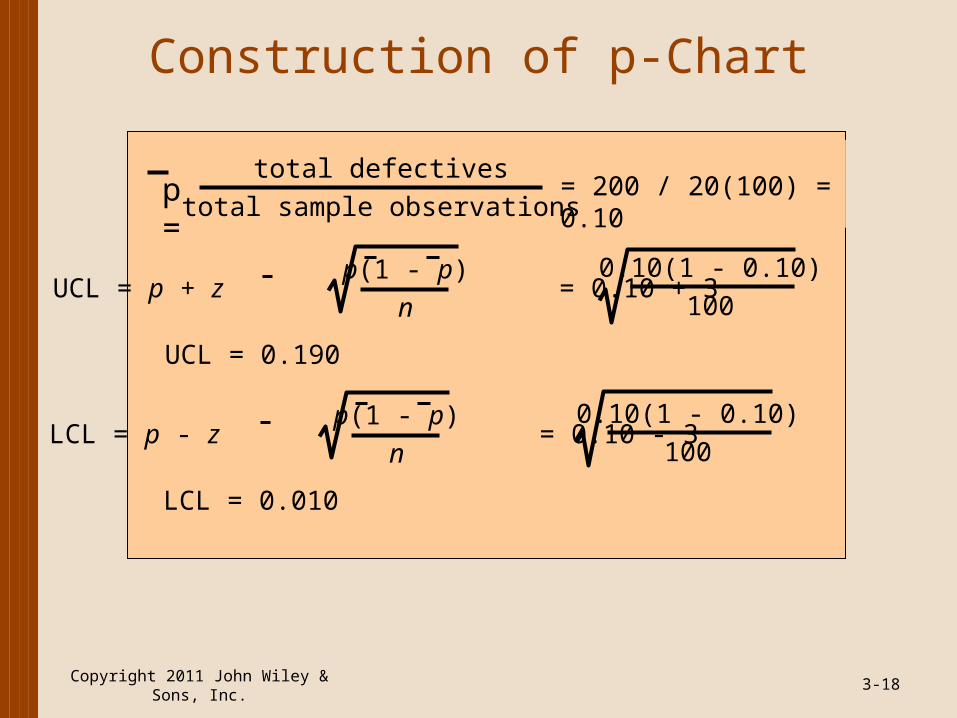
Construction of p-Chart
Copyright 2011 John Wiley & Sons, Inc. 3-18
UCL = p + z = 0.10 + 3p(1 - p)
n
0.10(1 - 0.10)
100
UCL = 0.190
LCL = 0.010
LCL = p - z = 0.10 - 3p(1 - p)
n
0.10(1 - 0.10)
100
= 200 / 20(100) = 0.10total defectives
total sample observationsp =
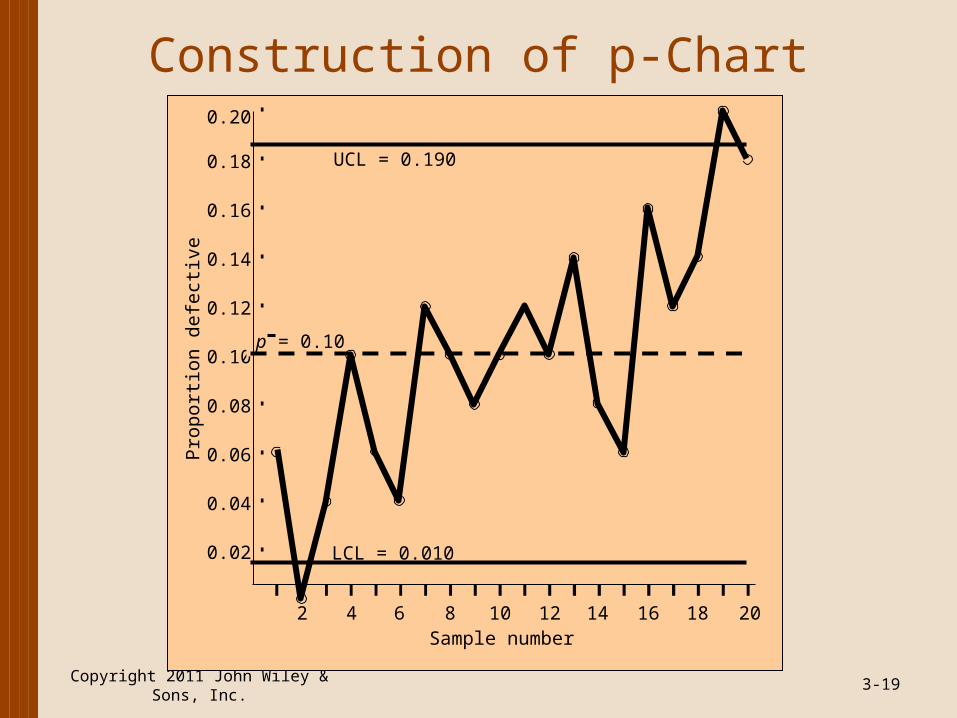
Construction of p-Chart
Copyright 2011 John Wiley & Sons, Inc. 3-19
0.02
0.04
0.06
0.08
0.10
0.12
0.14
0.16
0.18
0.20
Pro
por
tion
defe
ctiv
e
Sample number2 4 6 8 10 12 14 16 18 20
UCL = 0.190
LCL = 0.010
p = 0.10
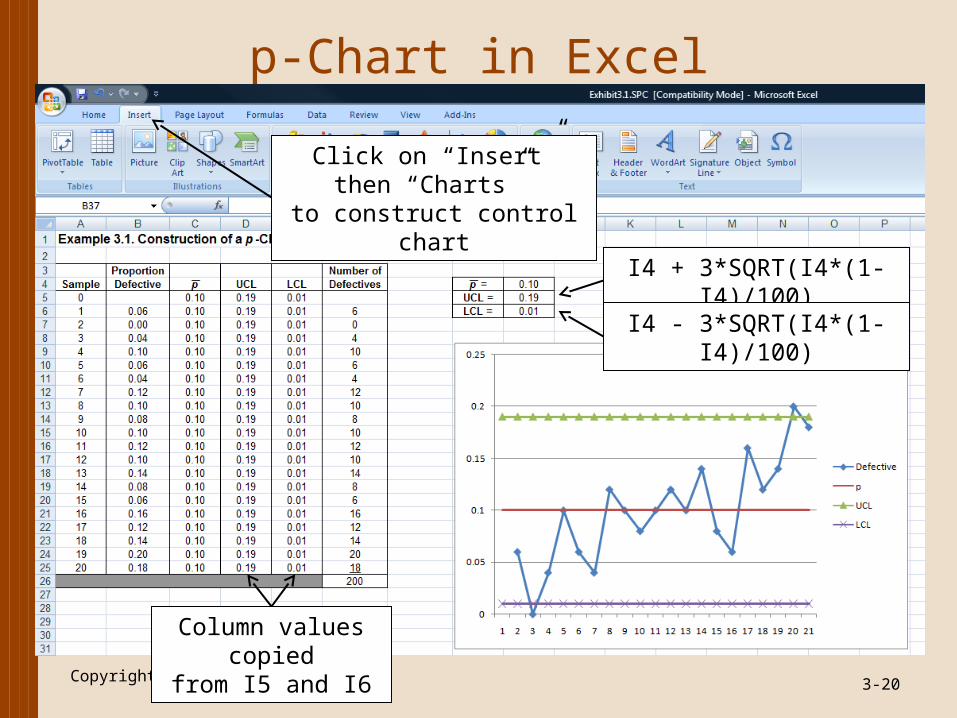
p-Chart in Excel
Copyright 2011 John Wiley & Sons, Inc. 3-20
Click on “Insert” then “Charts”
to construct control chart
I4 + 3*SQRT(I4*(1-I4)/100)
I4 - 3*SQRT(I4*(1-I4)/100)
Column values copiedfrom I5 and I6
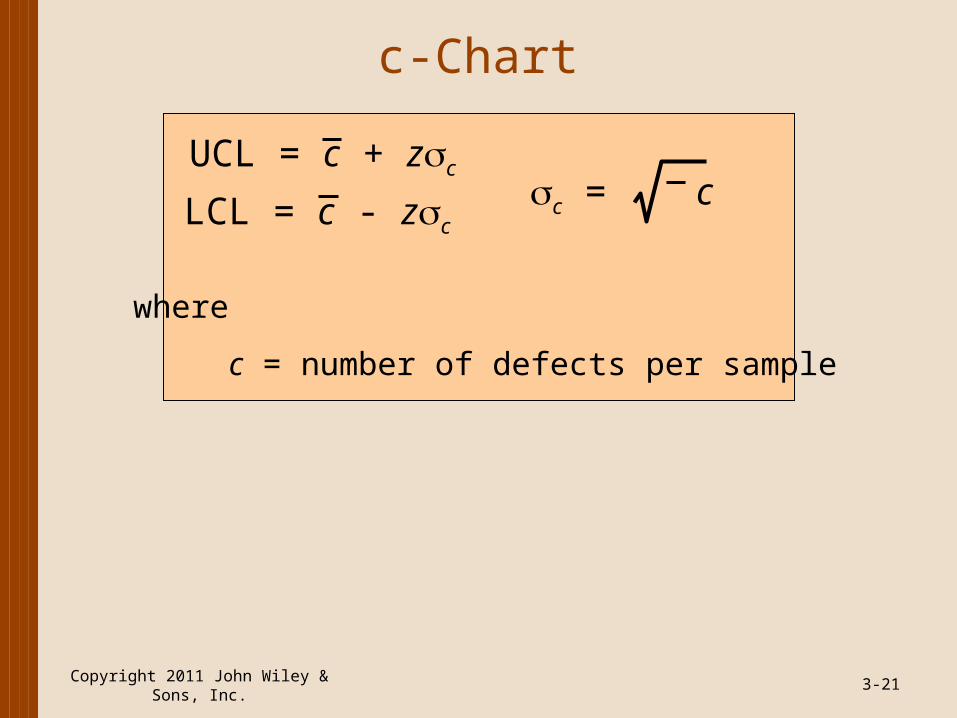
c-Chart
Copyright 2011 John Wiley & Sons, Inc. 3-21
UCL = c + zc
LCL = c - zc
where
c = number of defects per sample
c = c
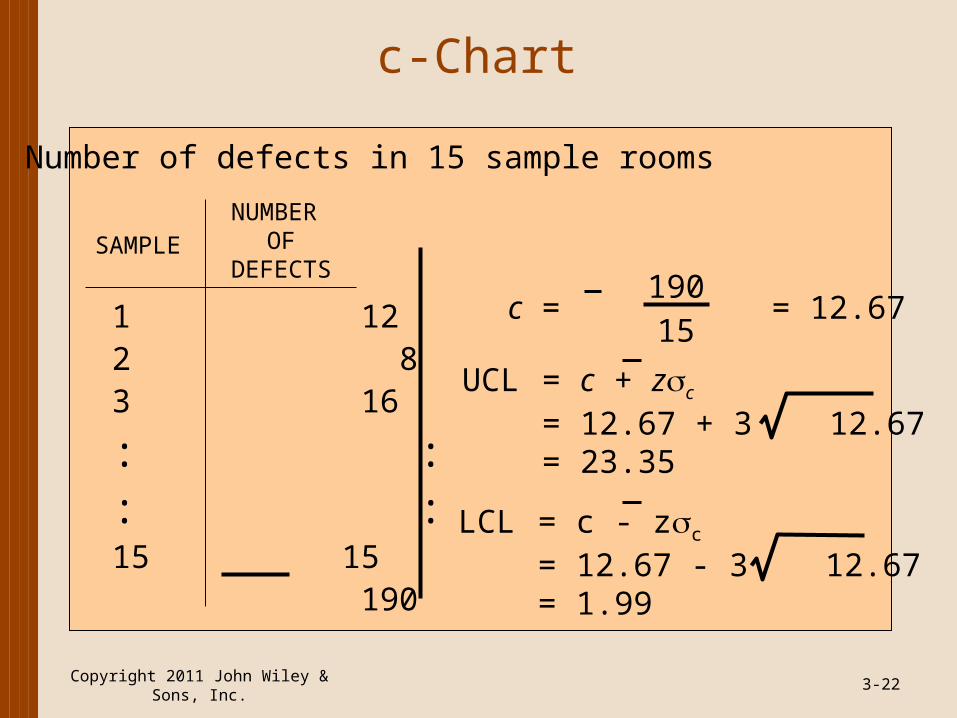
c-Chart
Copyright 2011 John Wiley & Sons, Inc. 3-22
Number of defects in 15 sample rooms
1 122 83 16
: :: :15 15 190
SAMPLE
c = = 12.6719015
UCL = c + zc
= 12.67 + 3 12.67= 23.35
LCL = c - zc
= 12.67 - 3 12.67= 1.99
NUMBER OF
DEFECTS
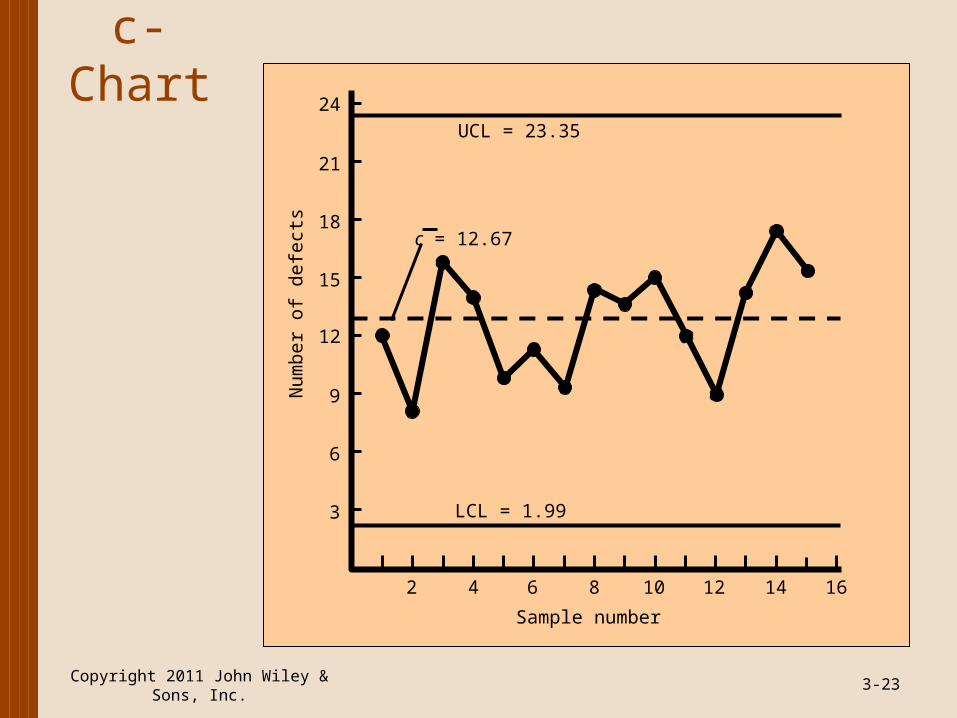
c-Chart
Copyright 2011 John Wiley & Sons, Inc. 3-23
3
6
9
12
15
18
21
24
Num
ber
of
defe
cts
Sample number
2 4 6 8 10 12 14 16
UCL = 23.35
LCL = 1.99
c = 12.67
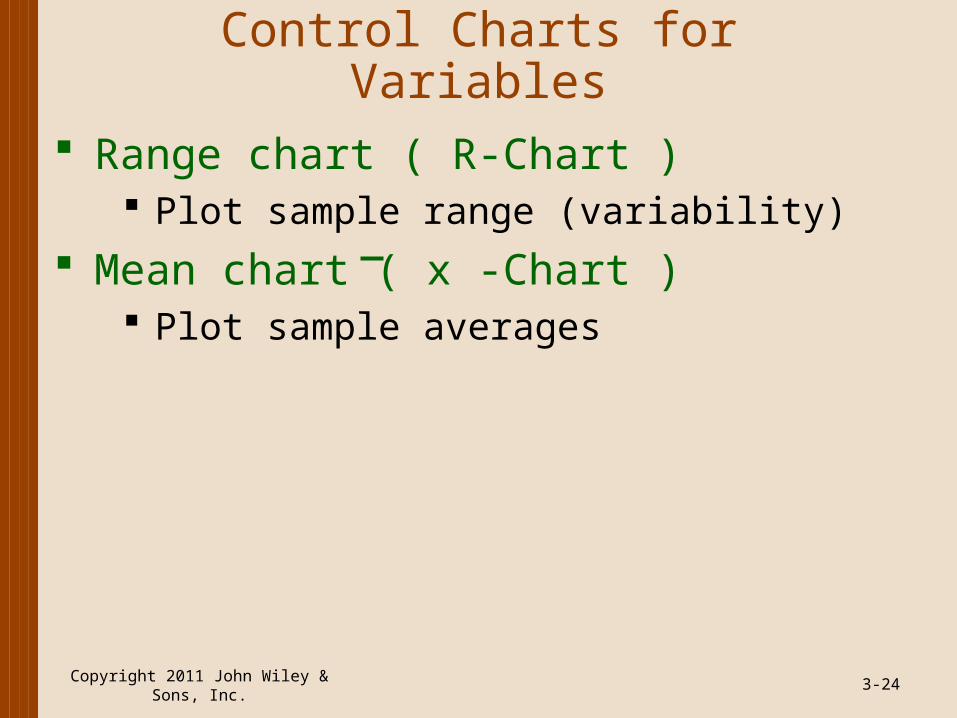
Control Charts for Variables
Copyright 2011 John Wiley & Sons, Inc. 3-24
Range chart ( R-Chart ) Plot sample range (variability)
Mean chart ( x -Chart ) Plot sample averages
3-25
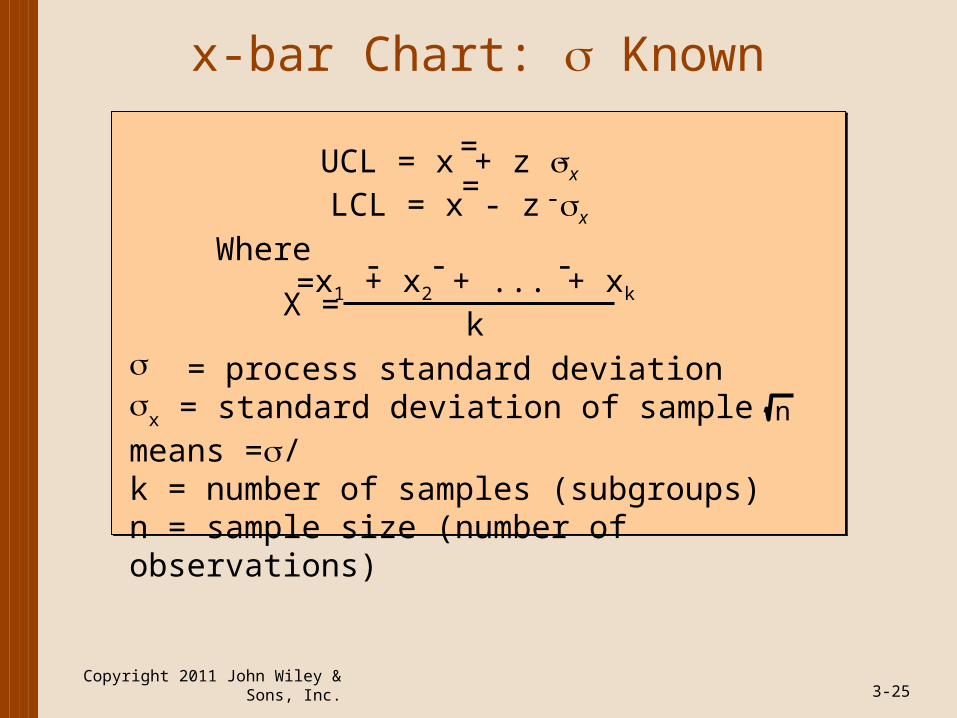
x-bar Chart: Known
UCL = x + z x LCL = x - z x
-
-
==
Where
= process standard deviation
x = standard deviation of sample means =/k = number of samples (subgroups)n = sample size (number of observations)
x1 + x2 + ... + xk
kX = =
- - -
n
Copyright 2011 John Wiley & Sons, Inc.
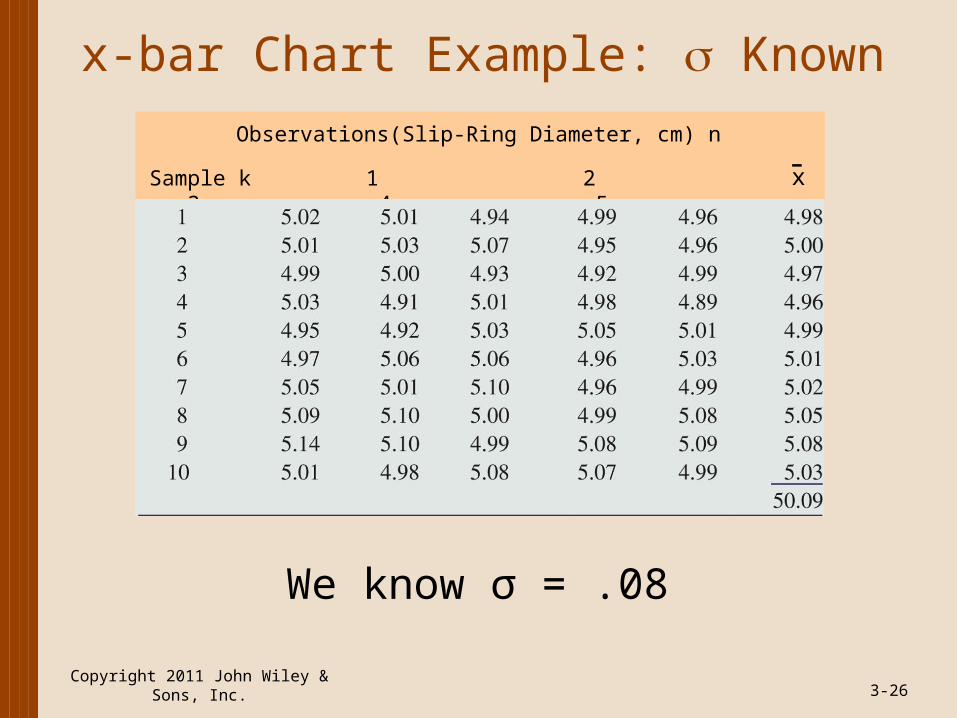
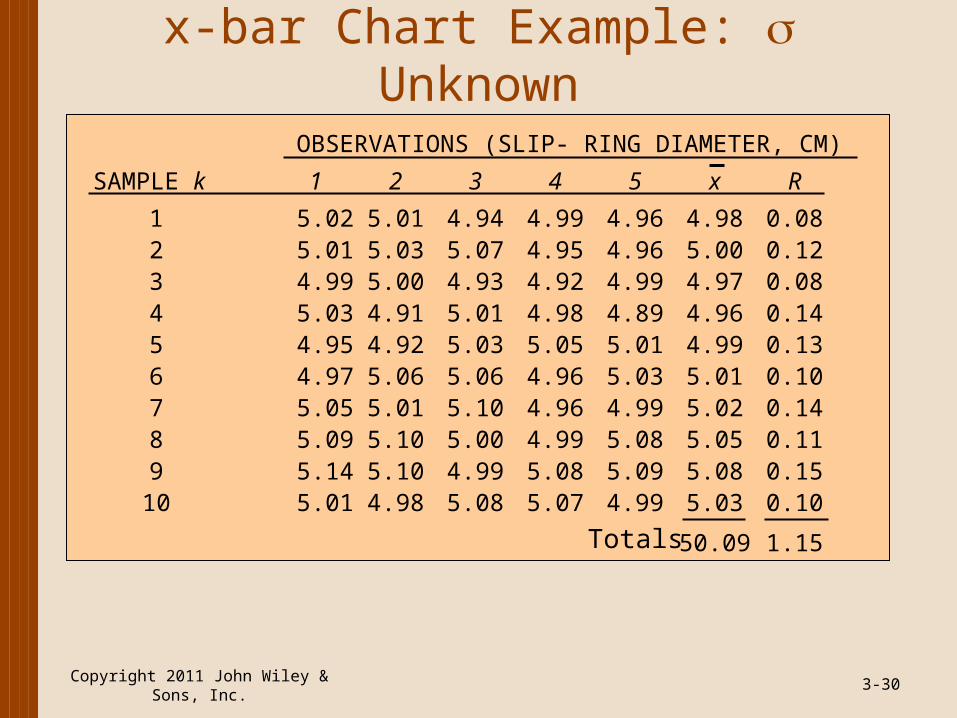
Observations(Slip-Ring Diameter, cm) n
Sample k 1 2 3 4 5 -
x-bar Chart Example: Known
Copyright 2011 John Wiley & Sons, Inc. 3-26
x
We know σ = .08
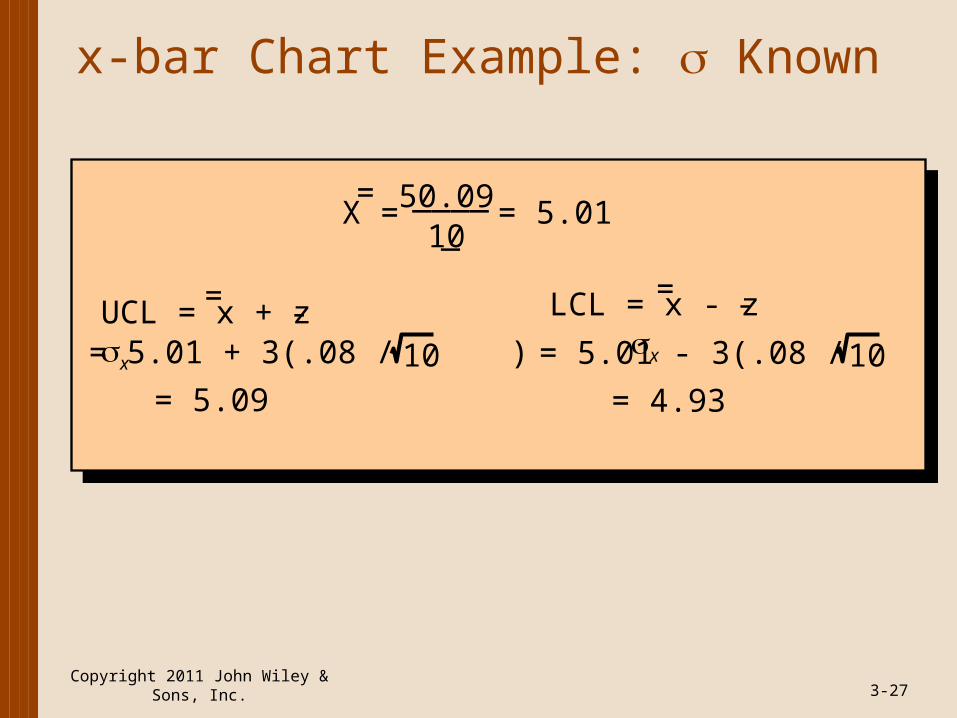
x-bar Chart Example: Known
Copyright 2011 John Wiley & Sons, Inc. 3-27
= 5.01 - 3(.08 / )10
= 4.93
_____10
50.09 = 5.01X =
=
LCL = x - z x = -UCL = x + z x
= -= 5.01 + 3(.08 / )10
= 5.09
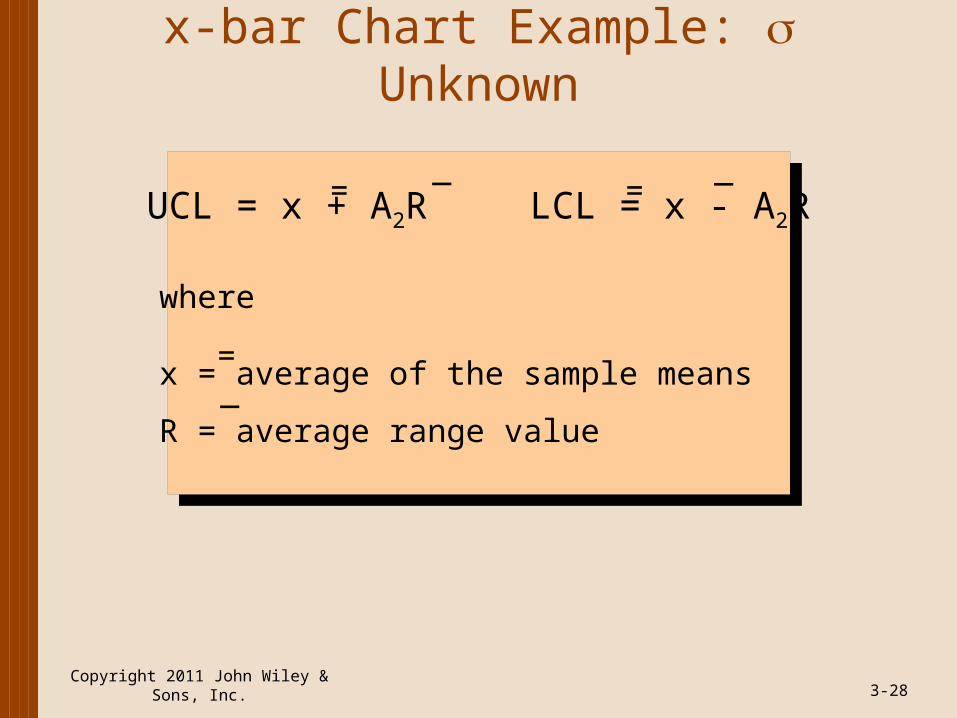
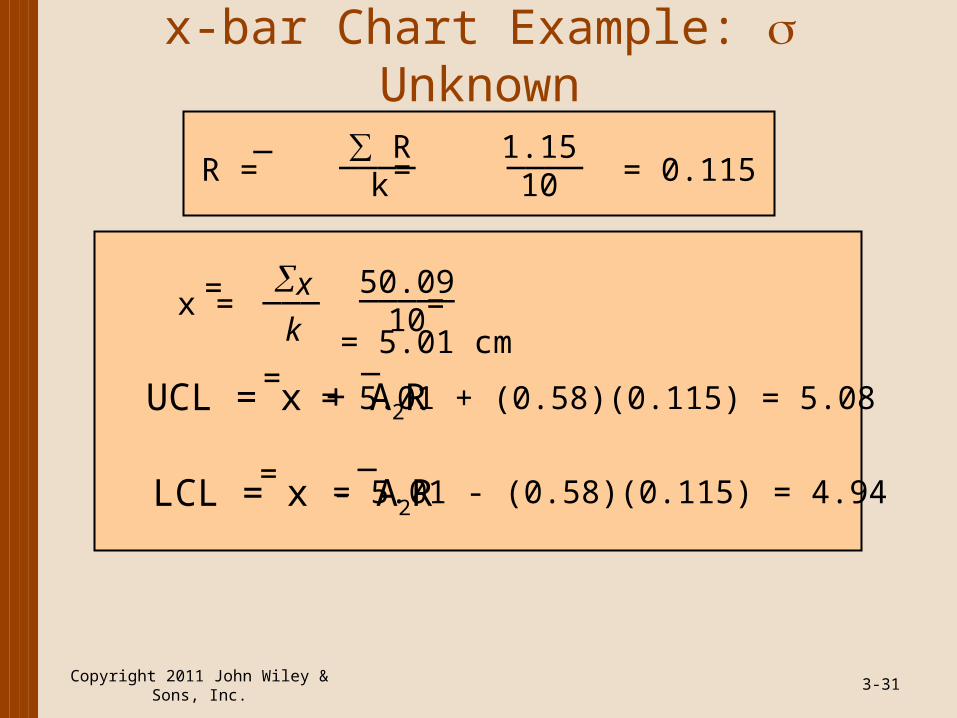
x-bar Chart Example: Unknown
Copyright 2011 John Wiley & Sons, Inc. 3-28
_UCL = x + A2R LCL = x - A2R
= =_
where
x = average of the sample means
R = average range value
=_
Copyright 2011 John Wiley & Sons, Inc. 3-29
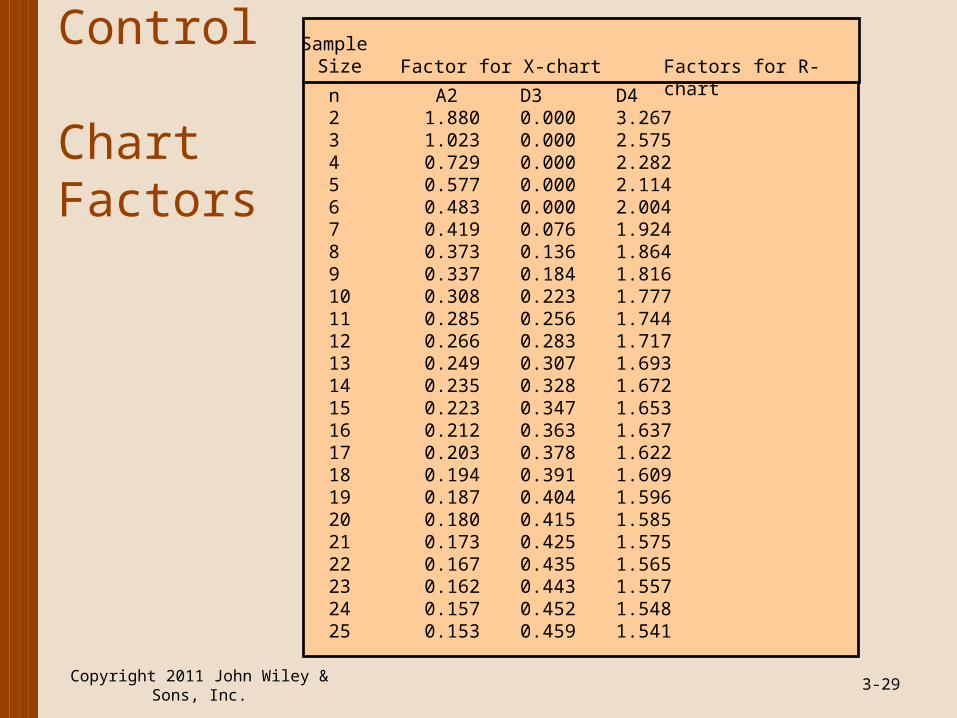
Control Chart Factors
n A2 D3 D42 1.880 0.000 3.2673 1.023 0.000 2.5754 0.729 0.000 2.2825 0.577 0.000 2.1146 0.483 0.000 2.0047 0.419 0.076 1.9248 0.373 0.136 1.8649 0.337 0.184 1.81610 0.308 0.223 1.77711 0.285 0.256 1.74412 0.266 0.283 1.71713 0.249 0.307 1.69314 0.235 0.328 1.67215 0.223 0.347 1.65316 0.212 0.363 1.63717 0.203 0.378 1.62218 0.194 0.391 1.60919 0.187 0.404 1.59620 0.180 0.415 1.58521 0.173 0.425 1.57522 0.167 0.435 1.56523 0.162 0.443 1.55724 0.157 0.452 1.54825 0.153 0.459 1.541
Factors for R-chartSample
Size Factor for X-chart
x-bar Chart Example: Unknown
Copyright 2011 John Wiley & Sons, Inc. 3-30
OBSERVATIONS (SLIP- RING DIAMETER, CM)
SAMPLE k 1 2 3 4 5 x R
1 5.02 5.01 4.94 4.99 4.96 4.98 0.082 5.01 5.03 5.07 4.95 4.96 5.00 0.123 4.99 5.00 4.93 4.92 4.99 4.97 0.084 5.03 4.91 5.01 4.98 4.89 4.96 0.145 4.95 4.92 5.03 5.05 5.01 4.99 0.136 4.97 5.06 5.06 4.96 5.03 5.01 0.107 5.05 5.01 5.10 4.96 4.99 5.02 0.148 5.09 5.10 5.00 4.99 5.08 5.05 0.119 5.14 5.10 4.99 5.08 5.09 5.08 0.15
10 5.01 4.98 5.08 5.07 4.99 5.03 0.10
50.09 1.15Totals
x-bar Chart Example: Unknown
Copyright 2011 John Wiley & Sons, Inc. 3-31
∑ Rk
1.1510R = = = 0.115
_ ____ ____
_UCL = x + A2R
=
= 50.0910
_____x = = = 5.01 cmx
k___
= 5.01 + (0.58)(0.115) = 5.08
_LCL = x - A2R
== 5.01 - (0.58)(0.115) = 4.94
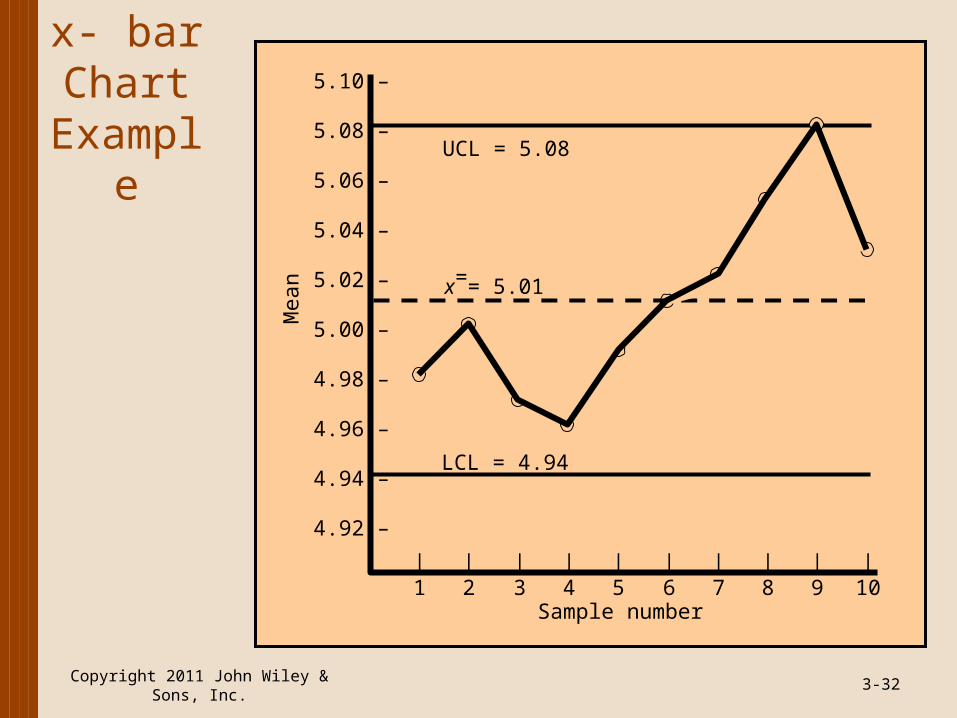
x- bar Chart
Example
Copyright 2011 John Wiley & Sons, Inc. 3-32
UCL = 5.08
LCL = 4.94
Mea
n
Sample number
|1
|2
|3
|4
|5
|6
|7
|8
|9
|10
5.10 –
5.08 –
5.06 –
5.04 –
5.02 –
5.00 –
4.98 –
4.96 –
4.94 –
4.92 –
x = 5.01=
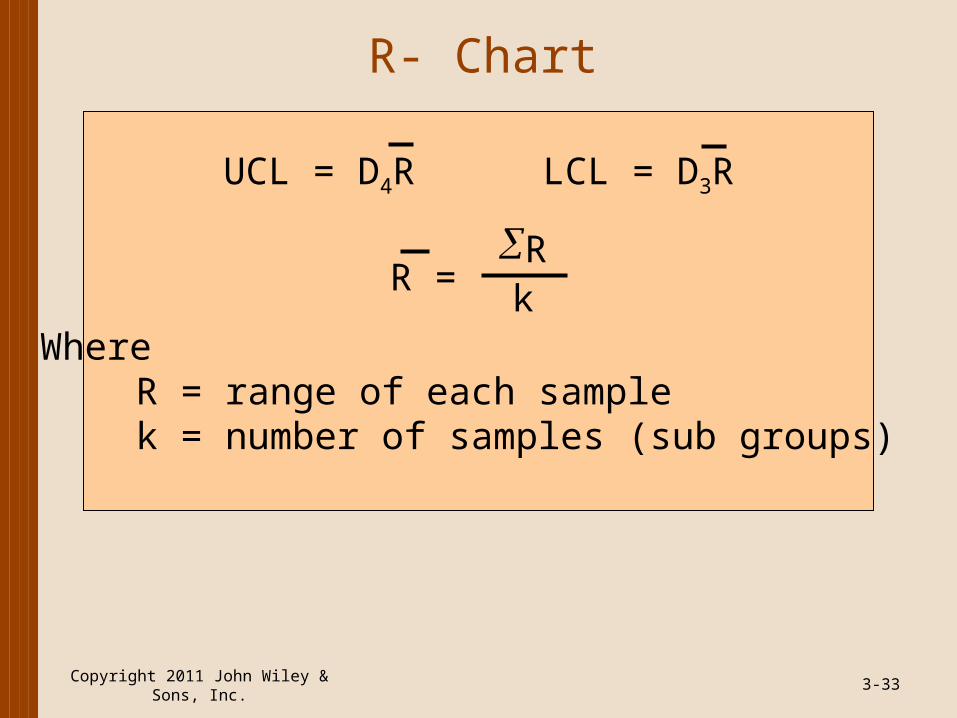
R- Chart
Copyright 2011 John Wiley & Sons, Inc. 3-33
UCL = D4R LCL = D3R
R = Rk
WhereR = range of each samplek = number of samples (sub groups)
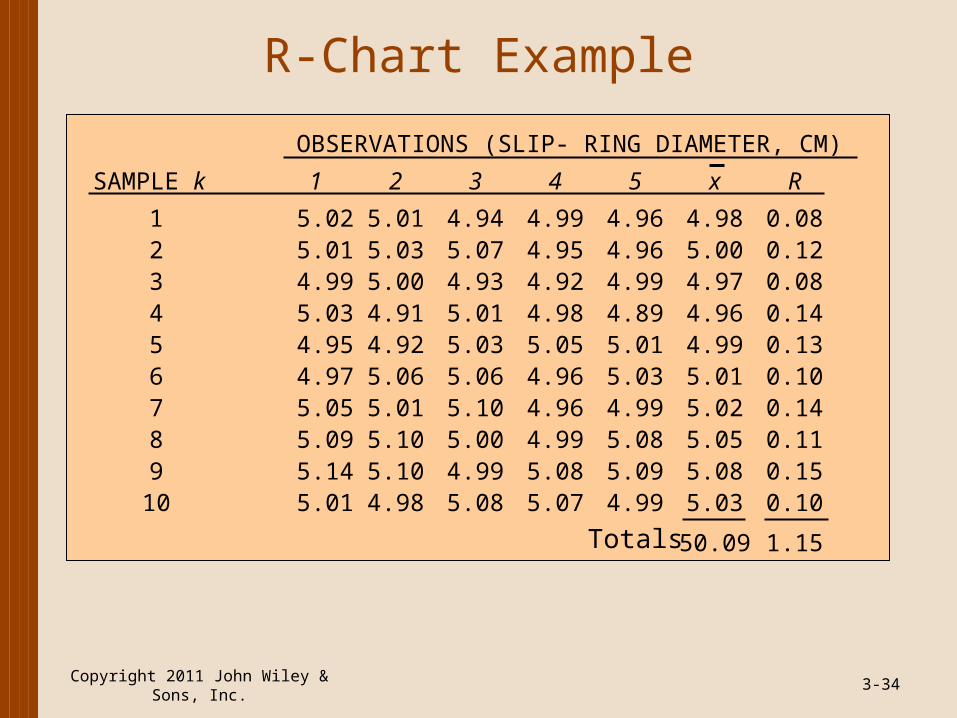
R-Chart Example
Copyright 2011 John Wiley & Sons, Inc. 3-34
OBSERVATIONS (SLIP- RING DIAMETER, CM)
SAMPLE k 1 2 3 4 5 x R
1 5.02 5.01 4.94 4.99 4.96 4.98 0.082 5.01 5.03 5.07 4.95 4.96 5.00 0.123 4.99 5.00 4.93 4.92 4.99 4.97 0.084 5.03 4.91 5.01 4.98 4.89 4.96 0.145 4.95 4.92 5.03 5.05 5.01 4.99 0.136 4.97 5.06 5.06 4.96 5.03 5.01 0.107 5.05 5.01 5.10 4.96 4.99 5.02 0.148 5.09 5.10 5.00 4.99 5.08 5.05 0.119 5.14 5.10 4.99 5.08 5.09 5.08 0.15
10 5.01 4.98 5.08 5.07 4.99 5.03 0.10
50.09 1.15Totals
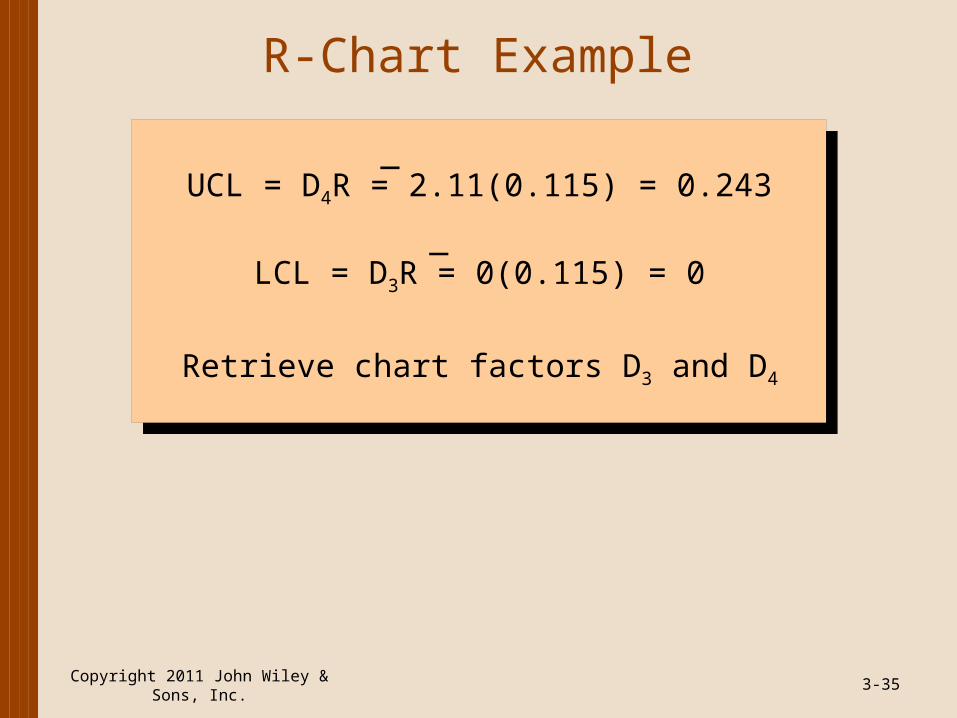
R-Chart Example
Copyright 2011 John Wiley & Sons, Inc. 3-35
Retrieve chart factors D3 and D4
UCL = D4R = 2.11(0.115) = 0.243
LCL = D3R = 0(0.115) = 0_
_
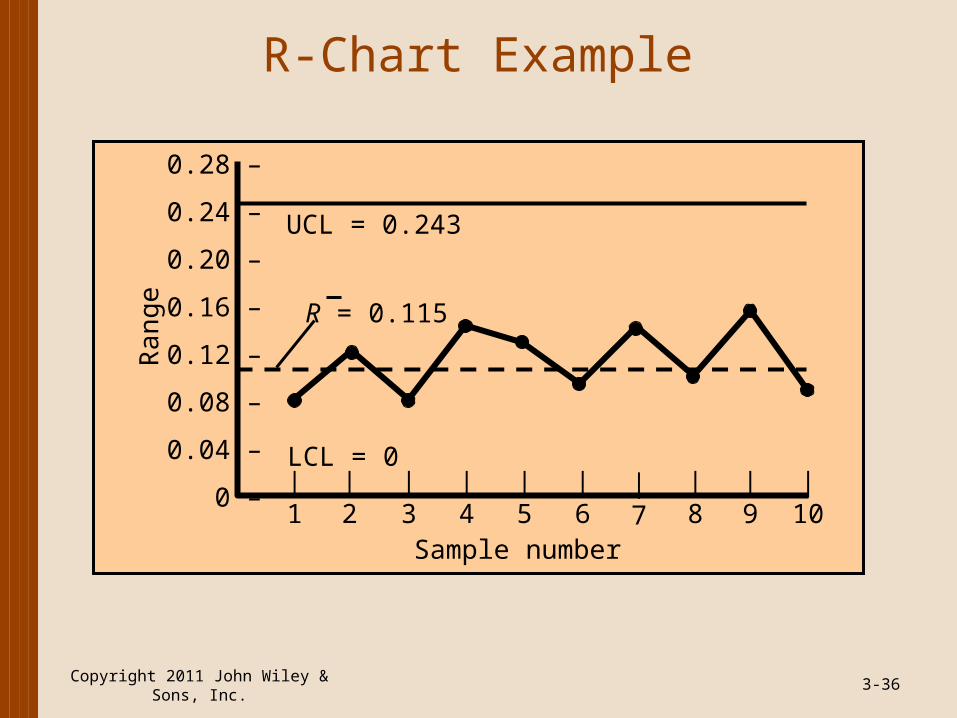
R-Chart Example
Copyright 2011 John Wiley & Sons, Inc. 3-36
UCL = 0.243
LCL = 0
Ra
nge
Sample number
R = 0.115
|1
|2
|3
|4
|5
|6
|7
|8
|9
|10
0.28 –
0.24 –
0.20 –
0.16 –
0.12 –
0.08 –
0.04 –
0 –
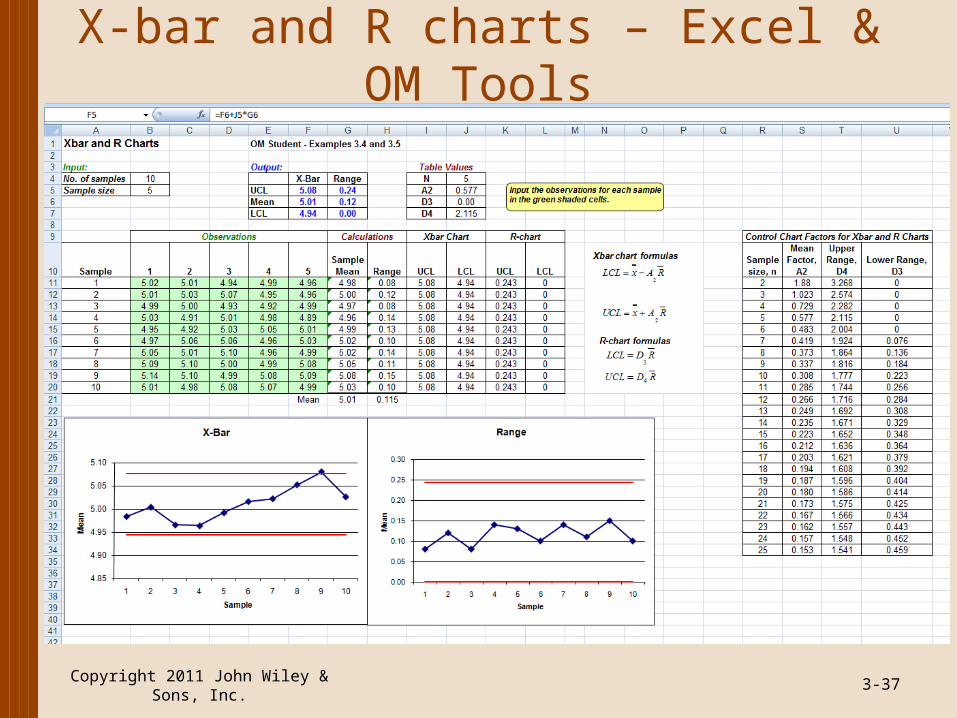
X-bar and R charts – Excel & OM Tools
Copyright 2011 John Wiley & Sons, Inc. 3-37
Using x- bar and R-Charts Together
• Process average and process variability must be in control
• Samples can have very narrow ranges, but sample averages might be beyond control limits
• Or, sample averages may be in control, but ranges might be out of control
• An R-chart might show a distinct downward trend, suggesting some nonrandom cause is reducing variation
Copyright 2011 John Wiley & Sons, Inc. 3-38
Control Chart Patterns
• Run• sequence of sample values that display same
characteristic
• Pattern test• determines if observations within limits of a control
chart display a nonrandom pattern
Copyright 2011 John Wiley & Sons, Inc. 3-39
Control Chart Patterns
• To identify a pattern look for:• 8 consecutive points on one side of the center line• 8 consecutive points up or down• 14 points alternating up or down• 2 out of 3 consecutive points in zone A (on one side
of center line)• 4 out of 5 consecutive points in zone A or B (on one
side of center line)
Copyright 2011 John Wiley & Sons, Inc. 3-40
Control Chart Patterns
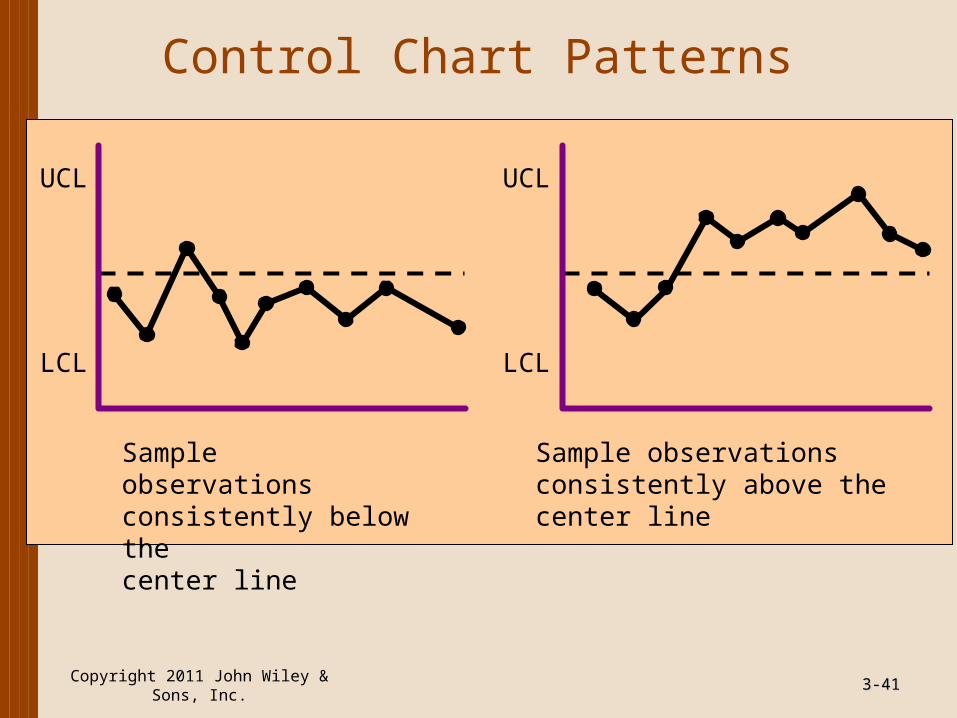
Copyright 2011 John Wiley & Sons, Inc. 3-3-4141
UCL
LCL
Sample observationsconsistently above thecenter line
LCL
UCL
Sample observationsconsistently below thecenter line
Control Chart Patterns
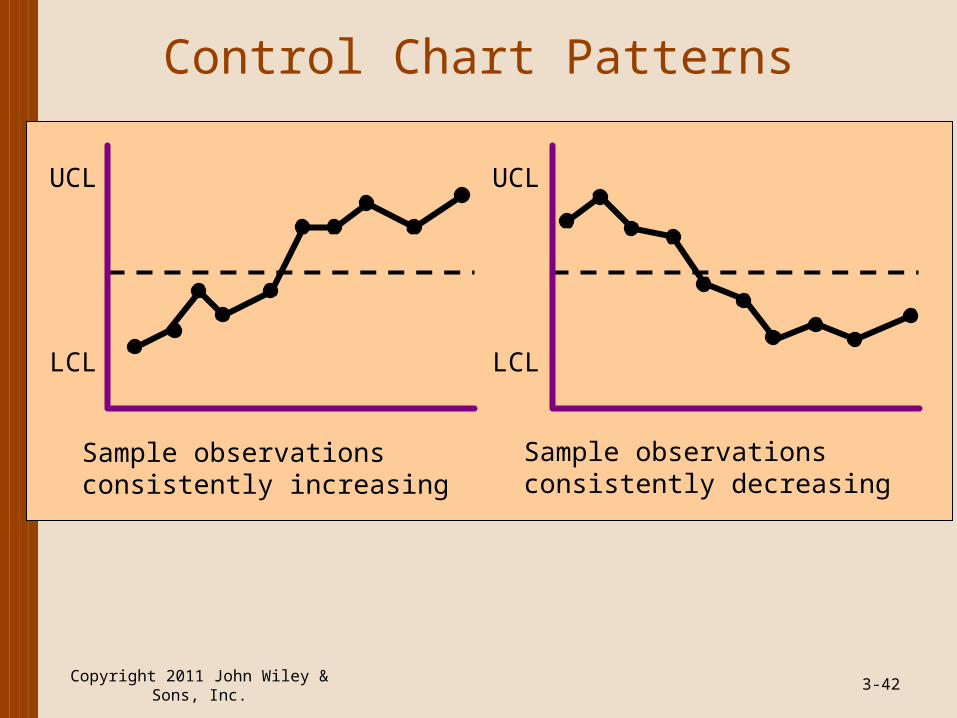
Copyright 2011 John Wiley & Sons, Inc. 3-42
LCL
UCL
Sample observationsconsistently increasing
UCL
LCL
Sample observationsconsistently decreasing
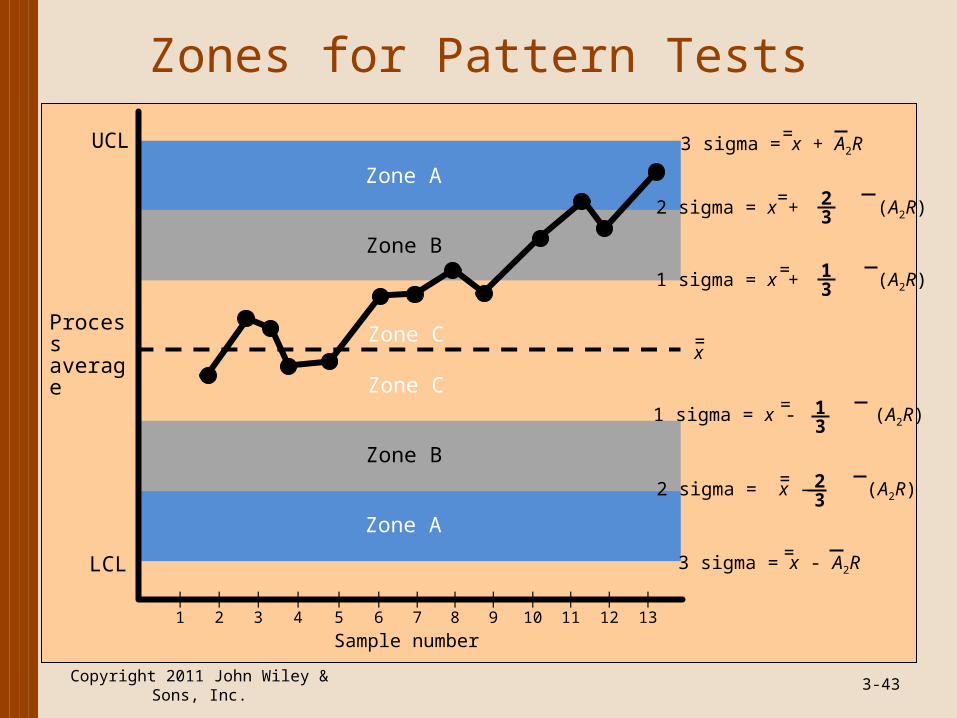
Zones for Pattern Tests
3-43
UCL
LCL
Zone A
Zone B
Zone C
Zone C
Zone B
Zone A
Process average
3 sigma = x + A2R=
3 sigma = x - A2R=
2 sigma = x + (A2R)= 23
2 sigma = x - (A2R)= 23
1 sigma = x + (A2R)= 13
1 sigma = x - (A2R)= 13
x=
Sample number
|1
|2
|3
|4
|5
|6
|7
|8
|9
|10
|11
|12
|13
Copyright 2011 John Wiley & Sons, Inc.
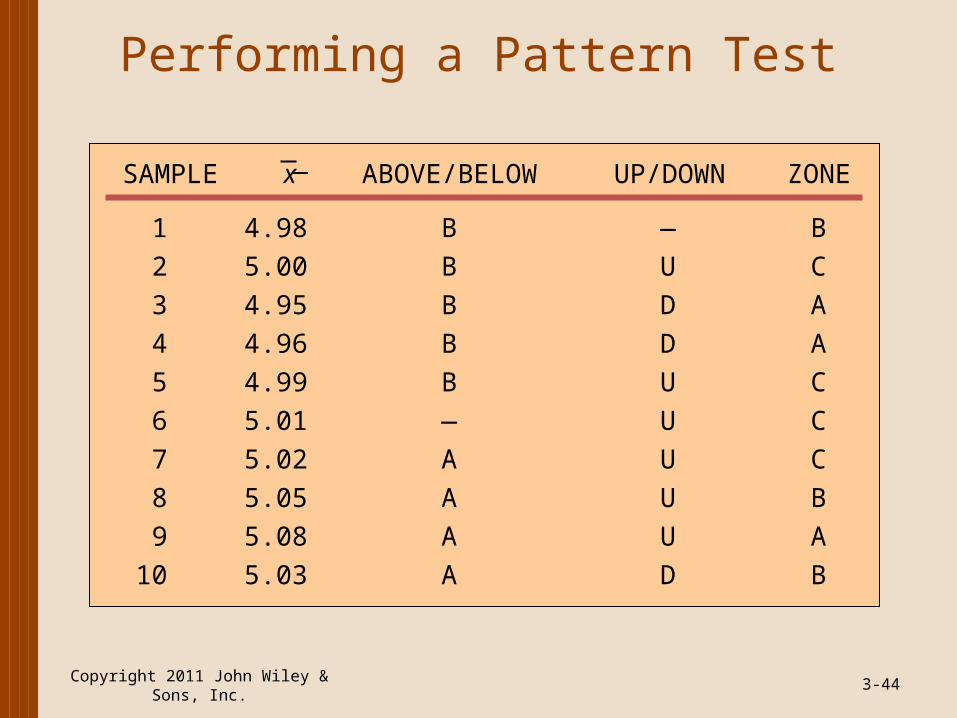
Performing a Pattern Test
Copyright 2011 John Wiley & Sons, Inc. 3-44
1 4.98 B — B
2 5.00 B U C
3 4.95 B D A
4 4.96 B D A
5 4.99 B U C
6 5.01 — U C
7 5.02 A U C
8 5.05 A U B
9 5.08 A U A
10 5.03 A D B
SAMPLE x ABOVE/BELOW UP/DOWN ZONE
Sample Size Determination
• Attribute charts require larger sample sizes• 50 to 100 parts in a sample
• Variable charts require smaller samples• 2 to 10 parts in a sample
Copyright 2011 John Wiley & Sons, Inc. 3-45
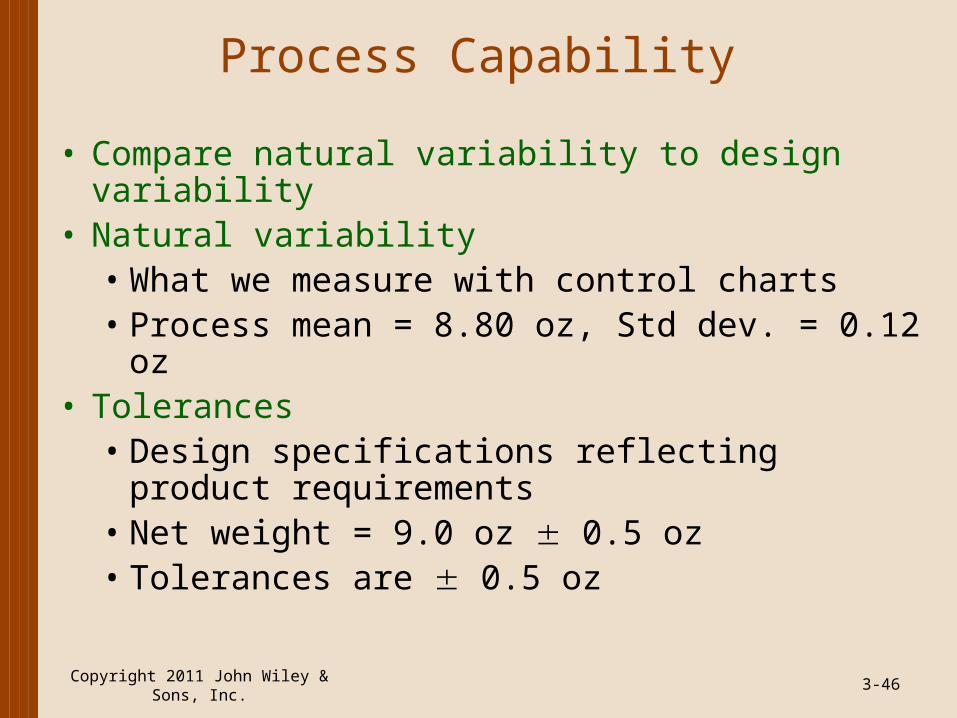
Process Capability
• Compare natural variability to design variability • Natural variability
• What we measure with control charts• Process mean = 8.80 oz, Std dev. = 0.12 oz
• Tolerances• Design specifications reflecting product
requirements• Net weight = 9.0 oz 0.5 oz • Tolerances are 0.5 oz
Copyright 2011 John Wiley & Sons, Inc. 3-46
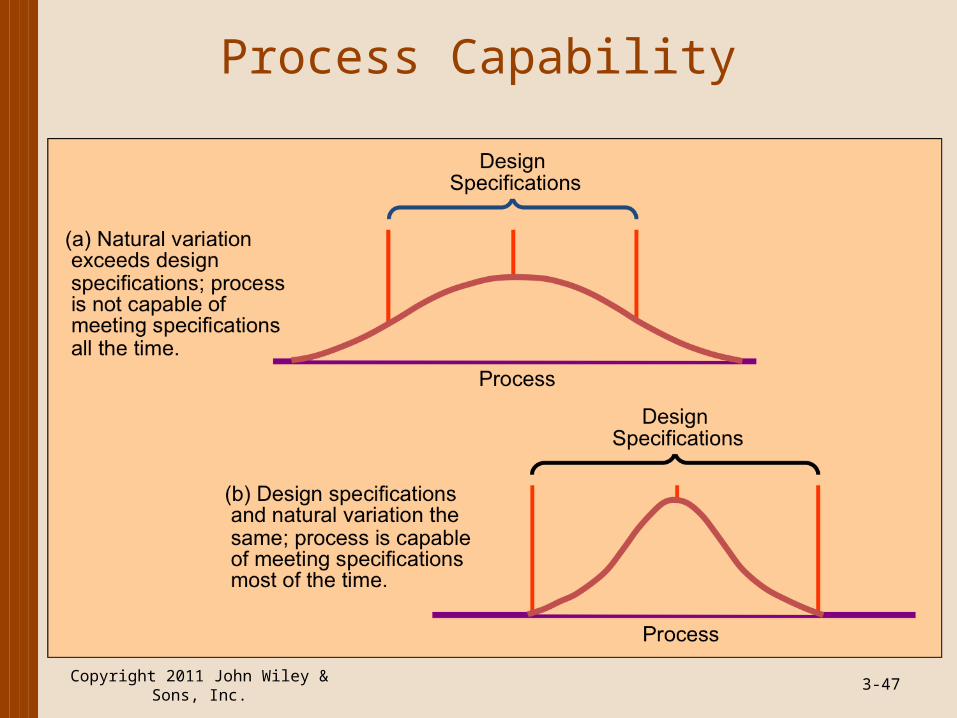
Process Capability
Copyright 2011 John Wiley & Sons, Inc. 3-47
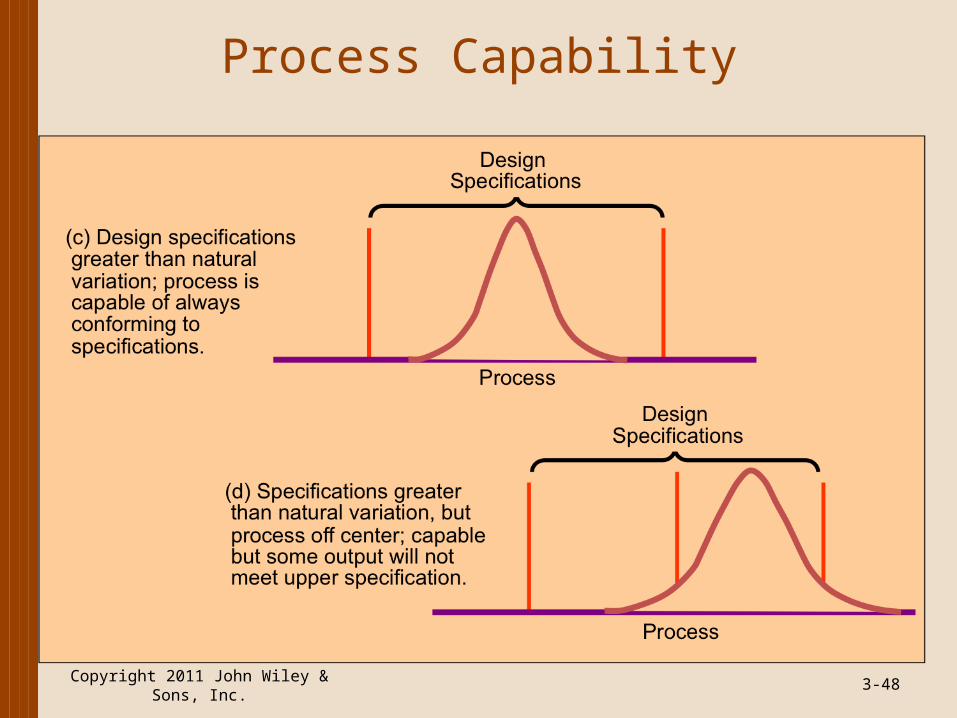
Process Capability
Copyright 2011 John Wiley & Sons, Inc. 3-48
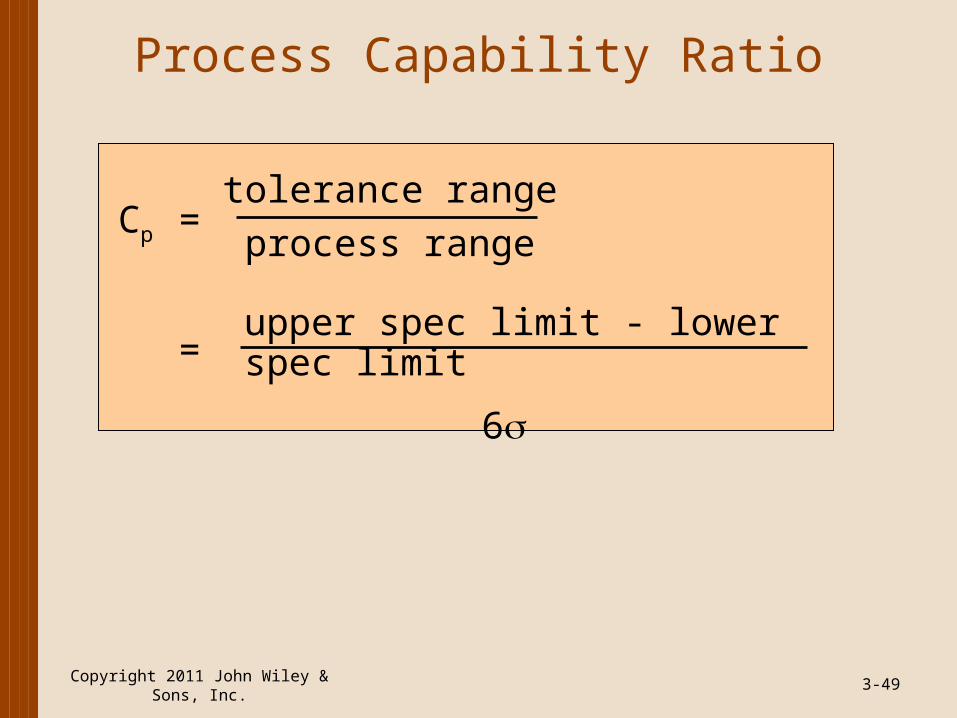
Process Capability Ratio
Copyright 2011 John Wiley & Sons, Inc. 3-49
Cp =tolerance range
process range
upper spec limit - lower spec limit
6=
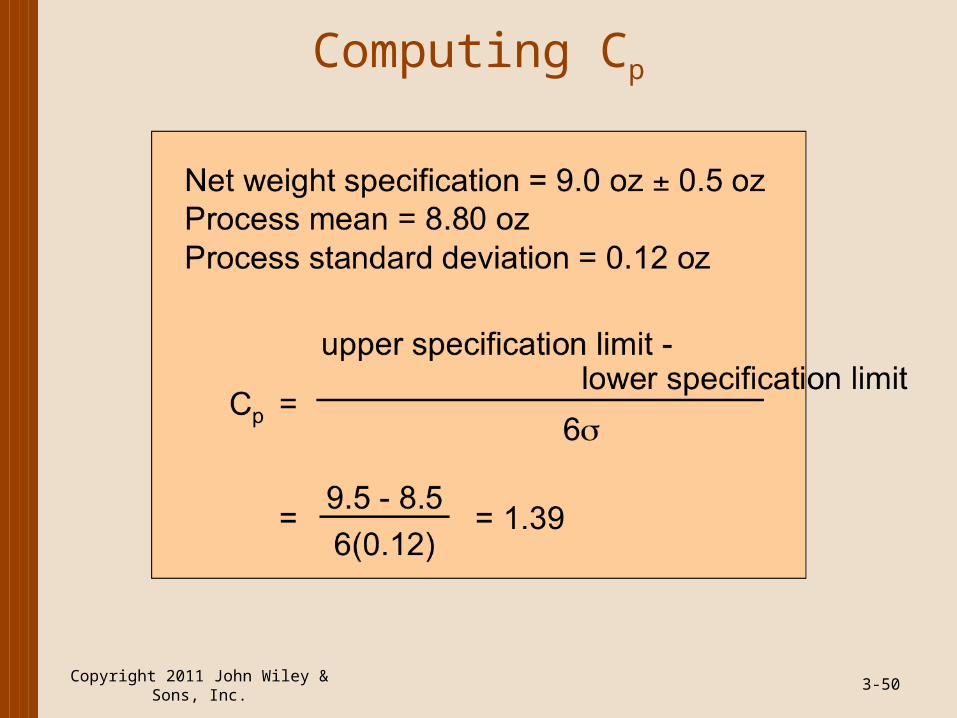
Computing Cp
Copyright 2011 John Wiley & Sons, Inc. 3-50
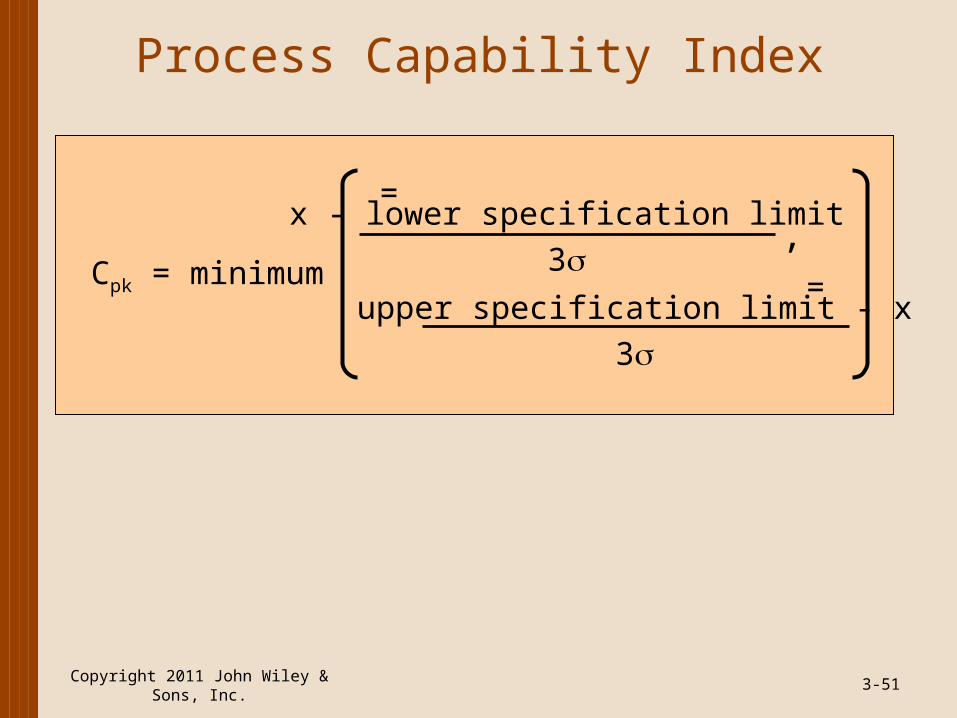
Process Capability Index
Copyright 2011 John Wiley & Sons, Inc. 3-51
Cpk = minimum
x - lower specification limit
3
=
upper specification limit - x
3
=
,
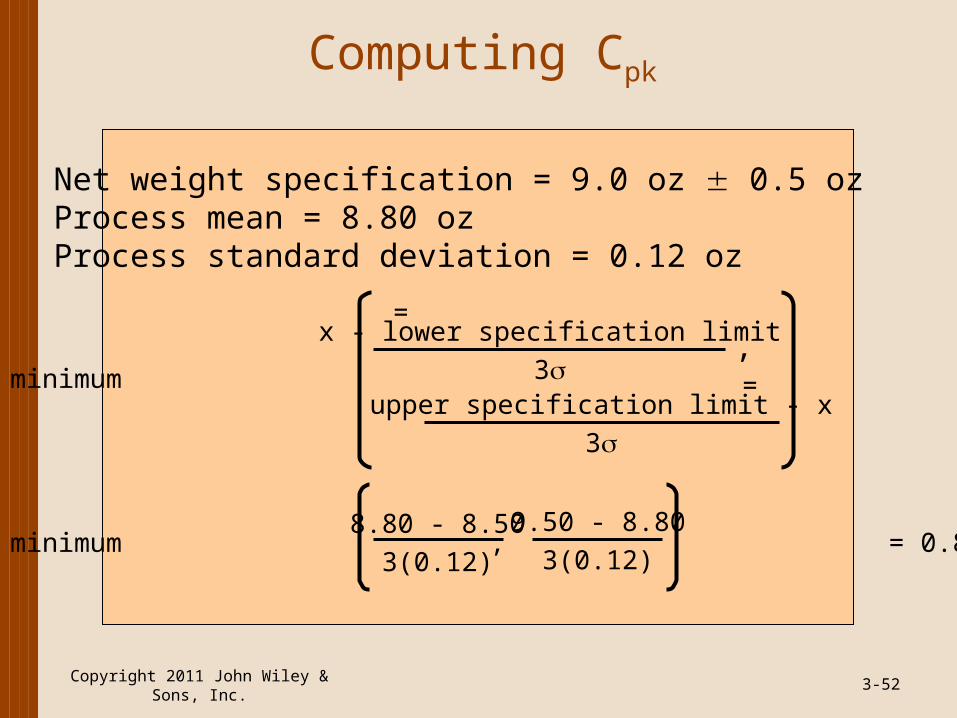
Computing Cpk
Copyright 2011 John Wiley & Sons, Inc. 3-52
Net weight specification = 9.0 oz 0.5 ozProcess mean = 8.80 ozProcess standard deviation = 0.12 oz
Cpk = minimum
= minimum , = 0.83
x - lower specification limit
3
=
upper specification limit - x
3
=
,
8.80 - 8.50
3(0.12)
9.50 - 8.80
3(0.12)
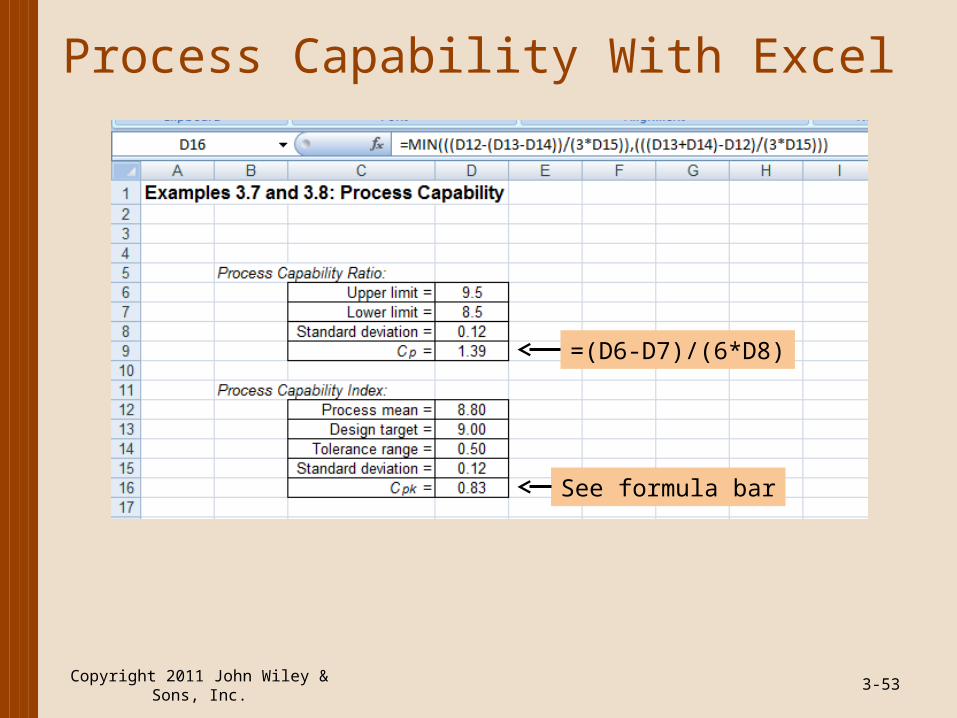
Process Capability With Excel
Copyright 2011 John Wiley & Sons, Inc. 3-53
=(D6-D7)/(6*D8)
See formula bar
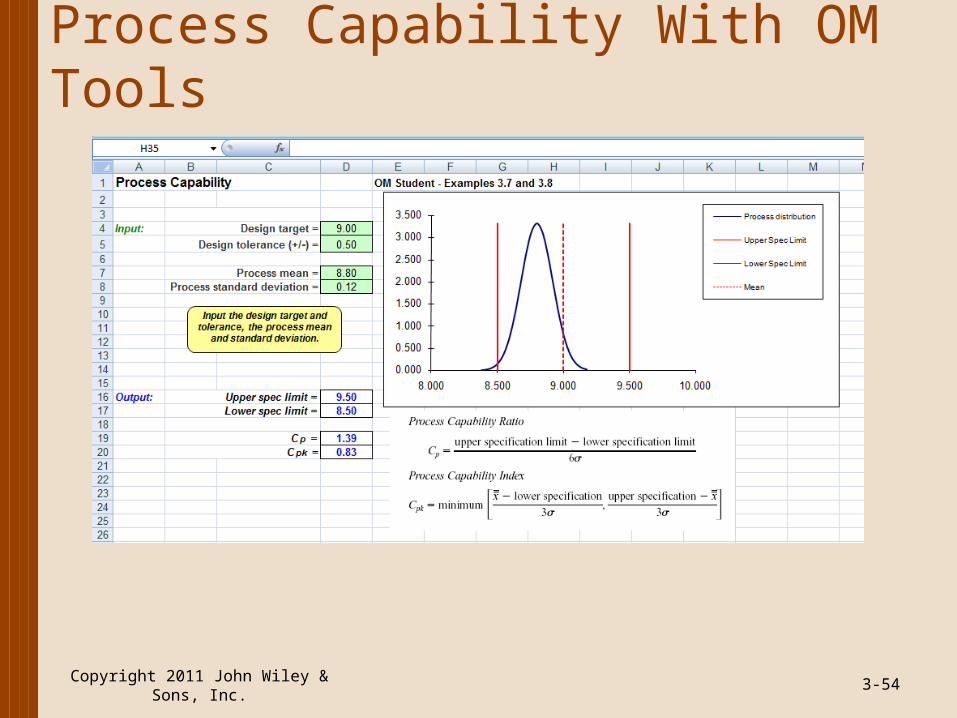
Process Capability With OM Tools
Copyright 2011 John Wiley & Sons, Inc. 3-54
Copyright 2011 John Wiley & Sons, Inc. 3-55
Copyright 2011 John Wiley & Sons, Inc.All rights reserved. Reproduction or translation of this work beyond that permitted in section 117 of the 1976 United States Copyright Act without express permission of the copyright owner is unlawful. Request for further information should be addressed to the Permission Department, John Wiley & Sons, Inc. The purchaser may make back-up copies for his/her own use only and not for distribution or resale. The Publisher assumes no responsibility for errors, omissions, or damages caused by the use of these programs or from the use of the information herein.


![[Psy] ch03](https://img.pdfslide.us/doc/110x75/555d741ad8b42a687b8b53c6/psy-ch03.jpg)