Embed Size (px)
Citation preview

http://www.cs.ubc.ca/~tmm/courses/547-19
Ch 4/5/6: Validation, Marks & Channels, Rules of Thumb Paper: Artery VisTamara MunznerDepartment of Computer ScienceUniversity of British Columbia
CPSC 547, Information VisualizationWeek 3: 24 September 2019

News
• schedule today–discussion: readings–papers: types and strategies for reading–exercise: Decoding
• presentations plan–yes, we'll have presentations–presentation topic choices will be due Oct 25–stay tuned for more on presentation topics
2

Ch 4: Validation
3

VAD Ch 4: Analysis: Four Levels for Validation
4
Data/task abstraction
Visual encoding/interaction idiom
Algorithm
Domain situation

5
Four levels of design and validation
• four levels of design problems–different threats to validity at each level
Domain situationYou misunderstood their needs
You’re showing them the wrong thing
Visual encoding/interaction idiomThe way you show it doesn’t work
AlgorithmYour code is too slow
Data/task abstraction

6
• mismatch: cannot show idiom good with system timings• mismatch: cannot show abstraction good with lab study
Validation by level
Domain situationObserve target users using existing tools
Visual encoding/interaction idiomJustify design with respect to alternatives
AlgorithmMeasure system time/memoryAnalyze computational complexity
Observe target users after deployment ( )
Measure adoption
Analyze results qualitativelyMeasure human time with lab experiment (lab study)
Data/task abstraction

7
Directionality & scope
Data/task abstraction
Visual encoding/interaction idiom
Algorithm
Domain situationproblem-driven
work
technique-drivenwork

Ch 5: Marks & Channels
8

9
Definitions: Marks and channels• marks
– geometric primitives
• channels– control appearance of marks
Horizontal
Position
Vertical Both
Color
Shape Tilt
Size
Length Area Volume
Points Lines Areas

Encoding visually with marks and channels
• analyze idiom structure– as combination of marks and channels
10
1: vertical position
mark: line
2: vertical position horizontal position
mark: point
3: vertical position horizontal position color hue
mark: point
4: vertical position horizontal position color hue size (area)
mark: point
11
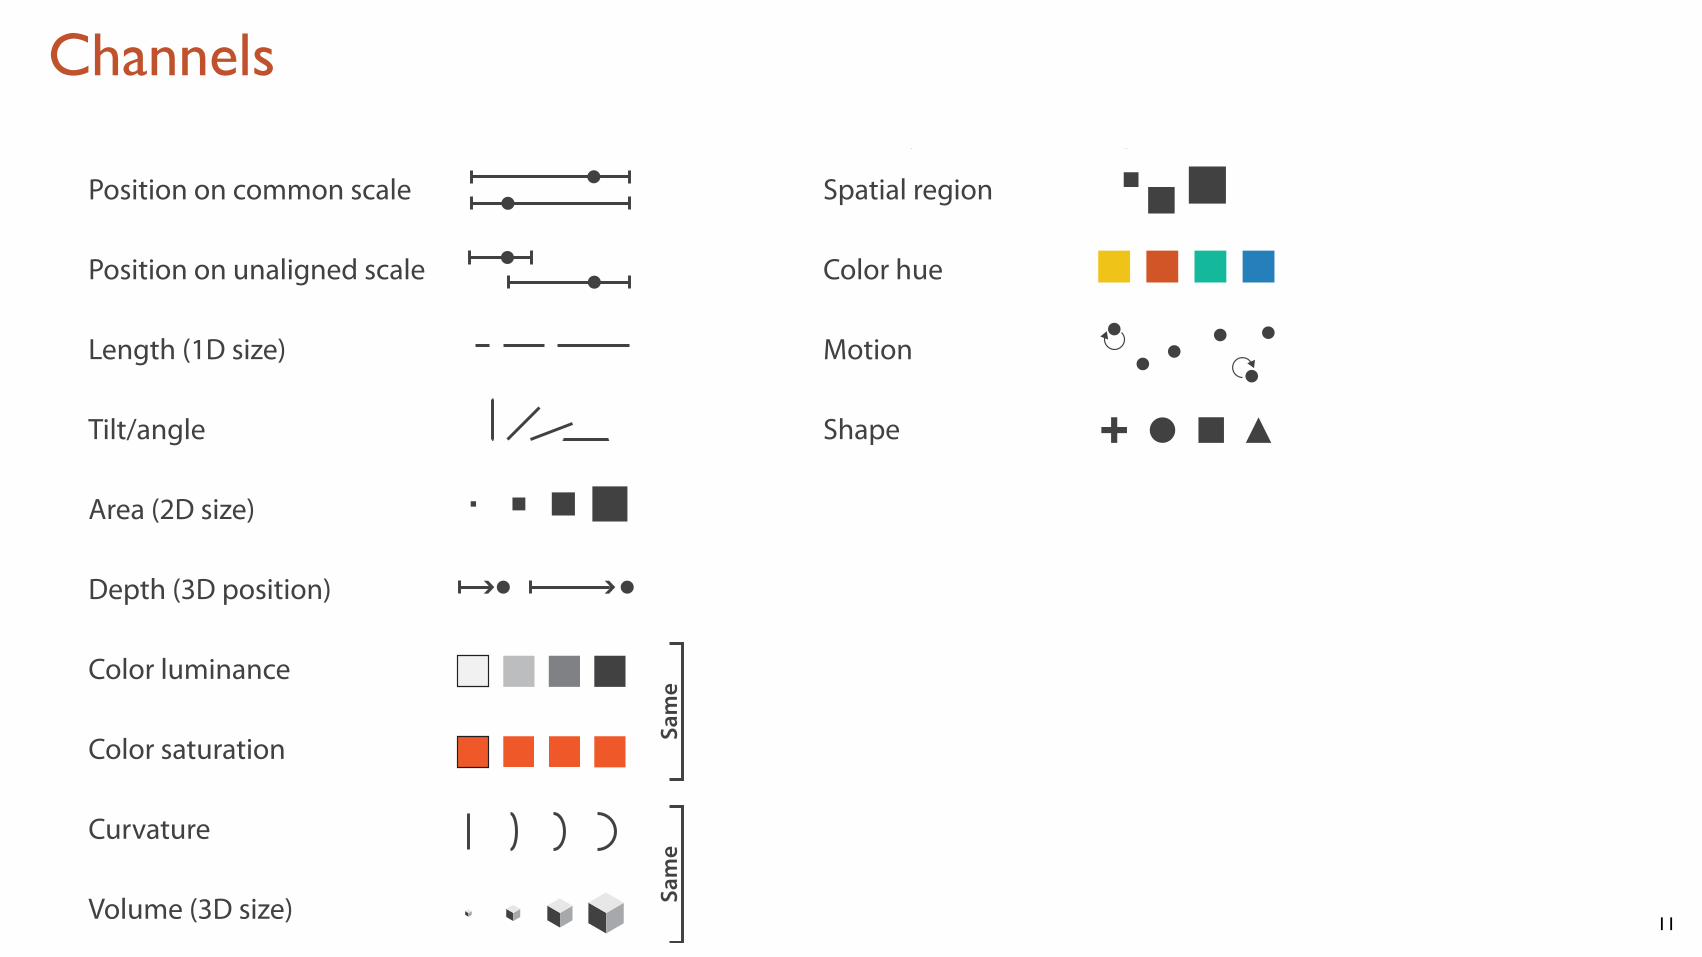
Channels: Expressiveness types and effectiveness rankingsMagnitude Channels: Ordered Attributes Identity Channels: Categorical Attributes
Spatial region
Color hue
Motion
Shape
Position on common scale
Position on unaligned scale
Length (1D size)
Tilt/angle
Area (2D size)
Depth (3D position)
Color luminance
Color saturation
Curvature
Volume (3D size)
Channels: Expressiveness Types And Effectiveness Ranks

12
Channels: RankingsMagnitude Channels: Ordered Attributes Identity Channels: Categorical Attributes
Spatial region
Color hue
Motion
Shape
Position on common scale
Position on unaligned scale
Length (1D size)
Tilt/angle
Area (2D size)
Depth (3D position)
Color luminance
Color saturation
Curvature
Volume (3D size)
Channels: Expressiveness Types And Effectiveness Ranks
• effectiveness principle– encode most important attributes with
highest ranked channels
• expressiveness principle– match channel and data characteristics
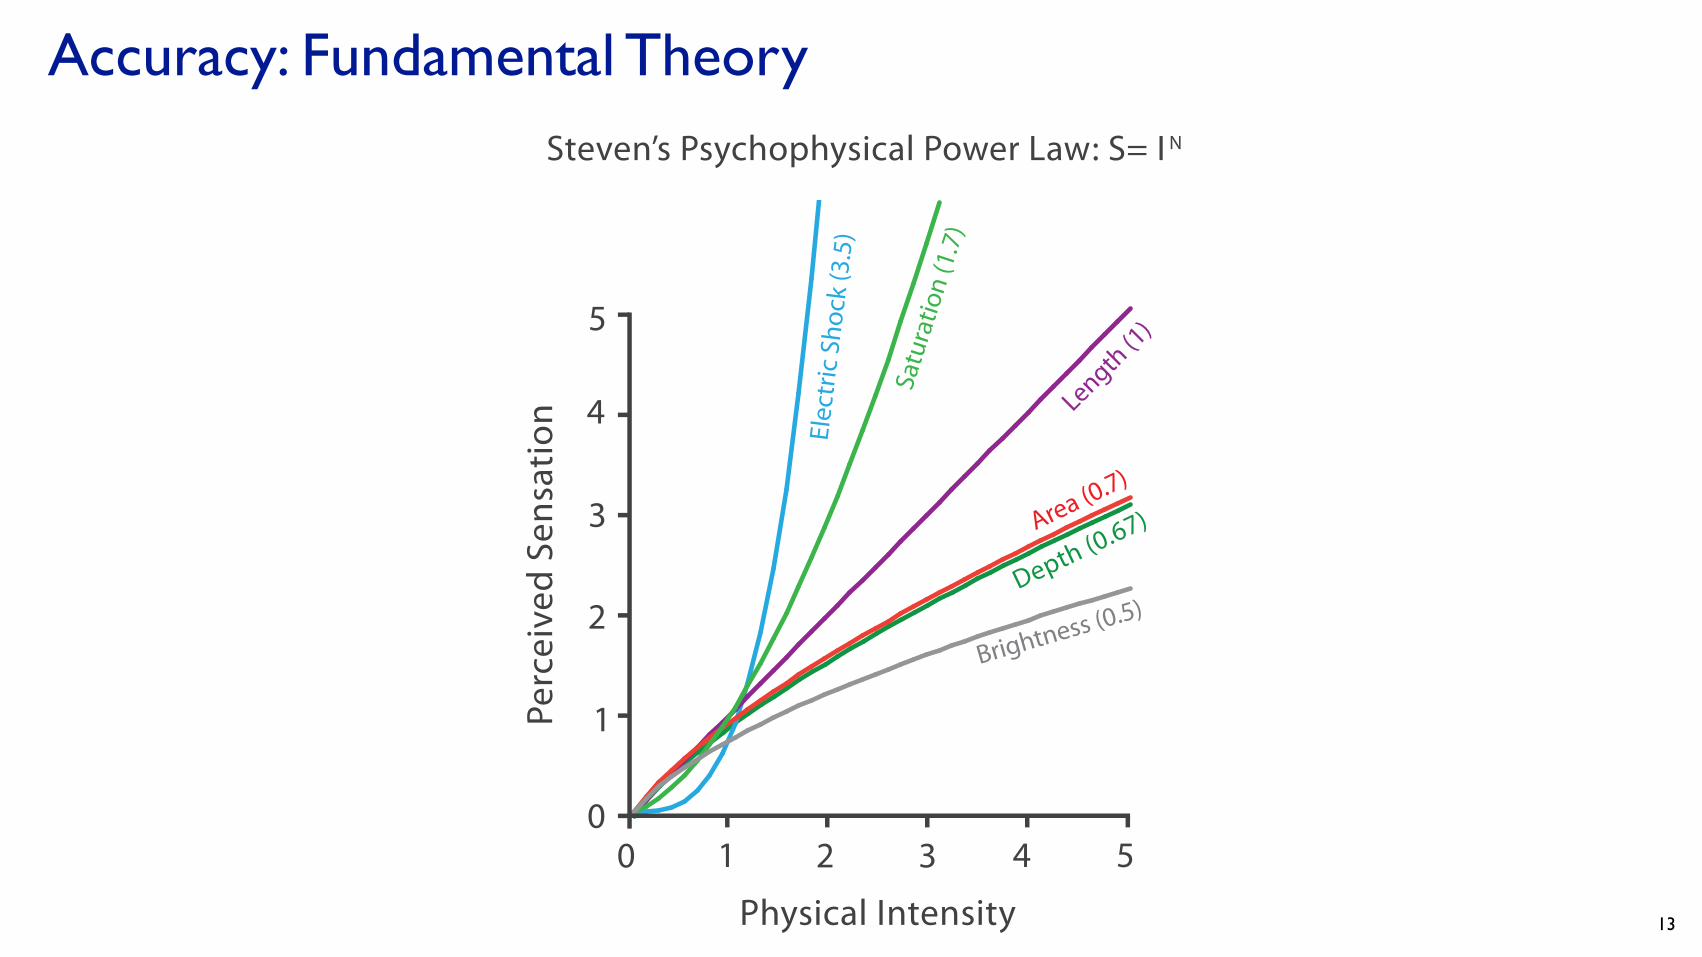
Accuracy: Fundamental Theory
13

Accuracy: Vis experiments
14after Michael McGuffin course slides, http://profs.etsmtl.ca/mmcguffin/
[Crowdsourcing Graphical Perception: Using Mechanical Turk to Assess Visualization Design. Heer and Bostock. Proc ACM Conf. Human Factors in Computing Systems (CHI) 2010, p. 203–212.]
Positions
Rectangular areas
(aligned or in a treemap)
Angles
Circular areas
Cleveland & McGill’s Results
Crowdsourced Results
1.0 3 .01.5 2 .52 .0Log Error
1.0 3 .01.5 2 .52 .0Log Error

Discriminability: How many usable steps?
• must be sufficient for number of attribute levels to show– linewidth: few bins
15
[mappa.mundi.net/maps/maps 014/telegeography.html]

Separability vs. Integrality
16
2 groups each 2 groups each 3 groups total: integral area
4 groups total: integral hue
Position Hue (Color)
Size Hue (Color)
Width Height
Red Green
Fully separable Some interference Some/significant interference
Major interference
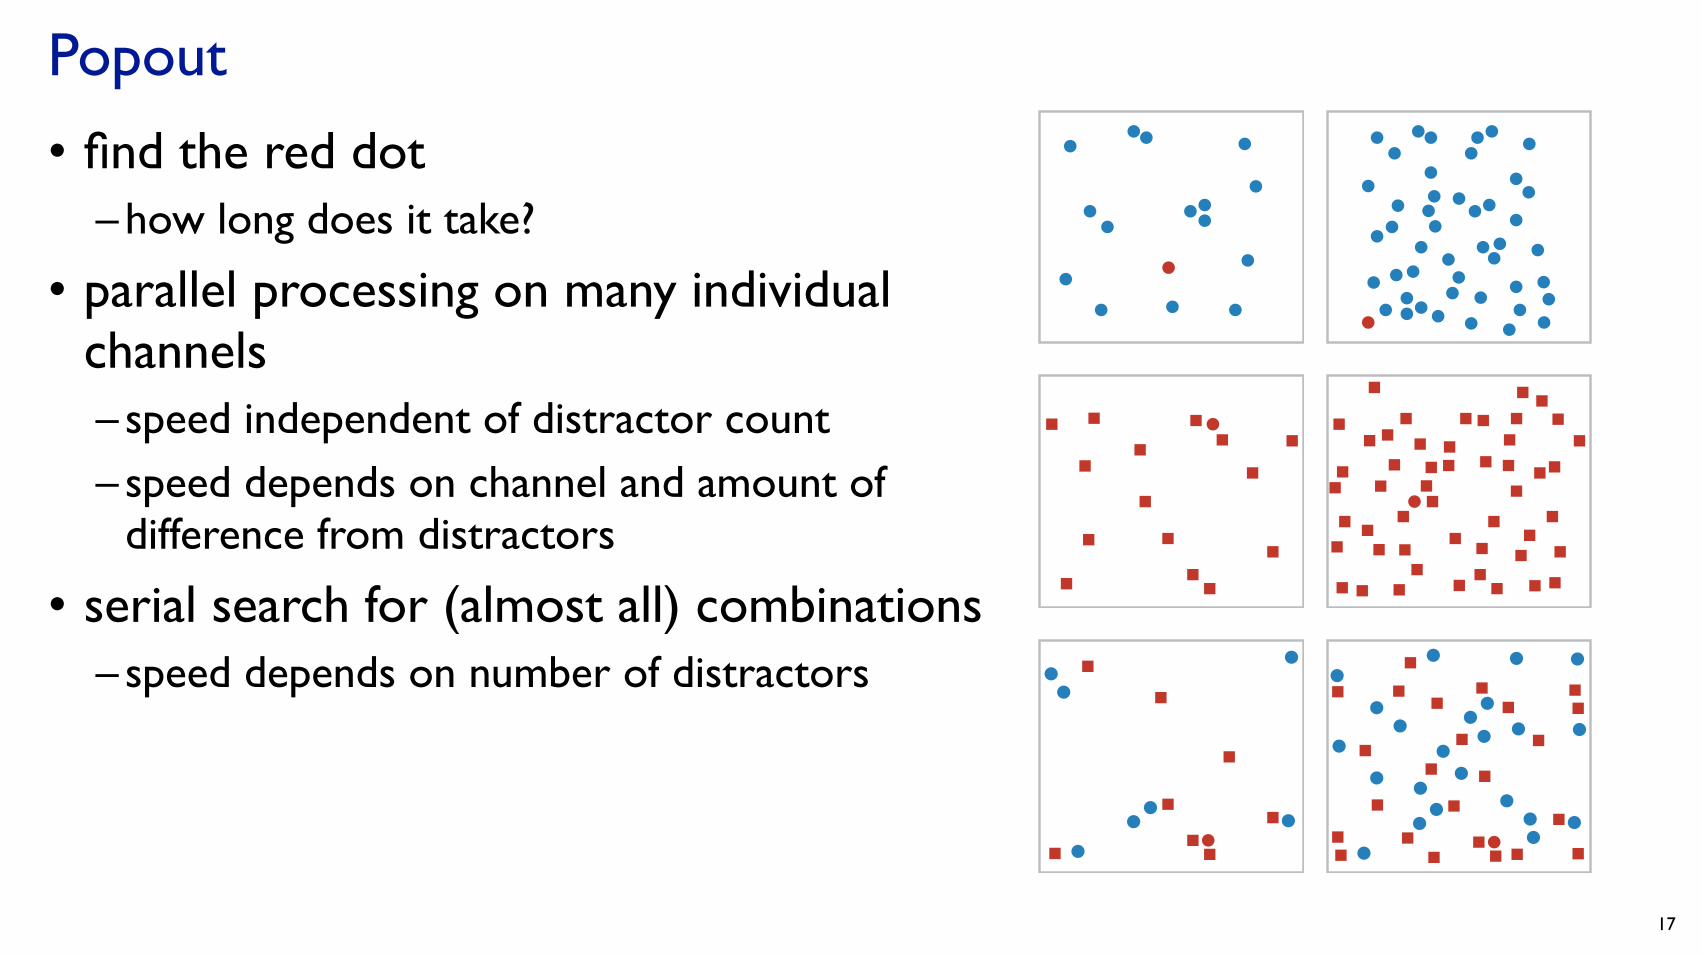
Popout
• find the red dot– how long does it take?
• parallel processing on many individual channels– speed independent of distractor count– speed depends on channel and amount of
difference from distractors
• serial search for (almost all) combinations– speed depends on number of distractors
17

Popout
• many channels: tilt, size, shape, proximity, shadow direction, ...• but not all! parallel line pairs do not pop out from tilted pairs
18
19
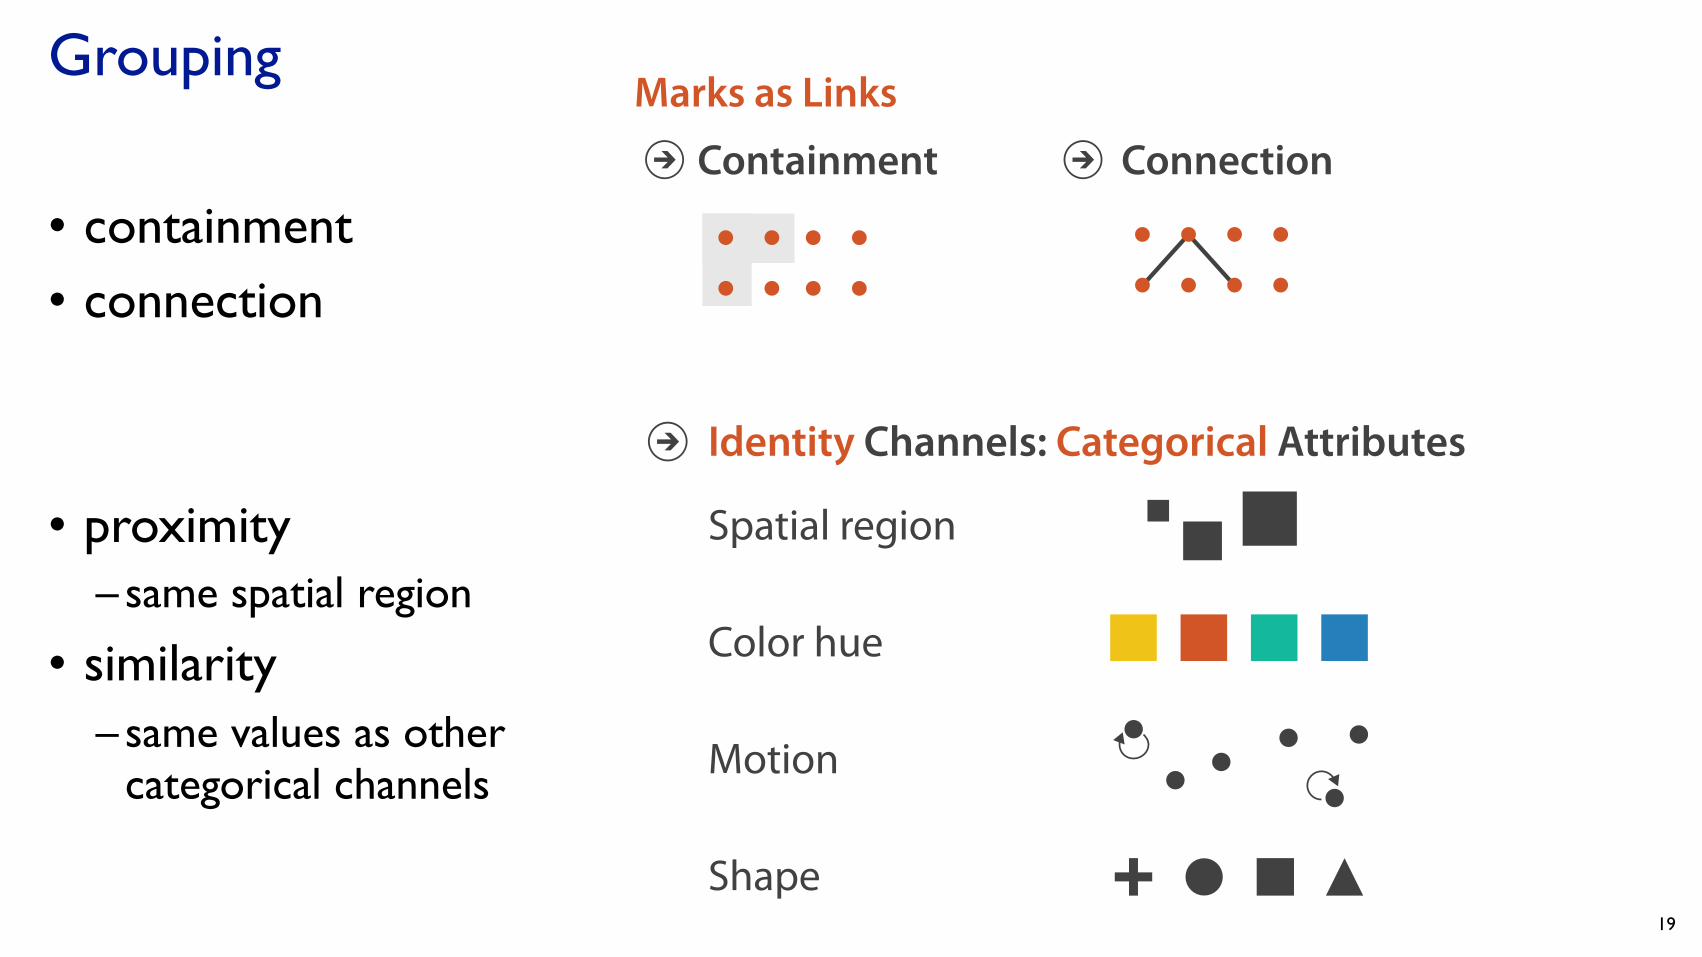
Grouping
• containment• connection
• proximity– same spatial region
• similarity– same values as other
categorical channels
Magnitude Channels: Ordered Attributes Identity Channels: Categorical Attributes
Spatial region
Color hue
Motion
Shape
Position on common scale
Position on unaligned scale
Length (1D size)
Tilt/angle
Area (2D size)
Depth (3D position)
Color luminance
Color saturation
Curvature
Volume (3D size)
Channels: Expressiveness Types And Effectiveness Ranks
Marks as Items/Nodes
Marks as Links
Points Lines Areas
Containment Connection

Relative vs. absolute judgements
• perceptual system mostly operates with relative judgements, not absolute – that’s why accuracy increases with common frame/scale and alignment– Weber’s Law: ratio of increment to background is constant
• filled rectangles differ in length by 1:9, difficult judgement• white rectangles differ in length by 1:2, easy judgement
20
A B
Unframed Aligned
Framed Unaligned
AB
AB
Unframed Unaligned
length
after [Graphical Perception: Theory, Experimentation, and Application to the Development of Graphical Methods. Cleveland and McGill. Journ. American Statistical Association 79:387 (1984), 531–554.]
position along unaligned common scale
A B
Unframed Aligned
Framed Unaligned
AB
AB
Unframed Unaligned
position along aligned scale
A B
Unframed Aligned
Framed Unaligned
AB
AB
Unframed Unaligned

Relative luminance judgements
• perception of luminance is contextual based on contrast with surroundings
21http://persci.mit.edu/gallery/checkershadow
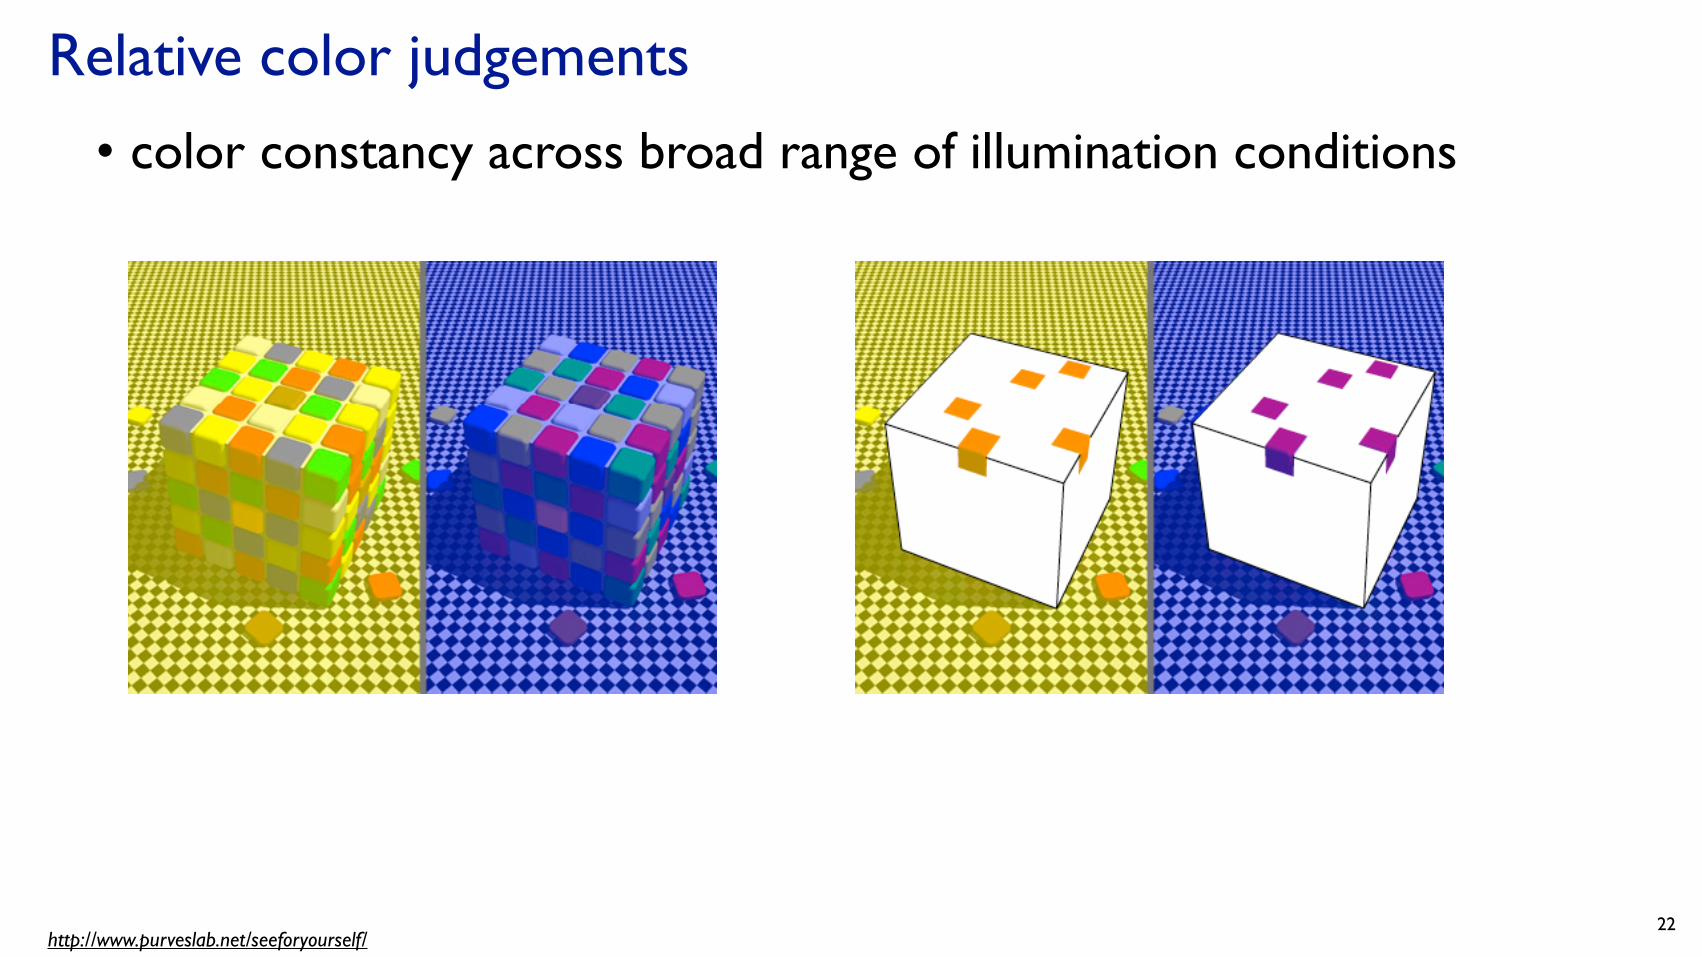
Relative color judgements
• color constancy across broad range of illumination conditions
22http://www.purveslab.net/seeforyourself/
Ch 6: Rules of Thumb
23
VAD Ch 6: Rules of Thumb
• No unjustified 3D –Power of the plane, dangers of depth –Occlusion hides information –Perspective distortion loses information –Tilted text isn’t legible
• No unjustified 2D • Eyes beat memory • Resolution over immersion • Overview first, zoom and filter, details on demand • Function first, form next
• (Get it right in black and white) 24

No unjustified 3D: Power of the plane
25
• high-ranked spatial position channels: planar spatial position– not depth!
Magnitude Channels: Ordered Attributes Identity Channels: Categorical Attributes
Spatial region
Color hue
Motion
Shape
Position on common scale
Position on unaligned scale
Length (1D size)
Tilt/angle
Area (2D size)
Depth (3D position)
Color luminance
Color saturation
Curvature
Volume (3D size)
Channels: Expressiveness Types And Effectiveness Ranks

No unjustified 3D: Danger of depth
• we don’t really live in 3D: we see in 2.05D–acquire more info on image plane quickly from eye movements–acquire more info for depth slower, from head/body motion
26
TowardsAway
Up
Down
Right
Left
Thousands of points up/down and left/right
We can only see the outside shell of the world

Occlusion hides information
• occlusion• interaction complexity
27
[Distortion Viewing Techniques for 3D Data. Carpendale et al. InfoVis1996.]
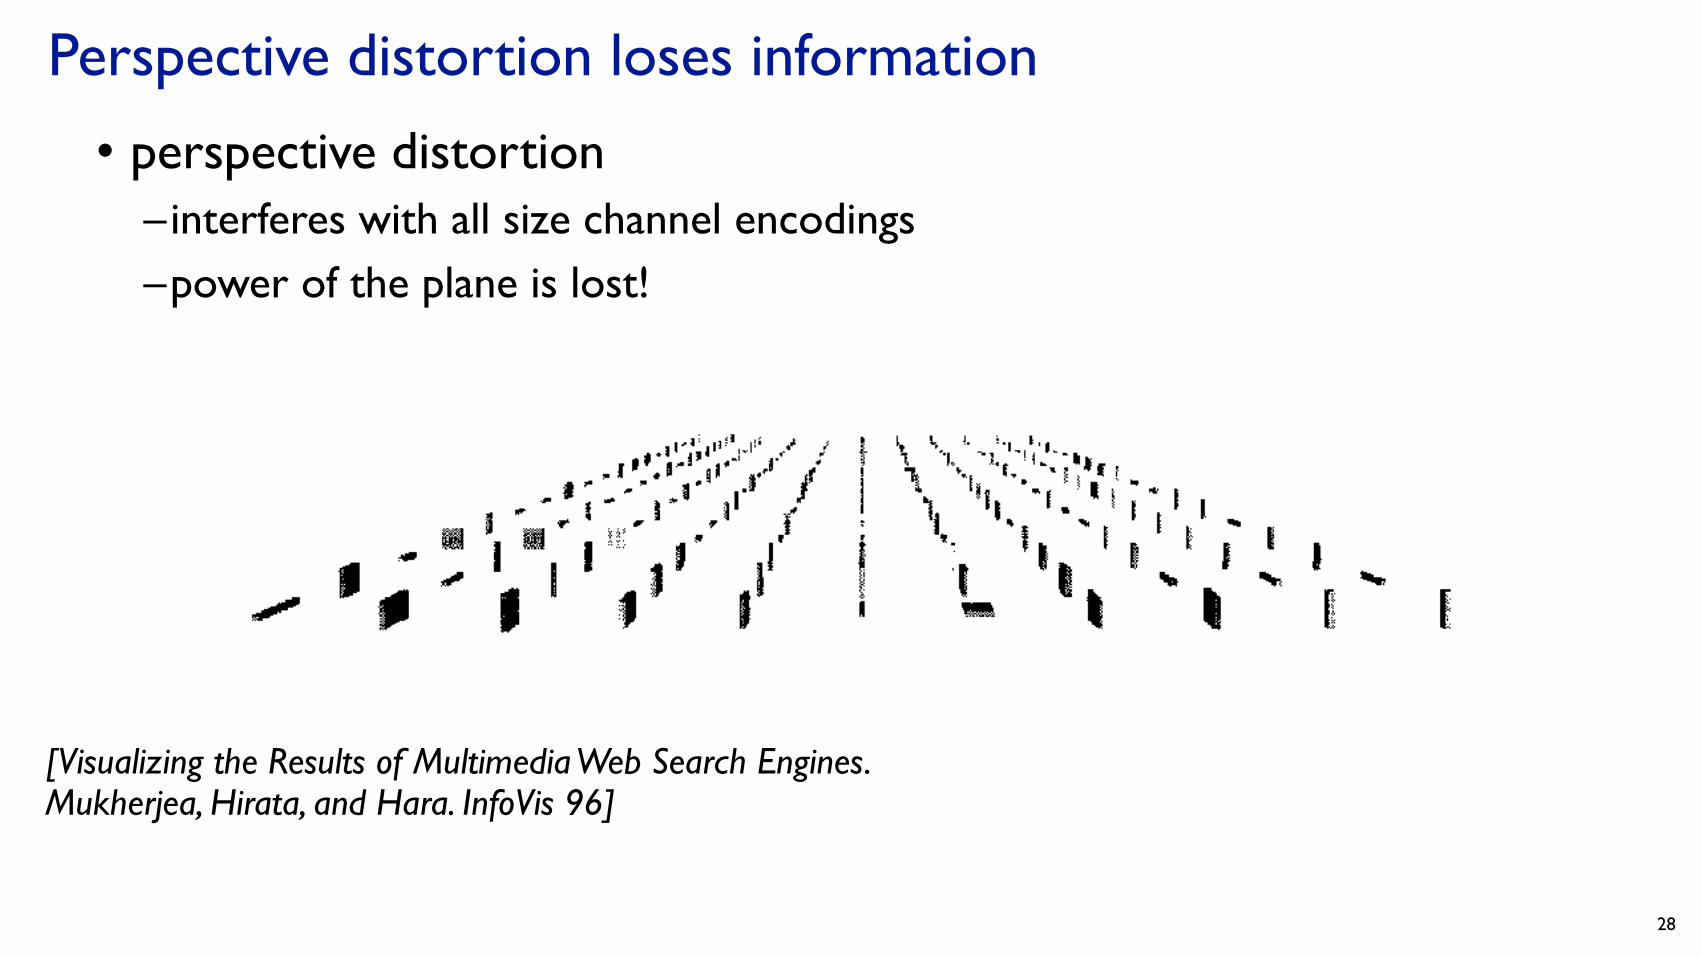
Perspective distortion loses information
• perspective distortion–interferes with all size channel encodings–power of the plane is lost!
28
[Visualizing the Results of Multimedia Web Search Engines. Mukherjea, Hirata, and Hara. InfoVis 96]

Tilted text isn’t legible
• text legibility–far worse when tilted from image plane
• further reading[Exploring and Reducing the Effects of Orientation on Text Readability in Volumetric Displays. Grossman et al. CHI 2007]
29
[Visualizing the World-Wide Web with the Navigational View Builder.Mukherjea and Foley. Computer Networks and ISDN Systems, 1995.]

No unjustified 3D example: Time-series data
• extruded curves: detailed comparisons impossible
30[Cluster and Calendar based Visualization of Time Series Data. van Wijk and van Selow, Proc. InfoVis 99.]

No unjustified 3D example: Transform for new data abstraction
• derived data: cluster hierarchy • juxtapose multiple views: calendar, superimposed 2D curves
31[Cluster and Calendar based Visualization of Time Series Data. van Wijk and van Selow, Proc. InfoVis 99.]

Justified 3D: shape perception
• benefits outweigh costs when task is shape perception for 3D spatial data–interactive navigation supports
synthesis across many viewpoints
32[Image-Based Streamline Generation and Rendering. Li and Shen. IEEE Trans. Visualization and Computer Graphics (TVCG) 13:3 (2007), 630–640.]

No unjustified 3D
• 3D legitimate for true 3D spatial data• 3D needs very careful justification for abstract data
– enthusiasm in 1990s, but now skepticism– be especially careful with 3D for point clouds or networks
33
[WEBPATH-a three dimensional Web history. Frecon and Smith. Proc. InfoVis 1999]
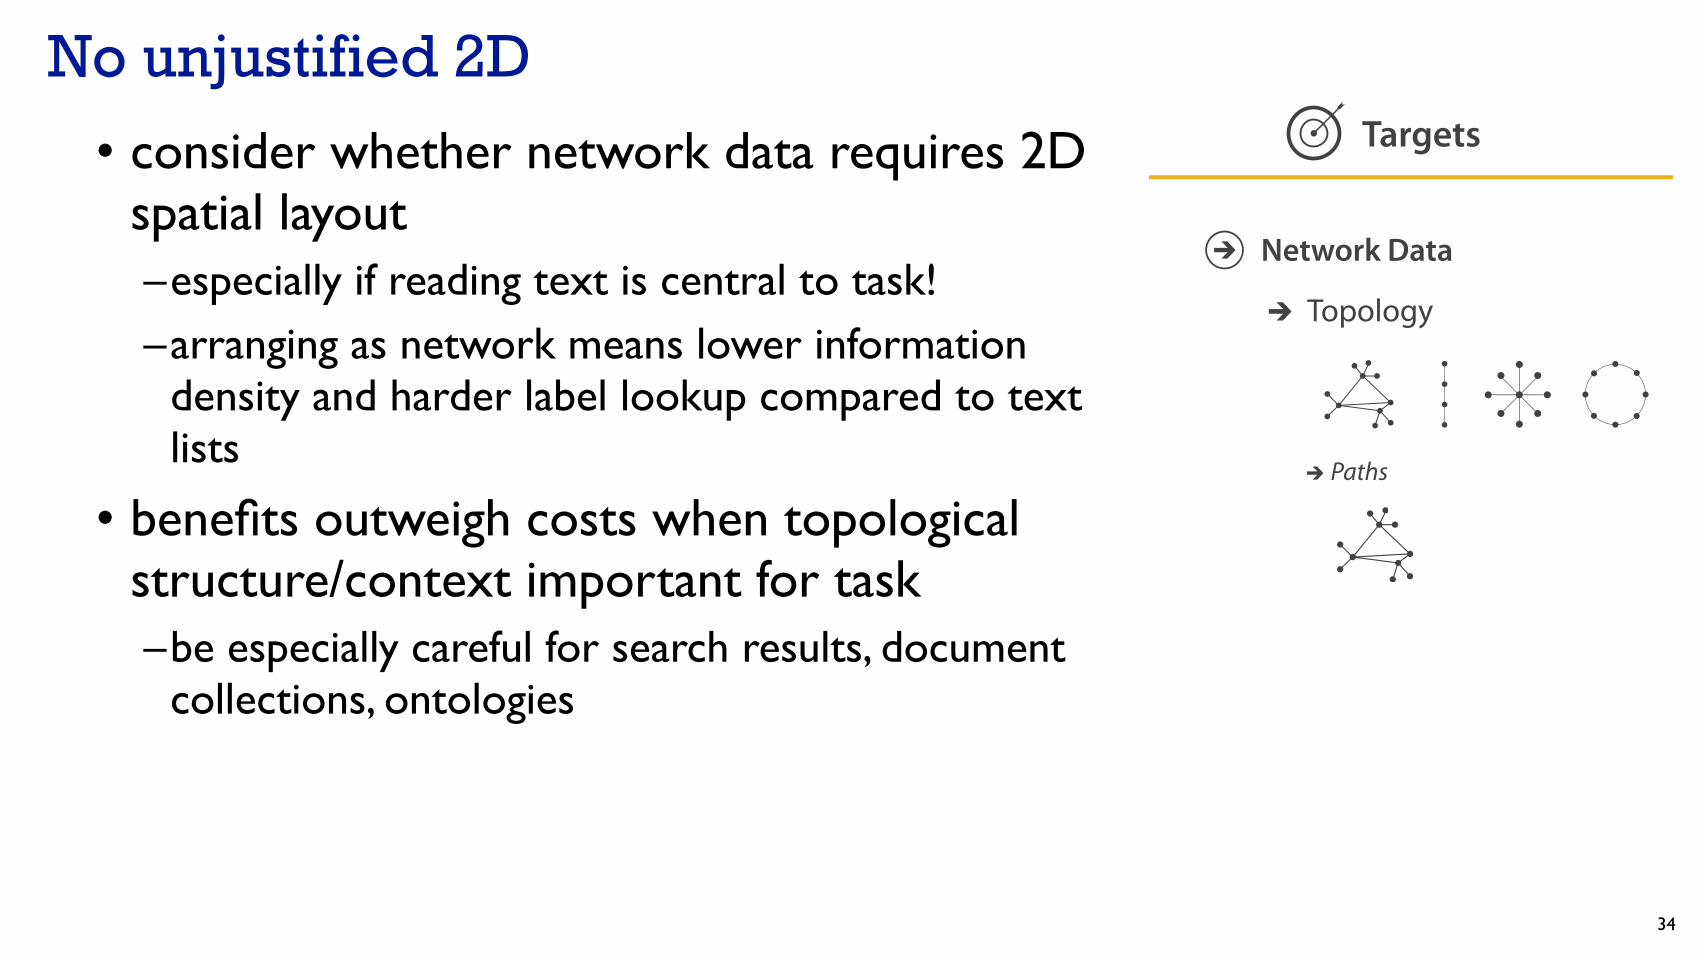
No unjustified 2D
• consider whether network data requires 2D spatial layout–especially if reading text is central to task!–arranging as network means lower information
density and harder label lookup compared to text lists
• benefits outweigh costs when topological structure/context important for task–be especially careful for search results, document
collections, ontologies
34
Trends
All Data
Outliers Features
Attributes
One Many
Distribution Dependency Correlation Similarity
Network Data
Spatial Data
Shape
Topology
Paths
Extremes
Targets
Trends
All Data
Outliers Features
Attributes
One Many
Distribution Dependency Correlation Similarity
Network Data
Spatial Data
Shape
Topology
Paths
Extremes
Targets

Eyes beat memory
• principle: external cognition vs. internal memory –easy to compare by moving eyes between side-by-side views–harder to compare visible item to memory of what you saw
• implications for animation–great for choreographed storytelling–great for transitions between two states–poor for many states with changes everywhere
• consider small multiples instead
35
literal abstract
show time with time show time with space
animation small multiples
36
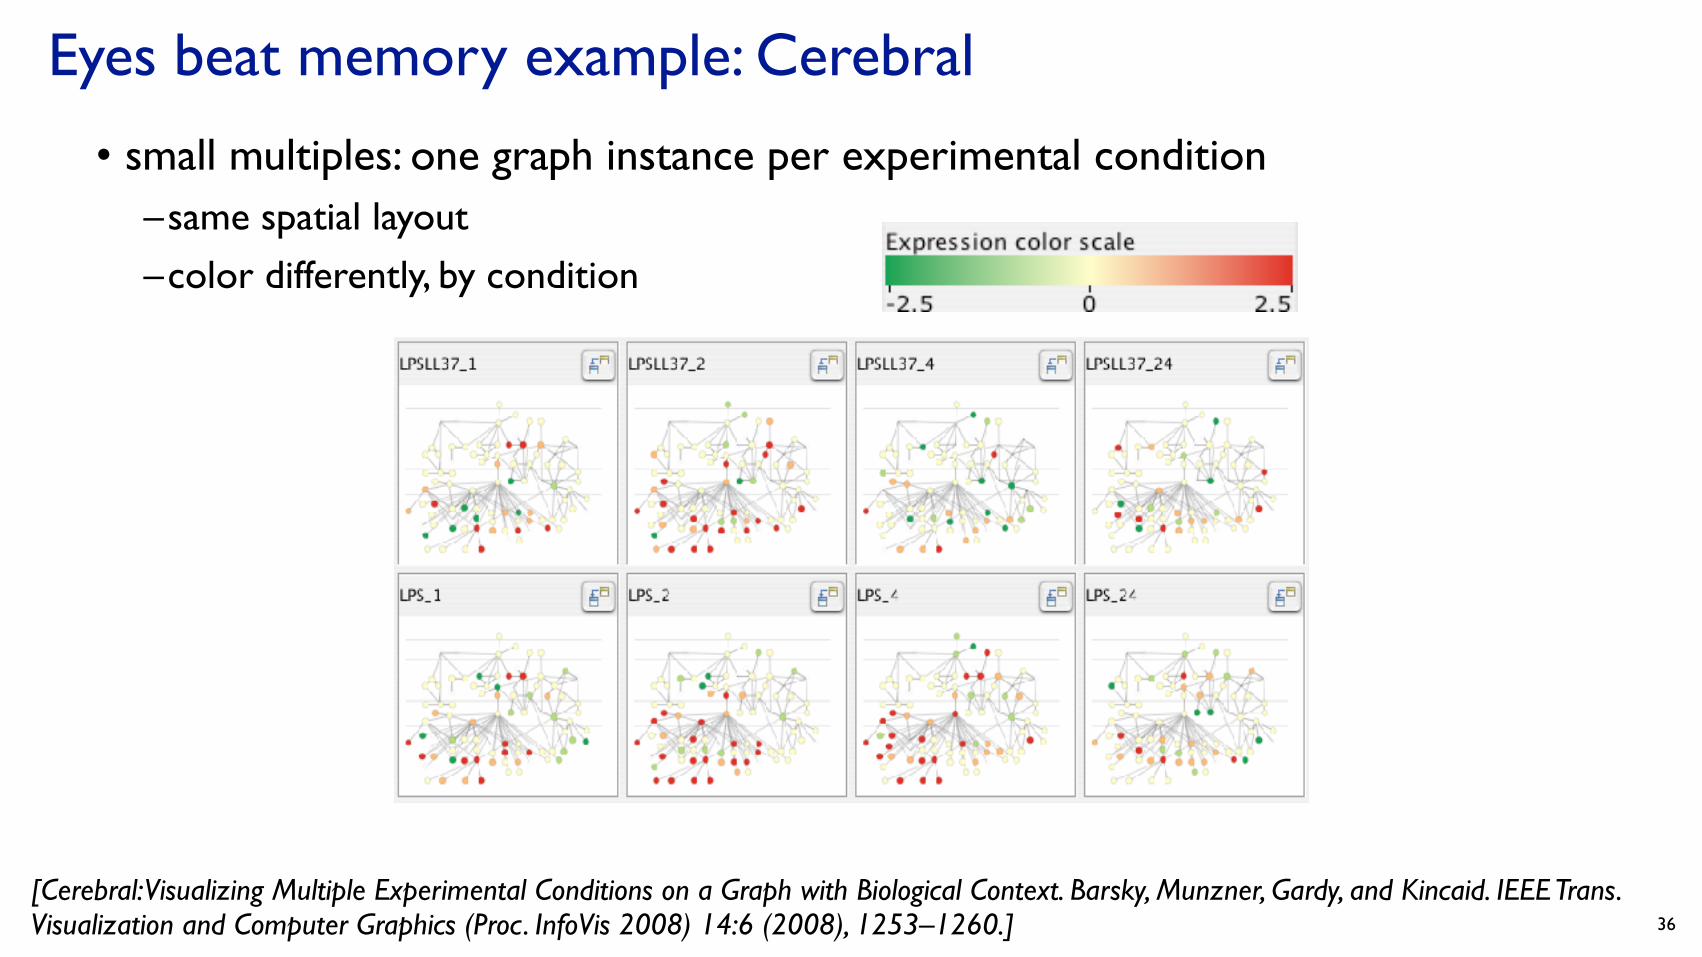
Eyes beat memory example: Cerebral
• small multiples: one graph instance per experimental condition–same spatial layout
–color differently, by condition
[Cerebral: Visualizing Multiple Experimental Conditions on a Graph with Biological Context. Barsky, Munzner, Gardy, and Kincaid. IEEE Trans. Visualization and Computer Graphics (Proc. InfoVis 2008) 14:6 (2008), 1253–1260.]
37
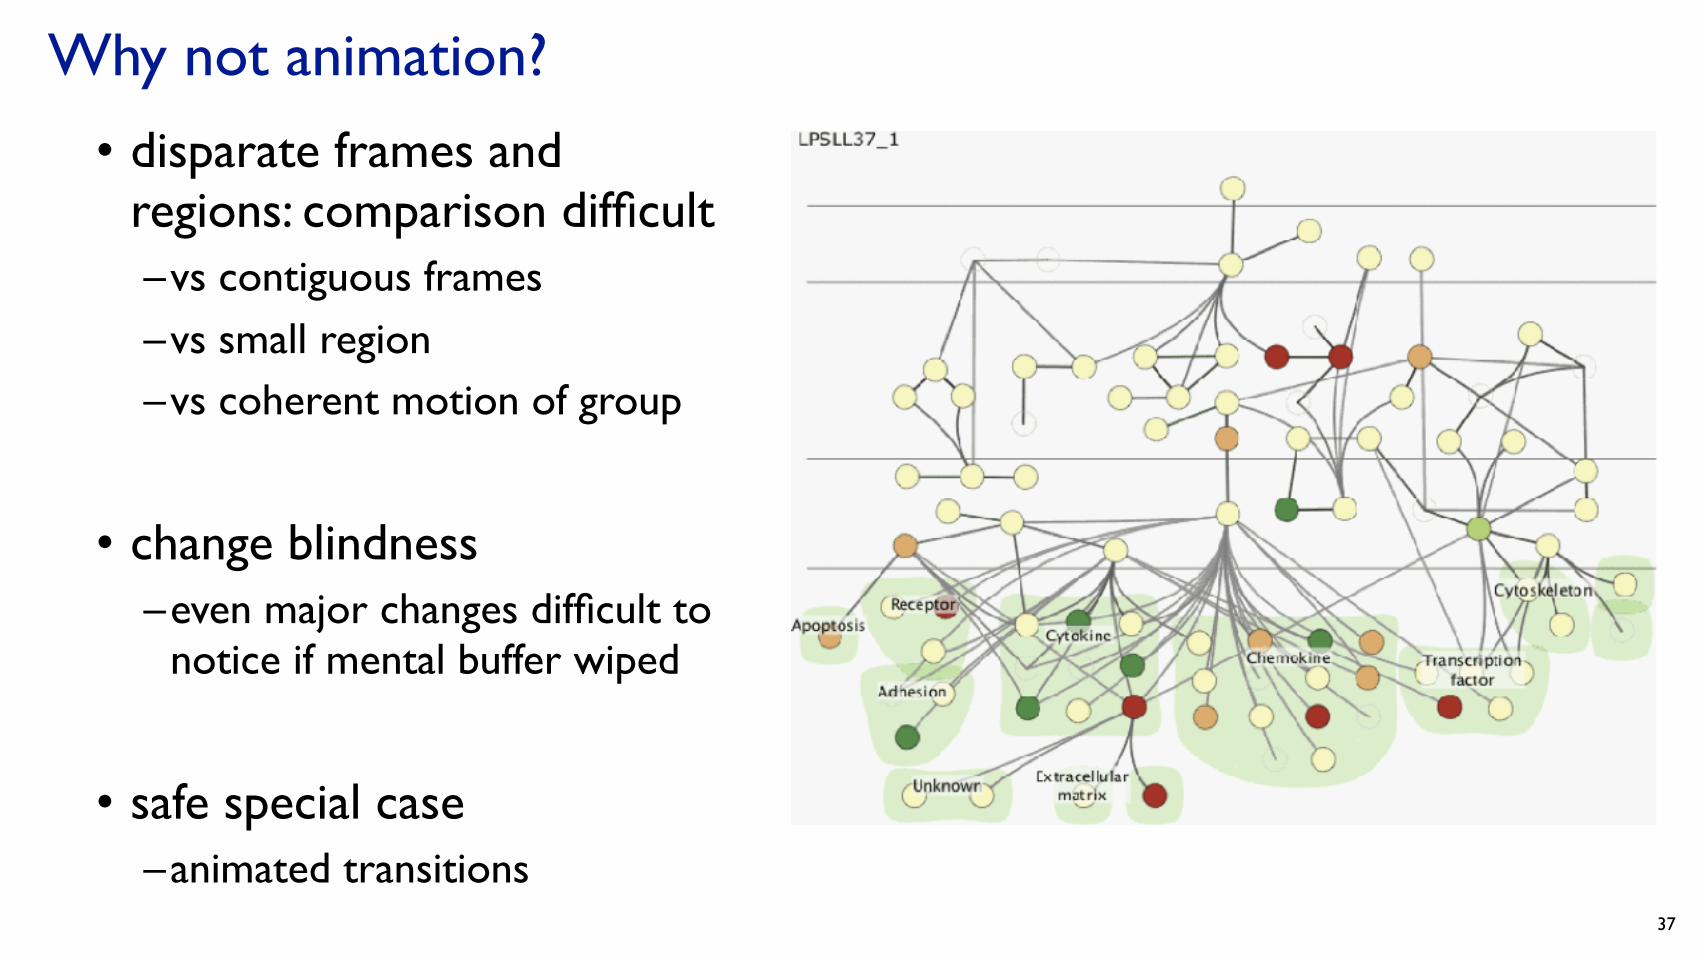
Why not animation?
• disparate frames and regions: comparison difficult–vs contiguous frames–vs small region–vs coherent motion of group
• change blindness–even major changes difficult to
notice if mental buffer wiped
• safe special case–animated transitions

Resolution beats immersion
• immersion typically not helpful for abstract data–do not need sense of presence or stereoscopic 3D
• resolution much more important–pixels are the scarcest resource–desktop also better for workflow integration
• virtual reality for abstract data very difficult to justify
38
[Development of an information visualization tool using virtual reality. Kirner and Martins. Proc. Symp. Applied Computing 2000]
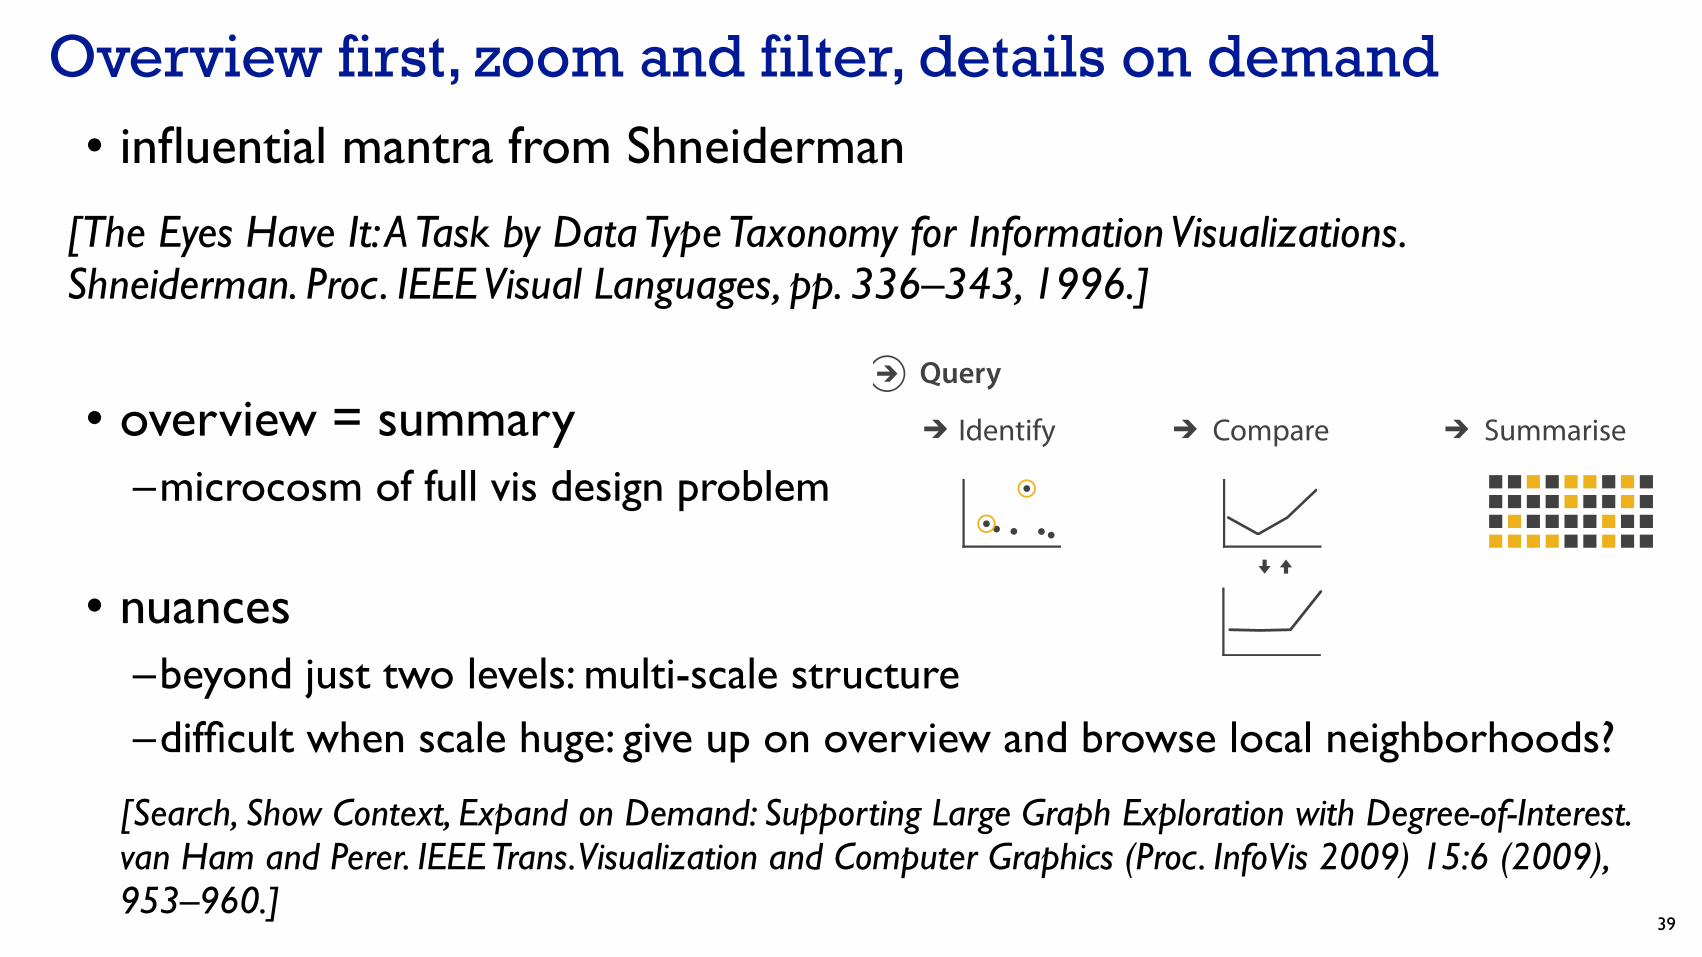
Overview first, zoom and filter, details on demand• influential mantra from Shneiderman
• overview = summary–microcosm of full vis design problem
• nuances–beyond just two levels: multi-scale structure–difficult when scale huge: give up on overview and browse local neighborhoods?
39
[The Eyes Have It: A Task by Data Type Taxonomy for Information Visualizations. Shneiderman. Proc. IEEE Visual Languages, pp. 336–343, 1996.]
[Search, Show Context, Expand on Demand: Supporting Large Graph Exploration with Degree-of-Interest. van Ham and Perer. IEEE Trans. Visualization and Computer Graphics (Proc. InfoVis 2009) 15:6 (2009), 953–960.]
Analyze
Search
Query
ConsumePresent EnjoyDiscover
ProduceAnnotate Record Derive
Identify Compare Summarise
tag
Target known Target unknown
Location known
Location unknown
Lookup
Locate
Browse
Explore
Actions
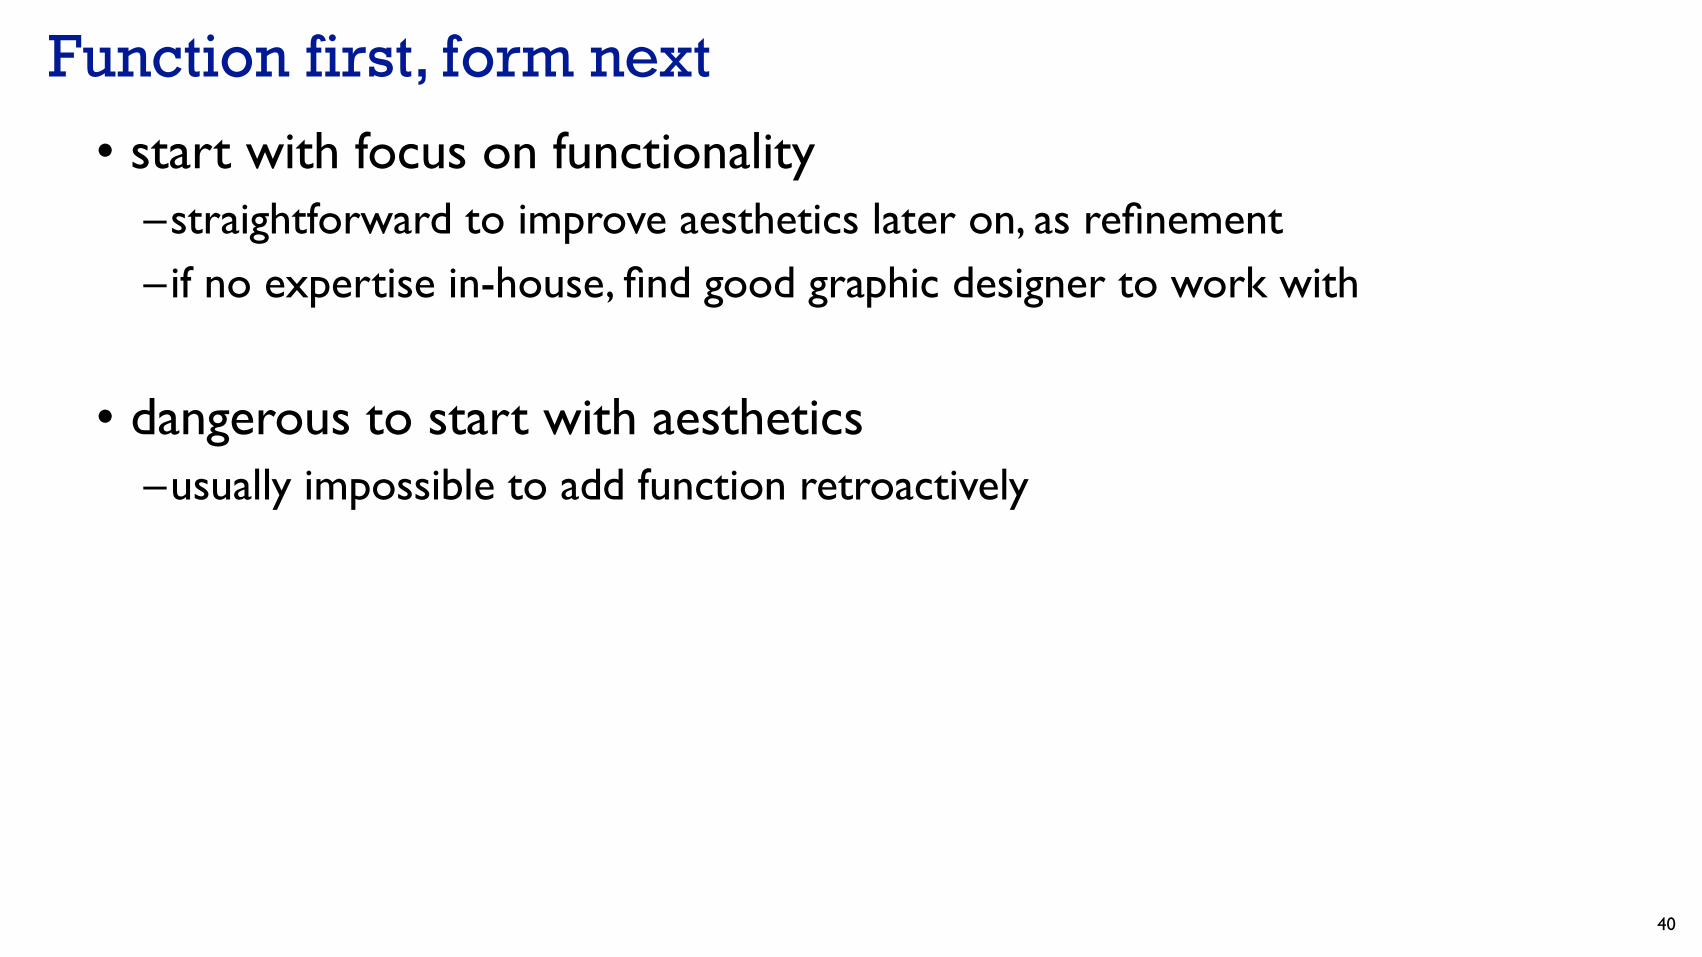
Function first, form next
• start with focus on functionality–straightforward to improve aesthetics later on, as refinement–if no expertise in-house, find good graphic designer to work with
• dangerous to start with aesthetics–usually impossible to add function retroactively
40
Artery Visualizations for Heart Disease Diagnosis
41
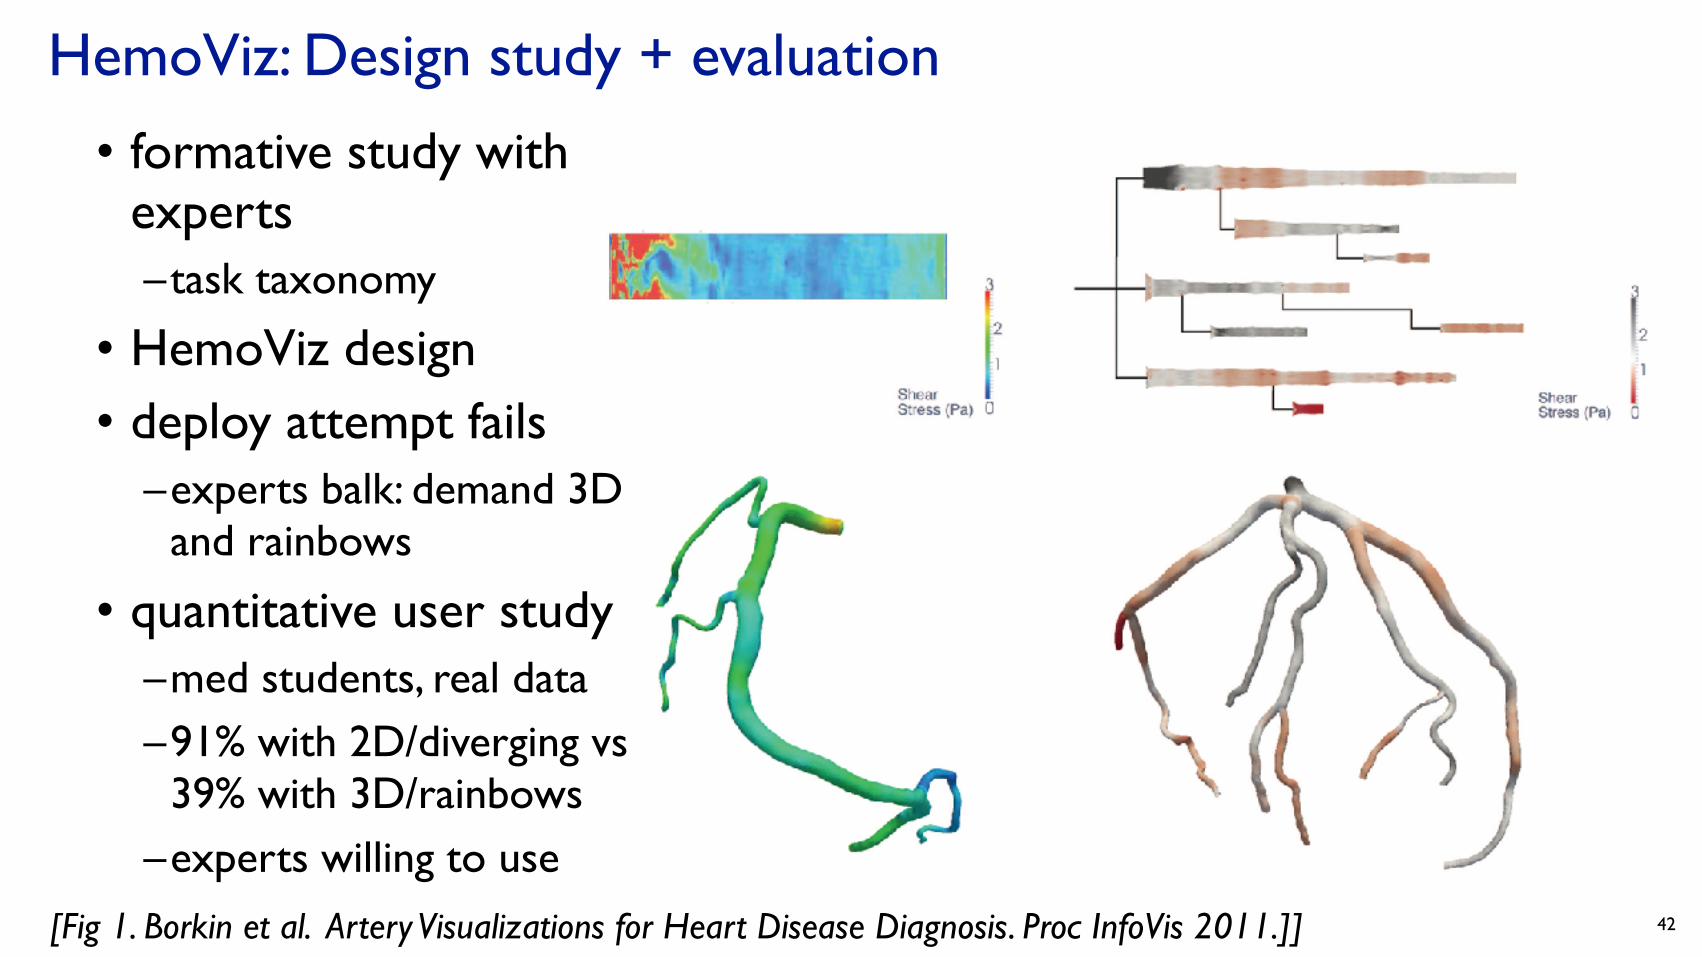
HemoViz: Design study + evaluation
• formative study with experts–task taxonomy
• HemoViz design• deploy attempt fails
–experts balk: demand 3D and rainbows
• quantitative user study–med students, real data–91% with 2D/diverging vs
39% with 3D/rainbows–experts willing to use
42[Fig 1. Borkin et al. Artery Visualizations for Heart Disease Diagnosis. Proc InfoVis 2011.]]

Study results: Error
43
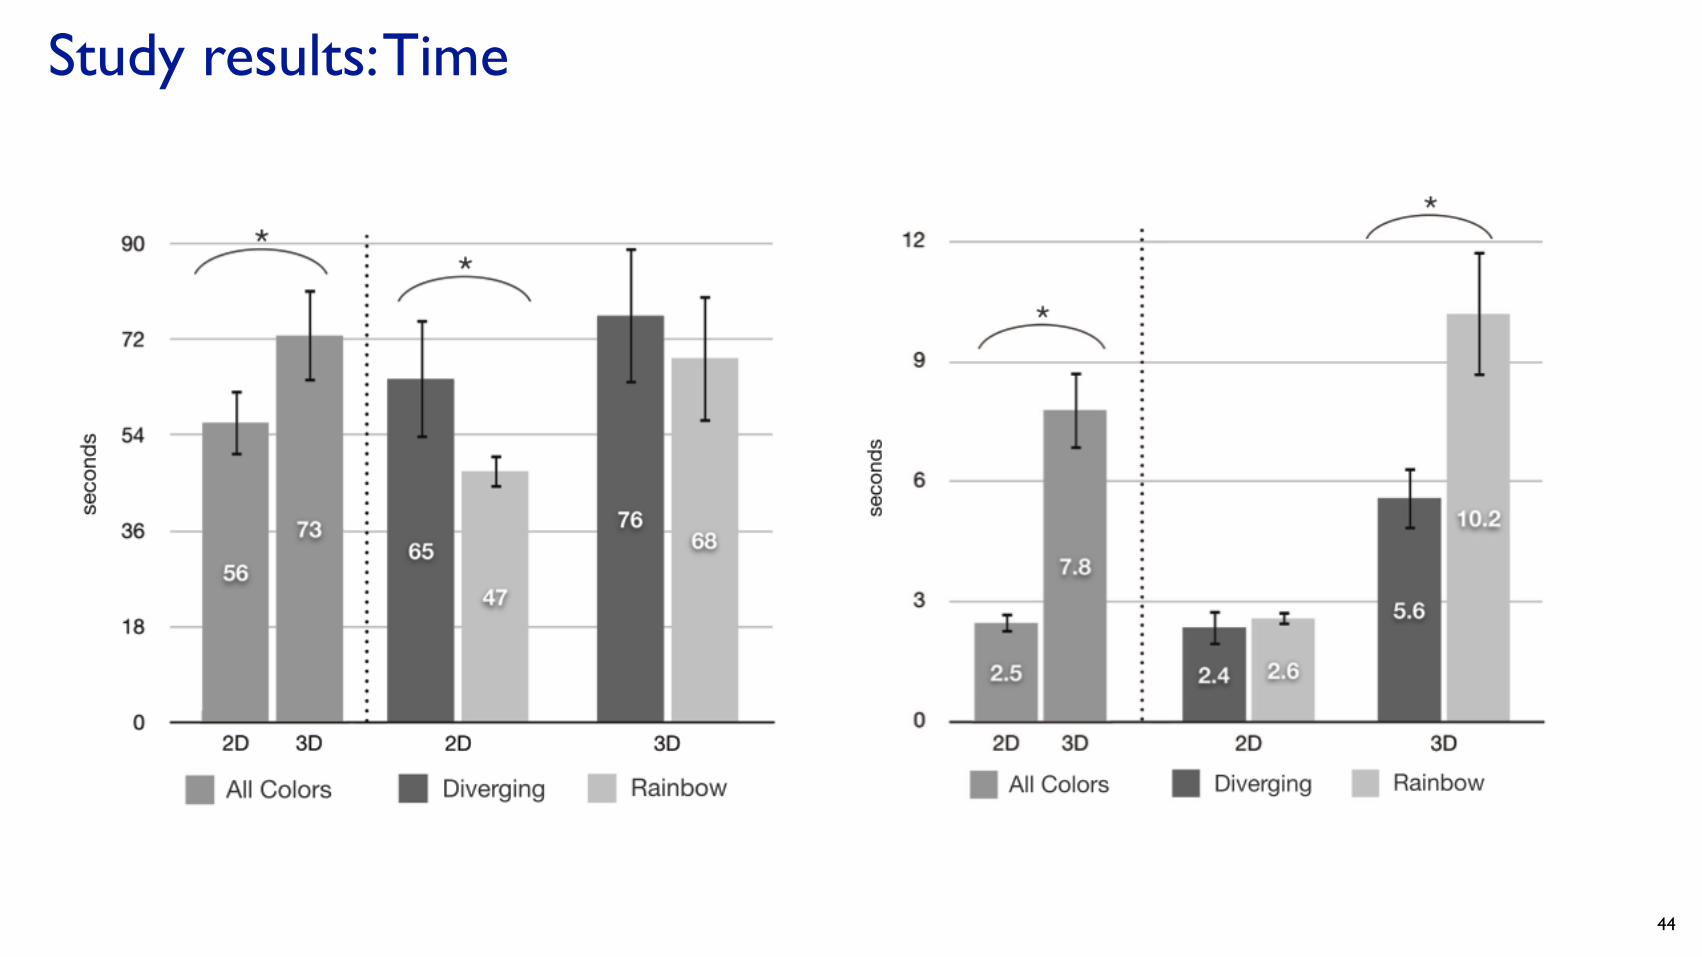
Study results: Time
44

Critique• many strengths
– careful and well justified design, convincing human-subjects experiment• bringing visualization best practices to medical domain
• limitation– paper does not clearly communicate why colormap is diverging not sequential
• answer by email• doctors care about extremely high and extremely low ESS (scalar) values
– high values (top of scale, dark grey): extreme blood flow patterns may relate to heart malfunctions - but not imminently life threatening and don't indicate plaque locations
– low values (bottom of scale, dark red): very diseased regions with lots of plaque, docs care a lot!– much debate from doctors on where is boundary between “normal” and “low” ESS values
» most think below 3 Pa are indicative of disease but many argue other values in the 2-4 range» all docs agree that values below 2 Pa are increasingly dangerous disease levels » thus map has transition at 3 Pa for the diverging point and truly red below 2 Pa
• why continuous not segmented?– doctors gain tremendous insight by seeing the subtle patterning of the ESS values– particularly varying values in red region - patterns help them understand disease progression and severity
» especially useful for deciding what types of interventions to prescribe for the patient 45

Papers: Types, Reading Strategies
46

Paper types
• each has different contributions, validation methods, structure– design studies– technique/algorithm– evaluation– model/taxonomy– system
47
http://ieeevis.org/year/2019/info/call-participation/infovis-paper-types

Paper types: Validation• design studies
–qualitative discussion of result images/videos–abstraction & idiom validation: case studies, field studies, design justification
• technique/algorithm• qualitative discussion of result images/videos–algorithm validation for algorithm papers: computational benchmarks– idiom validation for technique papers: controlled experiments
• evaluation– (controlled experiment as primary contribution)
• theory/model/taxonomy–show power: descriptive, generative, evaluative, (predictive)
• system–show power for developer using system
48

Paper structures
• typical research paper vs expectations for this course final report– more on implementation– novel research contribution not requiredhttp://www.cs.ubc.ca/~tmm/courses/547-19/projectdesc.html#outlines
49
Reading visualization papers
• one strategy: multiple passes– title – abstract, authors/affiliation– flip through, glance at figures, notice structure from section titles– skim intro, results/discussion (maybe conclusion)– fast read to get big ideas
• if you don’t get something, just keep going
– second pass to work through details• later parts may cast light on earlier parts for badly structured papers
– third pass to dig deep• if it’s highly relevant, or you’re presenting it to class
• literature search– decide when to stop reading: is this relevant to my current concerns? 50

Literature search
• this course: I will give you seed papers during our 1on1 meetings• forwards vs backwards search
– Google Scholar forward citations!– only a subset of forwards & backwards citations will be what you need
• building up landscape– authors/affiliations will have more signal as you develop expertise
51
In-Class Exercise: Decoding
52

Reading for Next Time
• VAD book Ch 7: Arrange Tables• VAD book Ch 10: Map Color and Other Channels• paper: D3 (Data-Driven Documents)
– [type: system]
53


![5 The Generative Wordwebspace.qmul.ac.uk/hborer/Downloads/5-Borer.pdfC:/ITOOLS/WMS/CUP-NEW/9006600/WORKINGFOLDER/MCGIL/9781107165892C05.3D 110 [110–133] 26.11.2016 10:23AM 5 The](https://img.pdfslide.us/doc/110x75/6045992257e73476b6103476/5-the-generative-citoolswmscup-new9006600workingfoldermcgil9781107165892c053d.jpg)