Embed Size (px)
Citation preview
Embargoed: November 14, 2007, 4:00 p.m. EST
Contacts: Marshall Hoffman (703) 533-3535; (703) 801-8602 mobile
CGD- Ben Edwards, CGD, (202) 416-0740; (215) 570-7468 mobile
CGD-Kevin Ummel-Data (202) 416-0729
Interviews with David Wheeler, architect of CARMA, are available November 13 & 14. For TV producers, a B-roll is available. Carbon Monitoring for Action (CARMA) database is available at http://www.CARMA.org
CGD Ranks CO2 Emissions from Power Plants Worldwide It Answers: How Green is Your Power?
WASHINGTON: Now for the first time, the CO2 emissions of 50,000 power plants worldwide,
the globe’s most concentrated source of greenhouse gases, have been compiled into a massive
new data base, called CARMA—Carbon Monitoring for Action.
The on-line database, compiled by the Center for Global Development (CGD), an independent
policy and research organization that focuses on how the actions of the rich world shape the lives
of poor people in developing countries, lays out exactly where the CO2 emitters are and how
much of the greenhouse gas they are casting into the atmosphere. It also shows which companies
own the plants.
A research team, led by David Wheeler, a senior fellow at CGD, constructed the enormous
database to help speed the shift to less carbon-intensive power generation – with the objective of
minimizing global warming which is and will hurt poor people in developing countries first and
worst. The CARMA data is arrayed on a user-friendly website: www.CARMA.org.
The database and its website rank individual power plants, plotting their location by latitude and
longitude. The data for total power-related emissions can be displayed by cities, states or
provinces, and countries. For the U.S., emissions data are also available for Congressional
districts, counties and metro areas, making it possible for the first time to compare total power-
related emissions by locality.
Rankings of the 4,000 electric power companies in the world show which are the biggest carbon
polluters, globally, nationally, and at sub-national levels. Company-level data include emissions
and power generation for 2000 and 2007, as well as estimates of future emissions and power
generation from planned expansions. Data will be updated regularly as facility ownership
changes and new plants come online.
Power generation accounts for about one-quarter of total emissions of CO2, the main culprit in
global warming. But, until now, people concerned about climate change lacked information
about the emissions of particular power plants and the identities of the companies that own them.
“CARMA makes information about power-related CO2 emissions transparent to people
throughout the world,” says Dr. Wheeler, an expert in the use of public information disclosure to
reduce pollution. “Information leads to action. We know that this works for other forms of
pollution and we believe it can work for greenhouse gas emissions, too.”
“We expect that institutional and private investors, insurers, lenders, environmental and
consumer groups and individual activists will use the CARMA data to encourage power
companies to burn less coal and oil and to shift to renewable power sources, such as wind and
solar,” Dr. Wheeler says. Earlier research by Wheeler and his co-authors showed that highly-
polluting plants in China and Indonesia responded to pressure from neighboring communities
and lenders by reducing pollution significantly after public disclosure of their emissions.
On a per capita basis, Australians are some of the largest CO2 emitters in the world, producing
more than 11 tons of power sector CO2 emissions per person every year. Americans aren’t far
behind at more than 9 tons per person. Populous developing nations have far lower per capita
emissions. For example, the average Chinese citizen produces 2 tons of CO2 emissions from
power generation annually, and Indians emit about half of one ton per person.
CARMA - 2
A recent study by William Cline, a joint senior fellow at CGD and the Peterson Institute for
International Economics, predicts that agricultural productivity in developing countries will
decline sharply by 2080, as crops in areas closer to the equator suffer from the effects of
increased heat and drought. Averting such a disaster would require rapid emission reductions in
the first half of this century. CARMA is intended to help speed the necessary emission
reductions.
CARMA data come from government reports and often from the plants themselves. Where
directly reported emissions data are lacking, the CARMA team has estimated emissions, with 90
percent or greater confidence, using a statistical model based on the type and age of plant, the
type of fuel, and the amount of power generated.
The resulting information is displayed using a five-color rating system and differently sized
circles based on the amount of power produced. CARMA highlights low-carbon power
producers and flags dangerous emitters. Rankings range from nearly zero emissions, Green, to
extremely dirty, Red.
“CARMA is unique, one of a kind—a world standard,” says CGD president Nancy Birdsall.
“Never before has this kind of detailed information been made available on a global scale. Not
only is it likely to catalyze action to cut emissions now, it also strengthens the knowledge base
for monitoring any future international market-based agreement, whether a carbon tax or cap-
and-trade. Let us hope it speeds the way to an agreement – which matters immensely for the
well-being of hundreds of millions of people in developing countries.”
The U.S. Dirty Dozen
Globally, power generation emits nearly 10 billion tons of CO2 per year. The U.S., with over
8,000 power plants out of the more than 50,000 worldwide, accounts for about 25 percent of that
total or 2.8 billion tons. CARMA shows that the U.S.’s biggest CO2 emitter is Southern Co. with
annual emissions of 172 million tons, followed by American Electric Power Company Inc., Duke
Energy Corp., and AES Corp.
CARMA - 3
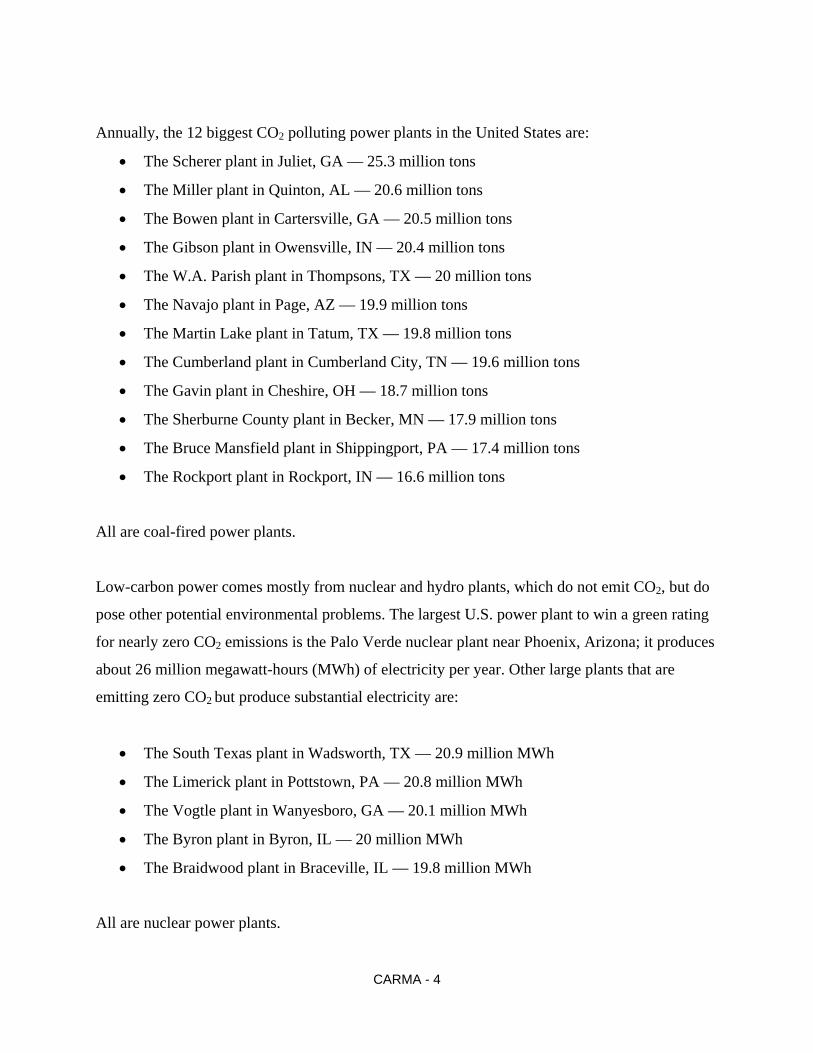
Annually, the 12 biggest CO2 polluting power plants in the United States are:
• The Scherer plant in Juliet, GA — 25.3 million tons
• The Miller plant in Quinton, AL — 20.6 million tons
• The Bowen plant in Cartersville, GA — 20.5 million tons
• The Gibson plant in Owensville, IN — 20.4 million tons
• The W.A. Parish plant in Thompsons, TX — 20 million tons
• The Navajo plant in Page, AZ — 19.9 million tons
• The Martin Lake plant in Tatum, TX — 19.8 million tons
• The Cumberland plant in Cumberland City, TN — 19.6 million tons
• The Gavin plant in Cheshire, OH — 18.7 million tons
• The Sherburne County plant in Becker, MN — 17.9 million tons
• The Bruce Mansfield plant in Shippingport, PA — 17.4 million tons
• The Rockport plant in Rockport, IN — 16.6 million tons
All are coal-fired power plants.
Low-carbon power comes mostly from nuclear and hydro plants, which do not emit CO2, but do
pose other potential environmental problems. The largest U.S. power plant to win a green rating
for nearly zero CO2 emissions is the Palo Verde nuclear plant near Phoenix, Arizona; it produces
about 26 million megawatt-hours (MWh) of electricity per year. Other large plants that are
emitting zero CO2 but produce substantial electricity are:
• The South Texas plant in Wadsworth, TX — 20.9 million MWh
• The Limerick plant in Pottstown, PA — 20.8 million MWh
• The Vogtle plant in Wanyesboro, GA — 20.1 million MWh
• The Byron plant in Byron, IL — 20 million MWh
• The Braidwood plant in Braceville, IL — 19.8 million MWh
All are nuclear power plants.
CARMA - 4
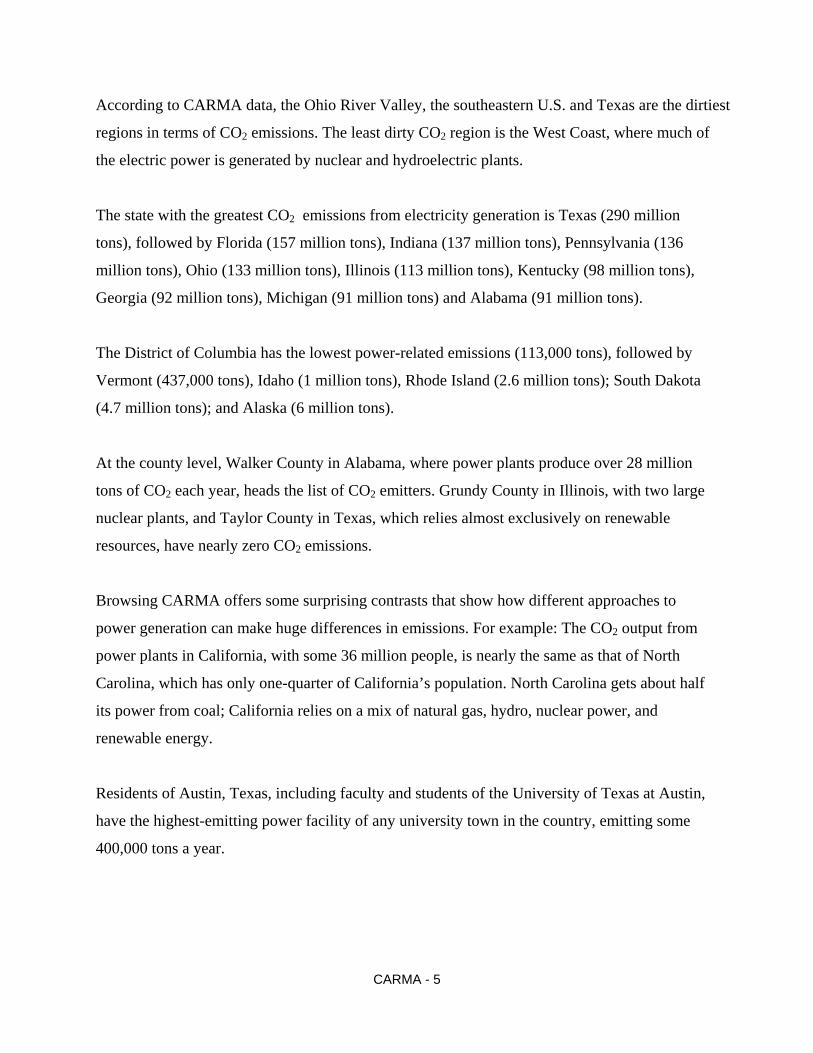
According to CARMA data, the Ohio River Valley, the southeastern U.S. and Texas are the dirtiest
regions in terms of CO2 emissions. The least dirty CO2 region is the West Coast, where much of
the electric power is generated by nuclear and hydroelectric plants.
The state with the greatest CO2 emissions from electricity generation is Texas (290 million
tons), followed by Florida (157 million tons), Indiana (137 million tons), Pennsylvania (136
million tons), Ohio (133 million tons), Illinois (113 million tons), Kentucky (98 million tons),
Georgia (92 million tons), Michigan (91 million tons) and Alabama (91 million tons).
The District of Columbia has the lowest power-related emissions (113,000 tons), followed by
Vermont (437,000 tons), Idaho (1 million tons), Rhode Island (2.6 million tons); South Dakota
(4.7 million tons); and Alaska (6 million tons).
At the county level, Walker County in Alabama, where power plants produce over 28 million
tons of CO2 each year, heads the list of CO2 emitters. Grundy County in Illinois, with two large
nuclear plants, and Taylor County in Texas, which relies almost exclusively on renewable
resources, have nearly zero CO2 emissions.
Browsing CARMA offers some surprising contrasts that show how different approaches to
power generation can make huge differences in emissions. For example: The CO2 output from
power plants in California, with some 36 million people, is nearly the same as that of North
Carolina, which has only one-quarter of California’s population. North Carolina gets about half
its power from coal; California relies on a mix of natural gas, hydro, nuclear power, and
renewable energy.
Residents of Austin, Texas, including faculty and students of the University of Texas at Austin,
have the highest-emitting power facility of any university town in the country, emitting some
400,000 tons a year.
CARMA - 5
The International Burden
Although no single country comes close to the 2.8 billion tons of CO2 produced annually by the
U.S. power sector, other countries collectively account for three-quarters of the power-related
CO2 burden. China comes second after the U.S. with 2.7 billion tons; followed by Russia – 661
million tons; India – 583 million tons; Japan – 400 million tons; Germany – 356 million tons;
Australia – 226 million tons; South Africa – 222 million tons; the United Kingdom – 212 million
tons; and South Korea – 185 million tons.
CARMA shows low power sector CO2 emissions from Hungary, Algeria, Kuwait, Singapore,
Belarus, Portugal, Chile, Denmark, and Brazil.
“High U.S. emissions are partly the result of high living standards but they also reflect
differences in energy policy. Europeans, with comparable living standards, emit less than half the
power sector CO2 of the average American”, says Dr. Birdsall.
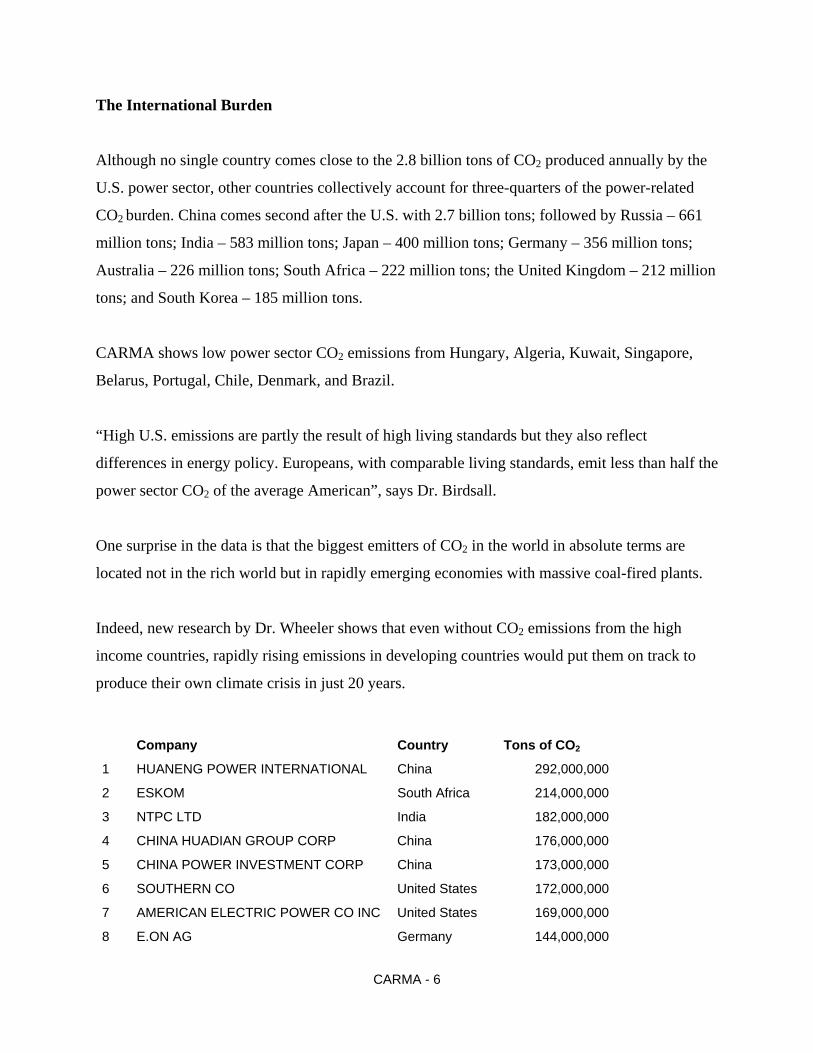
One surprise in the data is that the biggest emitters of CO2 in the world in absolute terms are
located not in the rich world but in rapidly emerging economies with massive coal-fired plants.
Indeed, new research by Dr. Wheeler shows that even without CO2 emissions from the high
income countries, rapidly rising emissions in developing countries would put them on track to
produce their own climate crisis in just 20 years.
Company Country Tons of CO2
1 HUANENG POWER INTERNATIONAL China 292,000,000
2 ESKOM South Africa 214,000,000
3 NTPC LTD India 182,000,000
4 CHINA HUADIAN GROUP CORP China 176,000,000
5 CHINA POWER INVESTMENT CORP China 173,000,000
6 SOUTHERN CO United States 172,000,000
7 AMERICAN ELECTRIC POWER CO INC United States 169,000,000
8 E.ON AG Germany 144,000,000
CARMA - 6
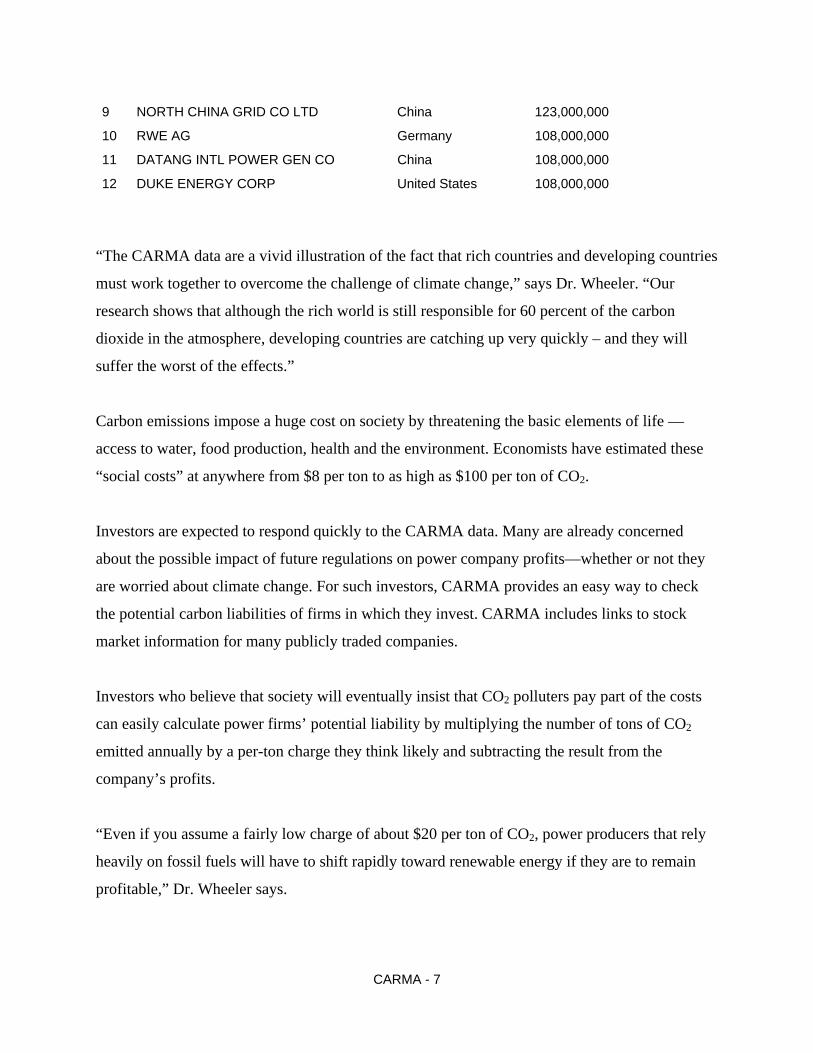
9 NORTH CHINA GRID CO LTD China 123,000,000
10 RWE AG Germany 108,000,000
11 DATANG INTL POWER GEN CO China 108,000,000
12 DUKE ENERGY CORP United States 108,000,000
“The CARMA data are a vivid illustration of the fact that rich countries and developing countries
must work together to overcome the challenge of climate change,” says Dr. Wheeler. “Our
research shows that although the rich world is still responsible for 60 percent of the carbon
dioxide in the atmosphere, developing countries are catching up very quickly – and they will
suffer the worst of the effects.”
Carbon emissions impose a huge cost on society by threatening the basic elements of life —
access to water, food production, health and the environment. Economists have estimated these
“social costs” at anywhere from $8 per ton to as high as $100 per ton of CO2.
Investors are expected to respond quickly to the CARMA data. Many are already concerned
about the possible impact of future regulations on power company profits—whether or not they
are worried about climate change. For such investors, CARMA provides an easy way to check
the potential carbon liabilities of firms in which they invest. CARMA includes links to stock
market information for many publicly traded companies.
Investors who believe that society will eventually insist that CO2 polluters pay part of the costs
can easily calculate power firms’ potential liability by multiplying the number of tons of CO2
emitted annually by a per-ton charge they think likely and subtracting the result from the
company’s profits.
“Even if you assume a fairly low charge of about $20 per ton of CO2, power producers that rely
heavily on fossil fuels will have to shift rapidly toward renewable energy if they are to remain
profitable,” Dr. Wheeler says.
CARMA - 7
By comparison, power companies that rely heavily on low-carbon technologies—hydropower,
nuclear, wind, and solar—face fewer potential climate-related liabilities. CARMA makes it easy
to find these companies: large power producers with low-carbon emissions intensity earn a large
Green circle, while large power producers that emit a lot of CO2 get a large Red circle.
CARMA’s maps and geographical interface will be useful for states, cities, and counties that
have pledged to reduce their carbon footprint. For example, CARMA will assist the nearly 700
US mayors who have signed the Mayors Climate Protection Agreement.
Jacob Scherr, Senior Attorney at the Natural Resources Defense Council, says that the data will
be helpful to states and cities that want to cut emissions from local power plants as part of their
climate change strategies. “Across the U.S., in the absence of federal action, many states and
cities are eager to take action,” he says. “This data will help state and local leaders to measure
their progress.”
* * *
Annexes
Table 1. Top-100 Highest CO2-Emitting Power Plants in the United States
Table 2. Power Sector CO2 Emissions by State
Table 3. Top-25 CO2-Free Power Plants in the United States
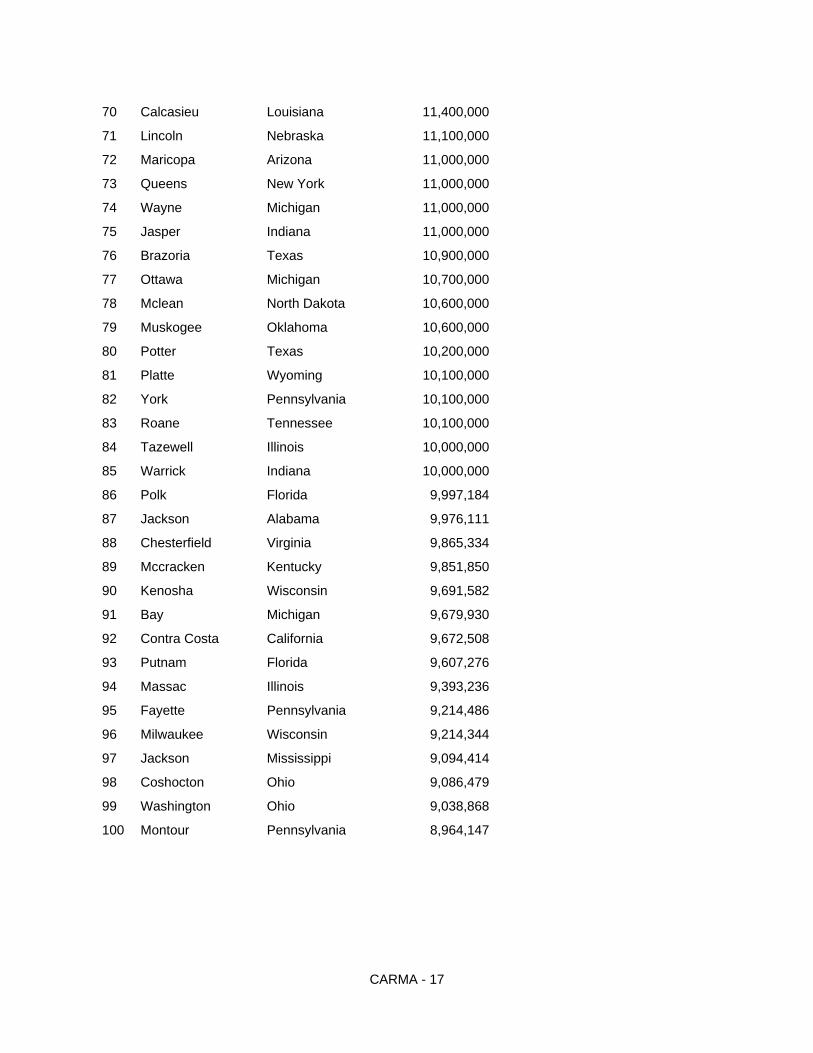
Table 4. Top-100 Highest CO2-Emitting Power Sectors by U.S. County
Table 5. Top-25 CO2-Free Power Sectors by U.S. County
Map. Power Plants in the Continental United States
Table 6. Top-25 Highest CO2-Emitting Power Plants Worldwide
Table 7. Top-50 Countries with Highest CO2-Emitting Power Sectors
CARMA - 8
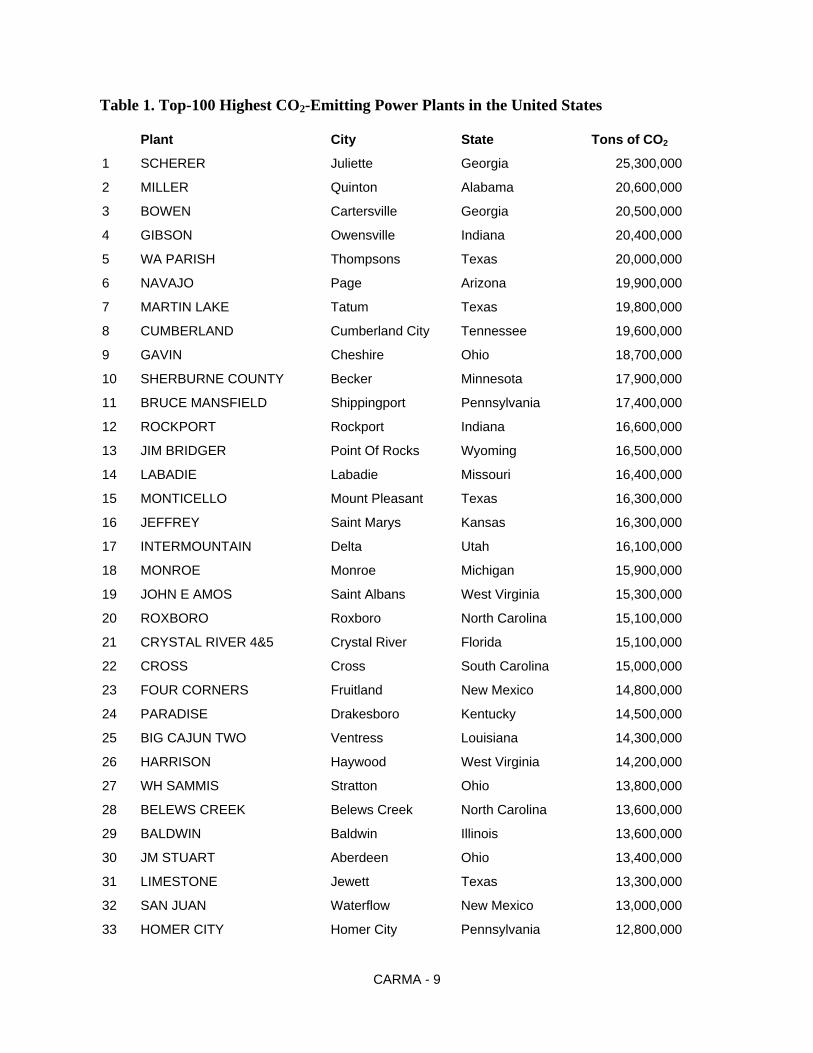
Table 1. Top-100 Highest CO2-Emitting Power Plants in the United States
Plant City State Tons of CO2
1 SCHERER Juliette Georgia 25,300,000
2 MILLER Quinton Alabama 20,600,000
3 BOWEN Cartersville Georgia 20,500,000
4 GIBSON Owensville Indiana 20,400,000
5 WA PARISH Thompsons Texas 20,000,000
6 NAVAJO Page Arizona 19,900,000
7 MARTIN LAKE Tatum Texas 19,800,000
8 CUMBERLAND Cumberland City Tennessee 19,600,000
9 GAVIN Cheshire Ohio 18,700,000
10 SHERBURNE COUNTY Becker Minnesota 17,900,000
11 BRUCE MANSFIELD Shippingport Pennsylvania 17,400,000
12 ROCKPORT Rockport Indiana 16,600,000
13 JIM BRIDGER Point Of Rocks Wyoming 16,500,000
14 LABADIE Labadie Missouri 16,400,000
15 MONTICELLO Mount Pleasant Texas 16,300,000
16 JEFFREY Saint Marys Kansas 16,300,000
17 INTERMOUNTAIN Delta Utah 16,100,000
18 MONROE Monroe Michigan 15,900,000
19 JOHN E AMOS Saint Albans West Virginia 15,300,000
20 ROXBORO Roxboro North Carolina 15,100,000
21 CRYSTAL RIVER 4&5 Crystal River Florida 15,100,000
22 CROSS Cross South Carolina 15,000,000
23 FOUR CORNERS Fruitland New Mexico 14,800,000
24 PARADISE Drakesboro Kentucky 14,500,000
25 BIG CAJUN TWO Ventress Louisiana 14,300,000
26 HARRISON Haywood West Virginia 14,200,000
27 WH SAMMIS Stratton Ohio 13,800,000
28 BELEWS CREEK Belews Creek North Carolina 13,600,000
29 BALDWIN Baldwin Illinois 13,600,000
30 JM STUART Aberdeen Ohio 13,400,000
31 LIMESTONE Jewett Texas 13,300,000
32 SAN JUAN Waterflow New Mexico 13,000,000
33 HOMER CITY Homer City Pennsylvania 12,800,000
CARMA - 9
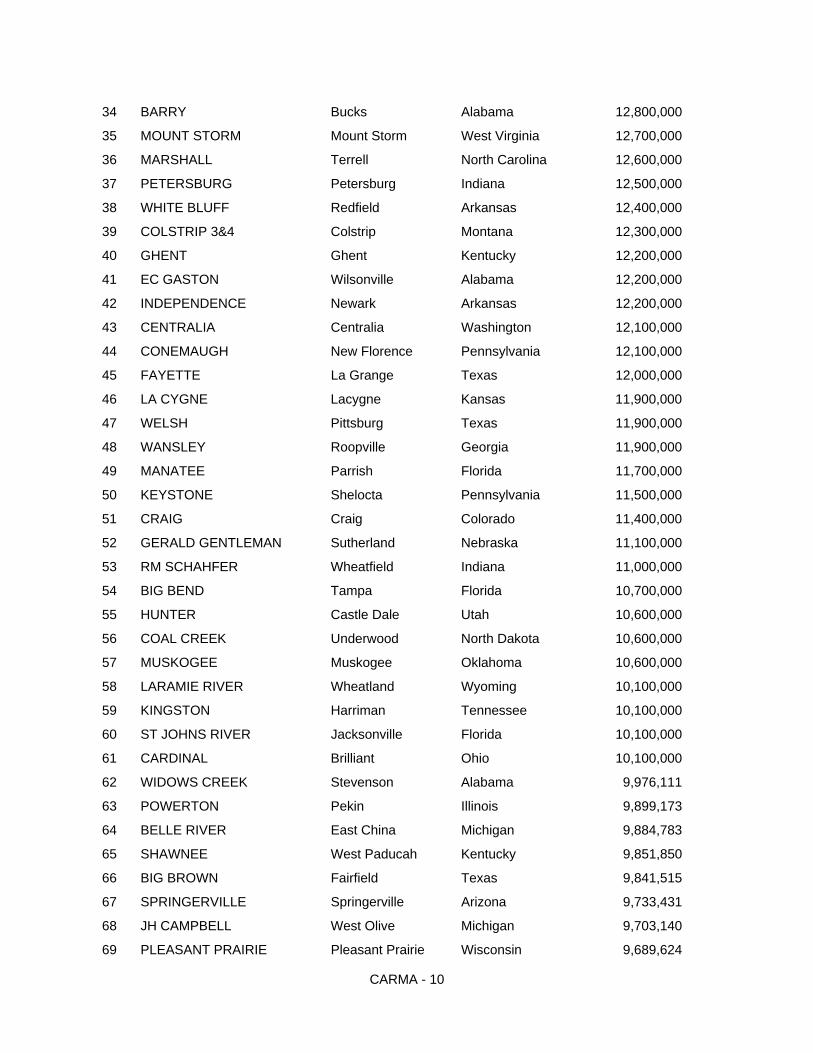
34 BARRY Bucks Alabama 12,800,000
35 MOUNT STORM Mount Storm West Virginia 12,700,000
36 MARSHALL Terrell North Carolina 12,600,000
37 PETERSBURG Petersburg Indiana 12,500,000
38 WHITE BLUFF Redfield Arkansas 12,400,000
39 COLSTRIP 3&4 Colstrip Montana 12,300,000
40 GHENT Ghent Kentucky 12,200,000
41 EC GASTON Wilsonville Alabama 12,200,000
42 INDEPENDENCE Newark Arkansas 12,200,000
43 CENTRALIA Centralia Washington 12,100,000
44 CONEMAUGH New Florence Pennsylvania 12,100,000
45 FAYETTE La Grange Texas 12,000,000
46 LA CYGNE Lacygne Kansas 11,900,000
47 WELSH Pittsburg Texas 11,900,000
48 WANSLEY Roopville Georgia 11,900,000
49 MANATEE Parrish Florida 11,700,000
50 KEYSTONE Shelocta Pennsylvania 11,500,000
51 CRAIG Craig Colorado 11,400,000
52 GERALD GENTLEMAN Sutherland Nebraska 11,100,000
53 RM SCHAHFER Wheatfield Indiana 11,000,000
54 BIG BEND Tampa Florida 10,700,000
55 HUNTER Castle Dale Utah 10,600,000
56 COAL CREEK Underwood North Dakota 10,600,000
57 MUSKOGEE Muskogee Oklahoma 10,600,000
58 LARAMIE RIVER Wheatland Wyoming 10,100,000
59 KINGSTON Harriman Tennessee 10,100,000
60 ST JOHNS RIVER Jacksonville Florida 10,100,000
61 CARDINAL Brilliant Ohio 10,100,000
62 WIDOWS CREEK Stevenson Alabama 9,976,111
63 POWERTON Pekin Illinois 9,899,173
64 BELLE RIVER East China Michigan 9,884,783
65 SHAWNEE West Paducah Kentucky 9,851,850
66 BIG BROWN Fairfield Texas 9,841,515
67 SPRINGERVILLE Springerville Arizona 9,733,431
68 JH CAMPBELL West Olive Michigan 9,703,140
69 PLEASANT PRAIRIE Pleasant Prairie Wisconsin 9,689,624
CARMA - 10
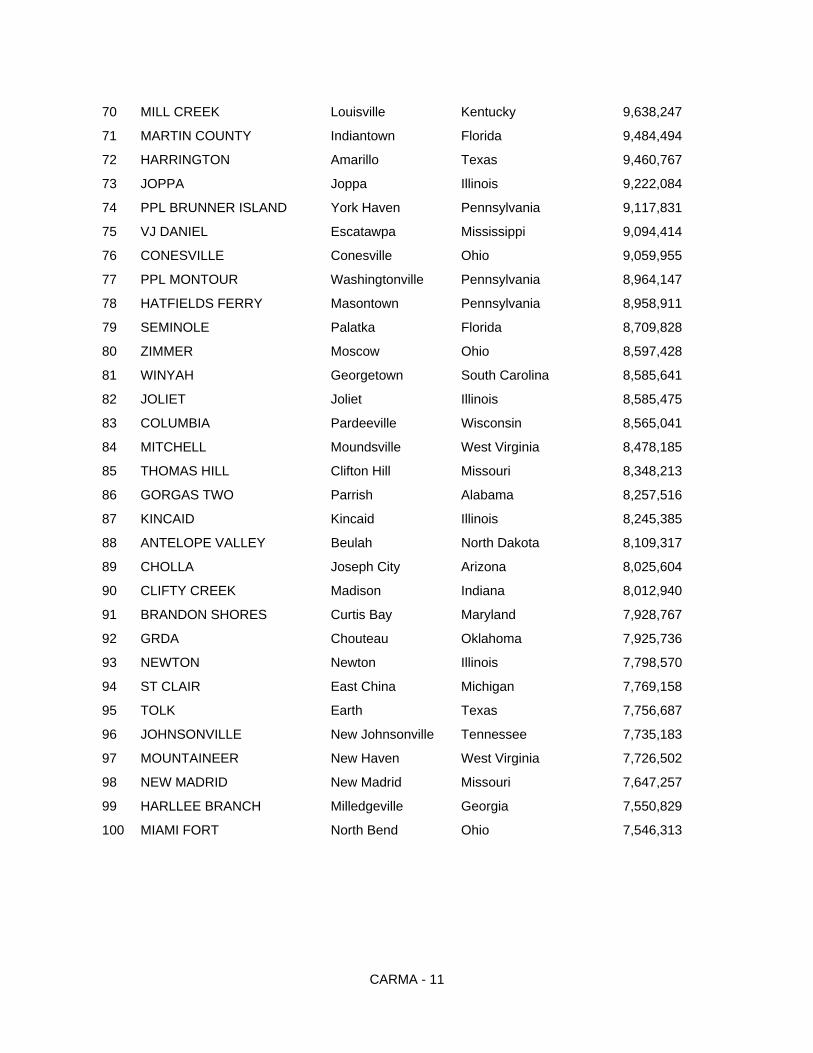
70 MILL CREEK Louisville Kentucky 9,638,247
71 MARTIN COUNTY Indiantown Florida 9,484,494
72 HARRINGTON Amarillo Texas 9,460,767
73 JOPPA Joppa Illinois 9,222,084
74 PPL BRUNNER ISLAND York Haven Pennsylvania 9,117,831
75 VJ DANIEL Escatawpa Mississippi 9,094,414
76 CONESVILLE Conesville Ohio 9,059,955
77 PPL MONTOUR Washingtonville Pennsylvania 8,964,147
78 HATFIELDS FERRY Masontown Pennsylvania 8,958,911
79 SEMINOLE Palatka Florida 8,709,828
80 ZIMMER Moscow Ohio 8,597,428
81 WINYAH Georgetown South Carolina 8,585,641
82 JOLIET Joliet Illinois 8,585,475
83 COLUMBIA Pardeeville Wisconsin 8,565,041
84 MITCHELL Moundsville West Virginia 8,478,185
85 THOMAS HILL Clifton Hill Missouri 8,348,213
86 GORGAS TWO Parrish Alabama 8,257,516
87 KINCAID Kincaid Illinois 8,245,385
88 ANTELOPE VALLEY Beulah North Dakota 8,109,317
89 CHOLLA Joseph City Arizona 8,025,604
90 CLIFTY CREEK Madison Indiana 8,012,940
91 BRANDON SHORES Curtis Bay Maryland 7,928,767
92 GRDA Chouteau Oklahoma 7,925,736
93 NEWTON Newton Illinois 7,798,570
94 ST CLAIR East China Michigan 7,769,158
95 TOLK Earth Texas 7,756,687
96 JOHNSONVILLE New Johnsonville Tennessee 7,735,183
97 MOUNTAINEER New Haven West Virginia 7,726,502
98 NEW MADRID New Madrid Missouri 7,647,257
99 HARLLEE BRANCH Milledgeville Georgia 7,550,829
100 MIAMI FORT North Bend Ohio 7,546,313
CARMA - 11

Table 2. Power Sector CO2 Emissions by State
State Tons of CO2
1 Texas 290,000,000
2 Florida 157,000,000
3 Indiana 137,000,000
4 Pennsylvania 136,000,000
5 Ohio 133,000,000
6 Illinois 113,000,000
7 Kentucky 98,300,000
8 Georgia 91,500,000
9 Michigan 91,400,000
10 Alabama 90,700,000
11 West Virginia 88,600,000
12 Missouri 82,500,000
13 California 79,200,000
14 North Carolina 77,700,000
15 New York 69,600,000
16 Arizona 64,500,000
17 Tennessee 63,300,000
18 Louisiana 61,000,000
19 Oklahoma 57,000,000
20 Wisconsin 54,800,000
21 South Carolina 52,500,000
22 Virginia 49,700,000
23 Colorado 47,200,000
24 Wyoming 45,900,000
25 Kansas 43,500,000
26 Minnesota 43,500,000
27 Utah 41,900,000
28 Iowa 38,800,000
29 North Dakota 37,600,000
30 Arkansas 35,400,000
31 Maryland 33,600,000
32 New Mexico 32,800,000
33 Mississippi 30,900,000
CARMA - 12
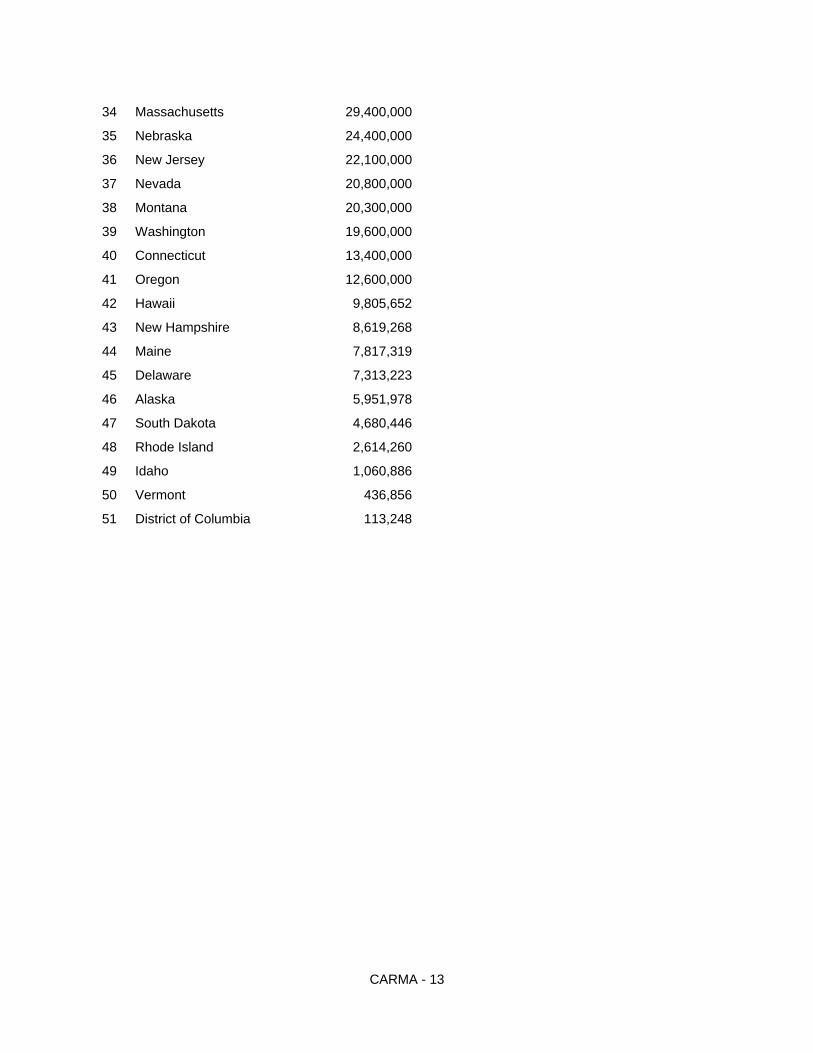
34 Massachusetts 29,400,000
35 Nebraska 24,400,000
36 New Jersey 22,100,000
37 Nevada 20,800,000
38 Montana 20,300,000
39 Washington 19,600,000
40 Connecticut 13,400,000
41 Oregon 12,600,000
42 Hawaii 9,805,652
43 New Hampshire 8,619,268
44 Maine 7,817,319
45 Delaware 7,313,223
46 Alaska 5,951,978
47 South Dakota 4,680,446
48 Rhode Island 2,614,260
49 Idaho 1,060,886
50 Vermont 436,856
51 District of Columbia 113,248
CARMA - 13
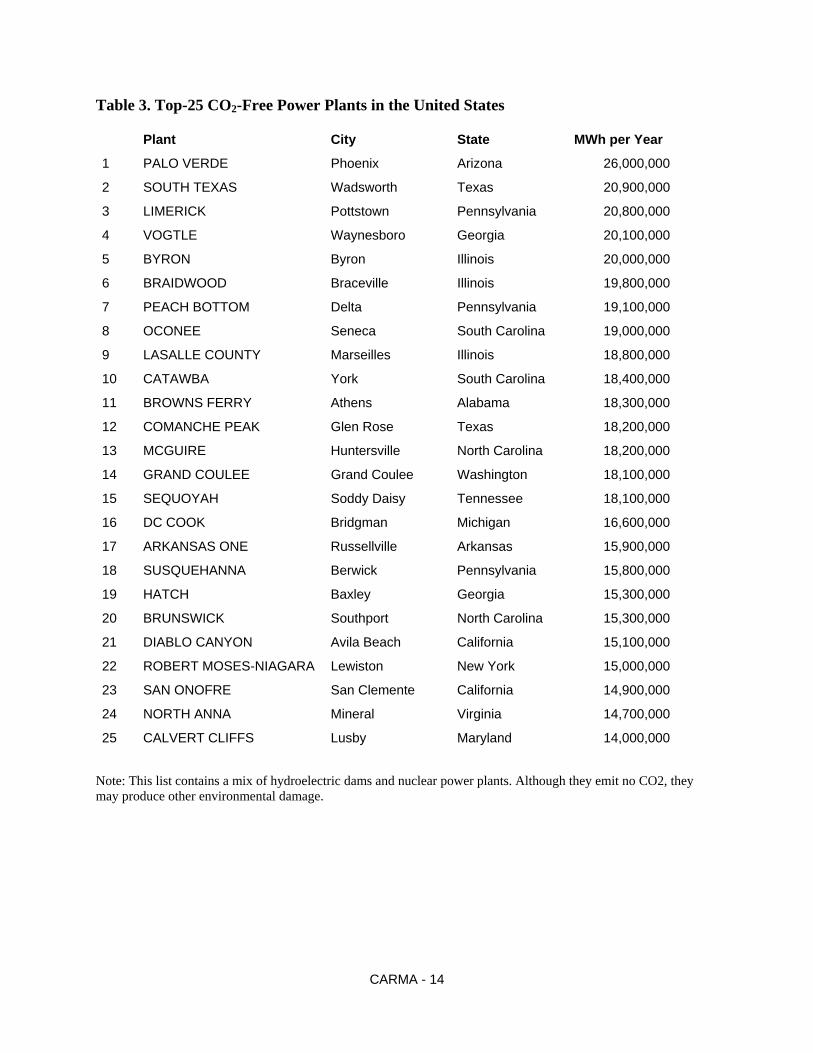
Table 3. Top-25 CO2-Free Power Plants in the United States
Plant City State MWh per Year
1 PALO VERDE Phoenix Arizona 26,000,000
2 SOUTH TEXAS Wadsworth Texas 20,900,000
3 LIMERICK Pottstown Pennsylvania 20,800,000
4 VOGTLE Waynesboro Georgia 20,100,000
5 BYRON Byron Illinois 20,000,000
6 BRAIDWOOD Braceville Illinois 19,800,000
7 PEACH BOTTOM Delta Pennsylvania 19,100,000
8 OCONEE Seneca South Carolina 19,000,000
9 LASALLE COUNTY Marseilles Illinois 18,800,000
10 CATAWBA York South Carolina 18,400,000
11 BROWNS FERRY Athens Alabama 18,300,000
12 COMANCHE PEAK Glen Rose Texas 18,200,000
13 MCGUIRE Huntersville North Carolina 18,200,000
14 GRAND COULEE Grand Coulee Washington 18,100,000
15 SEQUOYAH Soddy Daisy Tennessee 18,100,000
16 DC COOK Bridgman Michigan 16,600,000
17 ARKANSAS ONE Russellville Arkansas 15,900,000
18 SUSQUEHANNA Berwick Pennsylvania 15,800,000
19 HATCH Baxley Georgia 15,300,000
20 BRUNSWICK Southport North Carolina 15,300,000
21 DIABLO CANYON Avila Beach California 15,100,000
22 ROBERT MOSES-NIAGARA Lewiston New York 15,000,000
23 SAN ONOFRE San Clemente California 14,900,000
24 NORTH ANNA Mineral Virginia 14,700,000
25 CALVERT CLIFFS Lusby Maryland 14,000,000 Note: This list contains a mix of hydroelectric dams and nuclear power plants. Although they emit no CO2, they may produce other environmental damage.
CARMA - 14
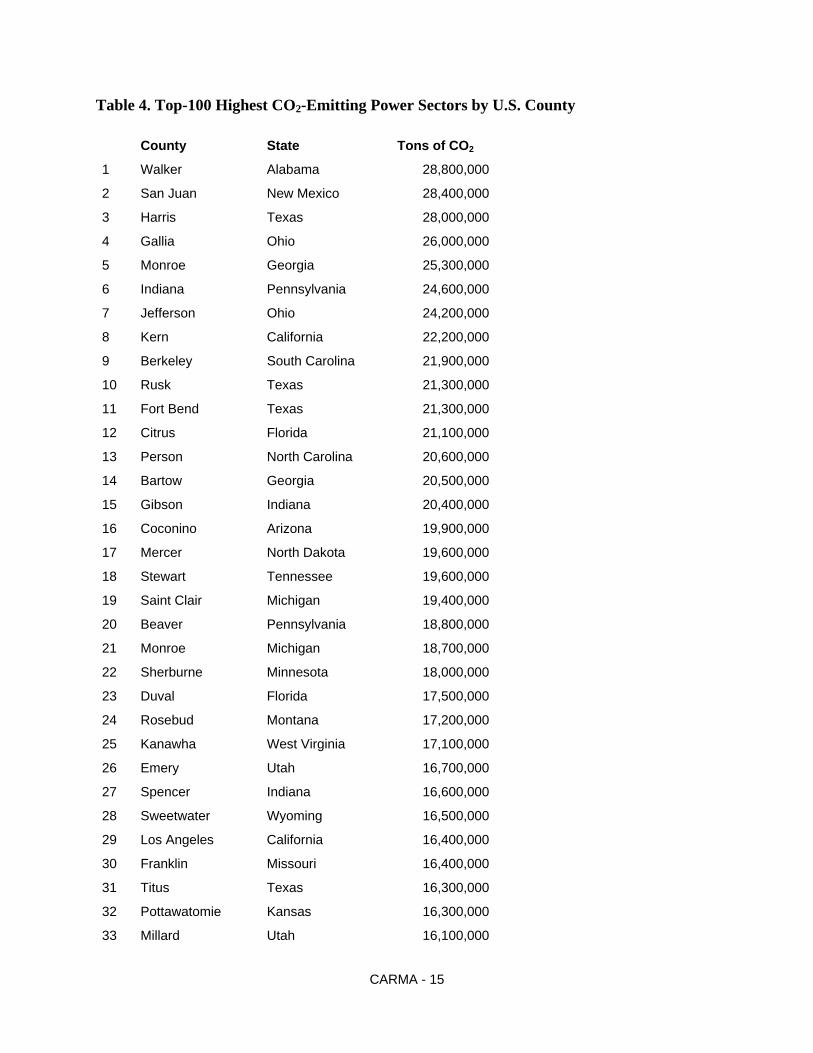
Table 4. Top-100 Highest CO2-Emitting Power Sectors by U.S. County
County State Tons of CO2
1 Walker Alabama 28,800,000
2 San Juan New Mexico 28,400,000
3 Harris Texas 28,000,000
4 Gallia Ohio 26,000,000
5 Monroe Georgia 25,300,000
6 Indiana Pennsylvania 24,600,000
7 Jefferson Ohio 24,200,000
8 Kern California 22,200,000
9 Berkeley South Carolina 21,900,000
10 Rusk Texas 21,300,000
11 Fort Bend Texas 21,300,000
12 Citrus Florida 21,100,000
13 Person North Carolina 20,600,000
14 Bartow Georgia 20,500,000
15 Gibson Indiana 20,400,000
16 Coconino Arizona 19,900,000
17 Mercer North Dakota 19,600,000
18 Stewart Tennessee 19,600,000
19 Saint Clair Michigan 19,400,000
20 Beaver Pennsylvania 18,800,000
21 Monroe Michigan 18,700,000
22 Sherburne Minnesota 18,000,000
23 Duval Florida 17,500,000
24 Rosebud Montana 17,200,000
25 Kanawha West Virginia 17,100,000
26 Emery Utah 16,700,000
27 Spencer Indiana 16,600,000
28 Sweetwater Wyoming 16,500,000
29 Los Angeles California 16,400,000
30 Franklin Missouri 16,400,000
31 Titus Texas 16,300,000
32 Pottawatomie Kansas 16,300,000
33 Millard Utah 16,100,000
CARMA - 15
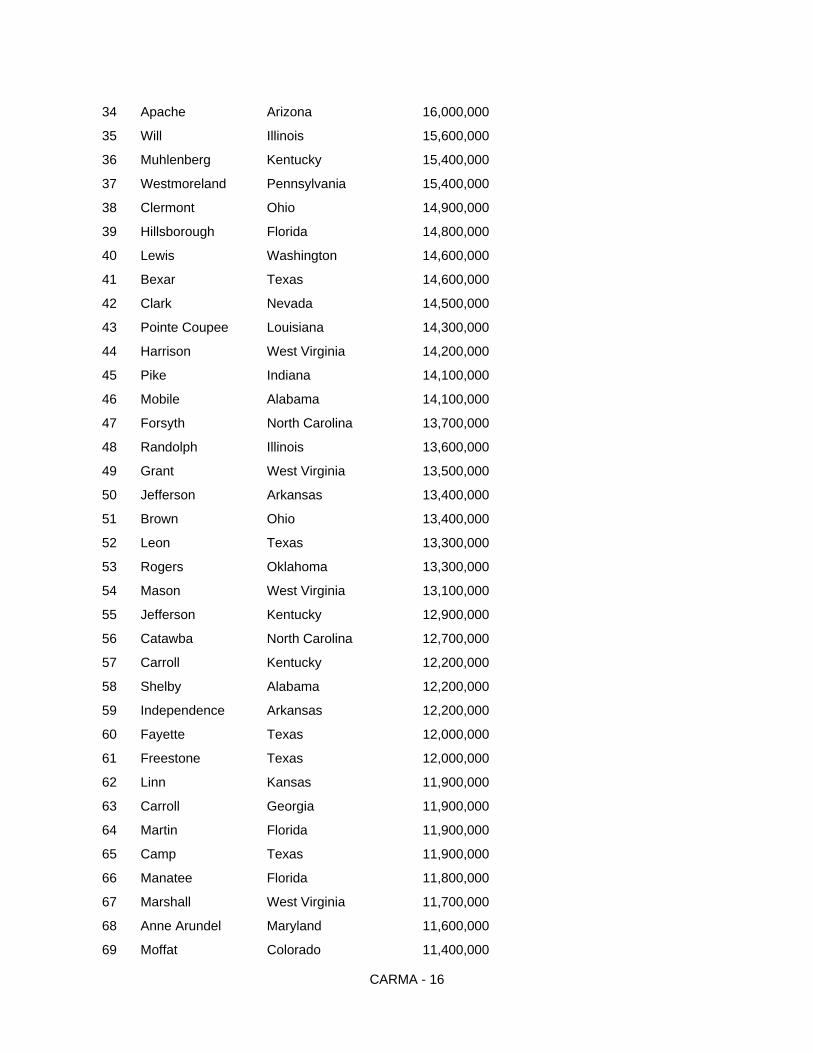
34 Apache Arizona 16,000,000
35 Will Illinois 15,600,000
36 Muhlenberg Kentucky 15,400,000
37 Westmoreland Pennsylvania 15,400,000
38 Clermont Ohio 14,900,000
39 Hillsborough Florida 14,800,000
40 Lewis Washington 14,600,000
41 Bexar Texas 14,600,000
42 Clark Nevada 14,500,000
43 Pointe Coupee Louisiana 14,300,000
44 Harrison West Virginia 14,200,000
45 Pike Indiana 14,100,000
46 Mobile Alabama 14,100,000
47 Forsyth North Carolina 13,700,000
48 Randolph Illinois 13,600,000
49 Grant West Virginia 13,500,000
50 Jefferson Arkansas 13,400,000
51 Brown Ohio 13,400,000
52 Leon Texas 13,300,000
53 Rogers Oklahoma 13,300,000
54 Mason West Virginia 13,100,000
55 Jefferson Kentucky 12,900,000
56 Catawba North Carolina 12,700,000
57 Carroll Kentucky 12,200,000
58 Shelby Alabama 12,200,000
59 Independence Arkansas 12,200,000
60 Fayette Texas 12,000,000
61 Freestone Texas 12,000,000
62 Linn Kansas 11,900,000
63 Carroll Georgia 11,900,000
64 Martin Florida 11,900,000
65 Camp Texas 11,900,000
66 Manatee Florida 11,800,000
67 Marshall West Virginia 11,700,000
68 Anne Arundel Maryland 11,600,000
69 Moffat Colorado 11,400,000
CARMA - 16
70 Calcasieu Louisiana 11,400,000
71 Lincoln Nebraska 11,100,000
72 Maricopa Arizona 11,000,000
73 Queens New York 11,000,000
74 Wayne Michigan 11,000,000
75 Jasper Indiana 11,000,000
76 Brazoria Texas 10,900,000
77 Ottawa Michigan 10,700,000
78 Mclean North Dakota 10,600,000
79 Muskogee Oklahoma 10,600,000
80 Potter Texas 10,200,000
81 Platte Wyoming 10,100,000
82 York Pennsylvania 10,100,000
83 Roane Tennessee 10,100,000
84 Tazewell Illinois 10,000,000
85 Warrick Indiana 10,000,000
86 Polk Florida 9,997,184
87 Jackson Alabama 9,976,111
88 Chesterfield Virginia 9,865,334
89 Mccracken Kentucky 9,851,850
90 Kenosha Wisconsin 9,691,582
91 Bay Michigan 9,679,930
92 Contra Costa California 9,672,508
93 Putnam Florida 9,607,276
94 Massac Illinois 9,393,236
95 Fayette Pennsylvania 9,214,486
96 Milwaukee Wisconsin 9,214,344
97 Jackson Mississippi 9,094,414
98 Coshocton Ohio 9,086,479
99 Washington Ohio 9,038,868
100 Montour Pennsylvania 8,964,147
CARMA - 17
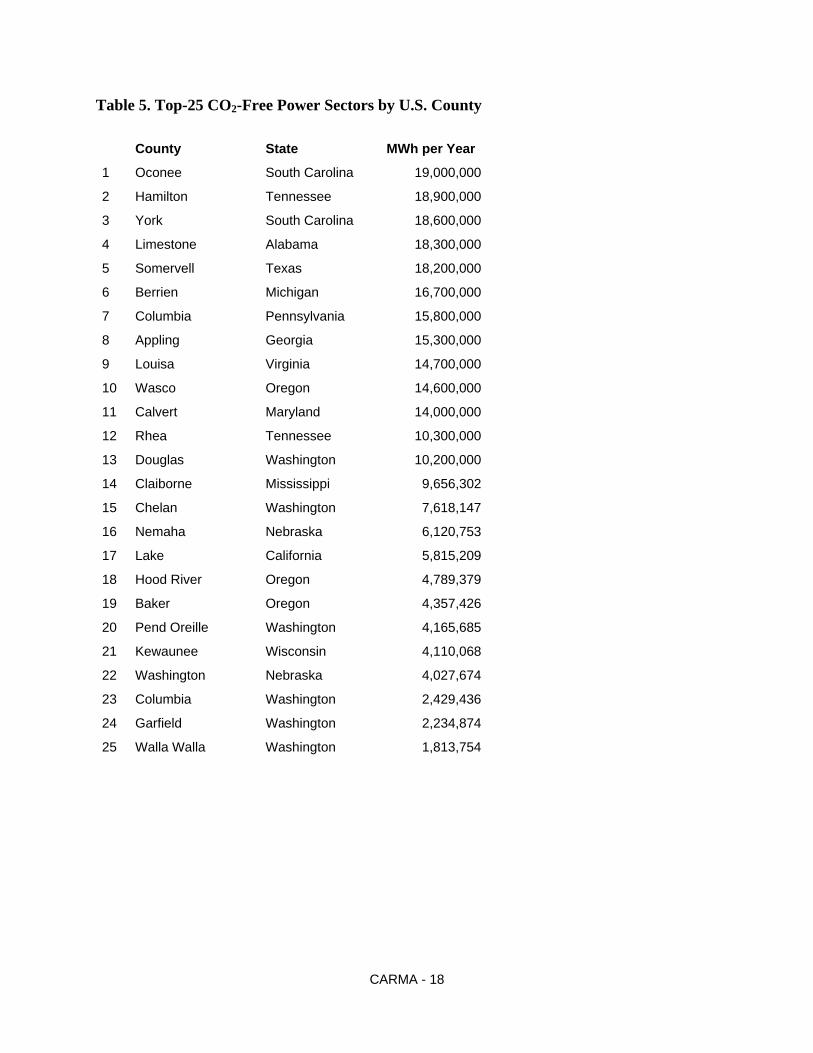
Table 5. Top-25 CO2-Free Power Sectors by U.S. County County State MWh per Year
1 Oconee South Carolina 19,000,000
2 Hamilton Tennessee 18,900,000
3 York South Carolina 18,600,000
4 Limestone Alabama 18,300,000
5 Somervell Texas 18,200,000
6 Berrien Michigan 16,700,000
7 Columbia Pennsylvania 15,800,000
8 Appling Georgia 15,300,000
9 Louisa Virginia 14,700,000
10 Wasco Oregon 14,600,000
11 Calvert Maryland 14,000,000
12 Rhea Tennessee 10,300,000
13 Douglas Washington 10,200,000
14 Claiborne Mississippi 9,656,302
15 Chelan Washington 7,618,147
16 Nemaha Nebraska 6,120,753
17 Lake California 5,815,209
18 Hood River Oregon 4,789,379
19 Baker Oregon 4,357,426
20 Pend Oreille Washington 4,165,685
21 Kewaunee Wisconsin 4,110,068
22 Washington Nebraska 4,027,674
23 Columbia Washington 2,429,436
24 Garfield Washington 2,234,874
25 Walla Walla Washington 1,813,754
CARMA - 18
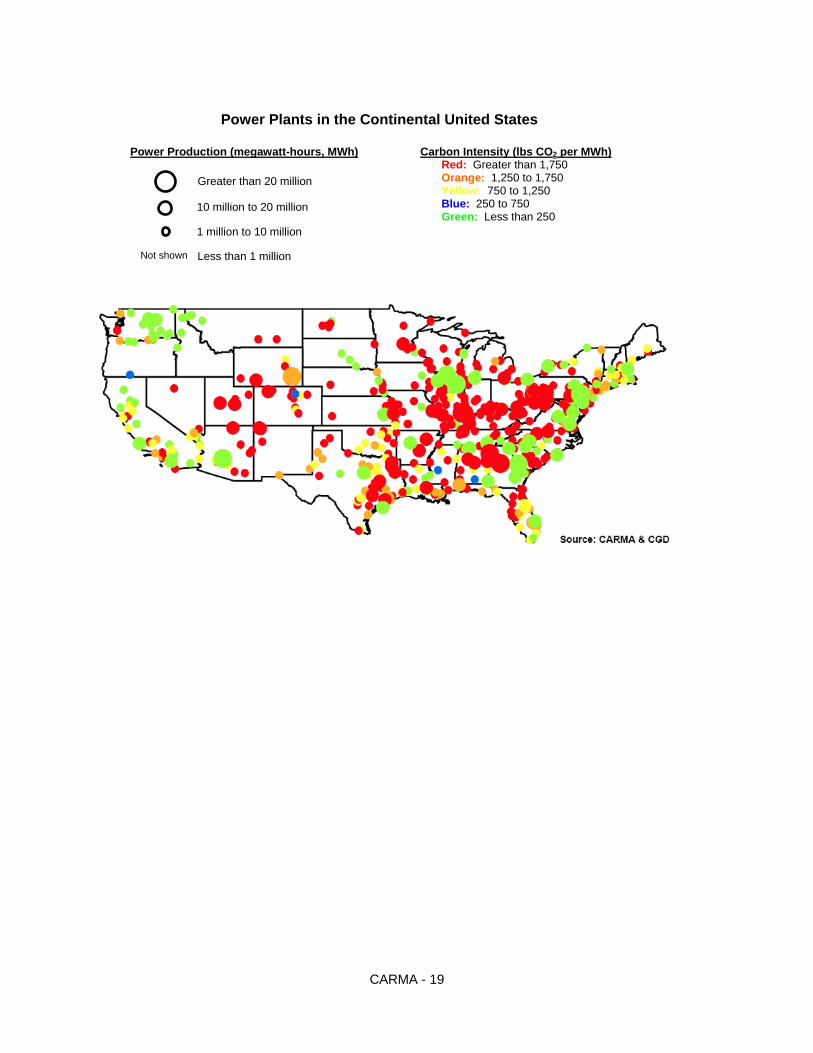
Power Plants in the Continental United States
Power Production (megawatt-hours, MWh)
Carbon Intensity (lbs CO2 per MWh) Red: Greater than 1,750 Orange: 1,250 to 1,750 Yellow: 750 to 1,250 Blue: 250 to 750 Green: Less than 250
Greater than 20 million
10 million to 20 million
1 million to 10 million
Less than 1 million Not shown
CARMA - 19
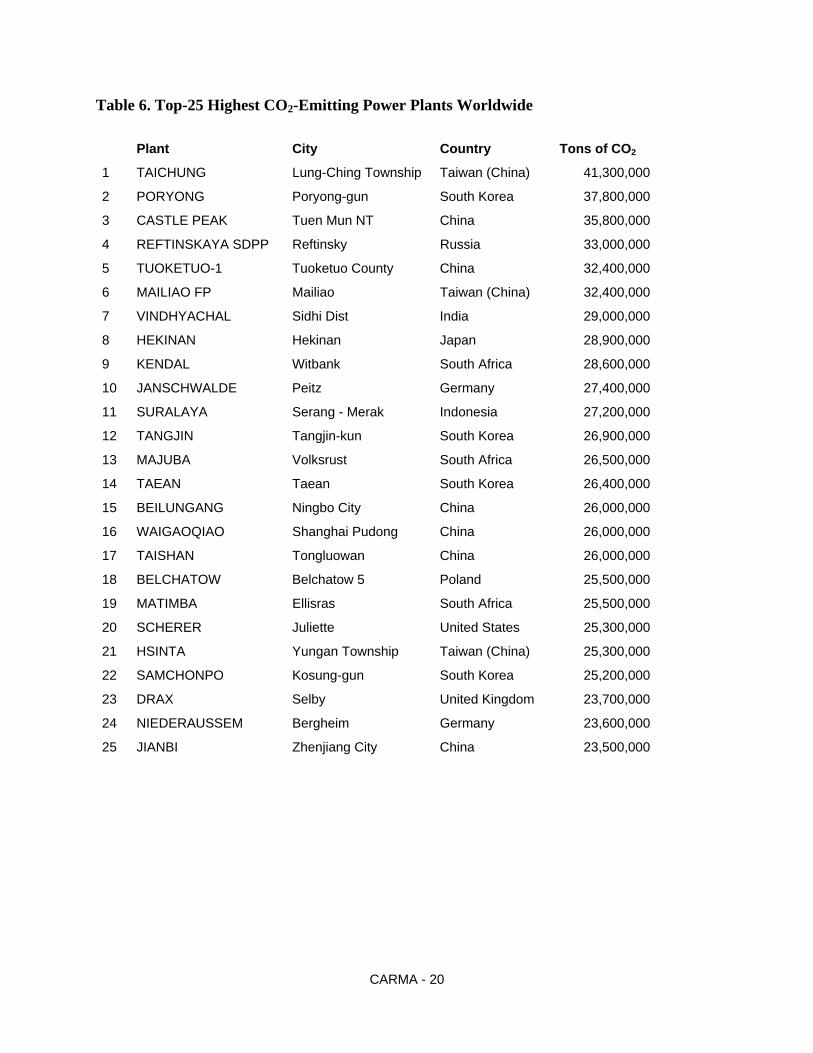
Table 6. Top-25 Highest CO2-Emitting Power Plants Worldwide Plant City Country Tons of CO2
1 TAICHUNG Lung-Ching Township Taiwan (China) 41,300,000
2 PORYONG Poryong-gun South Korea 37,800,000
3 CASTLE PEAK Tuen Mun NT China 35,800,000
4 REFTINSKAYA SDPP Reftinsky Russia 33,000,000
5 TUOKETUO-1 Tuoketuo County China 32,400,000
6 MAILIAO FP Mailiao Taiwan (China) 32,400,000
7 VINDHYACHAL Sidhi Dist India 29,000,000
8 HEKINAN Hekinan Japan 28,900,000
9 KENDAL Witbank South Africa 28,600,000
10 JANSCHWALDE Peitz Germany 27,400,000
11 SURALAYA Serang - Merak Indonesia 27,200,000
12 TANGJIN Tangjin-kun South Korea 26,900,000
13 MAJUBA Volksrust South Africa 26,500,000
14 TAEAN Taean South Korea 26,400,000
15 BEILUNGANG Ningbo City China 26,000,000
16 WAIGAOQIAO Shanghai Pudong China 26,000,000
17 TAISHAN Tongluowan China 26,000,000
18 BELCHATOW Belchatow 5 Poland 25,500,000
19 MATIMBA Ellisras South Africa 25,500,000
20 SCHERER Juliette United States 25,300,000
21 HSINTA Yungan Township Taiwan (China) 25,300,000
22 SAMCHONPO Kosung-gun South Korea 25,200,000
23 DRAX Selby United Kingdom 23,700,000
24 NIEDERAUSSEM Bergheim Germany 23,600,000
25 JIANBI Zhenjiang City China 23,500,000
CARMA - 20
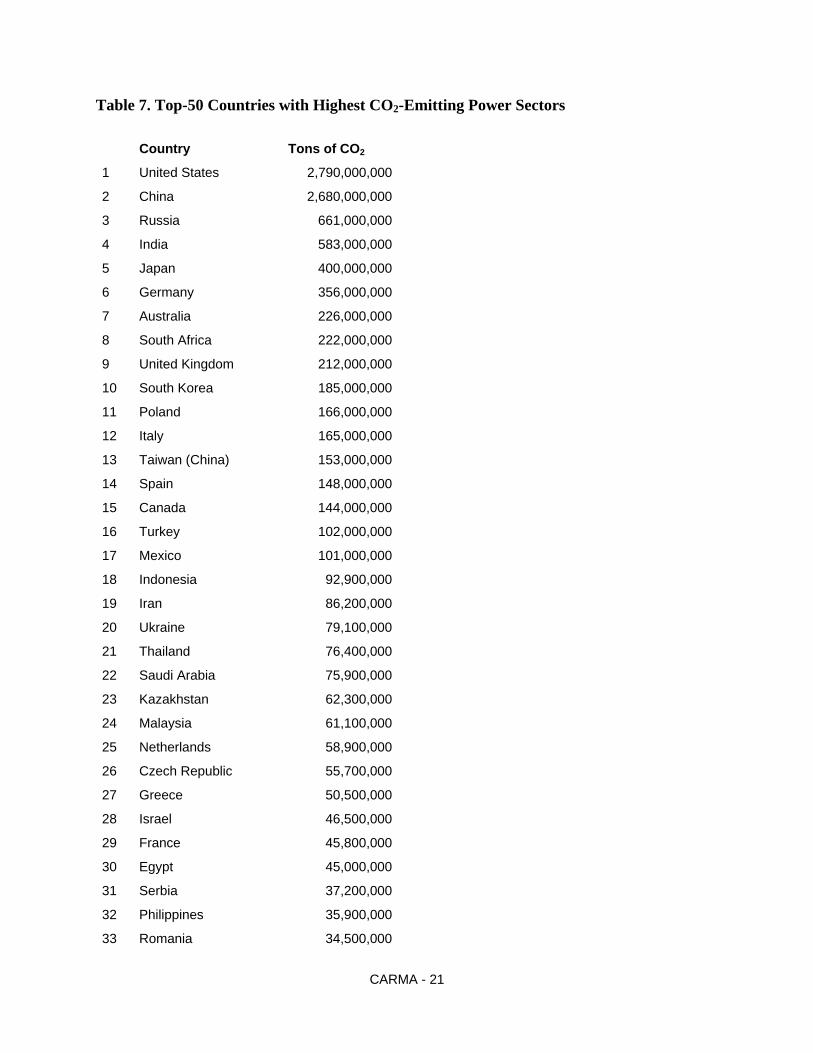
Table 7. Top-50 Countries with Highest CO2-Emitting Power Sectors Country Tons of CO2
1 United States 2,790,000,000
2 China 2,680,000,000
3 Russia 661,000,000
4 India 583,000,000
5 Japan 400,000,000
6 Germany 356,000,000
7 Australia 226,000,000
8 South Africa 222,000,000
9 United Kingdom 212,000,000
10 South Korea 185,000,000
11 Poland 166,000,000
12 Italy 165,000,000
13 Taiwan (China) 153,000,000
14 Spain 148,000,000
15 Canada 144,000,000
16 Turkey 102,000,000
17 Mexico 101,000,000
18 Indonesia 92,900,000
19 Iran 86,200,000
20 Ukraine 79,100,000
21 Thailand 76,400,000
22 Saudi Arabia 75,900,000
23 Kazakhstan 62,300,000
24 Malaysia 61,100,000
25 Netherlands 58,900,000
26 Czech Republic 55,700,000
27 Greece 50,500,000
28 Israel 46,500,000
29 France 45,800,000
30 Egypt 45,000,000
31 Serbia 37,200,000
32 Philippines 35,900,000
33 Romania 34,500,000
CARMA - 21
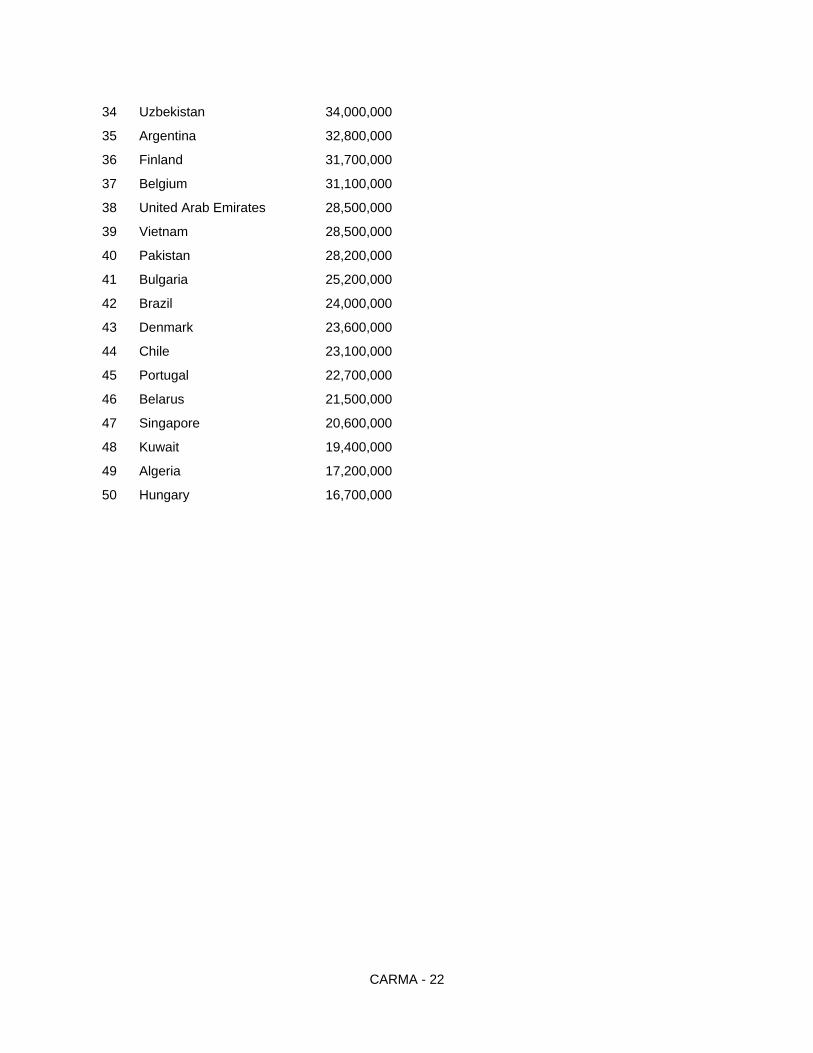
34 Uzbekistan 34,000,000
35 Argentina 32,800,000
36 Finland 31,700,000
37 Belgium 31,100,000
38 United Arab Emirates 28,500,000
39 Vietnam 28,500,000
40 Pakistan 28,200,000
41 Bulgaria 25,200,000
42 Brazil 24,000,000
43 Denmark 23,600,000
44 Chile 23,100,000
45 Portugal 22,700,000
46 Belarus 21,500,000
47 Singapore 20,600,000
48 Kuwait 19,400,000
49 Algeria 17,200,000
50 Hungary 16,700,000
CARMA - 22