Embed Size (px)
Citation preview
CFO Lens
Relevant, CFO-centric content
November 11–13 | Washington, D.C.
CFO VISION 2015
CFO Lens
Relevant, CFO-centric content
Patricia Buckley, Director, Economic
Policy & Analysis, Deloitte Services LP
Sara Elinson, Principal, Deloitte LLP
Elinor L. Hoover, Global Co-Head, Consumer
Products; Vice Chairman, Capital Markets
Origination, Citigroup Global Markets Inc.
Capital markets 2016:
Preparing for the unexpected
CAPITAL

Copyright © 2015 Deloitte Development LLC. All rights reserved.
Agenda
2
Economic growth challenges
Capital markets outlook
Panel discussion
Q&A

Copyright © 2015 Deloitte Development LLC. All rights reserved.
Two big trends impacting world
growth: the falling price of oil and
rising value of the dollar.
How one views these developments
depends on where and in which
sector you operate.
3

Copyright © 2015 Deloitte Development LLC. All rights reserved.
Falling oil prices has many winners and losers
4
Source: US Department of Energy, Energy Information Agency

Copyright © 2015 Deloitte Development LLC. All rights reserved.
The rising value of the dollar is a challenge to US exports,
but can help US trading partners and US consumers
5
Source: Federal Reserve Board

Copyright © 2015 Deloitte Development LLC. All rights reserved.
A wide variety of policy issues can impact the
attractiveness of markets as investment targets
6
Source: OCED International direct investment database, IMF
About Deloitte’s CFO Program
The CFO Program brings together a multidisciplinary team of Deloitte leaders and subject matter specialists to help CFOs stay
ahead in the face of growing challenges and demands. The program harnesses our organization’s broad capabilities to deliver
forward thinking and fresh insights for every stage of a CFO’s career, helping CFOs manage the complexities of their roles, tackle
their company’s most compelling challenges, and adapt to strategic shifts in the market.
DisclaimerThis publication contains general information only and Deloitte is not, by means of this publication, rendering accounting, business, financial, investment, legal, tax, or other professional advice or services. This publication is not a substitute for such professional advice or services, nor should it be used as a basis for any decision or action that may affect your business. Before making any decision or taking any action that may affect your business, you should consult a qualified professional advisor.Deloitte shall not be responsible for any loss sustained by any person who relies on this publication.
About DeloitteAs used in this document, "Deloitte" means Deloitte LLP and its subsidiaries. Please see www.deloitte.com/us/about for a detailed description of the legal structure of Deloitte LLP and its subsidiaries. Certain services may not be available to attest clients under the rules and regulations of public accounting.
Copyright © 2015 Deloitte Development LLC. All rights reserved.
Strictly Private and Confidential
November 12, 2015
Citigroup Global Markets, Inc. | Corporate & Investment Banking | Capital Markets Origination
Capital Markets 2016: Preparing for the UnexpectedCFO Vision 2015: Change. Challenge. Opportunity
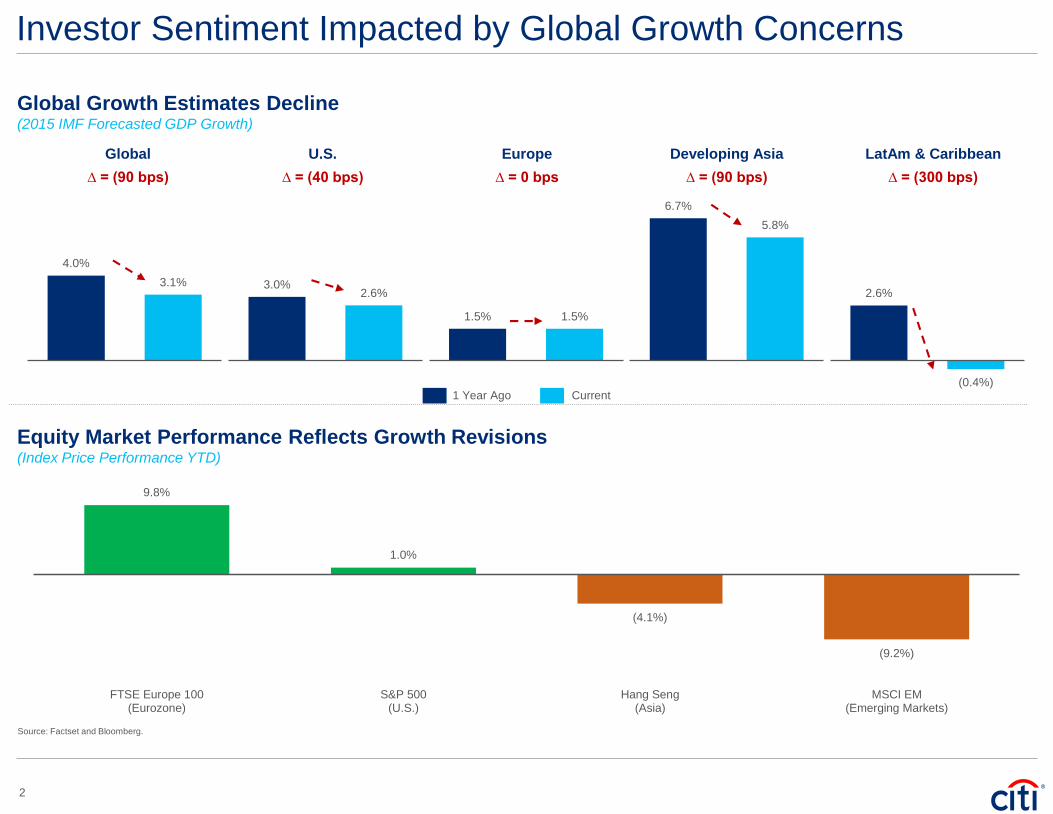
Investor Sentiment Impacted by Global Growth Concerns
2
2.6%
(0.4%)
1.5% 1.5%
4.0%
3.1% 3.0% 2.6%
Global Growth Estimates Decline(2015 IMF Forecasted GDP Growth)
6.7%
5.8%
Equity Market Performance Reflects Growth Revisions(Index Price Performance YTD)
Source: Factset and Bloomberg.
1 Year Ago Current
∆ = (90 bps) ∆ = (40 bps) ∆ = 0 bps ∆ = (90 bps) ∆ = (300 bps)
Global U.S. Europe Developing Asia LatAm & Caribbean
9.8%
1.0%
(4.1%)
(9.2%)
FTSE Europe 100(Eurozone)
S&P 500(U.S.)
Hang Seng(Asia)
MSCI EM(Emerging Markets)
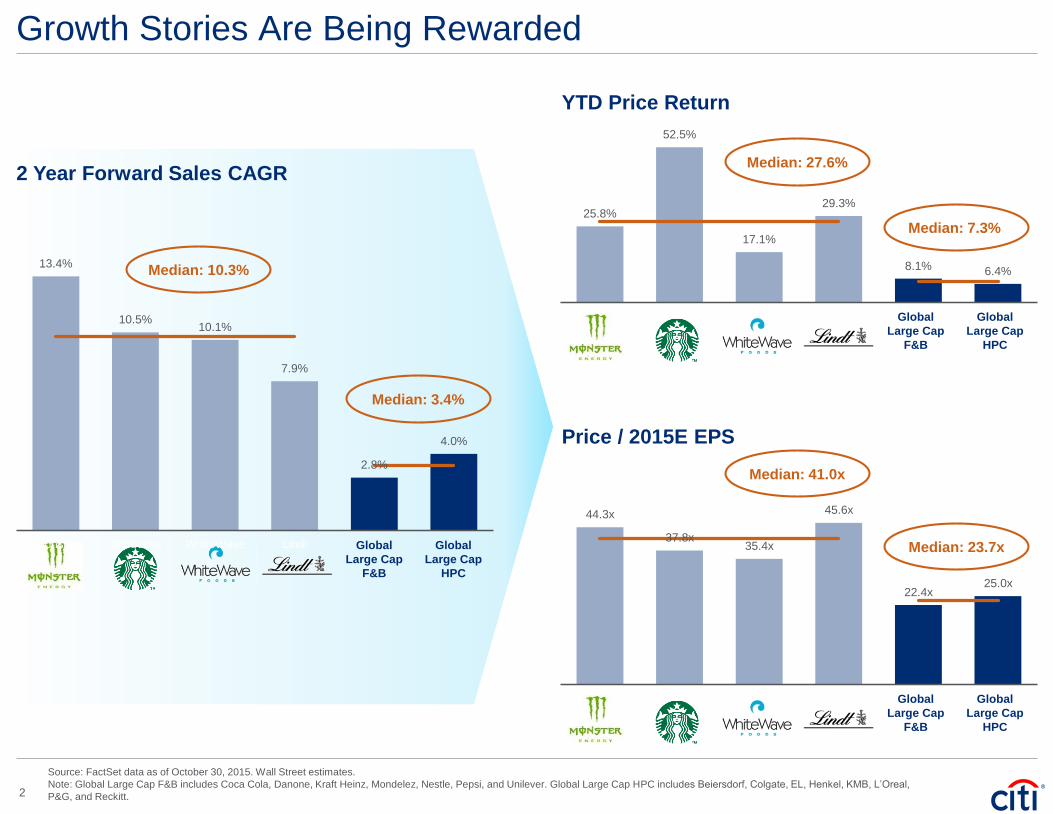
44.3x
37.8x 35.4x
45.6x
22.4x 25.0x
Monster Starbucks WhiteWave Lindt Global LargeCap F&B
Global LargeCap HPC
25.8%
52.5%
17.1%
29.3%
8.1% 6.4%
Monster Starbucks WhiteWave Lindt Global LargeCap F&B
Global LargeCap HPC
Growth Stories Are Being Rewarded
Price / 2015E EPS
Source: FactSet data as of October 30, 2015. Wall Street estimates.
Note: Global Large Cap F&B includes Coca Cola, Danone, Kraft Heinz, Mondelez, Nestle, Pepsi, and Unilever. Global Large Cap HPC includes Beiersdorf, Colgate, EL, Henkel, KMB, L’Oreal,
P&G, and Reckitt.
2 Year Forward Sales CAGR
Global
Large Cap
F&B
Global
Large Cap
HPC
YTD Price Return
Global
Large Cap
F&B
Global
Large Cap
HPC
Median: 27.6%
Median: 41.0x
Global
Large Cap
F&B
Global
Large Cap
HPC
13.4%
10.5% 10.1%
7.9%
2.8%
4.0%
Monster Starbucks WhiteWave Lindt
Median: 10.3%
Median: 3.4%
Median: 7.3%
Median: 23.7x
2
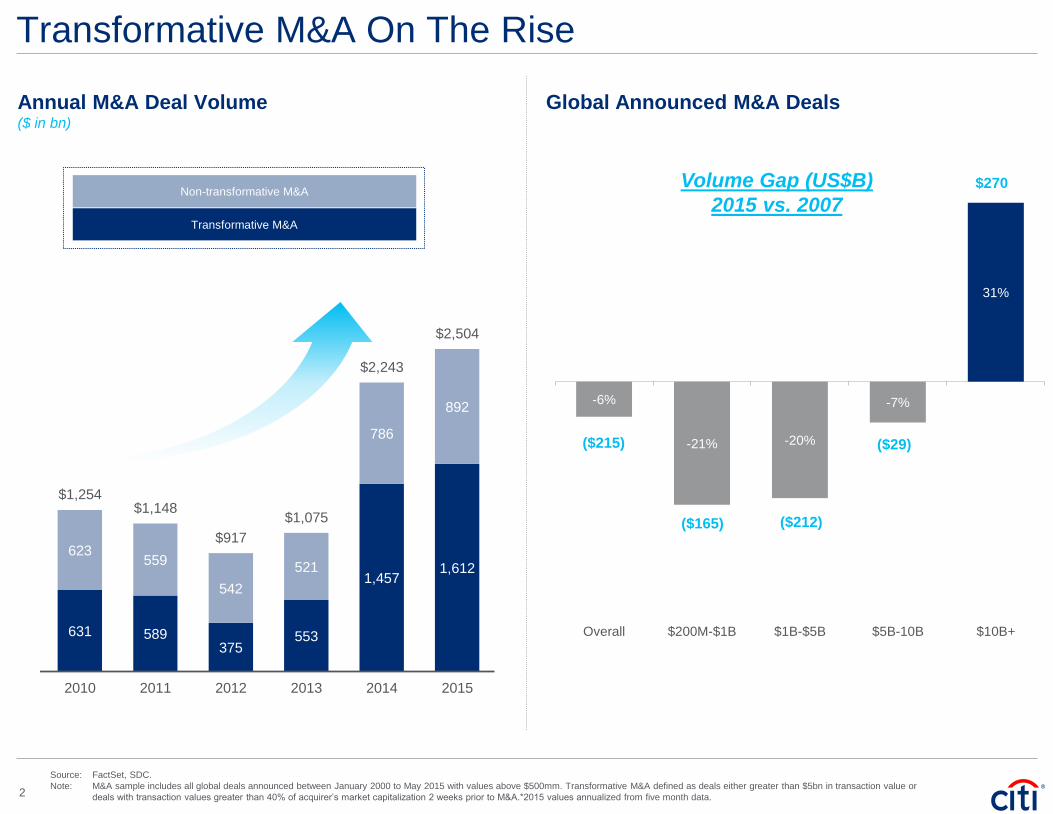
Transformative M&A On The Rise
2
Annual M&A Deal Volume($ in bn)
Non-transformative M&A
Transformative M&A
1,916
1,343
612
256 330
679 702
1,345 1,122
613 625 631 589 375
553
1,457 1,612
1,107
953
470
261 262
448
686
662 936
654 380
623 559
542
521
786
892
$3,023
$2,296
$1,082
$518 $592
$1,127
$1,388
$2,007 $2,057
$1,267
$1,005
$1,254 $1,148
$917
$1,075
$2,243
$2,504
1999 2000 2001 2002 2003 2004 2005 2006 2007 2008 2009 2010 2011 2012 2013 2014 2015
Global Announced M&A Deals
-6%
-21% -20%
-7%
31%
Overall $200M-$1B $1B-$5B $5B-10B $10B+
Volume Gap (US$B)
2015 vs. 2007$270
($165) ($212)
($29)($215)
Source: FactSet, SDC.
Note: M&A sample includes all global deals announced between January 2000 to May 2015 with values above $500mm. Transformative M&A defined as deals either greater than $5bn in transaction value or
deals with transaction values greater than 40% of acquirer’s market capitalization 2 weeks prior to M&A.*2015 values annualized from five month data.
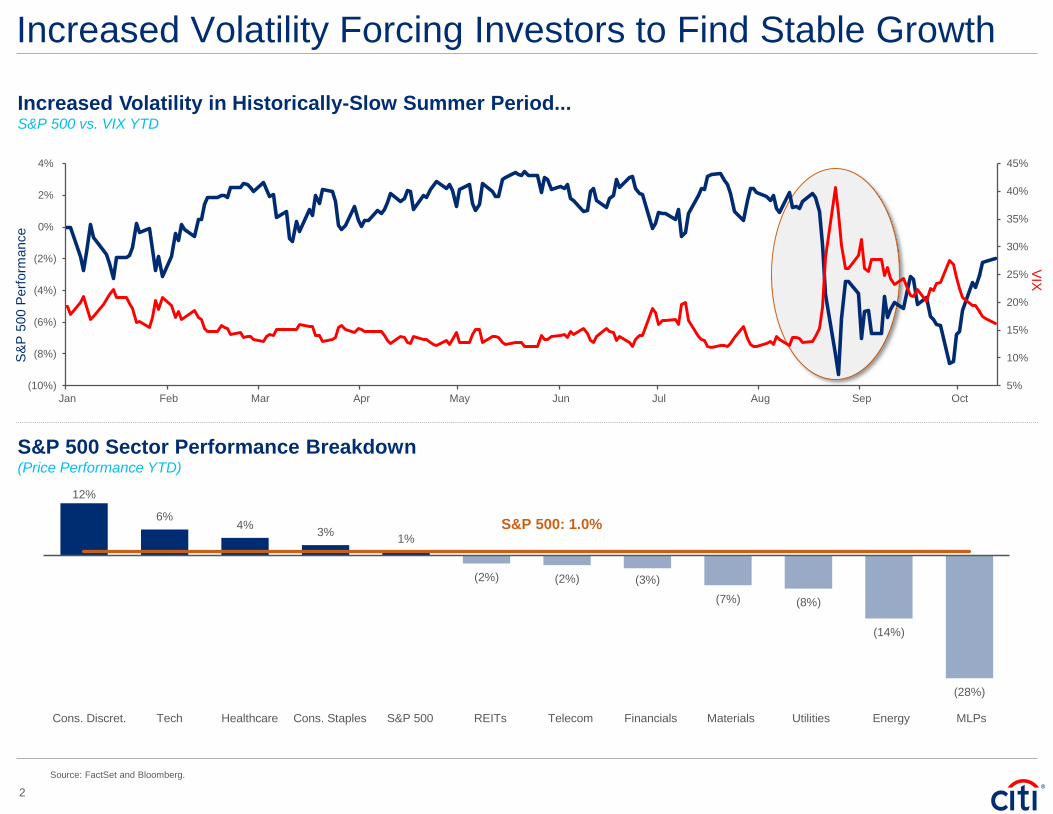
Increased Volatility Forcing Investors to Find Stable Growth
2
Source: FactSet and Bloomberg.
Increased Volatility in Historically-Slow Summer Period...S&P 500 vs. VIX YTD
5%
10%
15%
20%
25%
30%
35%
40%
45%
(10%)
(8%)
(6%)
(4%)
(2%)
0%
2%
4%
Jan Feb Mar Apr May Jun Jul Aug Sep Oct
VIX
S&
P 5
00
Pe
rfo
rma
nce
S&P 500 Sector Performance Breakdown(Price Performance YTD)
12%
6% 4%
3% 1%
(2%) (2%) (3%)
(7%) (8%)
(14%)
(28%)
Cons. Discret. Tech Healthcare Cons. Staples S&P 500 REITs Telecom Financials Materials Utilities Energy MLPs
S&P 500: 1.0%
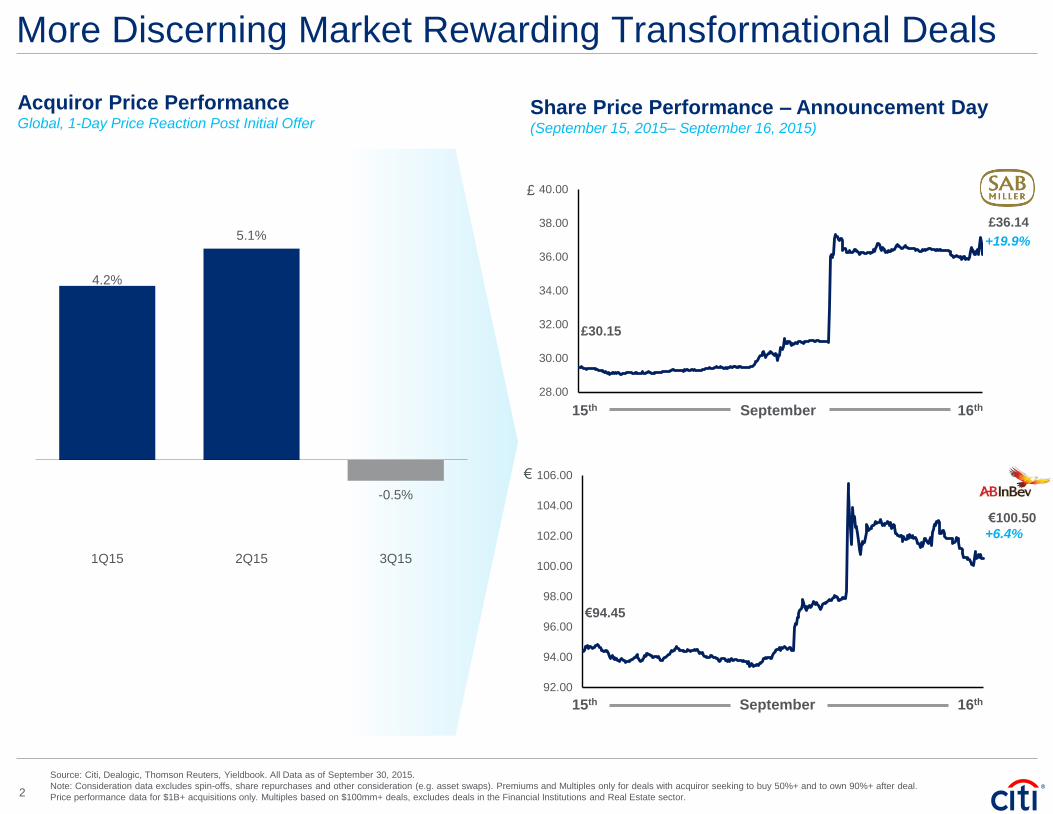
More Discerning Market Rewarding Transformational Deals
2
Source: Citi, Dealogic, Thomson Reuters, Yieldbook. All Data as of September 30, 2015.
Note: Consideration data excludes spin-offs, share repurchases and other consideration (e.g. asset swaps). Premiums and Multiples only for deals with acquiror seeking to buy 50%+ and to own 90%+ after deal.
Price performance data for $1B+ acquisitions only. Multiples based on $100mm+ deals, excludes deals in the Financial Institutions and Real Estate sector.
Acquiror Price Performance Global, 1-Day Price Reaction Post Initial Offer
4.2%
5.1%
-0.5%
1Q15 2Q15 3Q15
28.00
30.00
32.00
34.00
36.00
38.00
40.00
20150915 20150915.1720150915.34 20150915.5 20150915.6720150915.84
92.00
94.00
96.00
98.00
100.00
102.00
104.00
106.00
20150915 20150915.2 20150915.4 20150915.6 20150915.8
£30.15
£36.14
€94.45
€100.50
+19.9%
+6.4%
£
€
September
September 16th15th
16th15th
Share Price Performance – Announcement Day(September 15, 2015– September 16, 2015)
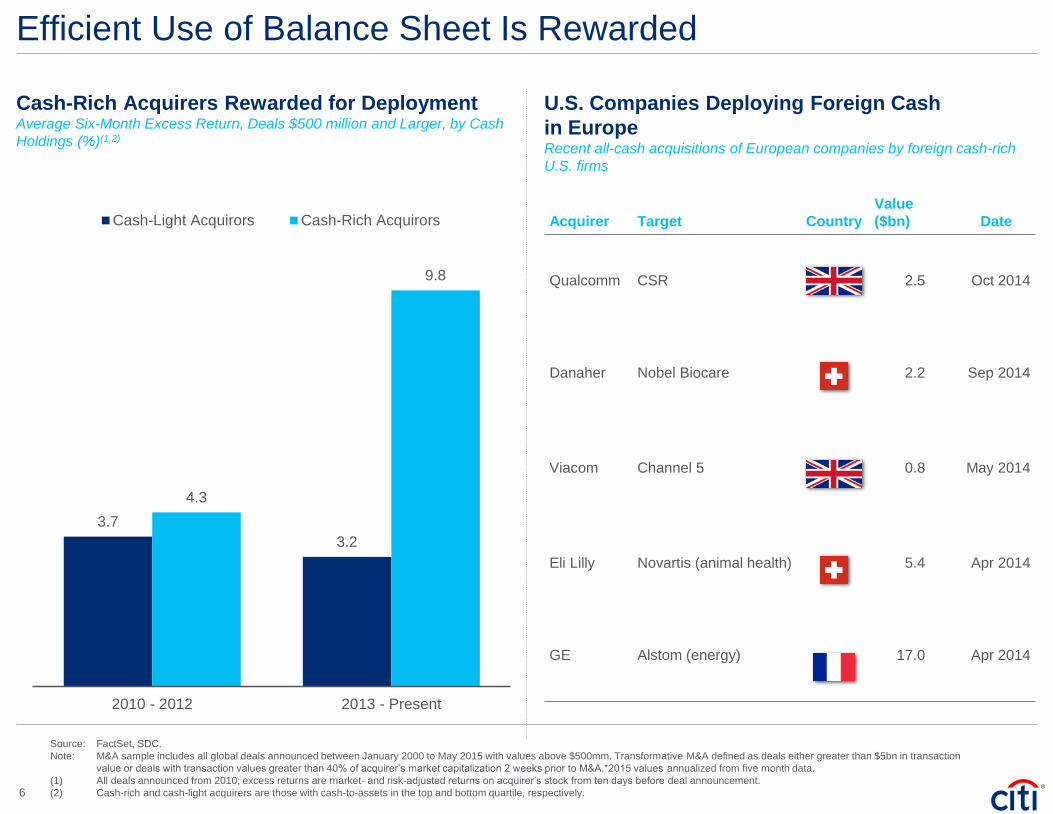
Efficient Use of Balance Sheet Is Rewarded
U.S. Companies Deploying Foreign Cash
in EuropeRecent all-cash acquisitions of European companies by foreign cash-rich
U.S. firms
Acquirer Target Country
Value
($bn) Date
Qualcomm CSR 2.5 Oct 2014
Danaher Nobel Biocare 2.2 Sep 2014
Viacom Channel 5 0.8 May 2014
Eli Lilly Novartis (animal health) 5.4 Apr 2014
GE Alstom (energy) 17.0 Apr 2014
Cash-Rich Acquirers Rewarded for DeploymentAverage Six-Month Excess Return, Deals $500 million and Larger, by Cash
Holdings (%)(1,2)
3.7
3.2
4.3
9.8
2010 - 2012 2013 - Present
Cash-Light Acquirors Cash-Rich Acquirors
Source: FactSet, SDC.
Note: M&A sample includes all global deals announced between January 2000 to May 2015 with values above $500mm. Transformative M&A defined as deals either greater than $5bn in transaction
value or deals with transaction values greater than 40% of acquirer’s market capitalization 2 weeks prior to M&A.*2015 values annualized from five month data.
(1) All deals announced from 2010; excess returns are market- and risk-adjusted returns on acquirer’s stock from ten days before deal announcement.
(2) Cash-rich and cash-light acquirers are those with cash-to-assets in the top and bottom quartile, respectively.6
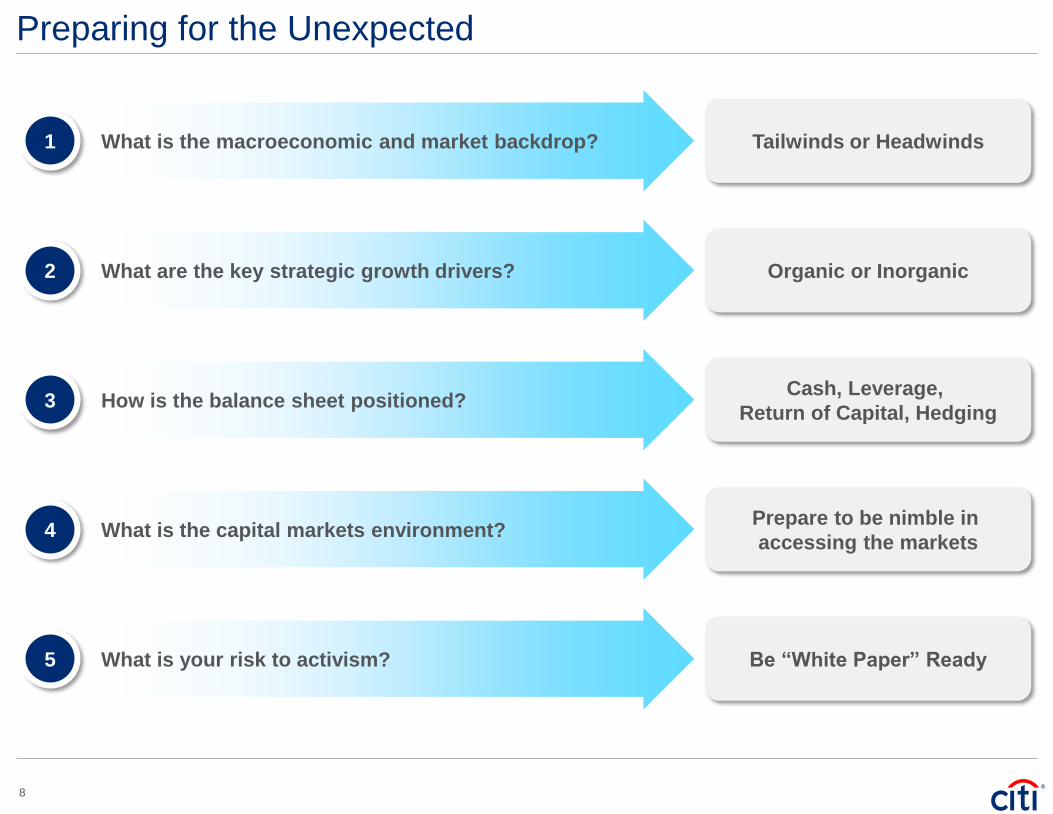
Preparing for the Unexpected
Tailwinds or Headwinds1 What is the macroeconomic and market backdrop?
Organic or Inorganic2 What are the key strategic growth drivers?
Cash, Leverage,
Return of Capital, Hedging3 How is the balance sheet positioned?
Prepare to be nimble in
accessing the markets4 What is the capital markets environment?
Be “White Paper” Ready5 What is your risk to activism?
8
IRS Circular 230 Disclosure: Citigroup Inc. and its affiliates do not provide tax or legal advice. Any discussion of tax matters in these materials (i) is not intended or written to be used, and cannot be used or
relied upon, by you for the purpose of avoiding any tax penalties and (ii) may have been written in connection with the "promotion or marketing" of any transaction contemplated hereby ("Transaction").
Accordingly, you should seek advice based on your particular circumstances from an independent tax advisor.
In any instance where distribution of this communication is subject to the rules of the US Commodity Futures Trading Commission ("CFTC"), this communication constitutes an invitation to consider entering
into a derivatives transaction under U.S. CFTC Regulations §§ 1.71 and 23.605, where applicable, but is not a binding offer to buy/sell any financial instrument.
Any terms set forth herein are intended for discussion purposes only and are subject to the final terms as set forth in separate definitive written agreements. This presentation is not a commitment to lend, syndicate a
financing, underwrite or purchase securities, or commit capital nor does it obligate us to enter into such a commitment, nor are we acting as a fiduciary to you. By accepting this presentation, subject to applicable law or
regulation, you agree to keep confidential the information contained herein and the existence of and proposed terms for any Transaction.
Prior to entering into any Transaction, you should determine, without reliance upon us or our affiliates, the economic risks and merits (and independently determine that you are able to assume these risks) as well as the legal,
tax and accounting characterizations and consequences of any such Transaction. In this regard, by accepting this presentation, you acknowledge that (a) we are not in the business of providing (and you are not relying on us
for) legal, tax or accounting advice, (b) there may be legal, tax or accounting risks associated with any Transaction, (c) you should receive (and rely on) separate and qualified legal, tax and accounting advice and (d) you
should apprise senior management in your organization as to such legal, tax and accounting advice (and any risks associated with any Transaction) and our disclaimer as to these matters. By acceptance of these materials,
you and we hereby agree that from the commencement of discussions with respect to any Transaction, and notwithstanding any other provision in this presentation, we hereby confirm that no participant in any Transaction
shall be limited from disclosing the U.S. tax treatment or U.S. tax structure of such Transaction.
We are required to obtain, verify and record certain information that identifies each entity that enters into a formal business relationship with us. We will ask for your complete name, street address, and taxpayer ID number.
We may also request corporate formation documents, or other forms of identification, to verify information provided.
Any prices or levels contained herein are preliminary and indicative only and do not represent bids or offers. These indications are provided solely for your information and consideration, are subject to change at any time
without notice and are not intended as a solicitation with respect to the purchase or sale of any instrument. The information contained in this presentation may include results of analyses from a quantitative model which
represent potential future events that may or may not be realized, and is not a complete analysis of every material fact representing any product. Any estimates included herein constitute our judgment as of the date hereof
and are subject to change without any notice. We and/or our affiliates may make a market in these instruments for our customers and for our own account. Accordingly, we may have a position in any such instrument at any
time.
Although this material may contain publicly available information about Citi corporate bond research, fixed income strategy or economic and market analysis, Citi policy (i) prohibits employees from offering, directly or
indirectly, a favorable or negative research opinion or offering to change an opinion as consideration or inducement for the receipt of business or for compensation; and (ii) prohibits analysts from being compensated for
specific recommendations or views contained in research reports. So as to reduce the potential for conflicts of interest, as well as to reduce any appearance of conflicts of interest, Citi has enacted policies and procedures
designed to limit communications between its investment banking and research personnel to specifically prescribed circumstances.
© 2015 Citigroup Global Markets Inc. Member SIPC. All rights reserved. Citi and Citi and Arc Design are trademarks and service marks of Citigroup Inc. or its affiliates and are used and registered throughout the world.
.
Citi believes that sustainability is good business practice. We work closely with our clients, peer financial institutions, NGOs and other partners to finance solutions to climate change, develop industry standards, reduce our
own environmental footprint, and engage with stakeholders to advance shared learning and solutions. Highlights of Citi's unique role in promoting sustainability include: (a) releasing in 2007 a Climate Change Position
Statement, the first US financial institution to do so; (b) targeting $50 billion over 10 years to address global climate change: includes significant increases in investment and financing of renewable energy, clean technology,
and other carbon-emission reduction activities; (c) committing to an absolute reduction in GHG emissions of all Citi owned and leased properties around the world by 10% by 2011; (d) purchasing more than 234,000 MWh of
carbon neutral power for our operations over the last three years; (e) establishing in 2008 the Carbon Principles; a framework for banks and their U.S. power clients to evaluate and address carbon risks in the financing of
electric power projects; (f) producing equity research related to climate issues that helps to inform investors on risks and opportunities associated with the issue; and (g) engaging with a broad range of stakeholders on the
issue of climate change to help advance understanding and solutions.
Citi works with its clients in greenhouse gas intensive industries to evaluate emerging risks from climate change and, where appropriate, to mitigate those risks.
efficiency, renewable energy and mitigation