Embed Size (px)
Citation preview
3rd quarter 2017
High-level report
CFO Signals™
What North America’s top finance executives are thinking—and doing
This report is a subset of a full report containing analysis and trends specific to industries and geographies. Please contact [email protected] for access to the full report.
Deloitte CFO Signals™2
ContentsFindings at a glance 3Summary and context 4Topical findings 5Longitudinal data and survey background 18
Additional findings in full report (please contact [email protected])
• Detailed findings (by industry)• Industry-by-industry trends• Country-by-country trends
About the survey
AuthorsGreg DickinsonManaging Director, CFO SignalsDeloitte LLP
Lori CalabroEditor, Global CFO SignalsDeloitte LLP
ContactsSanford A. Cockrell IIINational Managing Partner, US CFO Program Deloitte LLP Global Leader, CFO ProgramDeloitte Touche Tohmatsu Limited
Contents and background
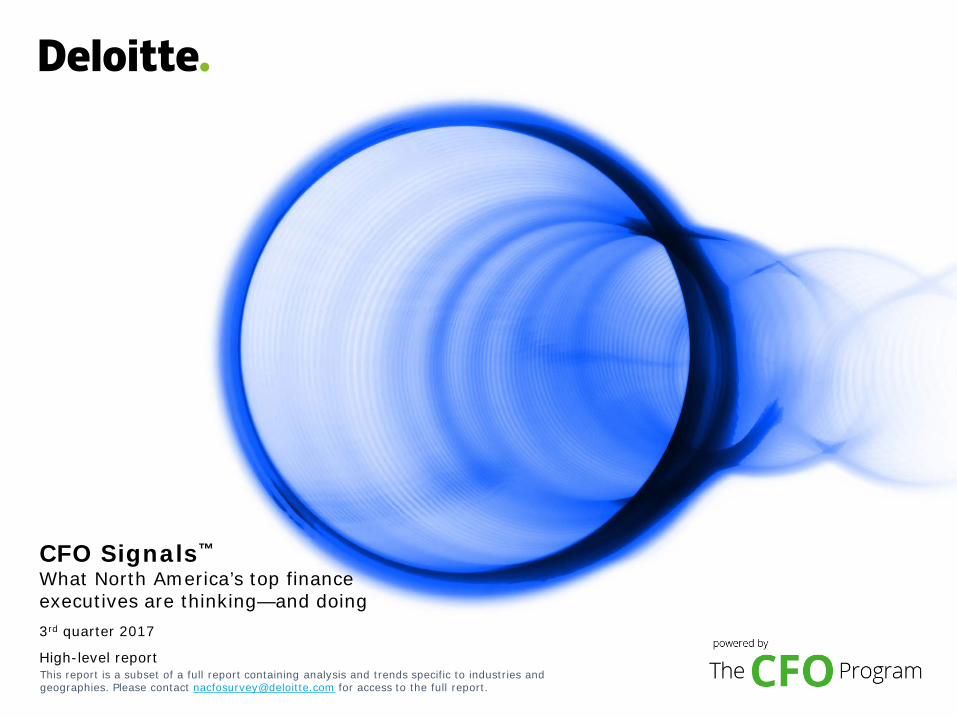
Survey responsesSurvey period: 8/7-8/18Total responses: 160• CFO proportion: 100%• Revenue >$1B: 82%• Public/private: 73%/27%
About the CFO Signals surveyEach quarter (since 2Q10), CFO Signals has tracked the thinking and actions of CFOs representing many of North America’s largest and most influential companies.
All respondents are CFOs from the US, Canada, and Mexico, and the vast majority are from companies with more than $1 billion in annual revenue. For a summary of this quarter’s response demographics, please see the sidebars and charts on this page. For other information about participation and methodology, please contact [email protected].
Participation by country*37
17
11
21
36
7 9
18
4
* Sample sizes for some charts may not sum to the total because some respondents did not answer all demographic questions.
Participation by industry*
US81%
Canada8%
Mexico11%
Deloitte CFO Signals™3
PerceptionsHow do you regard the current/future status of the North American, Chinese, and European economies? Perceptions of North America declined, with 64% of CFOs rating current conditions as good (still high), and 45% expecting better conditions in a year (down from 58% last quarter). Perceptions of Europe rose to 29% and 32%; China was flat at 32% and 30%. Page 6.
What is your perception of the capital markets? Eighty-three percent of CFOs say debt financing is attractive (down slightly from 85%). Attractiveness of equity financing rose for public company CFOs (from 42% to 48%) and decreased for private company CFOs (from 46% to 35%). Eighty-three percent of CFOs now say US equities are overvalued—a new survey high. Page 7.
SentimentOverall, what risks worry you the most? CFOs voice growing concerns about US political turmoil and geopolitical conflict; talent challenges again top CFOs’ internal worries, and technological change is a rising concern. Page 8.Compared to three months ago, how do you feel about the financial prospects for your company? The net optimism index declined from last quarter’s +44 to +29 this quarter. About 45% of CFOs express rising optimism (down from 55%), and 16% express declining optimism (up from 11%). Page 9.
ExpectationsWhat is your company’s business focus for the next year? CFOs indicate a strong bias toward revenue growth over cost reduction (60% vs. 20%) and investing cash over returning it (56% vs. 14%). They shifted back to a bias toward new offerings over existing ones (42% vs. 34%), and indicated a bias toward current geographies over new ones (62% vs. 19%). Page 10.Compared to the past 12 months, how do you expect your key operating metrics to change over the next 12 months? Revenue growth expectations remain above the two-year average at 5.7% (up from 5.6% last quarter). Earnings growth slid from 8.7% to 7.9%, but remains above the two-year average. Capital spending growth fell from 9.0% to 7.3%, while domestic hiring growth rose from 2.1% to 2.6%. US CFOs trailed in almost all metrics. Page 11.
Special topic: Finance’s use of emerging technologiesHow would you characterize your company’s progress in applying emerging technologies to your finance function? Relatively few CFOs say they are beyond the piloting stage for emerging technologies (e.g., cloud computing, robotic process automation, visualization, cognitive/AI, in-memory, and blockchain) or that they have already achieved the possible benefits, but some appear considerably further down the road than others. Page 12.
Findings at a glance
How have you used emerging technologies to improve finance’s efficiency, analytical support, and controls? Use of new technologies appears to be in its early stages. A minority of CFOs says solutions are mature enough to provide major benefits, but some cite aggressive use and notable improvements. Page 13.
Is there anything you have done with emerging technologies that has been particularly successful? Process automation via RPA and cloud-based services is relatively popular among those who cite substantial implementations; analytics enhancements are also relatively common. Page 14.
Special topic: Finance governance and succession
What type of offer would make you most likely to change your role or company? About 75% of CFOs say an expanded CFO role or CEO role would be among the opportunities most likely to make them consider a change. Page 15.How many people report directly to you? And how many are CFO-ready? The average number of CFOs’ direct reports is seven (six men and one woman), and half of CFOs say at least one direct report will be CFO-ready within a year. Page 16.
What are your aspirations regarding a CEO role? About 60% of CFOs express interest in becoming a CEO, but there is high variability in their perceptions of how likely it is to happen and about which path they would choose. Page 17.
3Q17 Survey Highlights*
• Perceptions of Europe’s and China’s economies show growing optimism; perceptions of North America show growing concern.
• Own-company optimism slid, largely on pessimism in the US.• Expectations for growth in earnings and capital spending fell, but
revenue growth held steady and domestic hiring surged.• A survey-high 83% of CFOs say US equities are overvalued.• Use of emerging technologies to improve finance efficiency,
analytical support, and controls appears to be in its early stages.• Robotic process automation (RPA) and analytics solutions are
popular among those citing significant use of new technologies. • A majority of CFOs indicate interest in a CEO role, but there is
variability in the perceived likelihood and preferred pathways.• CFOs’ mean number of direct reports is seven (six men and one
woman); half say at least one will be CFO-ready within a year.
* All responses were collected before Hurricane Harvey made landfall in the US.
Deloitte CFO Signals™4
Summary and contextGeopolitical threats and political turmoil dampen sentiment
Summary of CFO sentiment and expectations
Well below two-year average Well above two-year averageWell above last quarterWell below last quarter
Economy optimism—North America (Index)
Economy optimism—Europe(Index)
Economy optimism—China(Index)
Revenue growth (YOY)
Earnings growth (YOY)
Capital investment growth (YOY)
Domestic personnel growth (YOY)
Own-company optimism (Net)
68.8
42.1
41.4
5.7%
7.9%
7.3%
2.6%
+29.4
77.3
36.4
43.5
5.6%
8.7%
9.0%
2.1%
+43.9
This quarter
Lastquarter
2 yr.avg.
62.2
22.7
26.0
4.6%
7.3%
6.0%
1.7%
+26.1
83% 78% 66%Percent of CFOs sayingUS equity markets overvalued
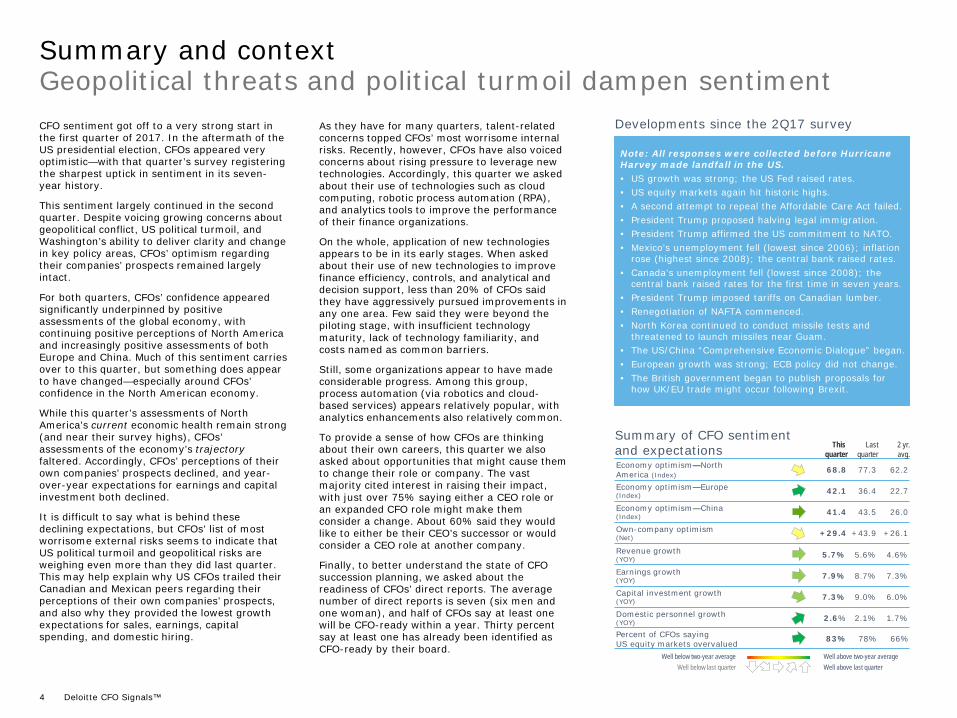
Developments since the 2Q17 surveyAs they have for many quarters, talent-related concerns topped CFOs’ most worrisome internal risks. Recently, however, CFOs have also voiced concerns about rising pressure to leverage new technologies. Accordingly, this quarter we asked about their use of technologies such as cloud computing, robotic process automation (RPA), and analytics tools to improve the performance of their finance organizations.
On the whole, application of new technologies appears to be in its early stages. When asked about their use of new technologies to improve finance efficiency, controls, and analytical and decision support, less than 20% of CFOs said they have aggressively pursued improvements in any one area. Few said they were beyond the piloting stage, with insufficient technology maturity, lack of technology familiarity, and costs named as common barriers.
Still, some organizations appear to have made considerable progress. Among this group, process automation (via robotics and cloud-based services) appears relatively popular, with analytics enhancements also relatively common.
To provide a sense of how CFOs are thinking about their own careers, this quarter we also asked about opportunities that might cause them to change their role or company. The vast majority cited interest in raising their impact, with just over 75% saying either a CEO role or an expanded CFO role might make them consider a change. About 60% said they would like to either be their CEO’s successor or would consider a CEO role at another company.
Finally, to better understand the state of CFO succession planning, we asked about the readiness of CFOs’ direct reports. The average number of direct reports is seven (six men and one woman), and half of CFOs say at least one will be CFO-ready within a year. Thirty percent say at least one has already been identified as CFO-ready by their board.
CFO sentiment got off to a very strong start in the first quarter of 2017. In the aftermath of the US presidential election, CFOs appeared very optimistic—with that quarter’s survey registering the sharpest uptick in sentiment in its seven-year history.
This sentiment largely continued in the second quarter. Despite voicing growing concerns about geopolitical conflict, US political turmoil, and Washington’s ability to deliver clarity and change in key policy areas, CFOs’ optimism regarding their companies’ prospects remained largely intact.
For both quarters, CFOs’ confidence appeared significantly underpinned by positive assessments of the global economy, with continuing positive perceptions of North America and increasingly positive assessments of both Europe and China. Much of this sentiment carries over to this quarter, but something does appear to have changed—especially around CFOs’ confidence in the North American economy.
While this quarter’s assessments of North America’s current economic health remain strong (and near their survey highs), CFOs’ assessments of the economy’s trajectoryfaltered. Accordingly, CFOs’ perceptions of their own companies’ prospects declined, and year-over-year expectations for earnings and capital investment both declined.
It is difficult to say what is behind these declining expectations, but CFOs’ list of most worrisome external risks seems to indicate that US political turmoil and geopolitical risks are weighing even more than they did last quarter. This may help explain why US CFOs trailed their Canadian and Mexican peers regarding their perceptions of their own companies’ prospects, and also why they provided the lowest growth expectations for sales, earnings, capital spending, and domestic hiring.
Note: All responses were collected before Hurricane Harvey made landfall in the US.• US growth was strong; the US Fed raised rates.• US equity markets again hit historic highs.• A second attempt to repeal the Affordable Care Act failed. • President Trump proposed halving legal immigration.• President Trump affirmed the US commitment to NATO. • Mexico’s unemployment fell (lowest since 2006); inflation
rose (highest since 2008); the central bank raised rates.• Canada’s unemployment fell (lowest since 2008); the
central bank raised rates for the first time in seven years.• President Trump imposed tariffs on Canadian lumber.• Renegotiation of NAFTA commenced. • North Korea continued to conduct missile tests and
threatened to launch missiles near Guam.• The US/China “Comprehensive Economic Dialogue” began.• European growth was strong; ECB policy did not change.• The British government began to publish proposals for
how UK/EU trade might occur following Brexit.
Topical findings
Deloitte CFO Signals™6
Assessments of regional economiesPerceptions
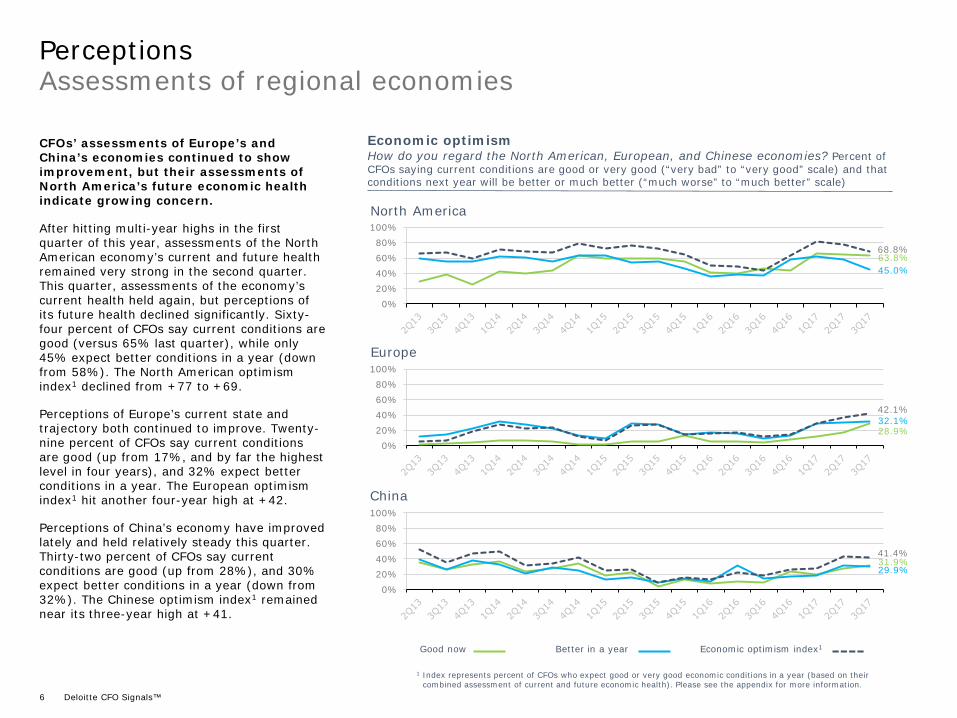
CFOs’ assessments of Europe’s and China’s economies continued to show improvement, but their assessments of North America’s future economic health indicate growing concern.
After hitting multi-year highs in the first quarter of this year, assessments of the North American economy’s current and future health remained very strong in the second quarter. This quarter, assessments of the economy’s current health held again, but perceptions of its future health declined significantly. Sixty-four percent of CFOs say current conditions are good (versus 65% last quarter), while only 45% expect better conditions in a year (down from 58%). The North American optimism index1 declined from +77 to +69.
Perceptions of Europe’s current state and trajectory both continued to improve. Twenty-nine percent of CFOs say current conditions are good (up from 17%, and by far the highest level in four years), and 32% expect better conditions in a year. The European optimism index1 hit another four-year high at +42.
Perceptions of China’s economy have improved lately and held relatively steady this quarter. Thirty-two percent of CFOs say current conditions are good (up from 28%), and 30% expect better conditions in a year (down from 32%). The Chinese optimism index1 remained near its three-year high at +41.
Economic optimismHow do you regard the North American, European, and Chinese economies? Percent of CFOs saying current conditions are good or very good (“very bad” to “very good” scale) and that conditions next year will be better or much better (“much worse” to “much better” scale)
North America
Europe
China
0%20%40%60%80%
100%
0%20%40%60%80%
100%
0%20%40%60%80%
100%
Good now Better in a year Economic optimism index1
1 Index represents percent of CFOs who expect good or very good economic conditions in a year (based on their combined assessment of current and future economic health). Please see the appendix for more information.
63.8%68.8%
45.0%
28.9%
42.1%32.1%
31.9%41.4%
29.9%
Deloitte CFO Signals™7
1500
1700
1900
2100
2300
2500
0%
20%
40%
60%
80%
100%
Overvalued
Undervalued
0%
20%
40%
60%
80%
100%Debt attractive
Equity attractive
Neutral
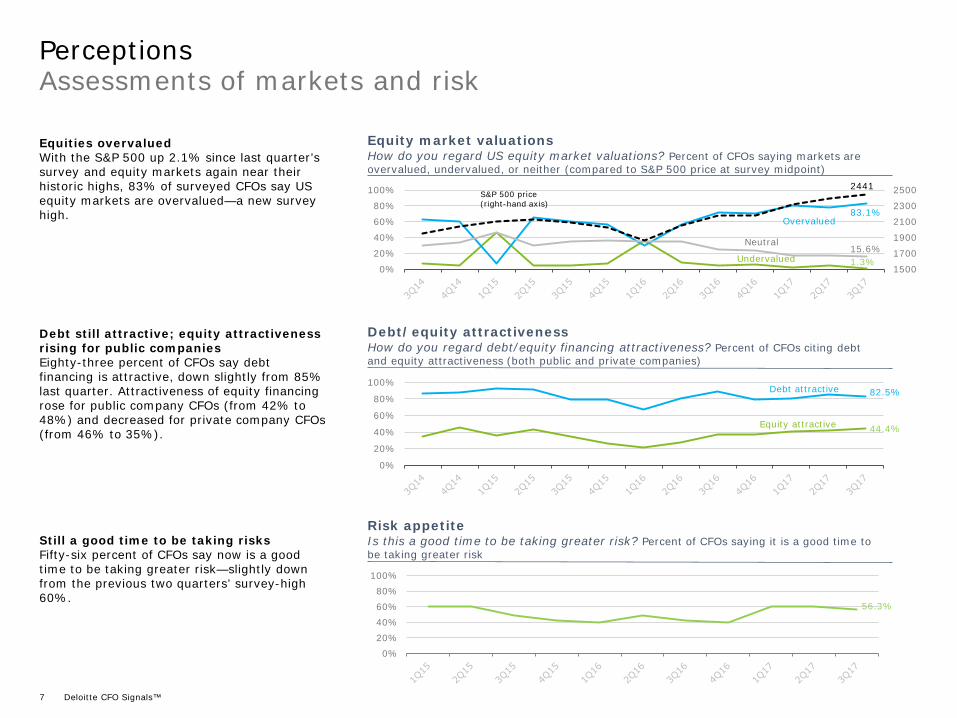
Equity market valuationsHow do you regard US equity market valuations? Percent of CFOs saying markets are overvalued, undervalued, or neither (compared to S&P 500 price at survey midpoint)
Debt/equity attractivenessHow do you regard debt/equity financing attractiveness? Percent of CFOs citing debt and equity attractiveness (both public and private companies)
0%20%40%60%80%
100%
Risk appetiteIs this a good time to be taking greater risk? Percent of CFOs saying it is a good time to be taking greater risk
Assessments of markets and riskPerceptions
Equities overvaluedWith the S&P 500 up 2.1% since last quarter’s survey and equity markets again near their historic highs, 83% of surveyed CFOs say US equity markets are overvalued—a new survey high.
Debt still attractive; equity attractiveness rising for public companiesEighty-three percent of CFOs say debt financing is attractive, down slightly from 85% last quarter. Attractiveness of equity financing rose for public company CFOs (from 42% to 48%) and decreased for private company CFOs (from 46% to 35%).
Still a good time to be taking risksFifty-six percent of CFOs say now is a good time to be taking greater risk—slightly down from the previous two quarters’ survey-high 60%.
S&P 500 price(right-hand axis)
1.3%
2441
83.1%
15.6%
44.4%
82.5%
56.3%
Deloitte CFO Signals™8
Most worrisome risks
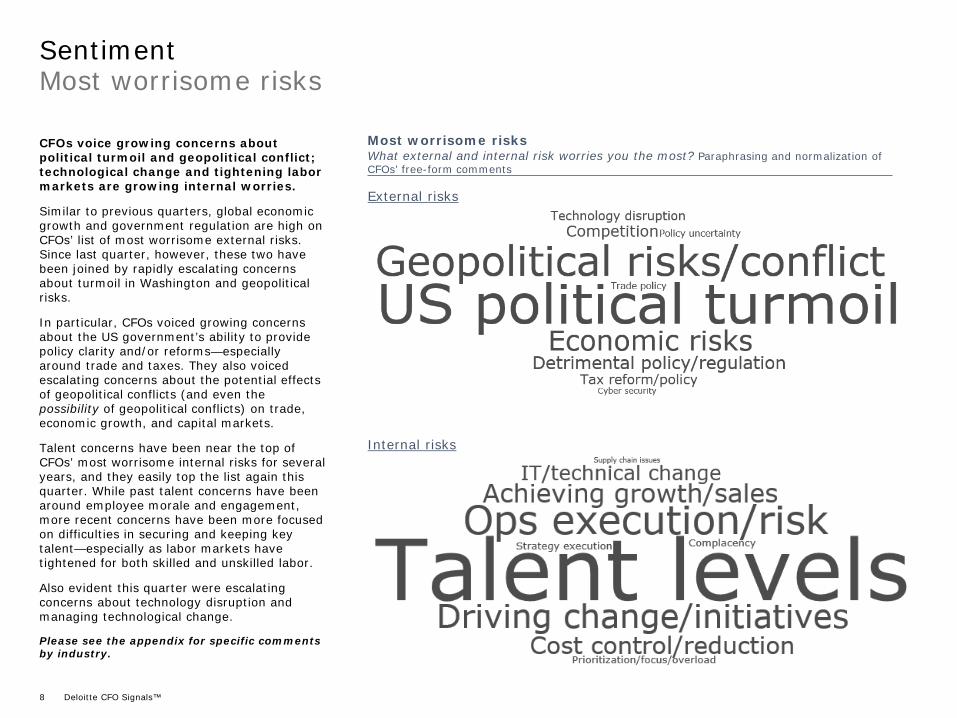
CFOs voice growing concerns about political turmoil and geopolitical conflict; technological change and tightening labor markets are growing internal worries.
Similar to previous quarters, global economic growth and government regulation are high on CFOs’ list of most worrisome external risks. Since last quarter, however, these two have been joined by rapidly escalating concerns about turmoil in Washington and geopolitical risks.
In particular, CFOs voiced growing concerns about the US government’s ability to provide policy clarity and/or reforms—especially around trade and taxes. They also voiced escalating concerns about the potential effects of geopolitical conflicts (and even the possibility of geopolitical conflicts) on trade, economic growth, and capital markets.
Talent concerns have been near the top of CFOs’ most worrisome internal risks for several years, and they easily top the list again this quarter. While past talent concerns have been around employee morale and engagement, more recent concerns have been more focused on difficulties in securing and keeping key talent—especially as labor markets have tightened for both skilled and unskilled labor.
Also evident this quarter were escalating concerns about technology disruption and managing technological change.
Please see the appendix for specific comments by industry.
Sentiment
External risks
Internal risks
Most worrisome risksWhat external and internal risk worries you the most? Paraphrasing and normalization of CFOs’ free-form comments
Deloitte CFO Signals™9
Optimism regarding own-companies’ prospectsSentiment
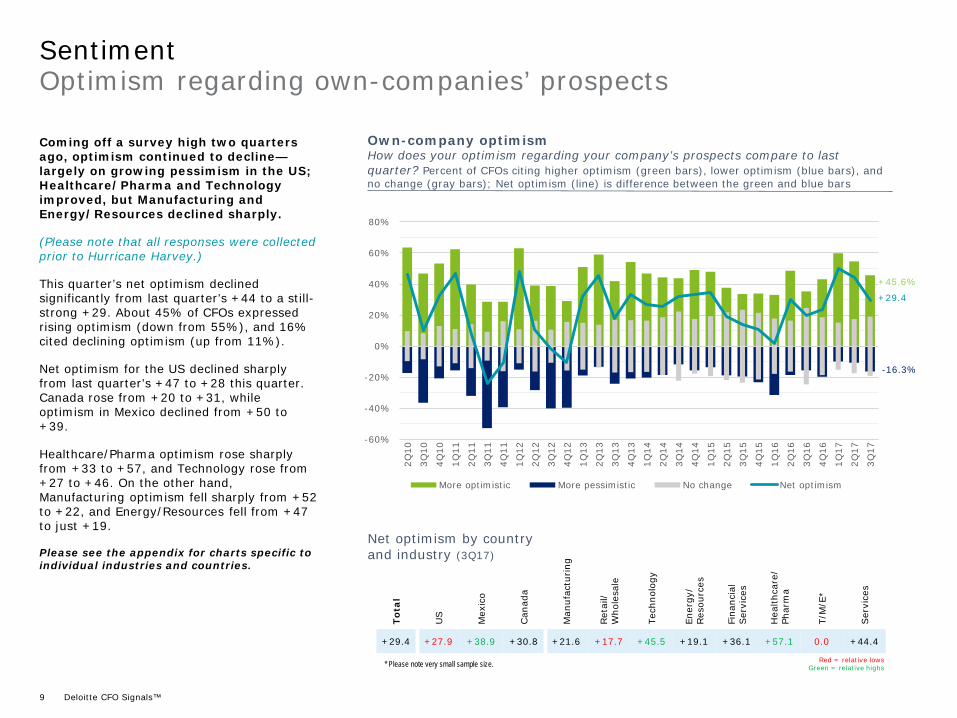
Own-company optimismHow does your optimism regarding your company’s prospects compare to last quarter? Percent of CFOs citing higher optimism (green bars), lower optimism (blue bars), and no change (gray bars); Net optimism (line) is difference between the green and blue bars
Coming off a survey high two quarters ago, optimism continued to decline—largely on growing pessimism in the US; Healthcare/Pharma and Technology improved, but Manufacturing and Energy/Resources declined sharply.
(Please note that all responses were collected prior to Hurricane Harvey.)
This quarter’s net optimism declined significantly from last quarter’s +44 to a still-strong +29. About 45% of CFOs expressed rising optimism (down from 55%), and 16% cited declining optimism (up from 11%).
Net optimism for the US declined sharply from last quarter’s +47 to +28 this quarter. Canada rose from +20 to +31, while optimism in Mexico declined from +50 to +39.
Healthcare/Pharma optimism rose sharply from +33 to +57, and Technology rose from +27 to +46. On the other hand, Manufacturing optimism fell sharply from +52 to +22, and Energy/Resources fell from +47 to just +19.
Please see the appendix for charts specific to individual industries and countries.
-60%
-40%
-20%
0%
20%
40%
60%
80%
2Q10
3Q10
4Q10
1Q11
2Q11
3Q11
4Q11
1Q12
2Q12
3Q12
4Q12
1Q13
2Q13
3Q13
4Q13
1Q14
2Q14
3Q14
4Q14
1Q15
2Q15
3Q15
4Q15
1Q16
2Q16
3Q16
4Q16
1Q17
2Q17
3Q17
More optimistic More pessimistic No change Net optimism
+45.6%
-16.3%
+29.4
To
tal
US
Mex
ico
Can
ada
Man
ufac
turing
Ret
ail/
W
hole
sale
Tech
nolo
gy
Ener
gy/
Res
ourc
es
Fina
ncia
l Ser
vice
s
Hea
lthca
re/
Phar
ma
T/M
/E*
Ser
vice
s
+29.4 +27.9 +38.9 +30.8 +21.6 +17.7 +45.5 +19.1 +36.1 +57.1 0.0 +44.4
Net optimism by countryand industry (3Q17)
* Please note very small sample size. Red = relative lowsGreen = relative highs
Deloitte CFO Signals™10
Business focus for next yearExpectations
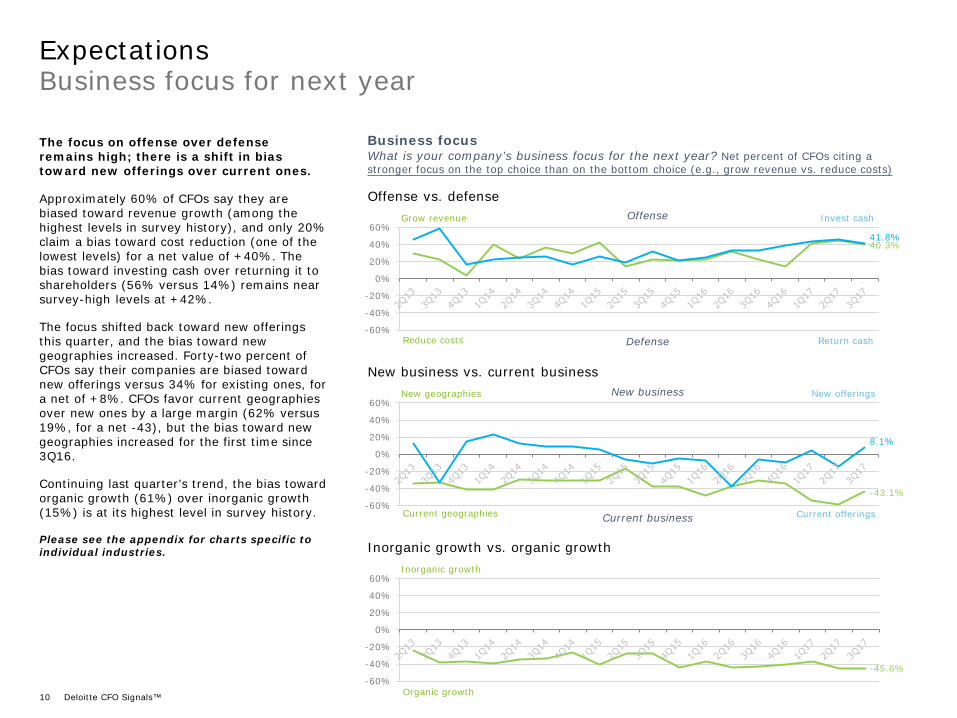
Business focusWhat is your company’s business focus for the next year? Net percent of CFOs citing a stronger focus on the top choice than on the bottom choice (e.g., grow revenue vs. reduce costs)
-60%
-40%
-20%
0%
20%
40%
60%
The focus on offense over defense remains high; there is a shift in bias toward new offerings over current ones.
Approximately 60% of CFOs say they are biased toward revenue growth (among the highest levels in survey history), and only 20% claim a bias toward cost reduction (one of the lowest levels) for a net value of +40%. The bias toward investing cash over returning it to shareholders (56% versus 14%) remains near survey-high levels at +42%.
The focus shifted back toward new offerings this quarter, and the bias toward new geographies increased. Forty-two percent of CFOs say their companies are biased toward new offerings versus 34% for existing ones, for a net of +8%. CFOs favor current geographies over new ones by a large margin (62% versus 19%, for a net -43), but the bias toward new geographies increased for the first time since 3Q16.
Continuing last quarter’s trend, the bias toward organic growth (61%) over inorganic growth (15%) is at its highest level in survey history.
Please see the appendix for charts specific to individual industries.
Grow revenue Invest cash
Reduce costs Return cash
Offense vs. defense
-60%
-40%
-20%
0%
20%
40%
60%New geographies
Current geographies
New business vs. current businessNew offerings
Current offerings
-60%
-40%
-20%
0%
20%
40%
60%Inorganic growth
Organic growth
Inorganic growth vs. organic growth
New business
Current business
Offense
Defense
40.3%41.8%
-43.1%
8.1%
-45.6%
Deloitte CFO Signals™11
To
tal
US
Mex
ico
Can
ada
Man
ufac
turing
Ret
ail/
W
hole
sale
Tech
nolo
gy
Ener
gy/
Res
ourc
es
Fina
ncia
l Ser
vice
s
Hea
lthca
re/
Phar
ma
T/M
/E
Ser
vice
s
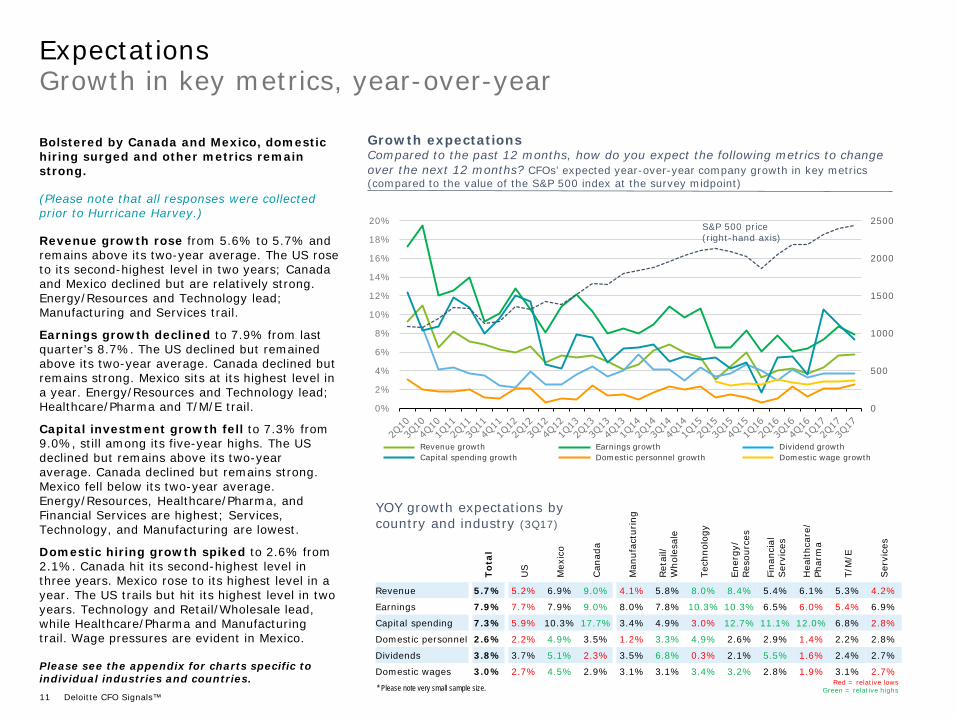
Revenue 5.7% 5.2% 6.9% 9.0% 4.1% 5.8% 8.0% 8.4% 5.4% 6.1% 5.3% 4.2%
Earnings 7.9% 7.7% 7.9% 9.0% 8.0% 7.8% 10.3% 10.3% 6.5% 6.0% 5.4% 6.9%
Capital spending 7.3% 5.9% 10.3% 17.7% 3.4% 4.9% 3.0% 12.7% 11.1% 12.0% 6.8% 2.8%
Domestic personnel 2.6% 2.2% 4.9% 3.5% 1.2% 3.3% 4.9% 2.6% 2.9% 1.4% 2.2% 2.8%
Dividends 3.8% 3.7% 5.1% 2.3% 3.5% 6.8% 0.3% 2.1% 5.5% 1.6% 2.4% 2.7%
Domestic wages 3.0% 2.7% 4.5% 2.9% 3.1% 3.1% 3.4% 3.2% 2.8% 1.9% 3.1% 2.7%
Growth in key metrics, year-over-year Expectations
Bolstered by Canada and Mexico, domestic hiring surged and other metrics remain strong.
(Please note that all responses were collected prior to Hurricane Harvey.)
Revenue growth rose from 5.6% to 5.7% and remains above its two-year average. The US rose to its second-highest level in two years; Canada and Mexico declined but are relatively strong. Energy/Resources and Technology lead; Manufacturing and Services trail.
Earnings growth declined to 7.9% from last quarter’s 8.7%. The US declined but remained above its two-year average. Canada declined but remains strong. Mexico sits at its highest level in a year. Energy/Resources and Technology lead; Healthcare/Pharma and T/M/E trail.
Capital investment growth fell to 7.3% from 9.0%, still among its five-year highs. The US declined but remains above its two-year average. Canada declined but remains strong. Mexico fell below its two-year average. Energy/Resources, Healthcare/Pharma, and Financial Services are highest; Services, Technology, and Manufacturing are lowest.
Domestic hiring growth spiked to 2.6% from 2.1%. Canada hit its second-highest level in three years. Mexico rose to its highest level in a year. The US trails but hit its highest level in two years. Technology and Retail/Wholesale lead, while Healthcare/Pharma and Manufacturing trail. Wage pressures are evident in Mexico.
Please see the appendix for charts specific to individual industries and countries.
0
500
1000
1500
2000
2500
0%
2%
4%
6%
8%
10%
12%
14%
16%
18%
20%
Growth expectationsCompared to the past 12 months, how do you expect the following metrics to change over the next 12 months? CFOs’ expected year-over-year company growth in key metrics (compared to the value of the S&P 500 index at the survey midpoint)
S&P 500 price (right-hand axis)
Revenue growth Earnings growth Dividend growthCapital spending growth Domestic personnel growth Domestic wage growth
Red = relative lowsGreen = relative highs
YOY growth expectations by country and industry (3Q17)
* Please note very small sample size.
Deloitte CFO Signals™12
Progress and barriersSpecial topic: Finance’s use of emerging technologies
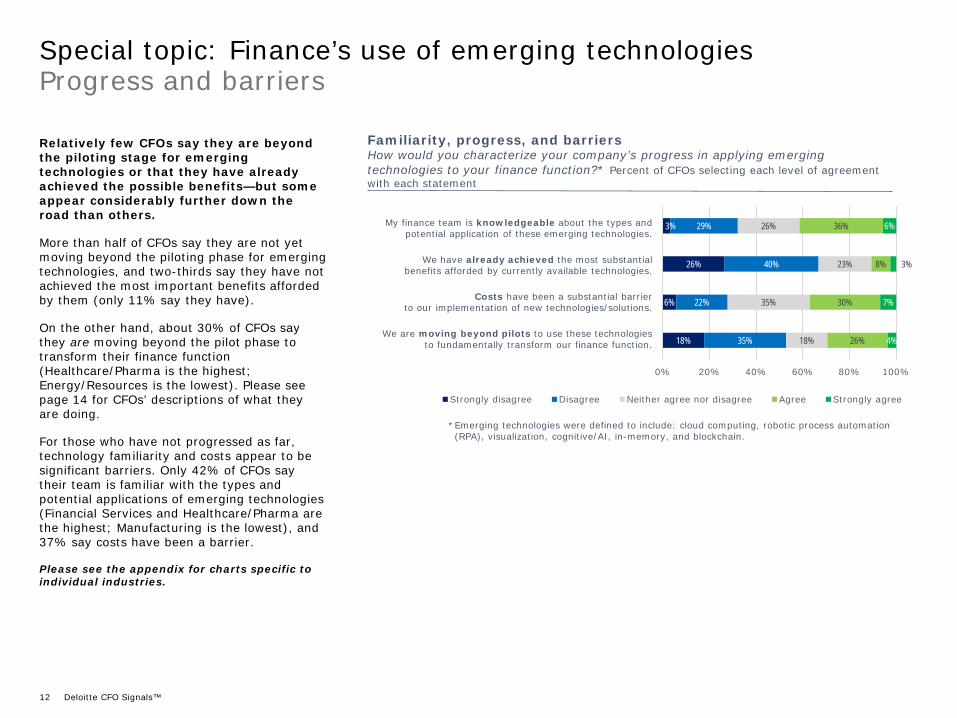
Relatively few CFOs say they are beyond the piloting stage for emerging technologies or that they have already achieved the possible benefits—but some appear considerably further down the road than others.
More than half of CFOs say they are not yet moving beyond the piloting phase for emerging technologies, and two-thirds say they have not achieved the most important benefits afforded by them (only 11% say they have).
On the other hand, about 30% of CFOs say they are moving beyond the pilot phase to transform their finance function (Healthcare/Pharma is the highest; Energy/Resources is the lowest). Please see page 14 for CFOs’ descriptions of what they are doing.
For those who have not progressed as far, technology familiarity and costs appear to be significant barriers. Only 42% of CFOs say their team is familiar with the types and potential applications of emerging technologies (Financial Services and Healthcare/Pharma are the highest; Manufacturing is the lowest), and 37% say costs have been a barrier.
Please see the appendix for charts specific to individual industries.
3%
26%
6%
18%
29%
40%
22%
35%
26%
23%
35%
18%
36%
8%
30%
26%
6%
3%
7%
4%
0% 20% 40% 60% 80% 100%
Strongly disagree Disagree Neither agree nor disagree Agree Strongly agree
Familiarity, progress, and barriersHow would you characterize your company’s progress in applying emerging technologies to your finance function?* Percent of CFOs selecting each level of agreement with each statement
My finance team is knowledgeable about the types and potential application of these emerging technologies.
We have already achieved the most substantialbenefits afforded by currently available technologies.
Costs have been a substantial barrier to our implementation of new technologies/solutions.
We are moving beyond pilots to use these technologies to fundamentally transform our finance function.
*Emerging technologies were defined to include: cloud computing, robotic process automation (RPA), visualization, cognitive/AI, in-memory, and blockchain.
Deloitte CFO Signals™13
Assessment and applicationSpecial topic: Finance’s use of emerging technologies
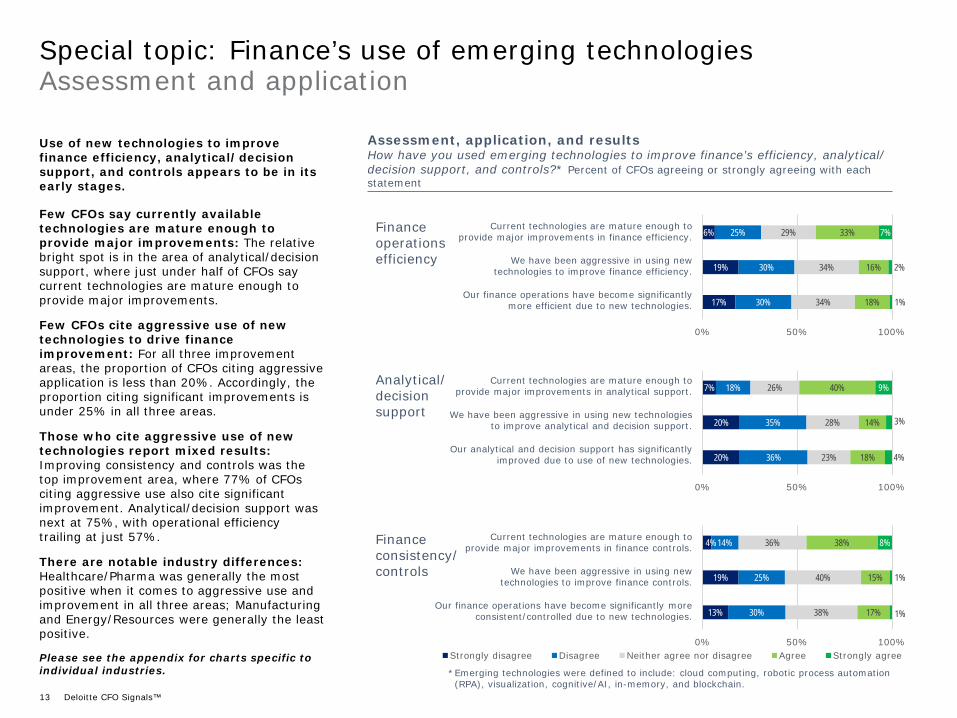
Use of new technologies to improve finance efficiency, analytical/decision support, and controls appears to be in its early stages.
Few CFOs say currently available technologies are mature enough to provide major improvements: The relative bright spot is in the area of analytical/decision support, where just under half of CFOs say current technologies are mature enough to provide major improvements.
Few CFOs cite aggressive use of new technologies to drive finance improvement: For all three improvement areas, the proportion of CFOs citing aggressive application is less than 20%. Accordingly, the proportion citing significant improvements is under 25% in all three areas.
Those who cite aggressive use of new technologies report mixed results: Improving consistency and controls was the top improvement area, where 77% of CFOs citing aggressive use also cite significant improvement. Analytical/decision support was next at 75%, with operational efficiency trailing at just 57%.
There are notable industry differences: Healthcare/Pharma was generally the most positive when it comes to aggressive use and improvement in all three areas; Manufacturing and Energy/Resources were generally the least positive.
Please see the appendix for charts specific to individual industries.
Assessment, application, and resultsHow have you used emerging technologies to improve finance’s efficiency, analytical/ decision support, and controls?* Percent of CFOs agreeing or strongly agreeing with each statement
Financeoperationsefficiency
Analytical/decisionsupport
Financeconsistency/controls
6%
19%
17%
25%
30%
30%
29%
34%
34%
33%
16%
18%
7%
2%
1%
0% 50% 100%
4%
19%
13%
14%
25%
30%
36%
40%
38%
38%
15%
17%
8%
1%
1%
0% 50% 100%Strongly disagree Disagree Neither agree nor disagree Agree Strongly agree
7%
20%
20%
18%
35%
36%
26%
28%
23%
40%
14%
18%
9%
3%
4%
0% 50% 100%
Current technologies are mature enough to provide major improvements in finance efficiency.
We have been aggressive in using new technologies to improve finance efficiency.
Our finance operations have become significantly more efficient due to new technologies.
Current technologies are mature enough to provide major improvements in analytical support.
We have been aggressive in using new technologiesto improve analytical and decision support.
Our analytical and decision support has significantly improved due to use of new technologies.
Current technologies are mature enough toprovide major improvements in finance controls.
We have been aggressive in using new technologies to improve finance controls.
Our finance operations have become significantly more consistent/controlled due to new technologies.
*Emerging technologies were defined to include: cloud computing, robotic process automation (RPA), visualization, cognitive/AI, in-memory, and blockchain.

Deloitte CFO Signals™14
Successful and unsuccessful applicationsSpecial topic: Finance’s use of emerging technologies
Process automation via robotics and cloud-based services is relatively popular among those who cite substantial implementation of emerging technologies; analytics enhancements are also relatively common.
CFOs mention the application of robotic process automation (RPA) in the areas of reconciliation, close management, accounts payable/receivable management, expense management, forecasting, and budgeting. Several specifically mention deployment via cloud-based solutions.
Application of data warehousing and analytical tools was also mentioned, with CFOs citing implementation of real-time dashboards, business intelligence (BI) tools, and data visualization tools. Several specifically mention the implementation of these capabilities on top of current/legacy ERP systems.
Please see the appendix for industry breakdowns.
Successful/unsuccessful applicationsIs there anything you have done with emerging finance technologies/solutions that has been particularly successful (or unsuccessful)? Paraphrasing and normalization of CFOs’ free-form comments
CLOUD AND ROBOTIC PROCESS AUTOMATION (RPA)
Just getting started with cloud, RPA, and AI.
Piloting RPA for routine tasks.
Implemented RPA for reconciliation.
Implemented RPA for accounting processes.
Implemented cloud-based close management.
Automated expense management and control.
Currently identifying RPA opportunities.
Automated A/P and A/R administrative functions.
Cloud enabled simplified deployment and maintenance of RPA. Other advanced technologies, such as AI and blockchain, are further into the future.
Beginning to implement robotics; we see big opportunities for efficiency. Key will be ensuring we have good controls surrounding implementations.
Recently implemented cloud-based financial and strategic corporate performance management tool, which has streamlined forecasting and budgeting.
By leveraging increased automation, we have reduced the accounting close cycle from five days to two.
Implemented electronic payments and deposits, shop floor billing and invoicing.
DATA WAREHOUSING AND ANALYTICSCreated a common data warehouse that enhances access to information and drastically improves consistency.
Implemented better operational dashboards; more real-time data.
Working on implementing a BI tool and are excited about the analytical possibilities.
Implemented BI software for data blending and advanced analytics.
We have been using visualization technologies for data analytics reporting that has been beneficial in providing information to our business partners.
ERP ENHANCEMENTSNew tools, such as cloud-based accounting software, have been useful on top of our aging ERP system.
Implemented bolt-on ERP tools for consolidation and planning, and also for reporting.
Consolidating legacy systems; implementing budgeting, forecasting, and reporting tools.
OTHER TECHNOLOGIESLeveraged new training technologies and surveys to benefit compliance/controls.
Utilized optical reader technology advancements.
Our move to optical recognition for transaction processes (A/P) has been successful.
Deloitte CFO Signals™15
Career-changing opportunitiesSpecial topic: Finance governance and succession
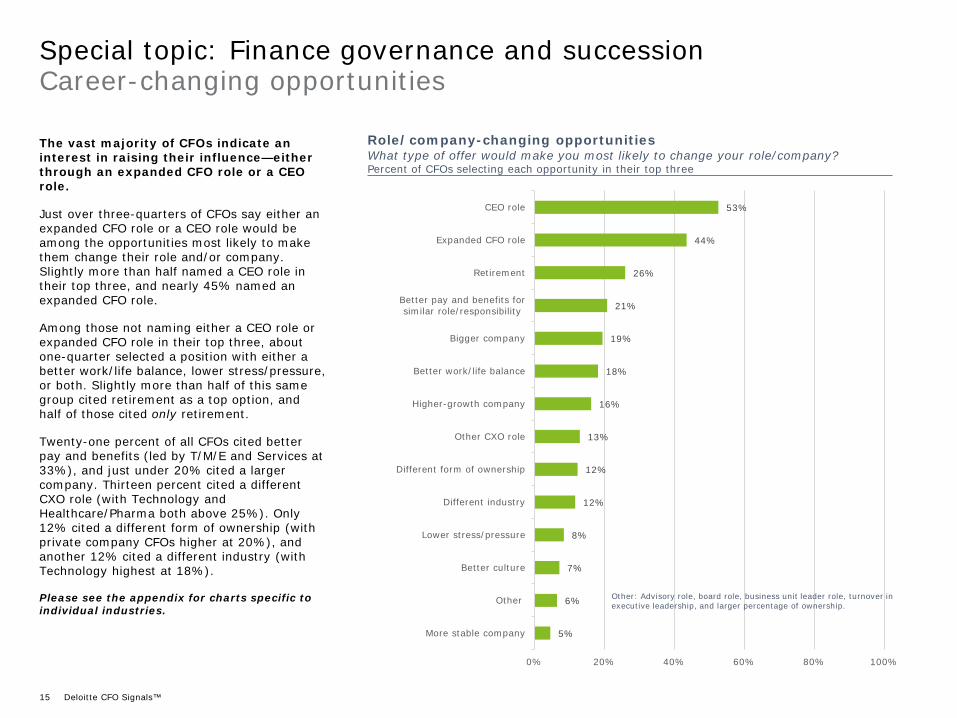
The vast majority of CFOs indicate an interest in raising their influence—either through an expanded CFO role or a CEO role.
Just over three-quarters of CFOs say either an expanded CFO role or a CEO role would be among the opportunities most likely to make them change their role and/or company. Slightly more than half named a CEO role in their top three, and nearly 45% named an expanded CFO role.
Among those not naming either a CEO role or expanded CFO role in their top three, about one-quarter selected a position with either a better work/life balance, lower stress/pressure, or both. Slightly more than half of this same group cited retirement as a top option, and half of those cited only retirement.
Twenty-one percent of all CFOs cited better pay and benefits (led by T/M/E and Services at 33%), and just under 20% cited a larger company. Thirteen percent cited a different CXO role (with Technology and Healthcare/Pharma both above 25%). Only 12% cited a different form of ownership (with private company CFOs higher at 20%), and another 12% cited a different industry (with Technology highest at 18%).
Please see the appendix for charts specific to individual industries.
Role/company-changing opportunities What type of offer would make you most likely to change your role/company?Percent of CFOs selecting each opportunity in their top three
5%
6%
7%
8%
12%
12%
13%
16%
18%
19%
21%
26%
44%
53%
More stable company
Other
Better culture
Lower stress/pressure
Different industry
Different form of ownership
Other CXO role
Higher-growth company
Better work/life balance
Bigger company
Better pay and benefits forsimilar role/responsibility
Retirement
Expanded CFO role
CEO role
0% 20% 40% 60% 80% 100%
Other: Advisory role, board role, business unit leader role, turnover in executive leadership, and larger percentage of ownership.
Deloitte CFO Signals™16
75%
22%3%
92%
8% 1%0%
20%40%60%80%
100%
0 1 2
Direct reports and their CFO-readinessSpecial topic: Finance governance and succession
Number of direct reportsPercent of CFOs reporting each number of direct reports*
1% 3% 4%9%
14% 15% 18%
10% 7% 8%3% 3% 1%0%
5%10%15%20%
1 2 3 4 5 6 7 8 9 10 11 12 13
* Stark outliers to the high side have not been included in these charts; each chart accounts for about 95% of responses.
57%36%
6%
84%
14%1%0%
20%40%60%80%
100%
0 1 2
Board recognizesas CFO-ready
CFO-readywithin 1 year
Number of direct reports (men and women)
Median = 7.00Mean = 6.75
Men Women
CFO-readiness of direct reportsPercent of CFOs naming each number of CFO-ready direct reports*
25%40%
30%
63%
34%
2%0%
20%40%60%80%
100%
0 1 2
CFO-readyin 1-3 years
0 1 2 3 4 517.1% 28.1% 26.7% 15.1% 8.9% 2.7%
0 0.7% 0.7%1 5.5% 0.7% 2.1% 0.7% 1.4% 0.7%2 7.5% 0.7% 1.4% 3.4% 1.4% 0.7%3 11.0% 2.1% 2.1% 4.1% 2.7%4 19.9% 3.4% 5.5% 5.5% 3.4% 1.4%5 19.9% 2.7% 3.4% 6.2% 3.4% 2.7% 1.4%6 15.1% 3.4% 7.5% 2.1% 0.7% 1.4%7 7.5% 0.7% 2.7% 2.1% 1.4%8 5.5% 0.7% 0.7% 2.1% 2.1%9 4.8% 1.4% 1.4% 1.4% 0.7%10 2.7% 1.4% 1.4%
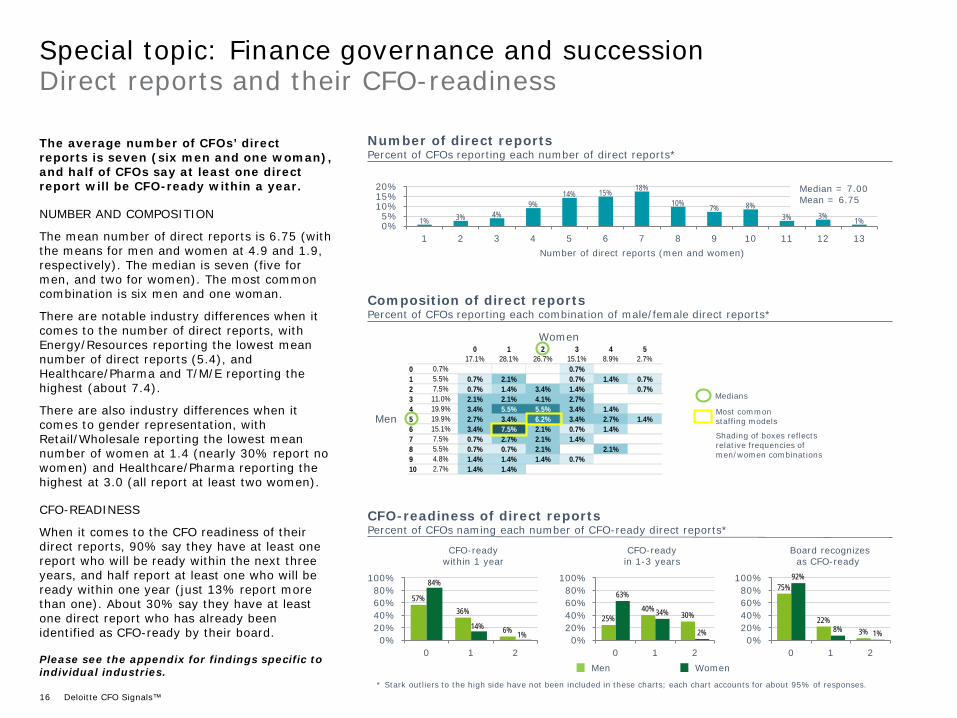
The average number of CFOs’ direct reports is seven (six men and one woman), and half of CFOs say at least one direct report will be CFO-ready within a year.
NUMBER AND COMPOSITION
The mean number of direct reports is 6.75 (with the means for men and women at 4.9 and 1.9, respectively). The median is seven (five for men, and two for women). The most common combination is six men and one woman.
There are notable industry differences when it comes to the number of direct reports, with Energy/Resources reporting the lowest mean number of direct reports (5.4), and Healthcare/Pharma and T/M/E reporting the highest (about 7.4).
There are also industry differences when it comes to gender representation, with Retail/Wholesale reporting the lowest mean number of women at 1.4 (nearly 30% report no women) and Healthcare/Pharma reporting the highest at 3.0 (all report at least two women).
CFO-READINESS
When it comes to the CFO readiness of their direct reports, 90% say they have at least one report who will be ready within the next three years, and half report at least one who will be ready within one year (just 13% report more than one). About 30% say they have at least one direct report who has already been identified as CFO-ready by their board.
Please see the appendix for findings specific to individual industries.
Composition of direct reportsPercent of CFOs reporting each combination of male/female direct reports*
Women
MenMost common staffing models
Medians
Shading of boxes reflects relative frequencies of men/women combinations
Deloitte CFO Signals™17
CEO careerSpecial topic: Finance governance and succession
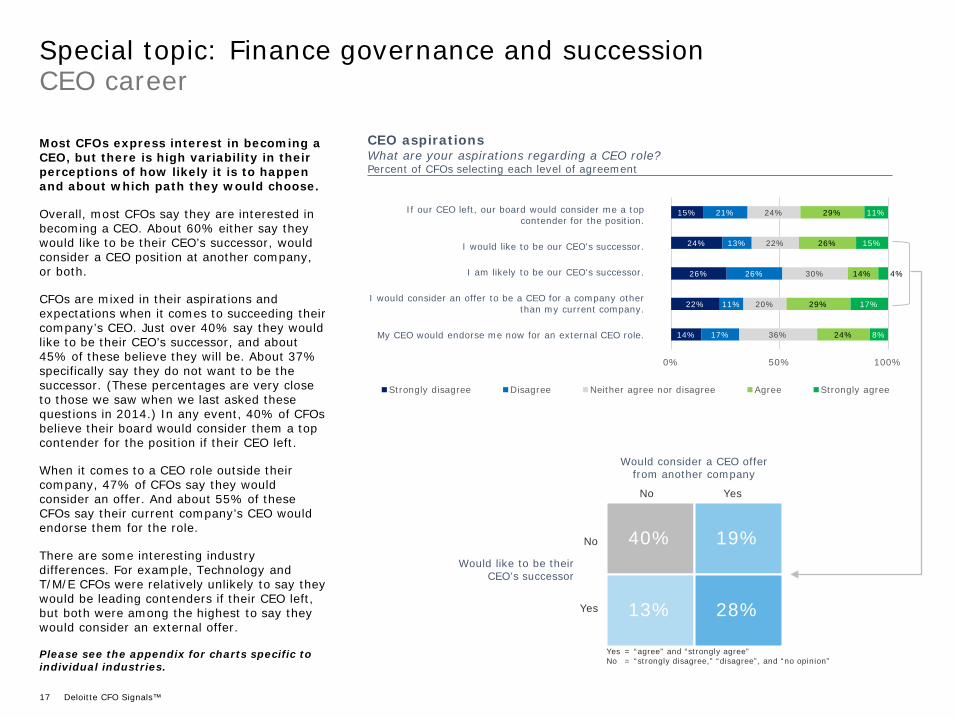
Most CFOs express interest in becoming a CEO, but there is high variability in their perceptions of how likely it is to happen and about which path they would choose.
Overall, most CFOs say they are interested in becoming a CEO. About 60% either say they would like to be their CEO’s successor, would consider a CEO position at another company, or both.
CFOs are mixed in their aspirations and expectations when it comes to succeeding their company’s CEO. Just over 40% say they would like to be their CEO’s successor, and about 45% of these believe they will be. About 37% specifically say they do not want to be the successor. (These percentages are very close to those we saw when we last asked these questions in 2014.) In any event, 40% of CFOs believe their board would consider them a top contender for the position if their CEO left.
When it comes to a CEO role outside their company, 47% of CFOs say they would consider an offer. And about 55% of these CFOs say their current company’s CEO would endorse them for the role.
There are some interesting industry differences. For example, Technology and T/M/E CFOs were relatively unlikely to say they would be leading contenders if their CEO left, but both were among the highest to say they would consider an external offer.
Please see the appendix for charts specific to individual industries.
CEO aspirationsWhat are your aspirations regarding a CEO role?Percent of CFOs selecting each level of agreement
15%
24%
26%
22%
14%
21%
13%
26%
11%
17%
24%
22%
30%
20%
36%
29%
26%
14%
29%
24%
11%
15%
4%
17%
8%
0% 50% 100%
Strongly disagree Disagree Neither agree nor disagree Agree Strongly agree
If our CEO left, our board would consider me a top contender for the position.
I would like to be our CEO's successor.
I am likely to be our CEO's successor.
I would consider an offer to be a CEO for a company other than my current company.
My CEO would endorse me now for an external CEO role.
40% 19%
13% 28%
Would like to be their CEO’s successor
No
Yes
No Yes
Would consider a CEO offer from another company
Yes = “agree” and “strongly agree”No = “strongly disagree,” “disagree”, and “no opinion”
AppendixLongitudinal data and survey background
Deloitte CFO Signals™19
4Q11 1Q12 2Q12 3Q12 4Q12 1Q13 2Q13 3Q13 4Q13 1Q14 2Q14 3Q14 4Q14 1Q15 2Q15 3Q15 4Q15 1Q16 2Q16 3Q16 4Q16 1Q17 2Q17 3Q17Survey
mean2-year mean
Revenue mean 6.3% 5.9% 6.6% 4.8% 5.6% 5.4% 5.7% 5.0% 4.1% 4.6% 6.1% 6.8% 6.0% 5.4% 3.1% 4.4% 5.9% 3.3% 4.0% 4.2% 3.7% 4.3% 5.6% 5.7% 5.7% 4.6%median 5.0% 5.0% 5.0% 5.0% 5.0% 5.0% 5.0% 5.0% 5.0% 5.0% 5.0% 5.0% 5.0% 5.0% 5.0% 4.5% 5.0% 3.0% 4.0% 4.0% 4.0% 4.0% 5.0% 5.0% 5.0% 4.3%
%>0 87% 79% 85% 82% 83% 81% 84% 78% 82% 90% 90% 89% 90% 86% 78% 79% 82% 78% 72% 83% 82% 85% 89% 92% 84% 83%standard deviation 4.9% 6.3% 6.1% 5.7% 6.3% 5.9% 4.5% 5.1% 4.9% 3.9% 4.5% 5.9% 4.0% 6.4% 6.3% 5.4% 6.8% 5.1% 6.7% 4.8% 3.9% 3.7% 4.4% 3.9% 5.7% 4.9%
Earnings 10.1% 12.8% 10.5% 8.0% 10.9% 12.1% 10.3% 8.0% 8.6% 7.9% 8.9% 10.9% 9.7% 10.6% 6.5% 6.5% 8.3% 6.0% 7.7% 6.1% 6.4% 7.3% 8.7% 7.9% 9.8% 7.3%9.0% 9.5% 8.5% 6.0% 7.0% 10.0% 10.0% 9.0% 8.0% 7.0% 8.0% 8.0% 8.0% 8.0% 5.0% 8.0% 7.0% 5.0% 7.0% 5.0% 6.0% 8.0% 8.0% 7.5% 7.8% 6.7%
84% 79% 81% 84% 76% 84% 83% 82% 82% 84% 83% 90% 86% 79% 79% 79% 82% 79% 76% 81% 81% 89% 88% 90% 83% 83%10.7% 19.8% 13.4% 9.7% 16.8% 14.1% 9.6% 8.1% 9.3% 7.5% 9.8% 8.6% 6.9% 17.1% 11.6% 11.0% 10.5% 9.1% 13.5% 7.0% 7.1% 5.6% 8.6% 5.7% 12% 8%
Dividends 2.4% 2.2% 3.9% 2.5% 2.5% 3.6% 4.5% 3.4% 4.0% 5.7% 4.1% 4.1% 3.0% 4.3% 3.4% 3.7% 4.7% 4.0% 2.9% 4.1% 3.3% 3.8% 3.7% 3.8% 3.9% 3.8%0.0% 0.0% 0.0% 0.0% 0.0% 0.0% 0.0% 0.0% 0.0% 0.0% 0.0% 0.0% 0.0% 0.0% 0.0% 0.0% 0.0% 0.0% 0.0% 0.0% 0.0% 0.0% 0.0% 0.0% 0.0% 0.0%
27% 31% 33% 30% 29% 38% 40% 39% 37% 47% 45% 45% 44% 47% 43% 45% 45% 46% 42% 43% 43% 43% 46% 43% 40% 44%4.7% 4.1% 7.0% 4.2% 5.3% 5.7% 5.8% 4.7% 6.7% 7.3% 6.1% 4.8% 3.8% 5.9% 5.3% 4.7% 7.0% 6.0% 4.7% 7.6% 3.9% 4.7% 5.5% 6.0% 6% 6%
Capital spending 9.6% 12.0% 11.4% 4.6% 4.2% 7.8% 7.5% 4.9% 6.4% 6.5% 6.8% 5.0% 5.5% 5.2% 5.4% 4.3% 4.9% 1.7% 5.4% 5.6% 3.6% 10.5% 9.0% 7.3% 7.2% 6.0%5.0% 6.0% 10.0% 3.0% 0.0% 0.0% 3.5% 2.4% 3.0% 3.0% 5.0% 5.0% 5.0% 5.0% 5.0% 2.0% 5.0% 0.0% 4.0% 2.0% 3.0% 5.0% 5.0% 4.5% 4.2% 3.6%
61% 68% 70% 53% 43% 57% 57% 54% 59% 57% 64% 60% 62% 63% 59% 53% 59% 50% 61% 58% 57% 66% 66% 61% 59% 60%16.0% 24.5% 22.1% 9.5% 15.3% 17.6% 11.7% 9.0% 11.2% 13.2% 12.1% 8.9% 10.9% 12.7% 16.5% 11.5% 12.4% 11.2% 16.0% 10.7% 11.4% 20.9% 17.8% 14.2% 14% 14%
Number of domestic personnel 1.0% 2.1% 2.1% 0.6% 1.0% 0.9% 2.4% 1.3% 1.4% 1.0% 1.6% 2.3% 2.1% 2.4% 1.2% 1.4% 1.2% 0.6% 1.1% 2.3% 1.3% 2.1% 2.1% 2.6% 1.7% 1.7%1.0% 1.0% 1.0% 0.0% 0.0% 0.0% 0.0% 0.0% 0.0% 0.0% 1.0% 1.0% 1.0% 1.0% 0.0% 1.5% 0.0% 0.0% 1.0% 1.0% 0.0% 1.0% 2.0% 2.0% 0.8% 0.9%
51% 51% 52% 40% 40% 43% 46% 47% 48% 42% 58% 58% 60% 58% 49% 57% 50% 47% 55% 53% 48% 57% 62% 59% 52% 54%5.2% 7.1% 10.3% 4.1% 3.9% 4.9% 9.6% 5.6% 4.4% 4.9% 3.9% 4.5% 3.6% 3.1% 4.5% 4.8% 3.6% 3.0% 3.8% 3.1% 2.3% 1.9% 2.7% 3.8% 5% 3%
Number of offshore personnel 4.8% 3.7% 3.8% 1.5% 0.5% 2.4% 2.5% 1.9% 4.1% 2.5% 1.9% 2.6% 1.9% 3.1% 2.0% 2.7% 2.8% 1.9% 1.8% 1.9% 1.9% 1.6% 1.7% 2.2% 2.6% 2.0%0.5% 0.0% 0.0% 0.0% 0.0% 0.0% 0.0% 0.0% 0.0% 0.0% 0.0% 0.0% 0.0% 0.0% 0.0% 0.0% 0.0% 0.0% 0.0% 0.0% 0.0% 0.0% 0.0% 0.0% 0.1% 0.0%
50% 43% 41% 30% 32% 39% 36% 33% 42% 34% 42% 45% 44% 48% 39% 46% 49% 45% 39% 43% 46% 37% 44% 45% 42% 44%8.7% 6.1% 6.3% 3.3% 2.7% 4.9% 4.3% 3.3% 9.0% 4.4% 3.7% 2.7% 2.8% 4.4% 3.0% 3.4% 3.7% 2.3% 2.2% 3.0% 1.8% 1.8% 2.1% 4.4% 4% 3%
4Q11 1Q12 2Q12 3Q12 4Q12 1Q13 2Q13 3Q13 4Q13 1Q14 2Q14 3Q14 4Q14 1Q15 2Q15 3Q15 4Q15 1Q16 2Q16 3Q16 4Q16 1Q17 2Q17 3Q17Survey
Mean2-Year Mean
Optimism (% more optimistic) 28.6% 63.0% 39.1% 38.8% 29.1% 51.0% 59.0% 41.9% 54.2% 46.8% 44.3% 43.7% 49.0% 47.9% 37.6% 33.6% 33.9% 33.1% 48.6% 35.2% 43.1% 59.9% 54.6% 45.6% 45.2% 44.2%Neutrality (% no change) 32.1% 21.9% 32.6% 21.2% 31.3% 30.1% 27.7% 33.9% 33.4% 33.0% 37.2% 44.6% 35.3% 38.5% 43.6% 46.9% 42.9% 35.6% 32.9% 49.2% 37.2% 30.3% 34.8% 38.1% 32.5% 37.6%Pessimism (% less optimistic) 39.3% 15.1% 28.3% 40.0% 39.6% 18.9% 13.3% 24.2% 20.8% 20.2% 18.6% 11.7% 15.6% 13.5% 18.8% 19.5% 23.2% 31.4% 18.6% 15.6% 19.7% 9.9% 10.6% 16.3% 22.6% 18.1%Net optimism (% more minus % less optimistic) -10.7% 47.9% 10.8% -1.2% -10.5% 32.1% 45.7% 17.7% 33.4% 26.6% 25.7% 32.0% 33.3% 34.4% 18.8% 14.2% 10.7% 1.7% 30.0% 19.7% 23.4% 50.0% 43.9% 29.4% 22.6% 26.1%
S&P 500 price at survey period midpoint 1,161 1,361 1,317 1,418 1,387 1,520 1,667 1,656 1,798 1,839 1,878 1,955 2,040 2,097 2,123 2,092 2,023 1,865 2,047 2,184 2,177 2,316 2,391 2,441 1,730 2,181S&P gain/loss QoQ 3.4% 17.2% -3.2% 7.7% -2.2% 9.6% 9.7% -0.7% 8.6% 2.3% 2.1% 4.1% 4.3% 2.8% 1.2% -1.5% -3.3% -7.8% 9.8% 6.7% -0.3% 6.4% 3.2% 2.1% 3.0% 2.1%US equity valuations (% who say overvalued) 65.4% 60.2% 56.3% 29.7% 56.1% 71.3% 70.1% 80.3% 78.0% 83.1% 65.0% 65.6%Eq
uitie
sO
pera
ting
Resu
ltsIn
vest
men
tO
ptim
ismEm
ploy
men
t
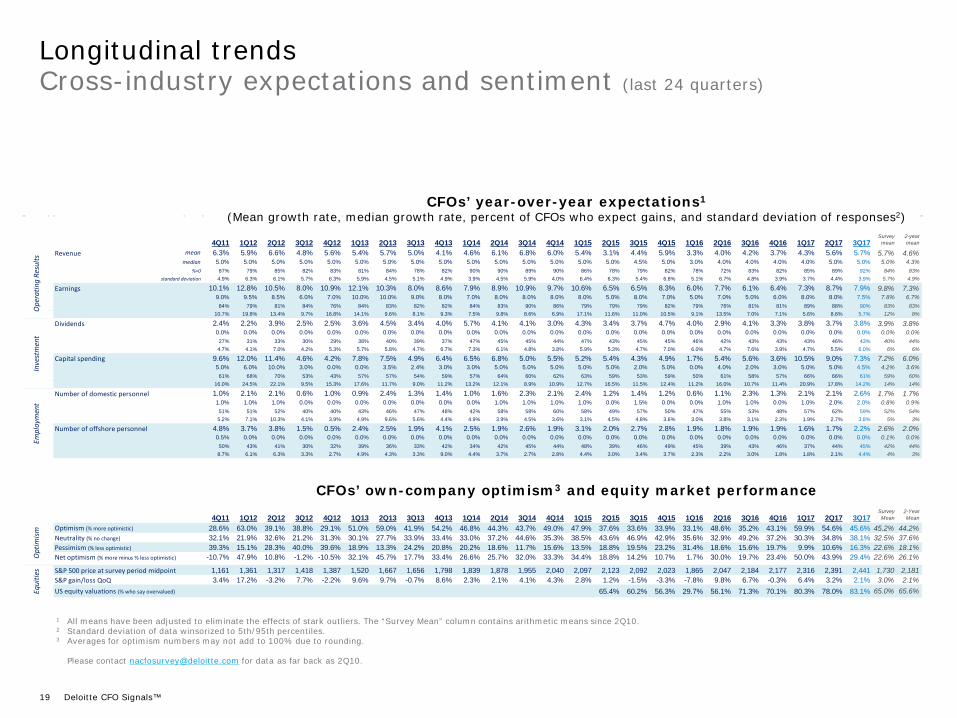
1 All means have been adjusted to eliminate the effects of stark outliers. The “Survey Mean” column contains arithmetic means since 2Q10.2 Standard deviation of data winsorized to 5th/95th percentiles.3 Averages for optimism numbers may not add to 100% due to rounding.
Please contact [email protected] for data as far back as 2Q10.
CFOs’ own-company optimism3 and equity market performance
CFOs’ year-over-year expectations1
(Mean growth rate, median growth rate, percent of CFOs who expect gains, and standard deviation of responses2)
Cross-industry expectations and sentiment (last 24 quarters)
Longitudinal trends
Deloitte CFO Signals™20
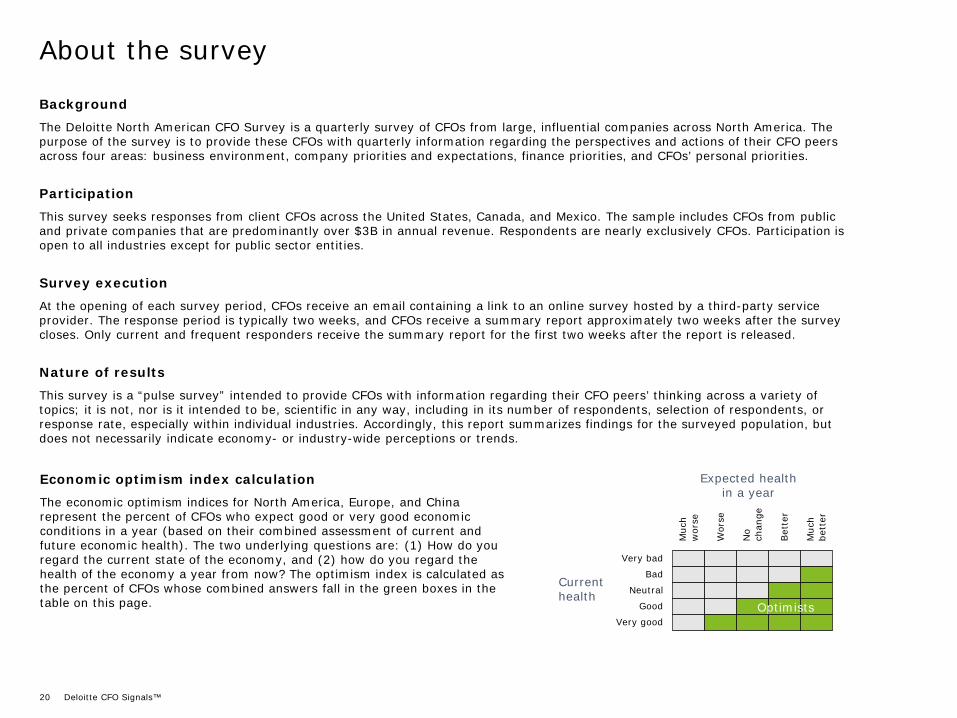
BackgroundThe Deloitte North American CFO Survey is a quarterly survey of CFOs from large, influential companies across North America. The purpose of the survey is to provide these CFOs with quarterly information regarding the perspectives and actions of their CFO peers across four areas: business environment, company priorities and expectations, finance priorities, and CFOs’ personal priorities.
ParticipationThis survey seeks responses from client CFOs across the United States, Canada, and Mexico. The sample includes CFOs from public and private companies that are predominantly over $3B in annual revenue. Respondents are nearly exclusively CFOs. Participation is open to all industries except for public sector entities.
Survey executionAt the opening of each survey period, CFOs receive an email containing a link to an online survey hosted by a third-party service provider. The response period is typically two weeks, and CFOs receive a summary report approximately two weeks after the surveycloses. Only current and frequent responders receive the summary report for the first two weeks after the report is released.
Nature of resultsThis survey is a “pulse survey” intended to provide CFOs with information regarding their CFO peers’ thinking across a variety of topics; it is not, nor is it intended to be, scientific in any way, including in its number of respondents, selection of respondents, or response rate, especially within individual industries. Accordingly, this report summarizes findings for the surveyed population, but does not necessarily indicate economy- or industry-wide perceptions or trends.
Muc
h w
orse
Wor
se
No
chan
ge
Bet
ter
Muc
h be
tter
About the survey
Very bad
Bad
Neutral
Good
Very good
Current health
Economic optimism index calculation The economic optimism indices for North America, Europe, and China represent the percent of CFOs who expect good or very good economic conditions in a year (based on their combined assessment of current and future economic health). The two underlying questions are: (1) How do you regard the current state of the economy, and (2) how do you regard the health of the economy a year from now? The optimism index is calculated as the percent of CFOs whose combined answers fall in the green boxes in the table on this page.
Expected healthin a year
Optimists
About Deloitte
Deloitte refers to one or more of Deloitte Touche Tohmatsu Limited, a UK private company limited by guarantee (“DTTL”), its network of member firms, and their related entities. DTTL and each of its member firms are legally separate and independent entities. DTTL (also referred to as “Deloitte Global”) does not provide services to clients. In the United States, Deloitte refers to one or more of the US member firms of DTTL, their related entities that operate using the “Deloitte” name in the United States and their respective affiliates. Certain services may not be available to attest clients under the rules and regulations of public accounting. Please see www.deloitte.com/about to learn more about our global network of member firms.
Copyright © 2017 Deloitte Development LLC. All rights reserved.
IMPORTANT NOTES ABOUT THIS SURVEY REPORT:
Participating CFOs have agreed to have their responses aggregated and presented.
This is a “pulse survey” intended to provide CFOs with quarterly information regarding their CFO peers’ thinking across a variety of topics. It is not, nor is it intended to be, scientific in any way, including in its number of respondents, selection of respondents, or response rate, especially within individual industries. Accordingly, this report summarizes findings for the surveyed population but does not necessarily indicate economy- or industry-wide perceptions or trends.
This publication contains general information only, and Deloitte is not, by means of this publication, rendering accounting, business, financial, investment, tax, legal, or other professional advice or services. This publication is not a substitute for such professional advice or services, nor should it be used as a basis for any decision or action that may affect your business. Before making any decisions that may impact your business, you should consult a qualified professional advisor.