Embed Size (px)
Citation preview

8/9/2019 Cfd Simulation of Pollutant Emission in Power Plant Boilers
http://slidepdf.com/reader/full/cfd-simulation-of-pollutant-emission-in-power-plant-boilers 1/8
1 Copyright © 2 11 ASME
Proceedings of the ASME 2011 Pow er ConferencePOWER2011
July 12-14 2011 Denver Co lorado USA
POWER2011-55110
CFD SIMULATION OF POLLUTANT EMISSION IN POWER PLANT BOILERS
Iván F. Galindo-García, Ana K. Vázquez-Barragán, Alejandro G. Maní-González, andMiguel Rossano-Román
Electrical Research Institute of México (IIE),Reforma 113, Cuernavaca, México, 62490
ABSTRACTA computational model is developed in order to investigatepollutant emissions from power plant boilers to theatmosphere. A well-known method of pollutant reduction is themodification of the combustion conditions to prevent theirformation, and 3D computational fluid dynamics (CFD) codesprovide an effective tool for the analysis of the combustionprocess. In this paper CFD calculations were performed toanalyze the effect of the amount of combustion air on theproduction and emission of nitrogen oxides, one of the mainpollutants produced during the combustion process. For thisanalysis the appropriate modeling of the chemical and physicalphenomena involved is important, because the production and
transport of pollutant species strongly depend on the flow andtemperature distributions in the furnace. Two case studies arepresented: a pulverized coal-firing tangential boiler and a fuel-oil frontal boiler. The CFD calculations adopt a 3D-formulation of the mean flow equations in combination withthe standard high-Reynolds-number k- ε turbulence model. Themodel domain consists of the whole boiler, from the burnernozzles up to the exit of the economizer. Due to their complexgeometrical features and computational limitations bank tubesare not modeled individually, but are grouped in a totalvolume. A porous media region approach is then undertaken tomodel gas flow and heat transfer in each heat exchanger.Model validation is a difficult task due to the lack of available
data from commercial utilities. Validation has been done usingroutinely measured global parameters. Relatively goodagreement is obtained. Results show that increasing theamount of air reduce nitrogen oxides formation for the case ofthe tangential boiler, however for the frontal boiler case thisbehavior is not as evident. These results demonstrate that CFDsimulations are a viable tool to study the effect somecombustion parameters have on the production of pollutants.CFD results may help to establish trends that, in turn, may helpto reduce pollutant emissions from power plant boilers.
1. INTRODUCTIONOne of the main challenges facing the power generationindustry that use fossil fuels is to meet the increased electricitydemand while maintaining the emission of pollutantsaccording to environmental regulations. Some of the airpollutants formed in high temperature combustion processeswhere the nitrogen present in the fuel or air combines withoxygen are nitrogen oxides (nitric oxide NO, nitrogen dioxideNO 2 and nitrous oxide N 2O, grouped as NO x), which, alongwith sulfur oxides (SO 2 and SO 3) and particulate matter,contribute to the formation of acid rain and ozone degradation,with the potential to affect visibility and in general deterioratehuman health [1]. In consequence, in order to diminish their
effect most combustion systems are regulated, monitored andrequired to have some type of control. This control is closelyrelated to the combustion process. In utility boilers, the so-called primary techniques for reduction of nitrogen oxidesconsist in the modification of combustion conditions to avoidtheir formation. Depending on the fuel, and also on the designof furnace and combustion system, diverse technologies areavailable: low NO x burners, fuel/air staging, overfire air,reburning, and flue gas recirculation. In many instances theseprimary techniques are not enough to meet the new, verystringent regulations, so that secondary techniques, i.e. NO x
selective chemical reduction, are unavoidable.Useful tools to help in the control of the emission of
contaminants, with either primary or secondary techniques, aresimulation tools such as the Computational Fluids Dynamics(CFD) codes. The method involves the use of mathematicaland numerical models to solve fluid flow, mass and heattransfer, chemical reactions and phase change. CFDsimulations help to analyze the combustion process through avirtual prototype that provides qualitative and quantitativeresults.
In this work simulations have been performed in order todemonstrate that CFD simulations are a viable tool to study the
Proceedings of the ASME 2011 Power ConferencePOWER2011
July 12-14, 2011, Denver, Colorado, USA
POWER2011-55110
Copyright © 2011 by ASME
wnloaded From: http://asmedigitalcollection.asme.org/ on 11/06/2014 Terms of Use: http://asme.org/terms

8/9/2019 Cfd Simulation of Pollutant Emission in Power Plant Boilers
http://slidepdf.com/reader/full/cfd-simulation-of-pollutant-emission-in-power-plant-boilers 2/8
2 Copyright © 2 11 ASME
effect some combustion parameters have on the production ofpollutants. The appropriate modeling of the chemical andphysical phenomena involved is important, because theproduction and transport of pollutant species strongly dependon the flow and temperature distributions in the furnace. CFDresults may help to establish trends that, in turn, may help to
reduce pollutant emissions from power plant boilers. Thepresent CFD simulations analyze the effect of increasing theamount of combustion air available for combustion by 10%.Two 350 MW generating units are simulated; one is a coal-fired tangential-design boiler and the other a heavy oil-firedfrontal-design boiler. Flow, energy and the global kinetics ofNO x formation in the furnace have been simulated by standardCFD techniques.
2. NO X FORMATION OVERVIEWCombustion of a fossil fuel invariably produces NO x due to
the high temperature and the availability of oxygen andnitrogen in the air and fuel. NO x formation results from three
main mechanisms: thermal NO x, fuel NO x and prompt NO x [1-3].Thermal NO x is produced by oxidation at high temperature
of the nitrogen present in the combustion air and its formationrate is function of temperature (significantly increases after1204°C) and the residence time at that temperature. Since thetypical factors for an efficient combustion are hightemperature, long residence time, and high turbulence, i.e.characteristics that tend to increase the formation rates ofthermal NO x, a balance has to be sought between an effectivecombustion and production of NO x. Typical control of thermalNO x consists of reducing mean and maximum flametemperature.
Fuel NO x is formed through two mechanisms: oxidation ofvolatile species in the nitrogen present in the fuel during theinitial phase of combustion and the formation of nitrogenradicals during char combustion. The volatiles consist ofhydrogen, carbon monoxide, carbon dioxide, and methane,principally, while the remaining particle, followingdevolatilization, consists of char residue and inert ash. In thefirst mechanism nitrogen reacts to form intermediatecompounds in the rich fuel region, therefore NO and NO 2 formation strongly depends on the local air-fuel stoichiometryratio. Conversion can be controlled by reducing the availableoxygen during the initial stages of combustion. In the secondmechanism, char-oxidant reactions, a fraction of the nitrogen
in the char is directly converted to NO. Additionally,heterogeneous reduction to N 2 by interaction with the charparticles can contribute to slightly decrease the total amount offuel NO x.
Prompt NO x is formed by reactions of N 2 with fuel derivedradicals such as CH and CH 2 in regions near the flame zone ofa hydrocarbon fuel. The contribution of prompt NO x to totalNO x is usually very small.
In order to model NO x formation, kinetic rate modelsdetailed enough to characterize the process, but consisting of
only a few global steps, to facilitate their interaction with thecomputation of velocity, temperature and concentration fieldsare employed. In CFD modeling, NO x simulation is usuallydecoupled from the main calculation. Simulations consist oftwo stages. First velocity, temperature and concentration ofmajor species are calculated, and second NO x calculations are
executed after as a post-processing task. This is expected,because the presence and evolution of trace species hardlyaffect the overall flame evolution, controlled by comparativelyfaster fuel combustion mechanisms [2].
3. NUMERICAL SIMULATION MODELThe general purpose CFD code FLUENT [4] has been
adopted to simulate chemical reactions, fluid and particle flow,and heat and mass transfer inside the furnace. The discretizedconservation equations for mass, momentum and energy aresolved. Turbulence is accounted for by means of the standardk–ε model [5].
For the simulation of the tube bundles (superheaters,
reheaters, economizers and hanger tubes) located downstreamof the furnace, it is not feasible to model each tubeindividually due to the different length scales, instead a porousmedia approach was adopted. The porous media model addstwo source terms to the momentum equations, a viscous termand an inertial loss term, which depend on the molecularviscosity and the square of velocity, respectively. For the caseof the heat absorbed inside the porous zone, the energyequations are modified in the heat conduction terms, using aneffective conductivity that takes into account the fluid andsolid conductivities and the porosity of the medium. Theporosity is the volume fraction of fluid within the porousregion (i.e., the open volume fraction of the medium). The
formula for porosity factor β is,
LT
o
S S D
41
2π−=β (1)
where D o is heat exchanger tube diameter, S T is the transversallength (pitch), and S L is the axial length. The porous model isemployed to model three superheaters (SH1, SH3 and SH4),two reheaters (RH2 and RH3), two economizers (ECOSUPand ECOINF) and hanger tubes for SH1. Superheater SH2 ismodeled as plates and reheater RH1 is not modeled. Thegeometric data used for the calculation of the porosity of theheat exchangers are given in Table 1.
Panels Tubes Diam.
mm S T, mm S L,mm Poro
SH3 26 33 48.6 522 58.1 0.938RH2 40 20 63.5 348 115 0.920RH3 80 8 60.3 174 115 0.857SH4 80 8 48.6 174 100 0.893SH1 54 34 54 130.5 100 0.824
ECO SUP 27 12 45 130.5 115 0.894ECOINF 27 12 45 130.5 115 0.894
Hanger tub SH1 54 5 48.6 130.5 100 0.857TABLE 1. HEAT EXCHANGERS PARAMETERS.
Copyright © 2011 by ASME
wnloaded From: http://asmedigitalcollection.asme.org/ on 11/06/2014 Terms of Use: http://asme.org/terms

8/9/2019 Cfd Simulation of Pollutant Emission in Power Plant Boilers
http://slidepdf.com/reader/full/cfd-simulation-of-pollutant-emission-in-power-plant-boilers 3/8
3 Copyright © 2 11 ASME
Total heat absorbed in each exchanger is modeled byadding an energy source term to the energy equation. Thevalue of the source term is calculated based on the percentageof heat absorbed in each heat exchanger. In Table 2, thepercentage of heat absorbed in each heat exchanger is shown.
Heat exchanger Coal Heavy OilBoiler Walls (%) 34 36Superheaters (%) 33 31Reheaters (%) 14 14Economizer (%) 9 10Air Pre-heater (%)(not modeled) 10 9Total absorbed heat (%) 100 100
TABLE 2. HEAT ABSORBED IN EACH HEAT EXCHANGER.
Coal combustion involves homogeneous (or gas-phase)combustion and heterogeneous reaction of fuel particles.During gas phase combustion species products of combustionare formed. The main objective of a combustion model is todetermine the mean production rates of those species; thekinetic rates then appear in the species transport equations.Here the Eddy-dissipation model with a one step heat-releasemechanism, available in FLUENT, was employed. Forcombustion of fuel particles the process involves drying,devolatilization, and char oxidation. The devolatilizationmodel is applied to a combusting particle after the particlereaches the vaporization temperature (i.e. after drying). Thesingle kinetic rate model, where the yielding kinetic rate k isdefined by an Arrhenius expression, was adopted. TheArrhenius expression is given by:
( ) RT E e Ak
−= 1 (2)
where A1 is the pre-exponential factor, E is the activationenergy, T is the temperature and R is the universal gasconstant.
Following devolatilization the remaining particle consist ofchar residue and inert ash. Char combustion is modeled by thekinetic/diffusion-limited rate model, which assumes that thesurface reaction rate is determined either by kinetics or by adiffusion rate.
The time averaged conservation equations are solved forpredicting the flow, temperature and concentration of gasspecies within the boiler. Turbulent quantities are calculatedusing the standard high-Reynolds-number k- ε turbulencemodel. Lagrangian particle trajectories of the pulverized coalparticles or heavy oil droplets are calculated throughout thecomputational domain. The dispersion of particles due to gasturbulence is predicted using the stochastic tracking modelwhich includes the effect of instantaneous turbulent velocityfluctuations of the gas on the particle trajectories. The P1radiation model is used to simulate radiation heat transfer.Absorption coefficients of the gas phase are calculated using
the weighted-sum-of-gray-gases model (WSGGM). Theimpact of reacting particles or droplets on the continuousphase can be examined using heat and mass transferrelationships, available in FLUENT. For coal particles themodel includes particle heating, evolution of volatiles andswelling, char reaction and cooling of the particle. For droplet
combustion the droplet evolution includes heating tovaporization temperature, evaporation, boiling and cooling.Interaction between the turbulence and chemistry is modeledwith the eddy dissipation model in which reaction rates areassumed to be controlled by the turbulence.
All models mentioned above have been extensively usedfor an efficient modeling of the complex phenomena found inlarge scale boilers. Detailed formulations of the models are notgiven here since they can be found in the ANSYS FLUENTTheory Guide [3].
A parametric analysis was accomplished to confirm thatnumerical results were grid independent. Fig. 1 shows thevelocity in a horizontal line inside the boiler at 23 m from the
bottom and going from one corner to the opposite corner(position 0-12.5m) using grids with different total number ofcells of 2, 3 and 5 million cells. It can be observed thatvelocity is similar for the grids with 3 and 5 million cells,which indicates that increasing the number of cells in the meshdoes not significantly affect results.
FIG. 1. VELOCITY CALCULATED USING THREEDIFFERENT MESH SIZES.
4. CASE-STUDY BOILER
The boiler under consideration is part of a 350 MWcommercial power plant operating in a subcritical steam cycle.The combustion chamber is rectangular in shape (dimensions12.7 x 14.15 x 45.6 m), and is fired tangentially using eitherfive pulverized coal burners or four heavy oil fuel burners ineach corner. The burner nozzles discharge a mixture of coaland air into the furnace, while auxiliary nozzles dischargesecondary air. For the case of the boiler firing pulverized coalit has two types of coal burners, one is a fuel rich burner
Copyright © 2011 by ASME
wnloaded From: http://asmedigitalcollection.asme.org/ on 11/06/2014 Terms of Use: http://asme.org/terms

8/9/2019 Cfd Simulation of Pollutant Emission in Power Plant Boilers
http://slidepdf.com/reader/full/cfd-simulation-of-pollutant-emission-in-power-plant-boilers 4/8
4 Copyright © 2 11 ASME
(CONC) and the other is a fuel lean burner (WEAK). Thefurnace geometry and burner arrangement are shown in Fig. 2.
FIG. 2. BOILER GEOMETRY.
The model domain consists of the combustion chamber, fromthe burner nozzles at the furnace corners, up to the exit of theeconomizer. A mesh for the model was created usingtetrahedral and hexahedral elements and has approximately3.5×10 6 elements of unequal size. The regions close to theburners, where the fluids are injected and the combustionprocesses take place, were assigned a denser mesh, Fig.3.
FIG. 3. MESH FOR THE MODEL.
Boundary conditions were obtained from the plant designdata sheets. The air and fuel nozzles were the inlets and theregion after the economizers was the outlet. The boiler wallswere assigned wall boundary conditions for flow and thermalproperties. Table 3 presents the boundary conditions for thesimulation cases. Properties of fuels, proximate and ultimate
analyses, as well as heating value are given in Table 4.
Parameter Boundary condition valueCase 1: Coal firingLoad 100% (350 MW)Elevations in service A, B, C, DCoal flow rate 33.786 kg/sPrimary air flow rate 86.666 kg/sPrimary air temperature 70 °C (343 K)Total secondary air flow rate 256.388 kg/sSecondary air temperature 321 °C (594 K)OFA flow rate 21.04 % of secondary airOutlet pressure relative toatmospheric pressure
-1000 Pa
Case 2: Heavy oil firingLoad 100% (350 MW)Elevations in service A, B, C, DHeavy oil flow rate 21.98 kg/sHeavy oil temperature 117.4°C (390 K)Air flow rate 305.55 kg/sAir temperature 325 °C (598 K)Gas recirculation flow rate 30.8 kg/sOFA flow rate 13.78 % of total airOutlet pressure relative toatmospheric pressure
-1000 Pa
TABLE 3. BOUNDARY CONDITIONS.
Coal Properties valuesProximate analysis (as received)Moisture (%) 9.5Ash (%) 12.2Volatile (%) 31Fixed carbon (%) 47.3Ultimate analysis (as received)Carbon (%) 82.5Hydrogen (%) 5.6Oxygen (%) 8.96Nitrogen (%) 1.8Sulfur (%) 1.1Chloride (%) 0.04Heating value (kJ/kg) 26,497.27
Heavy oil Properties values
Proximate analysis (as received)Carbon (%) 83.64Hydrogen (%) 11.3Sulfur (%) 4.2Oxygen + Nitrogen (%) 0.86Heating value (kJ/kg) 41,868
TABLE 4. FUEL PROPERTIES.
Copyright © 2011 by ASME
wnloaded From: http://asmedigitalcollection.asme.org/ on 11/06/2014 Terms of Use: http://asme.org/terms

8/9/2019 Cfd Simulation of Pollutant Emission in Power Plant Boilers
http://slidepdf.com/reader/full/cfd-simulation-of-pollutant-emission-in-power-plant-boilers 5/8
5 Copyright © 2 11 ASME
5. MODEL VALIDATIONThe data needed for model validation is usually not
available in commercial utilities. As stated in [6], it isimpractical and unlikely that enough experimental data couldbe collected to provide the detailed information needed forcombustion modeling. Therefore the global parameters
measured routinely by plant operators may be taken as a guidefor model validation. In this context validation refers more toagreement in trends than comparison of absolute values.
5.1. Validation results firing coalThe boiler was operated with the lower A–B–C–D levels
firing coal and the upper E level out of service. The tilt anglesof the A–E burner levels were assumed to be 0°. Thecombustion simulations are compared to some key globaldesign parameters available from boiler data, including theaverage temperature and average O 2 and CO 2 mass fraction atthe furnace exit. Table 5 presents data from calculations andfrom the reference boiler. It should be noted that the exact
location for measurements inside the boiler was not known.Therefore calculated values in Table 5 are given as a rangelimited by the maximum and minimum values in a transversalplane at the indicated location, where the minimum andmaximum temperature values are greatly influenced by thecold temperature at the walls (377 °C) and by the hot gases atthe center of the furnace, hence the wide range of values inTable 5. These results show that, except for flue gastemperature at furnace exit and O 2 concentration ateconomizer exit, which are higher and lower than plant data,respectively, the ranges of calculated values enclose therespective reference value. Discrepancies are difficult toanalyze because of the uncertainties about the exact location of
the measurement point. Despite these differences the generaltrend in flue gas temperature as the gas flows through thefurnace is similar for calculation and plant data. Recall,however, that this comparison is only a rough approximationtowards model validation and that more plant data is neededfor better analysis.
Variable Calculation Plant dataFlow rateFlue gas (economizer outlet) kg/s 372.2 376.66TemperatureFlue gas at furnace exit, °C 1433 – 1711 1007Reheater outlet , °C 511 – 1235 779Superheater outlet , °C 584 – 907 527Flue gas at economizer inlet, °C 487 – 907 524Flue gas economizer outlet , °C 252 – 610 343Flue gas concentrationO2 economizer exit (dry vol %) 0.73 – 2.58 3.6CO2 economizer exit (dry vol %) 15.5 – 18.1 15.2–17.7TABLE 5. COMPARISON BETWEEN CALCULATIONS AND
REFERENCE PLANT, COAL FIRING.
5.2. Validation results firing heavy oilFor the condition of 100% load and the boiler firing heavy
oil the four elevations of oil burners are used. Similarly to thecase for coal-firing, results in this case also show that plantdata is within the ranges given by the maximum and minimumcalculated values, exceptions are temperature at the furnace
exit and, only slightly, species concentrations at the exit.Model predictions and plant data are shown in Table 6.Comparing these data it is clear that more reference data isneeded for a comprehensive validation; however the availableplant data helps to roughly corroborate results from thesesimulations.
Variable Calculation Plant dataFlow rateFlue gas at economizer outlet, kg/s 358.20 357.5TemperatureFlue gas at furnace exit, °C 819–1484 1017Reheater outlet , °C 445 – 1081 773
Superheater outlet, °C 336 – 680 517Flue gas at economizer inlet , °C 336 – 668 546Flue gas economizer outlet , °C 171 – 400 352Flue gas concentrationO2 economizer exit (dry vol %) 0.08 – 0.9 1.1CO 2 economizer exit(dry vol %) 12.7 – 13.39 13.59TABLE 6. COMPARISON BETWEEN CALCULATIONS AND
REFERENCE PLANT, HEAVY OIL FIRING.
6. MODEL RESULTSCFD simulations have been performed in order to analyze
the effect of changing the boiler operating conditions on thecombustion process and in particular on pollutant emissions.Here the effect of varying the amount of combustion air isinvestigated. It is assumed that variation of the combustion aircan have a significant influence on the NO x formation process.Two cases are presented: a case with a tangentially fired boilerburning coal and a case of a frontal burner boiler using fueloil. For both cases results were obtained for 100% load andincreasing the combustion air by 10%.
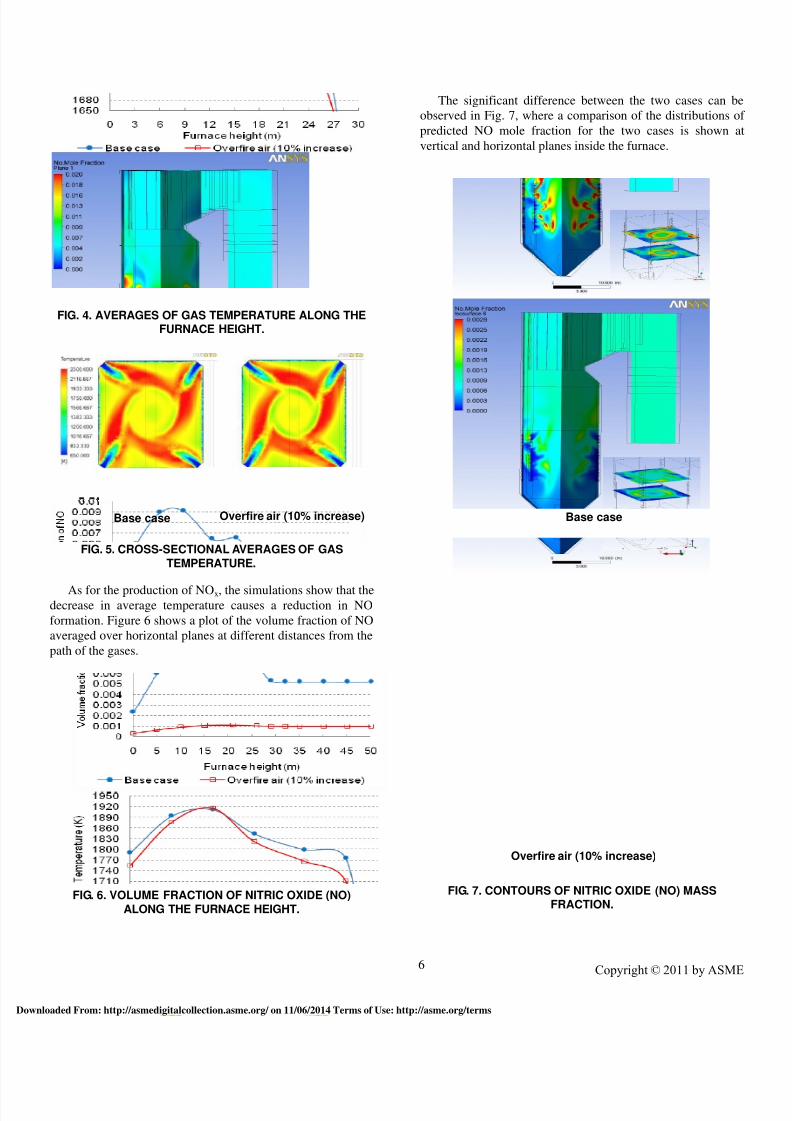
6.1 Tangentially fired Boiler Figure 4 shows a plot of the average temperature in
horizontal cross-sections at different distances in the path ofthe gas. It shows the influence of the amount of air suppliedfor the combustion process on average temperature.
Temperature is lower when combustion air was increased.Figure 5 shows temperature contours in a horizontal cross-section at the height of the elevation D burner (10 m) for thetwo cases. Even if the profiles are very similar, it appears thatthe temperature for the base case is higher.
Copyright © 2011 by ASME
wnloaded From: http://asmedigitalcollection.asme.org/ on 11/06/2014 Terms of Use: http://asme.org/terms
8/9/2019 Cfd Simulation of Pollutant Emission in Power Plant Boilers
http://slidepdf.com/reader/full/cfd-simulation-of-pollutant-emission-in-power-plant-boilers 6/8

8/9/2019 Cfd Simulation of Pollutant Emission in Power Plant Boilers
http://slidepdf.com/reader/full/cfd-simulation-of-pollutant-emission-in-power-plant-boilers 7/8
7 Copyright © 2 11 ASME
The difference between the two images is evident, becausewhile the base case shows several areas at the top of the scale(0.02) and an average at the outlet of 0.005, the case with 10%more air has a maximum fraction of 0.0028 and an average atthe outlet of 0.001. It should be noted that due to uncertainty
in the validation, the assessment of trends, i.e. the variationbetween different states of operation, is of greater value thanthe absolute values of the simulations. In our case the trendexhibited by the results can be considered adequate accordingto the NO x formation processes both thermal and fuel, asdescribed above. Although the formation of fuel NO x is greaterwith increased availability of air, the temperature decrease dueto more air dominates the formation of NO x and has a loweryield for the case where the secondary air was increased by10%.
6.2 Frontal burner boilerIn a second case study the same scenario of 10% increase
of combustion air, but now in a boiler that burns fuel oil withfrontal burners distributed in four levels of three wall burnerswith a total of 24 burners was also investigated. Unlike theprevious case, it sought to analyze the formation of NO x mainly at the furnace and excluding the effect of heat transferon the walls and on the banks of tubes. Results show thatincreasing the combustion air NO formation is reduced in thefurnace region, however, at the outlet both have similar values,even the base case is slightly higher (Fig. 8).
FIG. 8. PLOT OF MOLAR FRACTION OF NITRIC OXIDE(NO) ALONG THE FURNACE HEIGHT, FRONTAL BOILER.
Figure 9 shows the contours of the mole fraction of NO forthe two scenarios. As can be seen, although at the top and atthe outlet the profile is similar, in the furnace itself differencesin the profiles of NO can be noticed. The case in which there ismore available air appears to have less NO produced in theburner region.
Base case 10% air increase
FIG. 9. CONTOURS OF NITRIC OXIDE (NO) MASSFRACTION, FRONTAL BURNER BOILER.
6. CONCLUDING REMARKSComputations of a utility boiler have been undertaken using
a CFD-based model that solves the 3D-equations for mass-diffusion, momentum, and energy in combination with modelsfor turbulence (standard high-Reynolds-number k- ε model),combustion (eddy dissipation model) and radiation (P1model). The aim was to demonstrate that CFD simulations area viable tool to study the effect that combustion parametershave on the production of pollutants. CFD results may help toestablish trends that, in turn, may help to reduce pollutantemissions from power plant boilers. The CFD calculationspresented here investigate the effect that changing the
operating conditions of a boiler would have on NO x formation.The model has been validated comparing simulation results todesign parameters from the reference plant, where validationrefers more to agreement in trends than comparison of absolutevalues Two case studies have been presented in whichnumerical simulations were conducted varying the amount ofoxygen available for combustion, which changes theconditions for the production of NO x. Results show that NOproduction is reduced when the amount of available air forcombustion is increased by 10%. This result is justifiedbecause temperature decreases by increasing air flow.However, in the case of the frontal boiler firing fuel oil thistrend was not observed as clearly, so further simulations are
required varying this parameter further. As a final conclusionCFD is recommended as a viable computational tool toevaluate techniques aimed at reducing emissions in boilers,bearing in mind that validation is a key part in the simulationprocess.
Copyright © 2011 by ASME
wnloaded From: http://asmedigitalcollection.asme.org/ on 11/06/2014 Terms of Use: http://asme.org/terms

8/9/2019 Cfd Simulation of Pollutant Emission in Power Plant Boilers
http://slidepdf.com/reader/full/cfd-simulation-of-pollutant-emission-in-power-plant-boilers 8/8
8 Copyright © 2 11 ASME
ACKNOWLEDGMENTSFinancial support for this work was provided by CFE (the
Mexican utility, Laboratorio de Pruebas a Equipos yMateriales, LAPEM), CONACYT (National Council forScience and Technology of México) and IIE (ElectricalResearch Institute of México).
NOMENCLATURE Roman lettersA1 pre-exponential factor (kgmol/m 3-s)Do tube diameter (m)E activation energy (J/kgmol)R universal gas constant (J/kgmol-K)ST transversal length (m)SL axial length (m)T temperature (K)k kinetic reaction rate (kg/m 3-s)
Greek lettersβ porosity factor
REFERENCES[1] Babcock and Wilcox, 2005, Steam/its generation and use ,41 ed, eds. J.B. Kitto and S.C.Strultz, The Babcock andWilcox Company, Ohio, USA.[2] L. I. Dıéz, C. Cortés, and J. Pallarés, 2008, “NumericalInvestigation of NOx Emissions From a Tangentially-FiredUtility Boiler Under Conventional and Overfire AirOperation,” Fuel, 87, pp 1259-1269.
[3] ANSYS, 2009. ANSYS FLUENT 12.0 Theory Guide,ANSYS, April 2009.[4] ANSYS, 2009. ANSYS FLUENT 12.0 User’s Guide ,ANSYS, April 2009.[5] Launder BE, Spalding DB., 1974, “The NumericalComputation of Turbulent Flows”, Comput Meth Appl MechEng, 3, pp. 269–289.[6] Fiveland, W.A., Wessel RA, 1988, “Numerical Model forPredicting Performance of Three Dimensional Pulverize-FuelFired Furnaces”. J Eng Gas Turb Power, 110, pp.117–126.
Copyright © 2011 by ASME