Embed Size (px)
Citation preview
Journal of Engineering Science and Technology Review 11 (5) (2018) 185 - 192
Research Article
CFD Simulation Analysis of the Influence of Floor Area Ratio on the Wind Environment in Residential Districts
Li Li1,2, Xuesong Yang1,* and Yi Qian1
1School of Urban Design, Wuhan University, Wuhan 430072, China
2Teaching Affairs Department, Hubei Engineering University, Xiaogan 432000, China
Received 9 August 2018; Accepted 30 November 2018 ___________________________________________________________________________________________ Abstract
The floor area ratio (FAR) in residential districts in China has been expanding continuously as a response to the rapid urbanization and increasing demands for buildings. Consequently, the wind environment in residential districts begins to affect the outdoor comfort of residents. Simulation cases of residential buildings with different FARs were presented in this study to disclose the relationship between FAR and the wind environment in residential districts. First, the wind environment characteristics of residential districts with different FARs were established via computer numerical simulation. Second, wind speed ratio (WSR) and air age distribution were calculated at pedestrian height. Finally, the quantitative relationship between outdoor wind environment and FAR in residential districts was concluded. Results demonstrate a negative linear relationship between FAR and the average WSR (AWSR) in outdoor environment but a positive linear relationship between FAR and average air age. The AWSR in residential areas is decreased by 0.18 and the average air of age is increased by 53.38 s when FAR is increased from 0.63 to 2.32. In other words, increasing FAR in residential areas can decrease the AWSR but increase the average air age, thereby influencing the outdoor comfort of residents. This study provides references to improving wind environment and planning layout in residential districts with high FARs.
Keywords: Wind environment, Residential buildings, Floor area ratio, CFD ____________________________________________________________________________________________
1. Introduction The rapid urbanization and increasing demands for buildings in China have expanded urban size continuously to cope with population concentration and industrial activities. The land utilization form of building density and floor area ratio (FAR) becomes a solution to the contradiction between the intense urban land resources and dense urban population. Although high-rise buildings are conducive to saving land resources, the excessive FAR has caused serious environmental pollution and increasingly serious ecological and climatic issues in cities. The intense urbanization has changed the original microclimate environment in cities and may exert adverse impacts on the ventilation and physical environment of surrounding buildings [1] [2]. A high FAR induces wind environmental deterioration and poor climatic phenomena (e.g., eddy, large wind shadow area and poor ventilation) in residential districts. These conditions extremely affect the thermal comfort of people and even induce safety risks to pedestrians [3].
In regions with hot summer and cold winter, such as Wuhan City, China, natural ventilation can lead to excessive indoor and outdoor heats in the summer; this condition relieves the adverse effects of humidity on people and improves the thermal comfort of human body [4]. A good wind environment helps residents to acquire fresh air, which is considerably beneficial for the physical and mental health of residents. A good wind environment is an important link
to constructing comfortable and healthy green ecological residential districts.
Scholars have conducted numerous studies on the impact of FAR on outdoor wind environment [5-7]. However, evaluation indexes of wind environment and the quantitative relationship between FAR and wind environment have not yet been fully investigated. For example, deep studies on the influences of macroscopic factors (e.g., FAR) of residential areas on wind environment are lacking. Therefore, an accurate prediction of the impact of residential FAR on wind environment and the clarification of the quantitative relationship between FAR and wind environment are urgent issues that should be addressed. Many optimization problems involve multiple objectives. For the network-clustering problem, many multiobjective optimization models have been proposed. Pizzuti [10] presented a multiobjective genetic algorithm to uncover communities in networks. Recently, Gong et al. [11] proposed a multiobjective discrete particle swarm optimization algorithm for network clustering. Experiments have demonstrated that the proposed algorithm is very effective.
On the basis of the aforementioned analysis, this study establishes hypothetical building models of residential districts through computer numerical simulation and analyzes the average wind speed ratio (AWSR), air age, and wind environment characteristics of residential districts to accurately investigate the quantitative relationship between residential FAR and wind environment. Accordingly, the wind environment in high-FAR residential districts can be optimized and references for residential planning can be provided.
JOURNAL OF Engineering Science and Technology Review
www.jestr.org
Jestr
______________ *E-mail address: [email protected] ISSN: 1791-2377 © 2018 Eastern Macedonia and Thrace Institute of Technology. All rights reserved. doi:10.25103/jestr.115.24

Li Li, Xuesong Yang and Yi Qian/Journal of Engineering Science and Technology Review 11 (5) (2018) 185 – 192
186
2. State of the art Abundant studies on the wind environment in residential districts have been reported. Strategies to optimize wind environment and planning guidance have been proposed. However, these studies have mainly focused on urban morphology, mesoscale layout, and microscopic details of buildings. On the basis of CFD simulation of the wind environment in residential districts, Hu Kaihua et al. [8] analyzed the quantitative relationship between building density and wind environment. They indicated that building density has a negative linear relationship with the average outdoor wind speed ratio (WSR) in residential districts, but it shows a positive linear relationship with the average air age. These findings provide theoretical and practical enlightenments to study the quantitative relationship between FAR and wind environment. Ying Xiaoyu et al. [9] investigated the group wind environments of six layouts by numerical simulation and determined that O-shaped layout achieves the best outdoor wind environment. However, the influences of FAR on wind environment were not discussed. Gao Yafeng et al. [10] conducted a statistical analysis of the effects of urban architectural form on the morphology of wind field and reported that meteorological data and building layout are key influencing factors of wind environment. Chen Gong [11] investigated the determinant, staggering, indented, and mixing layouts of residential districts. He emphasized that the length of buildings influences the wind environment mostly, and the indented layout can improve the wind environment in residential districts. Fang Pingzhi et al. [12] studied the wind environment in a highly simplified building group in Lujiazui District, Shanghai by combining wind tunnel test and numerical simulation. They indicated that regions with high WSRs are developed at two sides of the windward surface and the space between two buildings, whereas regions with low WSRs occur in upstream and downstream of buildings. Yang Feng [13] investigated the subjective perceptions of pedestrians to wind and thermal comfort in different types of residential districts in Shanghai through field measurement and questionnaire survey and concluded that site planning and residential design should attach considerable attention to ventilation in the summer, and wind prevention in the winter may be inconsiderably important. Ghada Elshafei et al. [14] reviewed experimental and numerical studies that have evaluated the effects of natural ventilation on the thermal comfort in residential buildings and suggested to modify window design parameters (e.g., the size and position of windows) for improving indoor thermal comfort. Shi Xing et al. [15] exhibited the applications of a wind environmental evaluation method based on a practical urban-planning case. The evaluation standards cover wind comfort, wind safety, and wind amplification coefficient and provide references for evaluating wind environment during urban planning design. Li Tang [16] discussed the wind environment in historical clusters in China by CFD technique and evaluated the construction experiences of villages in location selection, layout, and landscape adaptation to wind environment. However, the effects of FAR on the wind environment in villages were not studied. C.W. Tsang [17] studied the effects of high-rise buildings on wind environment and indicated that high and wide buildings are disadvantageous for wind environment. However, the effects of macroscopic factors on wind environment were not analyzed. Akashi Mochida [18] explored the considerable influences of a tree–
vehicle canopy model on the turbulence field in street canyons. P.J. Jones [19] introduced two evaluation methods for wind environment, namely, wind tunnel scale modeling and numerical calculation. The application of CFD technology in actual wind environment has to be verified. Nevertheless, the influencing factors of wind environment were not discussed.
The above-mentioned studies have mainly focused on the morphological layout of wind environment and the influences of building details on the ventilation in residential districts. On the contrary, only a few studies have discussed the influences of macroscopic factors on FAR and the quantitative relationship between FAR and wind environment. In the current study, a simulation building model was constructed on the basis of computer numerical simulation and data statistics. The wind environmental characteristics in residential districts under different FARs were discussed using the AWSR and air age as evaluation indexes. The quantitative relationship between FAR and wind environment in residential districts was studied. The results provide references to improve the building layout and wind environment in residential districts.
The remainder of the study is organized as follows. Section 3 describes the hypothesized cases in a residential district and constructs a building calculation model of residual districts with different FARs. Section 4 analyzes the wind environment in the constructed model through computer numerical simulation. The distribution of WSR and the statistical distribution characteristics of air age under different simulation cases are disclosed. The strategies to improve the wind environment in residential districts are proposed. Section 5 elaborates the conclusions. 3. Methodology 3.1 Description of simulation cases FAR refers to the ratio between the total ground floor area and land area of one residential district. This ratio is an important index to measure land use intensity for construction projects. FAR involves the residential comfort of residents. In this section, the determinant building layout in a residential district was used as the prototype, and five different FARs were assumed for the follow-up simulation study. The base area of the residential district was kept constant (160 m×160 m) under all simulation cases. Table 1 shows the building layout. Table 1. Simulation cases with different FAR in a residential district
Cases Building volume (m)
Fore-and-aft spacing (m)
Lateral spacing (m) FAR
1 15×30×9 33 35 0.63 2 15×30×15 33 35 1.05 3 15×30×21 33 35 1.48 4 15×30×27 33 35 1.90 5 15×30×33 33 35 2.32 A total of 12 buildings with different heights were set in a residential district in the studies of the influences of FAR on wind environment. The FAR of the residential district was adjusted by changing the heights of buildings, and the base area of buildings was set to 15×30 m.
Li Li, Xuesong Yang and Yi Qian/Journal of Engineering Science and Technology Review 11 (5) (2018) 185 – 192
187
3.2 Domain size and grid generation The size of the computational domain should be set to prevent any diverse effect of the surrounding boundaries, such as reverse airflow, which causes the solution to diverge. Several recommendations have been made depending on the case under investigation. Cheng-Hu and Wang [20] used a separation distance between the boundary and building blocks that was thrice the overall depth (or width) of a building and five times its maximum height. However, a trial-and-error process was recommended at the beginning of the study to determine the most appropriate size that would lead to solution conversion using an acceptable mesh size. The domain size 4.8 (W) × 3.5 (L) × 5 (H) is determined appropriate for this study, where L denotes the overall length of the building blocks (160 m), W denotes the overall width of the building blocks (160 m), and H denotes the uniform height of the buildings (20 m).
For the implemented mesh size, horizontal and vertical hierarchies are created to ensure reasonable file sizes and computing time. To achieve this objective, a hexagonal nonstructural meshing scheme is adopted. Relatively coarse meshes are commonly used in built environment simulation cases given that a fine mesh is ensured at datum level. However, a high resolution is ensured in the current study because a mesh size limit of 62.2 10× cells is maintained. 3.3 Boundary conditions The boundary conditions implemented in this study are the inlet and outflow of the atmospheric boundary layer. To set the velocity in the inlet boundary condition, wind velocity variation along the solution domain height should be
considered. This factor is highly dependent on terrain roughness. For example, wind speed is considerably lower in a city terrain than in an open country terrain. The variation of wind velocity with height is given in the following equation:
1.5 1.5
α⎛ ⎞
= ⎜ ⎟⎝ ⎠
zzVV (1)
where zV is the mean reference wind speed (2.8 m/s in this study), 1.5 is the datum point height, 1.5V is the relative wind speed at pedestrian height, z is the reference height, and α indicates terrain roughness (0.2 in the case of an urban terrain). The outlet boundary conditions are set as free-flow boundaries. The top and sides are set as non-sliding wall boundary conditions. 3.4 Turbulence model and convergence criteria In addition to velocity magnitude, the turbulence parameters at the inlet should be defined. These parameters are essential for processing the solution using turbulence models, such as the renormalization group (RNG) k-epsilon model. In this two-equation turbulence model, two separate transport equations are solved to determine the value of the turbulent kinetic energy, k, and its dissipation rate, epsilon. This model is commonly used in simulating buildings where wind environment is highly turbulent. The RNG k-epsilon model is implemented as follows in this study:
( ) ( )i k e ff k bi i
kk ku u G Gt x xj xρ ρ α ρε
⎛ ⎞∂ ∂ ∂ ∂+ = + + −⎜ ⎟
∂ ∂ ∂ ∂⎝ ⎠ (2)
( ) ( ) ( )2
1 3 2ε ε ε εε ε ε
ρε ρε α ρ ε⎛ ⎞∂ ∂ ∂ ∂
+ = + + − + −⎜ ⎟∂ ∂ ∂ ∂⎝ ⎠
i e ff k b ki i
u u C G C G C G Rt x xi x k k
(3)
where kG represents the turbulent kinetic energy k due to
the average velocity gradient; bG represents the turbulent kinetic energy k due to the buoyant force; kα and εα are the Prandtl numbers that correspond to the turbulent kinetic energy k and the dissipation rate ε , respectively, where
kα and εα correspond to 1.39; 1C ε =1.42; and 2C ε =1.68. In CFD simulation, a solution is converged when the
user-defined convergence criteria are met. The specification of the convergence criteria depends on the problem under investigation and the desired output accuracy. Although a convergence of the scaled residuals to 10−5 is acceptable in most cases, performing a convergence study to examine the effects of the adopted criteria on the results is highly recommended.
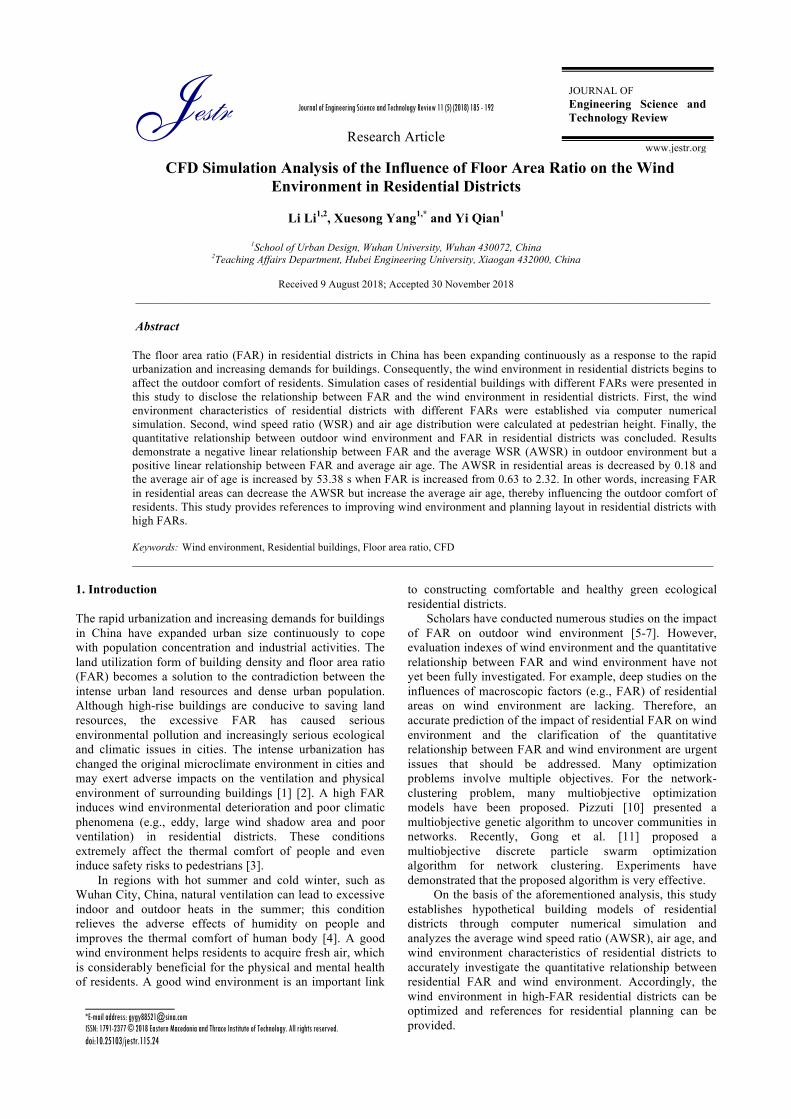
4 Results analysis and discussion 4.1 Simulation case 1 (FAR=0.63) The contour and cloud maps of WSR and air age distribution under simulation case 1 (FAR=0.63) are shown in Fig. 1. When the FAR is 0.63, the aspect ratio between the left and right buildings reaches the minimum (0.26), and the fore-and-apt spacing/floor height is 3.67 (it is considerably higher
than the daylight coefficient of local buildings). The contour map of WSR shows that airflow can arrive at low positions smoothly due to the minimum aspect ratio between the left and right buildings. The WSRs of both buildings are higher than 1.0. The maximum fore-and-apt spacing/floor height provides smooth ventilation in the space between the front and rear buildings. An eddy region with a small WSR is only observed at the corner of buildings. A large wind shadow region is formed on the leeside of the last row of buildings.
The cloud map of air age reveals that air age distributes uniformly in the entire residential district. The air age on the windward surface is small (<100s). The air age increases gradually along the dominant wind direction and reaches the maximum (approximately 200s) on the leeside of the last row of buildings.
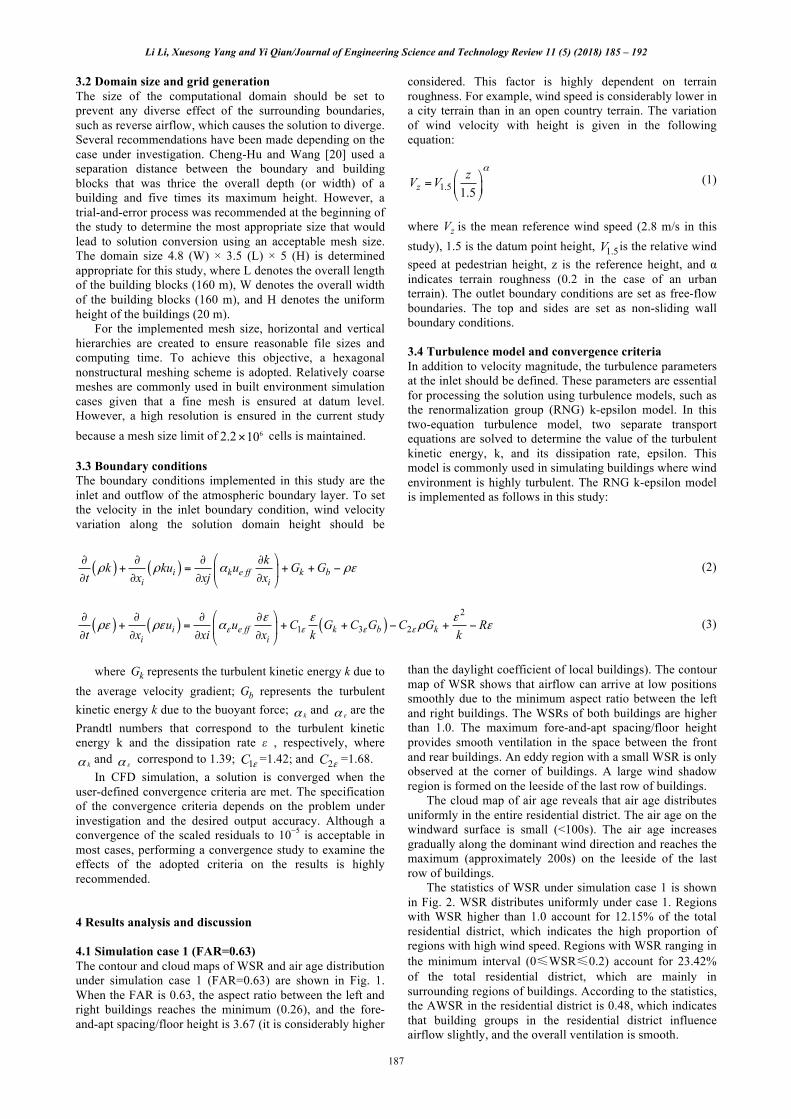
The statistics of WSR under simulation case 1 is shown in Fig. 2. WSR distributes uniformly under case 1. Regions with WSR higher than 1.0 account for 12.15% of the total residential district, which indicates the high proportion of regions with high wind speed. Regions with WSR ranging in the minimum interval (0≤WSR≤0.2) account for 23.42% of the total residential district, which are mainly in surrounding regions of buildings. According to the statistics, the AWSR in the residential district is 0.48, which indicates that building groups in the residential district influence airflow slightly, and the overall ventilation is smooth.
Li Li, Xuesong Yang and Yi Qian/Journal of Engineering Science and Technology Review 11 (5) (2018) 185 – 192
188
Fig. 1. Cloud maps of WSR and air age distribution under simulation case 1
Fig. 2. Statistical distribution of WSR in Case 1
The statistics of air age (MAA) under simulation case 1 is shown in Fig. 3. The proportion of MAA interval (>200 s) is only 1.05%. The proportion of maximum MAA interval (150–200 s) reaches 43.48%, and the proportion of MAA interval (<150 s) is 74.25%. These results reveal the small MAA and high air quality in the entire residential district. The average MAA (AMAA) is 123.42 s, which proves the general accessibility of fresh air in the residential district.
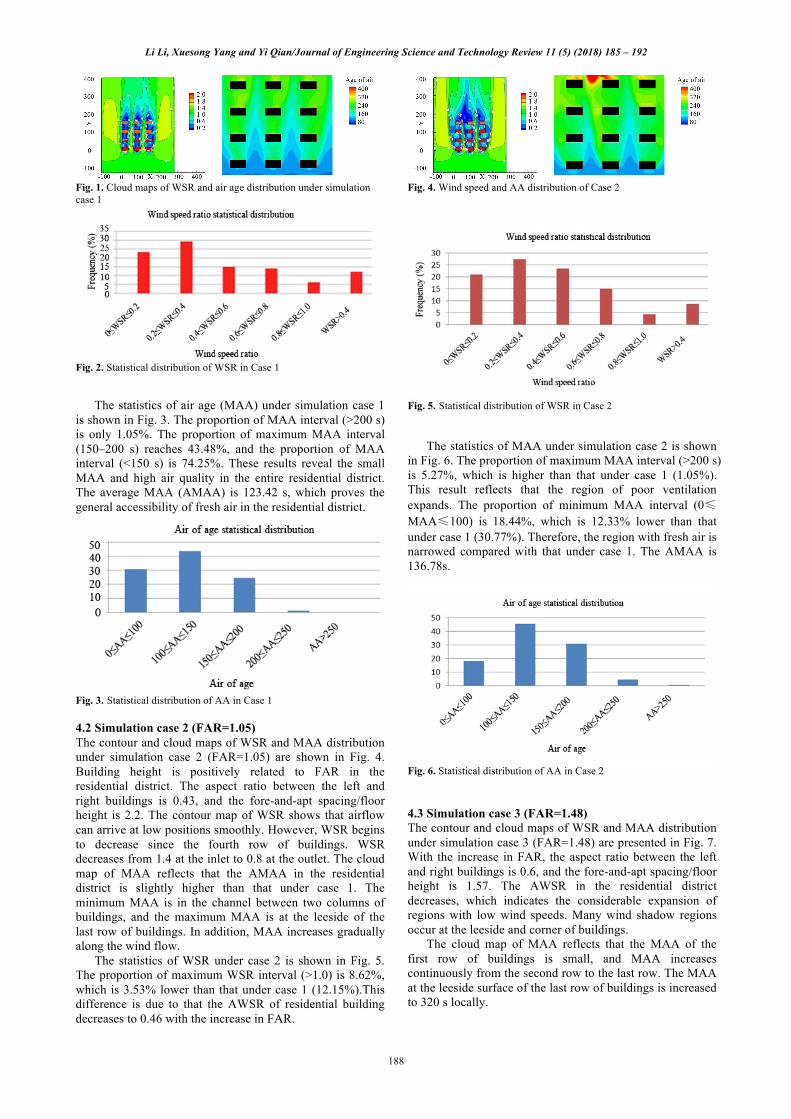
Fig. 3. Statistical distribution of AA in Case 1 4.2 Simulation case 2 (FAR=1.05) The contour and cloud maps of WSR and MAA distribution under simulation case 2 (FAR=1.05) are shown in Fig. 4. Building height is positively related to FAR in the residential district. The aspect ratio between the left and right buildings is 0.43, and the fore-and-apt spacing/floor height is 2.2. The contour map of WSR shows that airflow can arrive at low positions smoothly. However, WSR begins to decrease since the fourth row of buildings. WSR decreases from 1.4 at the inlet to 0.8 at the outlet. The cloud map of MAA reflects that the AMAA in the residential district is slightly higher than that under case 1. The minimum MAA is in the channel between two columns of buildings, and the maximum MAA is at the leeside of the last row of buildings. In addition, MAA increases gradually along the wind flow.
The statistics of WSR under case 2 is shown in Fig. 5. The proportion of maximum WSR interval (>1.0) is 8.62%, which is 3.53% lower than that under case 1 (12.15%).This difference is due to that the AWSR of residential building decreases to 0.46 with the increase in FAR.
Fig. 4. Wind speed and AA distribution of Case 2
Fig. 5. Statistical distribution of WSR in Case 2
The statistics of MAA under simulation case 2 is shown
in Fig. 6. The proportion of maximum MAA interval (>200 s) is 5.27%, which is higher than that under case 1 (1.05%). This result reflects that the region of poor ventilation expands. The proportion of minimum MAA interval (0≤MAA≤100) is 18.44%, which is 12.33% lower than that under case 1 (30.77%). Therefore, the region with fresh air is narrowed compared with that under case 1. The AMAA is 136.78s.
Fig. 6. Statistical distribution of AA in Case 2 4.3 Simulation case 3 (FAR=1.48) The contour and cloud maps of WSR and MAA distribution under simulation case 3 (FAR=1.48) are presented in Fig. 7. With the increase in FAR, the aspect ratio between the left and right buildings is 0.6, and the fore-and-apt spacing/floor height is 1.57. The AWSR in the residential district decreases, which indicates the considerable expansion of regions with low wind speeds. Many wind shadow regions occur at the leeside and corner of buildings.
The cloud map of MAA reflects that the MAA of the first row of buildings is small, and MAA increases continuously from the second row to the last row. The MAA at the leeside surface of the last row of buildings is increased to 320 s locally.
Li Li, Xuesong Yang and Yi Qian/Journal of Engineering Science and Technology Review 11 (5) (2018) 185 – 192
189
Fig. 7. Wind speed and AA distribution of Case 3
The statistics of WSR under simulation case 3 is shown in Fig. 8. The maximum WSR interval (>1.0) accounts for 7.72%, which is slightly smaller than that under case 2 (8.62%). The small WSR interval (0≤WSR≤0.4) accounts for 53.70% of the total WSR, which is slightly higher than that under case 2 (48.49%). This result is due to that the AWSR of residential buildings decreases again with the increase in FAR. The AWSR is 0.42.
Fig. 8. Statistical distribution of WSR in Case 3
The statistics of MAA under simulation case 3 is presented in Fig. 9. The proportion of maximum MAA interval (>200 s) is 15.84%, which is nearly 10% higher than that under case 2 (5.27%). This result reflects that the region of poor ventilation is expanded. The proportion of minimum MAA interval (0≤MAA≤100) is 12.32%, which is lower than that under case 2 (18.44%). Thus, the region with fresh air narrows relative to that under case 2. The MAA of the entire residential district increases continuously, and the AMAA is 157.02 s.
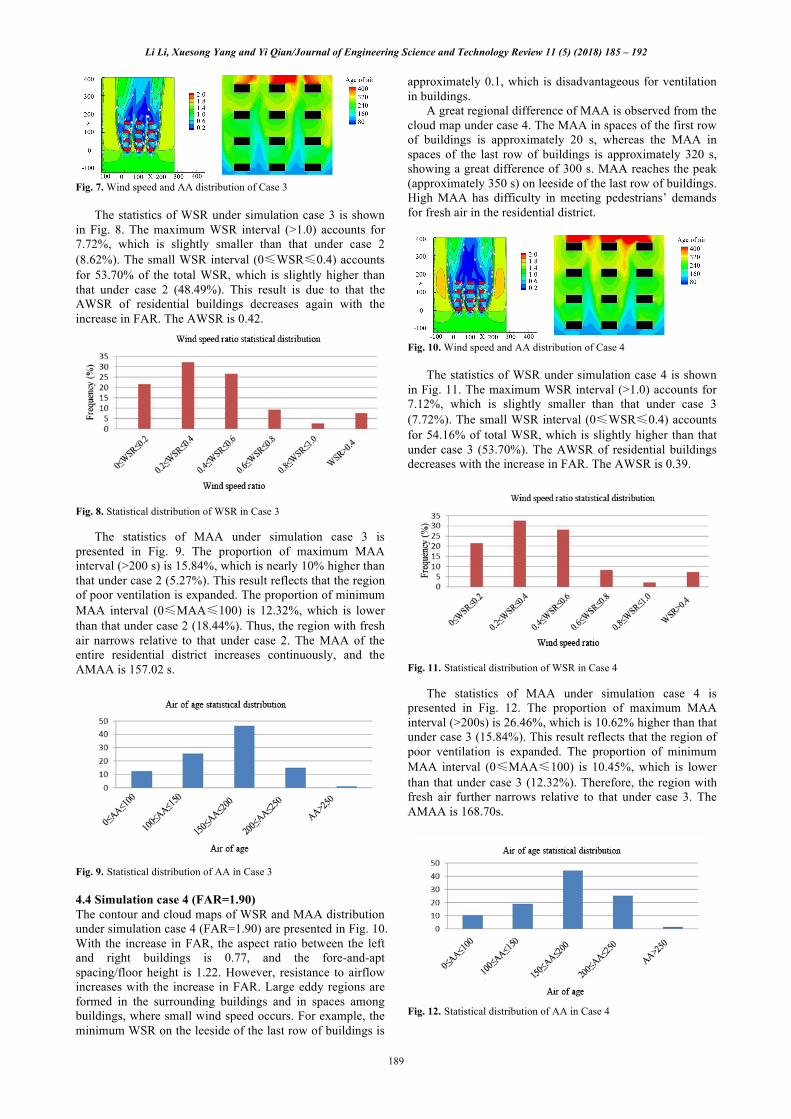
Fig. 9. Statistical distribution of AA in Case 3 4.4 Simulation case 4 (FAR=1.90) The contour and cloud maps of WSR and MAA distribution under simulation case 4 (FAR=1.90) are presented in Fig. 10. With the increase in FAR, the aspect ratio between the left and right buildings is 0.77, and the fore-and-apt spacing/floor height is 1.22. However, resistance to airflow increases with the increase in FAR. Large eddy regions are formed in the surrounding buildings and in spaces among buildings, where small wind speed occurs. For example, the minimum WSR on the leeside of the last row of buildings is
approximately 0.1, which is disadvantageous for ventilation in buildings.
A great regional difference of MAA is observed from the cloud map under case 4. The MAA in spaces of the first row of buildings is approximately 20 s, whereas the MAA in spaces of the last row of buildings is approximately 320 s, showing a great difference of 300 s. MAA reaches the peak (approximately 350 s) on leeside of the last row of buildings. High MAA has difficulty in meeting pedestrians’ demands for fresh air in the residential district.
Fig. 10. Wind speed and AA distribution of Case 4
The statistics of WSR under simulation case 4 is shown
in Fig. 11. The maximum WSR interval (>1.0) accounts for 7.12%, which is slightly smaller than that under case 3 (7.72%). The small WSR interval (0≤WSR≤0.4) accounts for 54.16% of total WSR, which is slightly higher than that under case 3 (53.70%). The AWSR of residential buildings decreases with the increase in FAR. The AWSR is 0.39.
Fig. 11. Statistical distribution of WSR in Case 4
The statistics of MAA under simulation case 4 is presented in Fig. 12. The proportion of maximum MAA interval (>200s) is 26.46%, which is 10.62% higher than that under case 3 (15.84%). This result reflects that the region of poor ventilation is expanded. The proportion of minimum MAA interval (0≤MAA≤100) is 10.45%, which is lower than that under case 3 (12.32%). Therefore, the region with fresh air further narrows relative to that under case 3. The AMAA is 168.70s.
Fig. 12. Statistical distribution of AA in Case 4
Li Li, Xuesong Yang and Yi Qian/Journal of Engineering Science and Technology Review 11 (5) (2018) 185 – 192
190
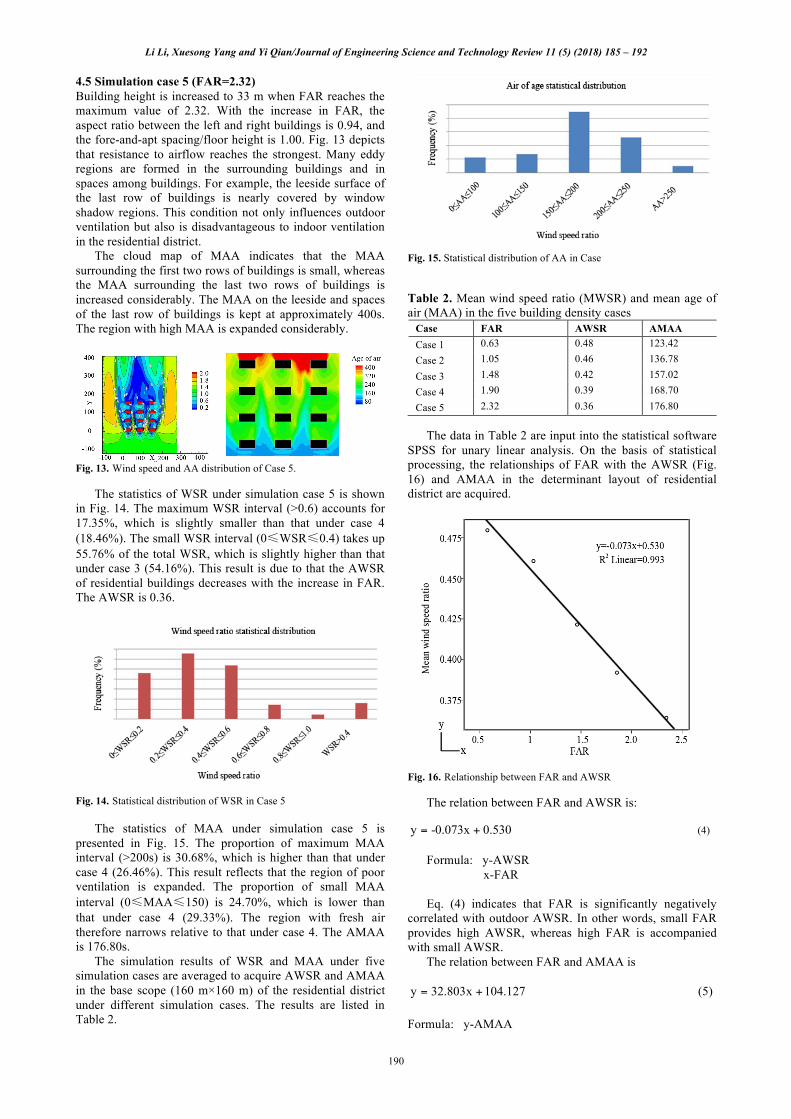
4.5 Simulation case 5 (FAR=2.32) Building height is increased to 33 m when FAR reaches the maximum value of 2.32. With the increase in FAR, the aspect ratio between the left and right buildings is 0.94, and the fore-and-apt spacing/floor height is 1.00. Fig. 13 depicts that resistance to airflow reaches the strongest. Many eddy regions are formed in the surrounding buildings and in spaces among buildings. For example, the leeside surface of the last row of buildings is nearly covered by window shadow regions. This condition not only influences outdoor ventilation but also is disadvantageous to indoor ventilation in the residential district.
The cloud map of MAA indicates that the MAA surrounding the first two rows of buildings is small, whereas the MAA surrounding the last two rows of buildings is increased considerably. The MAA on the leeside and spaces of the last row of buildings is kept at approximately 400s. The region with high MAA is expanded considerably.
Fig. 13. Wind speed and AA distribution of Case 5. The statistics of WSR under simulation case 5 is shown in Fig. 14. The maximum WSR interval (>0.6) accounts for 17.35%, which is slightly smaller than that under case 4 (18.46%). The small WSR interval (0≤WSR≤0.4) takes up 55.76% of the total WSR, which is slightly higher than that under case 3 (54.16%). This result is due to that the AWSR of residential buildings decreases with the increase in FAR. The AWSR is 0.36.
Fig. 14. Statistical distribution of WSR in Case 5
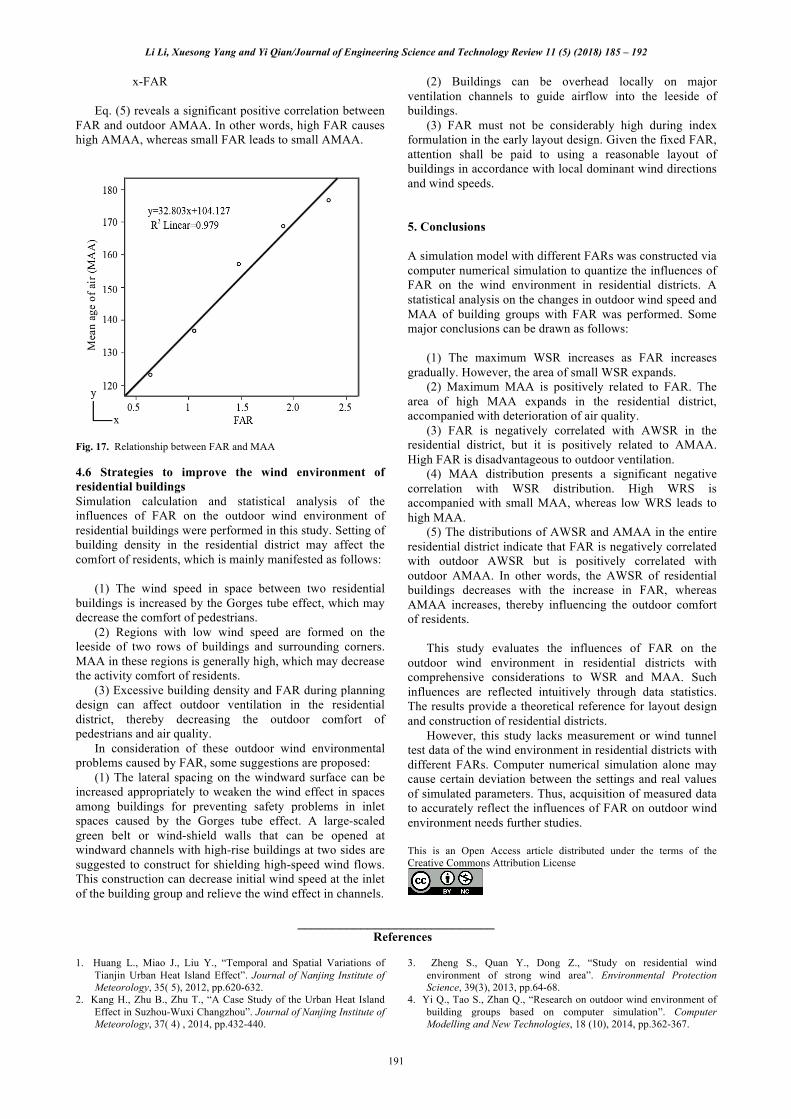
The statistics of MAA under simulation case 5 is presented in Fig. 15. The proportion of maximum MAA interval (>200s) is 30.68%, which is higher than that under case 4 (26.46%). This result reflects that the region of poor ventilation is expanded. The proportion of small MAA interval (0≤MAA≤150) is 24.70%, which is lower than that under case 4 (29.33%). The region with fresh air therefore narrows relative to that under case 4. The AMAA is 176.80s.
The simulation results of WSR and MAA under five simulation cases are averaged to acquire AWSR and AMAA in the base scope (160 m×160 m) of the residential district under different simulation cases. The results are listed in Table 2.
Fig. 15. Statistical distribution of AA in Case
Table 2. Mean wind speed ratio (MWSR) and mean age of air (MAA) in the five building density cases
Case FAR AWSR AMAA Case 1 0.63 0.48 123.42 Case 2 1.05 0.46 136.78
Case 3 1.48 0.42 157.02
Case 4 1.90 0.39 168.70
Case 5 2.32 0.36 176.80 The data in Table 2 are input into the statistical software
SPSS for unary linear analysis. On the basis of statistical processing, the relationships of FAR with the AWSR (Fig. 16) and AMAA in the determinant layout of residential district are acquired.
Fig. 16. Relationship between FAR and AWSR
The relation between FAR and AWSR is:
y -0.073x 0.530= + (4)
Formula: y-AWSR x-FAR Eq. (4) indicates that FAR is significantly negatively
correlated with outdoor AWSR. In other words, small FAR provides high AWSR, whereas high FAR is accompanied with small AWSR. The relation between FAR and AMAA is y 32.803x 104.127= + (5) Formula: y-AMAA
Li Li, Xuesong Yang and Yi Qian/Journal of Engineering Science and Technology Review 11 (5) (2018) 185 – 192
191
x-FAR
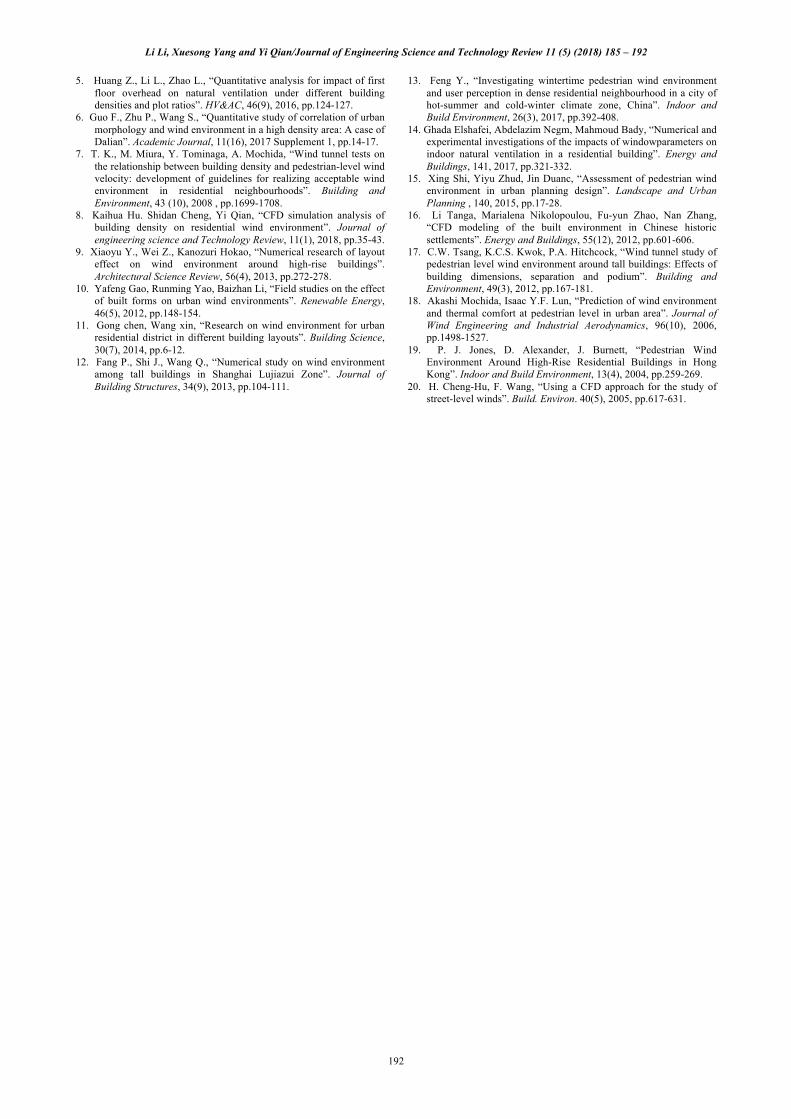
Eq. (5) reveals a significant positive correlation between FAR and outdoor AMAA. In other words, high FAR causes high AMAA, whereas small FAR leads to small AMAA.
Fig. 17. Relationship between FAR and MAA 4.6 Strategies to improve the wind environment of residential buildings Simulation calculation and statistical analysis of the influences of FAR on the outdoor wind environment of residential buildings were performed in this study. Setting of building density in the residential district may affect the comfort of residents, which is mainly manifested as follows:
(1) The wind speed in space between two residential buildings is increased by the Gorges tube effect, which may decrease the comfort of pedestrians.
(2) Regions with low wind speed are formed on the leeside of two rows of buildings and surrounding corners. MAA in these regions is generally high, which may decrease the activity comfort of residents.
(3) Excessive building density and FAR during planning design can affect outdoor ventilation in the residential district, thereby decreasing the outdoor comfort of pedestrians and air quality.
In consideration of these outdoor wind environmental problems caused by FAR, some suggestions are proposed:
(1) The lateral spacing on the windward surface can be increased appropriately to weaken the wind effect in spaces among buildings for preventing safety problems in inlet spaces caused by the Gorges tube effect. A large-scaled green belt or wind-shield walls that can be opened at windward channels with high-rise buildings at two sides are suggested to construct for shielding high-speed wind flows. This construction can decrease initial wind speed at the inlet of the building group and relieve the wind effect in channels.
(2) Buildings can be overhead locally on major ventilation channels to guide airflow into the leeside of buildings.
(3) FAR must not be considerably high during index formulation in the early layout design. Given the fixed FAR, attention shall be paid to using a reasonable layout of buildings in accordance with local dominant wind directions and wind speeds.
5. Conclusions A simulation model with different FARs was constructed via computer numerical simulation to quantize the influences of FAR on the wind environment in residential districts. A statistical analysis on the changes in outdoor wind speed and MAA of building groups with FAR was performed. Some major conclusions can be drawn as follows:
(1) The maximum WSR increases as FAR increases gradually. However, the area of small WSR expands.
(2) Maximum MAA is positively related to FAR. The area of high MAA expands in the residential district, accompanied with deterioration of air quality.
(3) FAR is negatively correlated with AWSR in the residential district, but it is positively related to AMAA. High FAR is disadvantageous to outdoor ventilation.
(4) MAA distribution presents a significant negative correlation with WSR distribution. High WRS is accompanied with small MAA, whereas low WRS leads to high MAA.
(5) The distributions of AWSR and AMAA in the entire residential district indicate that FAR is negatively correlated with outdoor AWSR but is positively correlated with outdoor AMAA. In other words, the AWSR of residential buildings decreases with the increase in FAR, whereas AMAA increases, thereby influencing the outdoor comfort of residents.
This study evaluates the influences of FAR on the
outdoor wind environment in residential districts with comprehensive considerations to WSR and MAA. Such influences are reflected intuitively through data statistics. The results provide a theoretical reference for layout design and construction of residential districts.
However, this study lacks measurement or wind tunnel test data of the wind environment in residential districts with different FARs. Computer numerical simulation alone may cause certain deviation between the settings and real values of simulated parameters. Thus, acquisition of measured data to accurately reflect the influences of FAR on outdoor wind environment needs further studies.
This is an Open Access article distributed under the terms of the Creative Commons Attribution License
____________________________
References
1. Huang L., Miao J., Liu Y., “Temporal and Spatial Variations of Tianjin Urban Heat Island Effect”. Journal of Nanjing Institute of Meteorology, 35( 5), 2012, pp.620-632.
2. Kang H., Zhu B., Zhu T., “A Case Study of the Urban Heat Island Effect in Suzhou-Wuxi Changzhou”. Journal of Nanjing Institute of Meteorology, 37( 4) , 2014, pp.432-440.
3. Zheng S., Quan Y., Dong Z., “Study on residential wind environment of strong wind area”. Environmental Protection Science, 39(3), 2013, pp.64-68.
4. Yi Q., Tao S., Zhan Q., “Research on outdoor wind environment of building groups based on computer simulation”. Computer Modelling and New Technologies, 18 (10), 2014, pp.362-367.
Li Li, Xuesong Yang and Yi Qian/Journal of Engineering Science and Technology Review 11 (5) (2018) 185 – 192
192
5. Huang Z., Li L., Zhao L., “Quantitative analysis for impact of first floor overhead on natural ventilation under different building densities and plot ratios”. HV&AC, 46(9), 2016, pp.124-127.
6. Guo F., Zhu P., Wang S., “Quantitative study of correlation of urban morphology and wind environment in a high density area: A case of Dalian”. Academic Journal, 11(16), 2017 Supplement 1, pp.14-17.
7. T. K., M. Miura, Y. Tominaga, A. Mochida, “Wind tunnel tests on the relationship between building density and pedestrian-level wind velocity: development of guidelines for realizing acceptable wind environment in residential neighbourhoods”. Building and Environment, 43 (10), 2008 , pp.1699-1708.
8. Kaihua Hu. Shidan Cheng, Yi Qian, “CFD simulation analysis of building density on residential wind environment”. Journal of engineering science and Technology Review, 11(1), 2018, pp.35-43.
9. Xiaoyu Y., Wei Z., Kanozuri Hokao, “Numerical research of layout effect on wind environment around high-rise buildings”. Architectural Science Review, 56(4), 2013, pp.272-278.
10. Yafeng Gao, Runming Yao, Baizhan Li, “Field studies on the effect of built forms on urban wind environments”. Renewable Energy, 46(5), 2012, pp.148-154.
11. Gong chen, Wang xin, “Research on wind environment for urban residential district in different building layouts”. Building Science, 30(7), 2014, pp.6-12.
12. Fang P., Shi J., Wang Q., “Numerical study on wind environment among tall buildings in Shanghai Lujiazui Zone”. Journal of Building Structures, 34(9), 2013, pp.104-111.
13. Feng Y., “Investigating wintertime pedestrian wind environment and user perception in dense residential neighbourhood in a city of hot-summer and cold-winter climate zone, China”. Indoor and Build Environment, 26(3), 2017, pp.392-408.
14. Ghada Elshafei, Abdelazim Negm, Mahmoud Bady, “Numerical and experimental investigations of the impacts of windowparameters on indoor natural ventilation in a residential building”. Energy and Buildings, 141, 2017, pp.321-332.
15. Xing Shi, Yiyu Zhud, Jin Duanc, “Assessment of pedestrian wind environment in urban planning design”. Landscape and Urban Planning , 140, 2015, pp.17-28.
16. Li Tanga, Marialena Nikolopoulou, Fu-yun Zhao, Nan Zhang, “CFD modeling of the built environment in Chinese historic settlements”. Energy and Buildings, 55(12), 2012, pp.601-606.
17. C.W. Tsang, K.C.S. Kwok, P.A. Hitchcock, “Wind tunnel study of pedestrian level wind environment around tall buildings: Effects of building dimensions, separation and podium”. Building and Environment, 49(3), 2012, pp.167-181.
18. Akashi Mochida, Isaac Y.F. Lun, “Prediction of wind environment and thermal comfort at pedestrian level in urban area”. Journal of Wind Engineering and Industrial Aerodynamics, 96(10), 2006, pp.1498-1527.
19. P. J. Jones, D. Alexander, J. Burnett, “Pedestrian Wind Environment Around High-Rise Residential Buildings in Hong Kong”. Indoor and Build Environment, 13(4), 2004, pp.259-269.
20. H. Cheng-Hu, F. Wang, “Using a CFD approach for the study of street-level winds”. Build. Environ. 40(5), 2005, pp.617-631.