Embed Size (px)
Citation preview

7/31/2019 CFD of a Catalytic Micro-Monolith
http://slidepdf.com/reader/full/cfd-of-a-catalytic-micro-monolith 1/22
INTERNATIONAL JOURNAL OF CHEMICAL
REACTOR ENGINEERING
Volume 9 2011 Article A21
CFD Modeling and Simulation of a
Catalytic Micro-Monolith
Almerinda Di Benedetto∗ Valeria Di Sarli†
∗National Research Council, [email protected]†National Research Council, [email protected]
ISSN 1542-6580
Copyright c2011 The Berkeley Electronic Press. All rights reserved.
7/31/2019 CFD of a Catalytic Micro-Monolith
http://slidepdf.com/reader/full/cfd-of-a-catalytic-micro-monolith 2/22
CFD Modeling and Simulation of a Catalytic
Micro-Monolith
Almerinda Di Benedetto and Valeria Di Sarli
Abstract
In this work, a first step in modeling and simulating the thermal behavior of
an entire catalytic micro-monolith was performed. In particular, a Computational
Fluid Dynamics (CFD) model was developed for simulating three-channel andfive-channel micro-combustors. For both configurations, the operating maps were
built as functions of the inlet gas velocity and compared to the operating map of a
single-channel configuration.
Results show that, due to the relevance of heat losses in micro-devices, it is not
possible to extrapolate the behavior of the multi-channel configurations from that
of the single channel. Therefore, simulation of the entire catalytic micro-monolith
is needed. However, this is computationally demanding: it has been found that the
CPU time almost linearly increases with the number of channels simulated.
Finally, for a fixed total mass flow rate, it has been demonstrated the opportunityto maximize the overall fuel conversion by means of a non-uniform distribution
of mass flow rates among the channels.
KEYWORDS: catalytic micro-monolith, multi-channel configuration, CFD

7/31/2019 CFD of a Catalytic Micro-Monolith
http://slidepdf.com/reader/full/cfd-of-a-catalytic-micro-monolith 3/22
1. Introduction
Catalytic monoliths are continuous structures made of a large number of straight parallel and thin channels with walls coated by catalyst. They are used in many practical applications, especially those involving oxidation of hydrocarbons in fastheterogeneous reactions (see, e.g., Hayes and Kolaczkowski, 1994; Groppi et al.,1999; Donsì et al., 2002).
Nowadays, a further relevant application has been proposed in micro-electro-mechanical-systems (MEMS). In such application, micro-scale monolithsare used to promote catalytic combustion in channels with typical values of thediameter equal to around 600 m. Catalytic micro-combustors have to face theissues of thermal management and control in order to achieve stable steady-stateconditions, prevent extinction and blow-out, and avoid hot spots, traveling heat
waves and wrong way behaviors.Due to the geometry scale, catalytic micro-combustors do not lendthemselves easily to detailed experimental diagnostics for measurements of temperature, concentration and velocity fields. Therefore, designing such micro-combustors is mainly pursued by means of mathematical modeling andsimulation.
Modeling catalytic monoliths can be performed at different scales:catalyst, single-channel, multi-channel and entire reactor scale. For catalyticmacro-combustors, models have been developed at all relevant scales: from thecatalyst scale, to the single-channel, multi-channel and reactor scales (see, e.g.,Kolaczkowski and Worth, 1995; Jahn et al., 1997; Jeong et al., 2002; James et al.,
2003; Tischer and Deutschmann, 2005; Di Benedetto et al., 2006; Mei et al.,2006). It has been demonstrated that modeling a single channel of the monolithcan be inadequate when the effects of non-uniform distribution at the inletsection, catalyst deactivation and/or heat losses toward the external environmentare relevant (Kolaczkowski and Worth, 1995; Jahn et al., 1997; Jeong et al., 2002;James et al., 2003; Mei et al., 2006).
The literature models for catalytic micro-combustors are based on thesingle-channel assumption (see, e.g., Spadaccini et al., 2007; Kaisare et al., 2008;Di Benedetto et al., 2009; 2010a; 2010b). It has been widely shown that thethermal management in such reactors is crucial, especially with regard to the roleof heat losses toward the external environment. This issue limits the application of
catalytic micro-combustors to low values of inlet gas velocities and, thus, input power densities.
Di Benedetto and Di Sarli: CFD of a Catalytic Micro-Monolith
Published by The Berkeley Electronic Press, 2

7/31/2019 CFD of a Catalytic Micro-Monolith
http://slidepdf.com/reader/full/cfd-of-a-catalytic-micro-monolith 4/22
to the operating map of a single-channel configuration.To this end, a continuation analysis was performed by means of direct
Computational Fluid Dynamics (CFD) simulations of the catalytic micro-reactor.We started from a stable steady-state solution and then continued the solution branch changing the inlet gas velocity, eventually building the entire operatingmap for the catalytic micro-combustor.
Furthermore, for a fixed value of total mass flow rate, the opportunity tofeed the channels of the five-channel micro-combustor with different mass flowrates was investigated in order to maximize the global fuel conversion and, thus,the output power density.
2. The Model
A two-dimensional CFD model was developed to simulate the coupling of thefluid flow and the chemical processes at the gas-solid interface and in the gas phase for lean propane/air combustion. Figure 1 shows the schemes of thecatalytic micro-combustors with three (A) and five (B) channels.
Each channel consists of two parallel (infinitely wide) plates (gapdistance, d = 600 m; wall thickness, d w = 200 m; total length, L = 10 mm). Theschemes of Figure 1 are symmetric (the dashed line is the symmetry line).
Therefore, the computational domain corresponds to the half of each scheme.For each channel, the model solves the mass, momentum, chemicalspecies and energy conservation equations in the fluid, along with the energyequation in the solid wall. Steady-state computations were carried out.
In this work, a first step in modeling and simulating the thermal behavior of an entire catalytic micro-monolith was performed. In particular, we focused onthree-channel and five-channel micro-combustors. For both configurations, we
built the operating maps as functions of the inlet gas velocity, and compared them
2 International Journal of Chemical Reactor Engineering Vol. 9 [2011], Article A
http://www.bepress.com/ijcre/vol9/A21

7/31/2019 CFD of a Catalytic Micro-Monolith
http://slidepdf.com/reader/full/cfd-of-a-catalytic-micro-monolith 5/22
Figure 1 – Schemes of the catalytic micro-combustors with three (A) and five (B)
channels.
d
dw
L
vin, Tin, yin wall_1
wall_2
wall_4
wall_3
A
d
dw
L
vin, Tin, yin wall_1
wall_2
wall_4
wall_3
wall_6
wall_5
B
Di Benedetto and Di Sarli: CFD of a Catalytic Micro-Monolith
Published by The Berkeley Electronic Press, 2

7/31/2019 CFD of a Catalytic Micro-Monolith
http://slidepdf.com/reader/full/cfd-of-a-catalytic-micro-monolith 6/22
The conservation equations in the fluid are listed below (conventionalnotation is adopted):
Continuity
0
y
v
x
v
yv
xv
y x y x
(1)
Momentum
y x x
p
y
vv
x
vv yx xx y x x x
(2)
y x y
p
y
vv
x
vv yy xy y y y x
(3)
Species (i = 1,....., N s - 1, with N s species number)
, , , y i x i i i
i m i m Hom i
v Y v Y Y Y D D R
x y x x y y
(4)
Energy
,,
,1 1
S S
y x
iii i m N i i m N
i Hom i
i i
v hv h T T
x y x x y y
Y Y h Dh D
y xh R
x y
(5)
The above equations are coupled to the ideal-gas equation:
mix pW
T
(6)
4 International Journal of Chemical Reactor Engineering Vol. 9 [2011], Article A
http://www.bepress.com/ijcre/vol9/A21

7/31/2019 CFD of a Catalytic Micro-Monolith
http://slidepdf.com/reader/full/cfd-of-a-catalytic-micro-monolith 7/22
2
2
2
2
0 y
T
x
T ww
w (7)
where w is the solid thermal conductivity.Concerning the boundary conditions, at the central line of the
configurations (dashed line in Figure 1), a condition of symmetry was assigned.At the inlet of each channel, a fixed flat velocity profile was assumed. For chemical species and energy, Danckwerts boundary conditions were used. At theexit, the static pressure was imposed as equal to the atmospheric pressure, and far-field conditions were specified for the remaining variables.
At the fluid-wall interface, a no-slip boundary condition was assigned (the
fluid has zero velocity relative to the boundary) which was coupled to the species balances (the mass flux of each species, J i, is equal to its rate of production/consumption, y,i):
i y ,i J
(8)
and the energy balance:
w
w h
T T
y y
(9)
where h is the heat surface production rate.Heat losses from the ends of the channels were not considered (insulated
ends), while Newton’s law of convection was used at the outer surface of theexternal channels:
w ,ext a ,ext q h T T (10)
where h is the exterior convective heat transfer coefficient, T w,ext is thetemperature at the exterior wall surface, and T a,ext is the external temperature(= 300 K).
The energy equation in the solid wall reads as follows:
Di Benedetto and Di Sarli: CFD of a Catalytic Micro-Monolith
Published by The Berkeley Electronic Press, 2

7/31/2019 CFD of a Catalytic Micro-Monolith
http://slidepdf.com/reader/full/cfd-of-a-catalytic-micro-monolith 8/22
3 8 2
0 1 1 65. .
v C H O
1.256 E 8 R 4.836 E 9 exp C C
T
3
kmol
m s
(11)
where the activation energy is in J/kmol and the concentrations in kmol/m3.The catalytic reaction was assumed to be irreversible, first order in fuel
concentration and zeroth order in oxygen concentration (Spadaccini et al., 2007).The reaction rate, referred to platinum as the catalyst, was calculated according to:
3 8
9 06cat C H
. E 7 R 2.4 E 5 exp C
T
2
kmol
m s
(12)
where the activation energy is in J/kmol and the concentration in kmol/m 2.The molecular viscosity was approximated through Sutherland’s law for
air viscosity. The fluid specific heat and thermal conductivity were calculated bya mass fraction weighted average of species properties. The species specific heatwas evaluated as a piecewise fifth-power polynomial function of temperature.
The model equations were discretized using a finite volume formulationon a uniform structured mesh. Grid-independent solutions were found with a cell
size equal to 2.5 E-2 mm.The spatial discretization of the model equations used second order central
differences. Computations were performed by means of the segregated pressure- based solver of the CFD code ANSYS® Fluent 6.3 (www.fluent.com). TheSIMPLE method was used for treating pressure-velocity coupling. All residualswere always smaller than 1.0 E-7.
The operating and initial conditions for simulations are summarized inTable 1 and Table 2, respectively.
The reaction rate for homogenous (volumetric) propane combustion wascalculated according to the single-step reaction rate by Westbrook and Dryer (1981):
6 International Journal of Chemical Reactor Engineering Vol. 9 [2011], Article A
http://www.bepress.com/ijcre/vol9/A21
7/31/2019 CFD of a Catalytic Micro-Monolith
http://slidepdf.com/reader/full/cfd-of-a-catalytic-micro-monolith 9/22
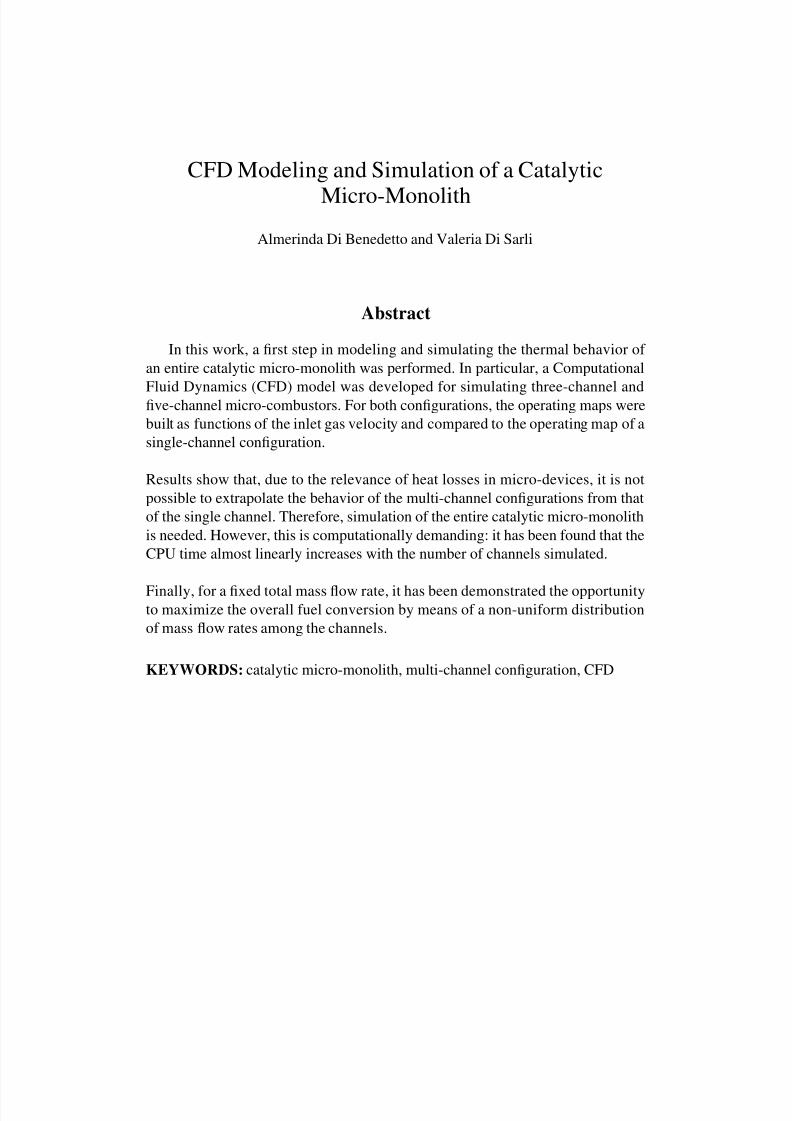
Table 1 – Operating conditions for simulations
Parameter Value
Inlet gas temperature, T in (K) 300Inlet gas velocity, vin (m/s) Varies
Inlet propane mole fraction, Y C3H8,in 0.024
Exterior convective heat transfer coefficient, h (W/m2 K)
20
Pressure, p (bar) 1
Solid thermal conductivity, w (W/m K) 2
Table 2 – Initial conditions for simulations
Parameter Value
Gas temperature, T (K) 750
Gas velocity, v (m/s) 0.5
Propane mole fraction, Y C3H8 0.024
Wall temperature, T wall (K) 750
Pressure, p (bar) 1
In Table 3, the values of the non-dimensional numbers Da1, Da2 and Pe
are given as calculated according to Spadaccini et al. (2007) in the range of inletgas velocities investigated. These values suggest that the diffusion of reactants iscontrolling (the reaction time is two orders of magnitude smaller than thediffusion time) and that reactants have enough time to contact the catalytic surface(the diffusion time is of the same order as the residence time).
Table 3 – Ranges for Da1, Da2 and Pe
Non-dimensional number Range
Da1 = residence
reaction
~ 400 - 900
Da2 = diffusion
reaction
~ 100
Pe = diffusion
residence
~ 0.1 - 0.3
Di Benedetto and Di Sarli: CFD of a Catalytic Micro-Monolith
Published by The Berkeley Electronic Press, 2

7/31/2019 CFD of a Catalytic Micro-Monolith
http://slidepdf.com/reader/full/cfd-of-a-catalytic-micro-monolith 10/22
3. Results and Discussion
In Figure 2, the propane conversion is plotted versus the inlet gas velocity ascomputed at the outlet section of all three configurations investigated. The 95 %conversion line is also shown in the figure (dashed line). It can be observed thatthe range of inlet gas velocities with conversion higher than 95 % increases ingoing from the single-channel (1_C) to the three-channel (3_C) and to the five-channel (5_C) configuration. The reason for this behavior can be found in thedifferent temperature level and, thus, degree of adiabaticity established inside thechannels of the three configurations.
Figure 2 – Propane conversion versus the inlet gas velocity as computed at theoutlet section of the three configurations investigated (the 95 % conversion line is
also shown).
In Figure 3, the axial profiles of the wall temperature of the centralchannel are shown as obtained for different configurations. The maximum walltemperature for the multi-channel (3_C and 5_C) configurations is about 600 K higher than that found with the 1_C configuration. The advantage of higher propane conversions provided by the multi-channel configurations is
vin (m/s)1 10
C o n v e r s i o n o f C 3 H 8 ( % )
20
40
60
80
100
1_C
3_C5_C
95 % conversion
8 International Journal of Chemical Reactor Engineering Vol. 9 [2011], Article A
http://www.bepress.com/ijcre/vol9/A21

7/31/2019 CFD of a Catalytic Micro-Monolith
http://slidepdf.com/reader/full/cfd-of-a-catalytic-micro-monolith 11/22
counterbalanced by the drawback of higher wall temperatures that are notsustainable by the catalyst.
Figure 3 – Axial profiles of the wall temperature of the central channel asobtained for the three configurations investigated (vin = 0.5 m/s).
In Figure 4, the temperature maps are presented for the threeconfigurations. The figure shows that also the external channels (not only theinternal ones) of the 3_C and 5_C configurations are hotter than the singlechannel. This can be attributed to the fact that the external channels are protected by the adjacent channels in which heat is produced and stored. It is also worthnoting the presence of a hot spot inside the internal channels. The hot spotdemonstrates the occurrence of the homogeneous reaction that allows completingthe propane conversion.
Central Channel
x (m)
0.000 0.002 0.004 0.006 0.008 0.010
T w a l l
( K )
900
1050
1200
1350
1500
1650
1800
3_C
1_C
5_C
Di Benedetto and Di Sarli: CFD of a Catalytic Micro-Monolith
Published by The Berkeley Electronic Press, 2

7/31/2019 CFD of a Catalytic Micro-Monolith
http://slidepdf.com/reader/full/cfd-of-a-catalytic-micro-monolith 12/22
Figure 4 – Temperature (K) maps for the three configurations investigated(vin = 0.5 m/s).
In Figure 5, the maps of the homogeneous (volumetric) reaction rate (R v)are reported as obtained for the three configurations investigated. It is shown that,due to the different boundary conditions, the external channels of both the 3_Cand 5_C configurations exhibit asymmetric profiles: the homogeneous reactionfront starts from the internal wall, which is hotter, and then propagates along thechannel, thus activating the reactive process also at the external wall.
T 1_C
3_C
5_C
10 International Journal of Chemical Reactor Engineering Vol. 9 [2011], Article A
http://www.bepress.com/ijcre/vol9/A21

7/31/2019 CFD of a Catalytic Micro-Monolith
http://slidepdf.com/reader/full/cfd-of-a-catalytic-micro-monolith 13/22
Figure 5 – Maps of the homogeneous (volumetric) reaction rate (R v) for the threeconfigurations investigated (vin = 0.5 m/s).
In Figure 6, the axial profiles of the heat exchanged toward the externalenvironment (heat losses) per unit volume are shown as computed for the threeconfigurations. It can be observed that the heat losses per unit volume are muchhigher in the case of the single channel. This result confirms the higher level of adiabaticity of the multi-channel configurations.
R v (kmol/ m3 s)
5_C 3_C 1_C
3_C
5_C
1_C
Di Benedetto and Di Sarli: CFD of a Catalytic Micro-Monolith
Published by The Berkeley Electronic Press, 2

7/31/2019 CFD of a Catalytic Micro-Monolith
http://slidepdf.com/reader/full/cfd-of-a-catalytic-micro-monolith 14/22
Figure 6 – Axial profiles of the heat losses per unit volume as computed for thethree configurations investigated (vin = 0.5 m/s).
From the above-presented results, it is clear that the behavior of the multi-
channel configurations cannot be extrapolated from the behavior of the singlechannel. Therefore, the full scale of the catalytic micro-monolith should bemodeled and simulated. The main drawback of such an approach is thecomputational cost. Table 4 gives the CPU times for a single iteration required bythe simulations of the three configurations (minimal variations for the CPU timeswere found between iterations).
Table 4 – CPU times for a single iteration required by the simulations of the threeconfigurations
Configuration CPU time (s)
1_C 0.1
3_C 0.26
5_C 0.47
x (m)
0.000 0.002 0.004 0.006 0.008 0.010
H ( W / m )
-25
-20
-15
-10
-5
0
3_C
5_C
1_C
12 International Journal of Chemical Reactor Engineering Vol. 9 [2011], Article A
http://www.bepress.com/ijcre/vol9/A21

7/31/2019 CFD of a Catalytic Micro-Monolith
http://slidepdf.com/reader/full/cfd-of-a-catalytic-micro-monolith 15/22
The CPU times for the 3_C and 5_C configurations are around three andfive times higher, respectively, than the CPU time needed by the 1_Cconfiguration.
3.1 Blow-Out
Figure 2 shows that, for the 5_C configuration, the propane conversionsignificantly decreases starting from vin = 1.67 m/s. This suggests the occurrenceof blow-out: the residence time is too low and, therefore, the reaction front isswept out of the reactor.
In Figure 7, the maps of the homogeneous reaction rate are shown asobtained at different inlet gas velocities (vin) for the 5_C configuration. When theinlet velocity is increased, the homogeneous reaction front shifts downstream: itfirst exits the external channels (v
in= 1.67 m/s) and then the internal channels
(vin = 2 m/s). The external channels exchange heat with the environment and,therefore, are colder. On the contrary, the internal channels are more adiabatic.
Figure 7 – Maps of the homogeneous reaction rate (kmol/m3 s) as obtained atdifferent inlet gas velocities (vin) for the 5_C configuration.
In Figure 8, the homogeneous and heterogeneous reaction rates are plottedversus the axial position for all channels of the 5_C configuration. Thehomogeneous reaction rate was calculated at the central line of each channel, theheterogeneous reaction rate at wall_1, wall_3 and wall_5 (Figure 1B). The figureshows that, when the inlet gas velocity is increased, the homogeneous andheterogeneous reaction fronts move along the channel up to reach the exit.
vin = 0.5 m/s vin = 1.5 m/s
vin = 2 m/svin = 1.67 m/s
Di Benedetto and Di Sarli: CFD of a Catalytic Micro-Monolith
Published by The Berkeley Electronic Press, 2

7/31/2019 CFD of a Catalytic Micro-Monolith
http://slidepdf.com/reader/full/cfd-of-a-catalytic-micro-monolith 16/22
Figure 8 – Axial profiles of the homogeneous (R v) and heterogeneous (R cat)reaction rates at different inlet gas velocities (vin) for the 5_C configuration.
vin
= 2 m/s
x (m)
0 2e-3 4e-3 6e-3 8e-3 1e-2
R v
( k m o l / m 3
s )
0.0
0.2
0.4
0.6
R c a t
( k m o l / m 2
s )
1e-7
1e-6
1e-5
1e-4
1e-3
vin
= 1.67 m/s
R v
( k m o l / m 3
s )
0.0
0.5
1.0
1.5
R
c a t
( k m o l / m 2
s )
1e-7
1e-6
1e-5
1e-4
1e-3
vin
= 1.5 m/s
R v
( k m o l / m
3 s
)
0.0
0.5
1.0
1.5
R c a t
( k m o l /
m 2
s )
1e-7
1e-6
1e-5
1e-4
1e-3
vin = 0.5 m/s
R v
( k m o l / m 3
s )
0.0
0.5
1.0
1.5
R c a t
( k m o l / m 2
s )
1e-7
1e-6
1e-5
1e-4
1e-3
wall_1 wall_3 wall_5
central middle external
14 International Journal of Chemical Reactor Engineering Vol. 9 [2011], Article A
http://www.bepress.com/ijcre/vol9/A21

7/31/2019 CFD of a Catalytic Micro-Monolith
http://slidepdf.com/reader/full/cfd-of-a-catalytic-micro-monolith 17/22
In Table 5, the propane conversion attained at the outlet section of eachchannel of the 5_C configuration is given for different inlet gas velocities. Thevalues reported in the table confirm that, when the homogeneous and
heterogeneous reaction fronts are blown out, the global propane conversion becomes lower than 100 %.
Table 5 – Propane conversion attained at the outlet section of each channel of the5_C configuration at different inlet gas velocities
vin (m/s)Centralchannel
Middlechannel
Externalchannel
0.5 100 100 100
1.5 100 100 100
1.67 100 100 91
2 85 84 71
3.2 Effect of Inlet Velocity Distribution
One of the main challenge for catalytic micro-combustors is to extend their operability region. This region can be defined as the operative parameter zone inwhich the fuel conversion is higher than 95 % (Kaisare et al., 2008). By enlargingthe range of inlet gas velocities at which the micro-combustor achieves a fuelconversion higher than 95 %, it is possible to operate at higher power densities.
From the above-presented results, it can be concluded that, in the multi-channel configurations, the central channel is more adiabatic and then has a larger operability map in terms of inlet gas velocities. In particular, the critical value of inlet velocity (uniform feeding among the channels) for achieving 95 % propaneconversion in the 5_C configuration is equal to 1.64 m/s (global value equal to8.2 m/s).
We performed simulations by feeding the channels of the 5_Cconfiguration with different inlet gas velocities to identify the optimal feedingconditions, i.e., the conditions that allow maximizing the power density. In particular, we fixed the total inlet flow rate (i.e., the total inlet velocity = 8.2 m/s), but changed the feeding distribution among the channels. Table 6 summarizes theconditions investigated.
Di Benedetto and Di Sarli: CFD of a Catalytic Micro-Monolith
Published by The Berkeley Electronic Press, 2

7/31/2019 CFD of a Catalytic Micro-Monolith
http://slidepdf.com/reader/full/cfd-of-a-catalytic-micro-monolith 18/22
Table 6 – Inlet gas velocity (m/s) distributions for the 5_C configuration
ConfigurationExternal
channel
Middle
channel
Central
channel
Middle
channel
External
channel
A 1.4 1.8 1.8 1.8 1.4
B 1.64 1.64 1.64 1.64 1.64
C 1.1 2 2 2 1.1
D 1.5 1.6 2 1.6 1.5
E 1.15 1.7 2.5 1.7 1.15
In Figure 9, the overall propane conversions as computed for the inletvelocity distributions of Table 6 are shown. It can be observed that the optimal
configuration is configuration A in which complete propane conversion isachieved.
Figure 9 – Overall propane conversions as computed for the inlet velocitydistribution reported in Table 6.
vin (m/s)
0 2 4 6 8
C 3 H 8 c o n v e r s i o n ( % )
89
93
94
97
100
A
C
B
D
external channelmiddle channel
central channel middle channelexternal channel
E
16 International Journal of Chemical Reactor Engineering Vol. 9 [2011], Article A
http://www.bepress.com/ijcre/vol9/A21

7/31/2019 CFD of a Catalytic Micro-Monolith
http://slidepdf.com/reader/full/cfd-of-a-catalytic-micro-monolith 19/22
In Figure 10, the maps of the homogeneous reaction rate are shown for configurations A, B and E of Table 6.
Figure 10 – Maps of the homogeneous reaction rate (kmol/m3 s) for configurations A, B and E of Table 6.
A
B
E
Di Benedetto and Di Sarli: CFD of a Catalytic Micro-Monolith
Published by The Berkeley Electronic Press, 2

7/31/2019 CFD of a Catalytic Micro-Monolith
http://slidepdf.com/reader/full/cfd-of-a-catalytic-micro-monolith 20/22
With configuration A, the homogeneous reaction front is stabilized insideeach channel. The occurrence of this reaction allows completing the propaneconversion. Conversely, with configuration B, the homogeneous reaction front is
stabilized only inside the internal channels, whereas is swept out of the externalchannels due to heat losses, which become predominant with respect to heat production. Under these conditions, the propane conversion for the externalchannels does not complete and, therefore, the overall conversion is lower. Withconfiguration E, the homogeneous reaction front is stabilized inside all channels,except for the central channel. In this case, the reaction front is blown out due tothe too high inlet velocity (vin = 2.5 m/s) and then too low residence time.
From these results, it is clear that, depending on the channel position,different inlet gas velocities can be used, thus enhancing the overall output power density.
4. Summary and Conclusions
In this work, a first step in modeling and simulating the thermal behavior of anentire catalytic micro-monolith was performed. In particular, a CFD model wasdeveloped for simulating three-channel and five-channel micro-combustors. For both configurations, the operating maps were built as functions of the inlet gasvelocity, and compared to the operating map of a single-channel configuration.
Results show that, due to the relevant role played by heat losses in micro-devices, it is not possible to extrapolate the behavior of the multi-channelconfigurations from that of the single channel. Therefore, in order to predict
correctly performances and operating maps of catalytic micro-monoliths,simulation of the entire reactor is needed. The main drawback of such anapproach is the computational cost. It has been found that the CPU time almostlinearly increases with the number of channels simulated.
The opportunity to feed the channels of the five-channel micro-combustor with different mass flow rates was also investigated. It has been shown that, for afixed total mass flow rate, the global fuel conversion can be optimized by meansof a non-uniform distribution of inlet gas velocities among the channels.
18 International Journal of Chemical Reactor Engineering Vol. 9 [2011], Article A
http://www.bepress.com/ijcre/vol9/A21

7/31/2019 CFD of a Catalytic Micro-Monolith
http://slidepdf.com/reader/full/cfd-of-a-catalytic-micro-monolith 21/22
References
Di Benedetto A, Marra FS, Donsì F, Russo G. Transport phenomena in a catalyticmonolith: Effect of the superficial reaction. AIChE Journal. 2006; 52: 911-923.
Di Benedetto A, Di Sarli V, Russo G. A novel catalytic-homogenous micro-combustor. Catalysis Today. 2009; 147S: S156-S161.
Di Benedetto A, Di Sarli V, Russo G. Effect of geometry on the thermal behaviour of catalityc micro-combustors. Catalysis Today. 2010a; 155:116-122.
Di Benedetto A, Di Sarli V. Steady state multiplicity in catalytic micro-combustors. Industrial & Engineering Chemistry Research. 2010b; 49:2130-2134.
Donsì F, Pirone R, Russo G. Oxidative dehydrogenation of ethane over a perovskite-based monolithic reactor. Journal of Catalysis. 2002; 209: 51-61.
Groppi G, Tronconi E, Forzatti P. Mathematical models of catalytic combustors.Catalysis Reviews. 1999; 41: 227-254.
Hayes RE, Kolaczkowski ST. Mass and heat transfer effects in catalytic monolithreactors. Chemical Engineering Science. 1994; 49: 3587-3599.
Jahn R, Šnita D, Kubíček M, Marek M. 3-D modeling of monolith reactors.Catalysis Today. 1997; 38: 39-46.
James A, Brindley J, McIntosh AC. Multi-channel monolith reactors as dynamicalsystems. Combustion and Flame. 2003; 134: 193-205.
Jeong S-J, Kim W-S, Kim T. An application of CFD to improve warm-up performance of the 3-way auto-catalyst by high surface area and low
thermal mass. International Journal of Vehicle Design. 2002; 29: 243-268.
Kaisare NS, Deshmukh SR, Vlachos DG. Stability and performance of catalyticmicroreactors: Simulations of propane catalytic combustion on Pt.Chemical Engineering Science. 2008; 63: 1098-1116.
Di Benedetto and Di Sarli: CFD of a Catalytic Micro-Monolith
Published by The Berkeley Electronic Press, 2

7/31/2019 CFD of a Catalytic Micro-Monolith
http://slidepdf.com/reader/full/cfd-of-a-catalytic-micro-monolith 22/22
Kolaczkowski ST, Worth DJ. Modelling channel interactions in a non-adiabaticmultichannel catalytic combustion reactor. Catalysis Today. 1995; 26:275-282.
Mei H, Li C, Liu H, Ji S. Simulation of catalytic combustion of methane in amonolith honeycomb reactor. Chinese Journal of Chemical Engineering.2006; 14: 56-64.
Spadaccini CM, Peck J, Waitz IA. Catalytic combustion systems for microscalegas turbine engines. Journal of Engineering for Gas Turbines and Power.2007; 129: 49-60.
Tischer S, Deutschmann O. Recent advances in numerical modeling of catalyticmonolith reactors.
Westbrook CK, Dryer FL. Simplified reaction mechanisms for the oxidation of hydrocarbon fuels in flames. Combustion Science Technology. 1981; 27:31-43.
20 International Journal of Chemical Reactor Engineering Vol. 9 [2011], Article A