Embed Size (px)
Citation preview
“thesisdraft” — 2005/5/9 — 8:51 — page i — #1ii
ii
ii
ii
CFD in the designof gas quenching furnace
by
Olivier MacchionFaxenlaboratoriet
Department of Mechanics
June 2005Technical Reports from
Royal Institute of TechnologyDepartment of Mechanics
S-100 44 Stockholm, Sweden
“thesisdraft” — 2005/5/9 — 13:12 — page ii — #2!!
!!
!!
!!
Typsatt i AMS-LATEX.
Akademisk avhandling som med tillstand av Kungliga Tekniska Hogskolan iStockholm framlagges till offentlig granskning for avlaggande av teknologiedoktorexamen torsdagen den 16:e Juni 2005 kl 10.00 i salen D2, KungligaTekniska Hogskolan, Lindstedtsvagen 5, Stockholm.
c©Olivier Macchion 2005
Intellecta Docusys, Stockholm 2005

“thesisdraft” — 2005/5/9 — 8:51 — page iii — #3ii
ii
ii
ii
To Boel and my parents.

“thesisdraft” — 2005/5/9 — 8:51 — page iv — #4ii
ii
ii
ii
iv
“thesisdraft” — 2005/5/9 — 8:51 — page v — #5ii
ii
ii
ii
CFD in design of gas quenching furnaces.
Olivier MacchionFaxenlaboratorietDepartment of Mechanics, Royal Institute of TechnologySE-100 44 Stockholm, Sweden.
AbstractThis thesis focus on the numerical study of gas quenching within industrial fur-naces. Gas quenching is the rapid cooling of metal pieces, aiming at performinga transformation of the metal structure to improve its mechanical properties.In the present study, several aspects of the factors influencing the performanceof a gas quenching furnace have been studied. A first study focused on theflow and heat transfer fields both in an empty furnace and in a furnace loadedwith different charges. The objective was to study the influence of the chargeconfiguration on the flow and heat transfer uniformity. This study led to theidentification of several possible improvements, and these improvements arecurrently being implemented by the industrial partners of this project. As ear-lier studies had shown the importance of flow uniformity on the quality of theheat treatment, a second work focused solely on the flow uniformity upstreamof the quenching zone. This led to the writing of design recommendations forthis particular type of furnace. Investigations of the dependence of the perfor-mance of the coolant on gas composition were performed. Improved knowledgeof the effect of gas mixture composition on heat transfer was added to the bodyof knowledge already available. Further studies of the factors suspected to be ofinfluence have been performed, leading to the identification of several avenuesfor future research.
Descriptors: Gas quenching, modeling, CFD, gas mixtures, uniformity.

“thesisdraft” — 2005/5/9 — 8:51 — page vi — #6ii
ii
ii
ii
vi
“thesisdraft” — 2005/5/9 — 13:12 — page vii — #7!!
!!
!!
!!
Preface
This thesis treats hydrodynamics and heat transfer within gas quenching fur-naces, both from an economical point of view through the estimation of thepressure drop occurring during such processes, and from a quality point ofview through the estimation of the heat treatment uniformity. The researchwas conducted within the framework of Faxenlaboratoriet, a centre of excel-lence located at the Royal Institute of Technology in Stockholm, Sweden. Thethesis is divided in two main sections. In the first of these, an introduction isgiven to the science of metal hardening, called quenching. A summary of theresearch conducted by the thesis author and his co-workers is also given, withthe objective to clarify its context. The second part consists of the appendedscientific papers. When necessary, these have been reset in the format of thisthesis.
Stockholm, June 2005.Olivier Macchion
Appended papers:
Paper 1. Macchion, O. and Zahrai, S. and Bouwman, J. 2004 ‘On hydrody-namics within gas quenching furnace’Submitted to the Journal of Materials Processing Technology.
Paper 2. Macchion, O. and Zahrai, S. and Bouwman, J. 2004 ‘On heat transferwithin gas quenching furnace’Submitted to the Journal of Materials Processing Technology.Short version published in the IASME Transactions vol. 1(2), January 2005
Paper 3. Macchion, O. and Zahrai, S. 2004 ‘CFD for design of gas quenchingfurnace’Proceedings of the 17th Nordic Seminar on Computational Mechanics, pp.62-65
Paper 4. Macchion, O. and Lior, N. 2004 ‘Computational study of velocitydistribution for designing some gas quench chamber and furnace ducts’Published in the Journal of Materials Processing Technology, Vol. 155-156,November 2004, p.1727-1733
“thesisdraft” — 2005/5/9 — 8:51 — page viii — #8ii
ii
ii
ii
viii PREFACE
Paper 5. Macchion, O. and Zahrai, S. 2004 ‘On the influence of gas mixturecomposition on gas quenching uniformity and mean’Accepted for presentation at the ASME Heat Transfer Conference 2005, in SanFrancisco.Submitted for publication in the ASME Transactions, Journal of Heat Transfer.
Paper 6. Macchion, O. and Zahrai, S. 2004 ‘Heat transfer correlation withingas quenching chamber’Submitted to the International Journal of Heat and Fluid Flow.
Paper 7. Macchion, O. and Zahrai, S. 2005 ‘Large eddy simulation of flowand heat transfer over a cylinder in axial flow’Draft.
Papers not present in this thesis
Ko, J. and Macchion, O. and Zahrai, S. 2004 ‘Numerical Modeling of HighSwirl Flows in a Through-Flow Cylindrical Hydrocyclone’ Submitted to theAmerican Institute of Chemical Engineers Journal.
Ko, J. and Macchion, O. and Zahrai, S. 2004 ‘Numerical Modeling of SwirlingTurbulent Pipe Flows Created by Tangential Inlets’ Submitted to the Interna-tional Journal for Numerical Methods in Fluids.
Division of work between authors
The work presented in this thesis has been done in collaboration with otherresearchers. The respondent performed the major part of the work. Prof. SaidZahrai, Department of Mechanics KTH, Prof. Noam Lior, Pennsylvania StateUniversity, Dr. Jan Bouwman, Dr. Anders Astrom have acted as supervisors.They have all contributed with comments and discussion of the work and themanuscripts.
Parts of the activities have been presented in talks given at,The AMPT 2003, Dublin, Ireland, in July 2003,Svenska Mekanikdagar, Gothenburg, Sweden, in August 2003The 17th Nordic Seminar on Computational Mechanics , Stockholm, Sweden,in October 2004,The 2005 IASME Heat Transfer Conference, Udine, Italy, 20-22 January 2005,
“thesisdraft” — 2005/5/9 — 8:51 — page ix — #9ii
ii
ii
ii
Contents
Preface vii
Chapter 1. Introduction 11.1. Heat treatment of steels 1
1.1.1. Heating temperatures and phase transformation 11.1.2. Cooling rate and phase transformations 3
1.2. Quenching 5
Chapter 2. Quenching chamber and performance parameters 82.1. Gas quenching furnaces 82.2. Architecture of the VUTK furnace 102.3. Heat transfer modes in a gas quenching furnace 122.4. Convective heat transfer and fluid properties 152.5. Heat transfer uniformity 15
Chapter 3. Mathematical modeling of flow and heat transfer 173.1. Gas properties 18
3.1.1. Pure gases 183.1.2. Mixtures of pure gases 19
3.2. Turbulence modeling 203.2.1. Shear-Stress Transport model 203.2.2. Differential Reynolds Stress model 22
3.3. Solution methodology 23
Chapter 4. Summary of results 244.1. Heat transfer around a cylinder in axial homogeneous flow 244.2. Influence of quenching basket on heat transfer 264.3. The influence of gas mixture composition 294.4. Gas quenching furnace 30
4.4.1. Validation of the computational model 314.4.2. Multi-body charges 32
ix
“thesisdraft” — 2005/5/9 — 8:51 — page x — #10ii
ii
ii
ii
x CONTENTS
4.5. Chamber geometrical characteristics and chamber performance 364.6. Flow uniformity and duct geometry. 394.7. Flow uniformity upstream of the charge. 41
Chapter 5. Concluding remarks 42
Acknowledgments 45
Bibliography 46
On hydrodynamic effects within gas quenching furnace 511. Introduction 512. Problem statement 543. Mathematical model 554. Numerical method and boundary conditions 585. Results and analysis 596. Summary and conclusions 64References 66
On heat transfer within gas quenching furnace 691. Introduction 692. Problem statement 703. Mathematical formulation and mumerical method 724. Results 735. Conclusion 81References 82
CFD for design of gas quenching furnace 871. Introduction 872. Computational method 883. Hydrodynamics within the quenching chamber 884. Heat transfer within the quenching chamber 895. Quenching basket design 906. Concluding remarks 90References 91
Computational study of velocity distribution for designing somegas quench chamber and furnace ducts 95
1. Introduction 952. Computational model 97
2.1. Transition Duct Model Configurations 972.2. Solver and Boundary Conditions 98
“thesisdraft” — 2005/5/9 — 8:51 — page xi — #11ii
ii
ii
ii
CONTENTS xi
2.3. Performance Criteria 993. Circular-to-rectangular transition ducts 100
3.1. Duct length effects 1003.2. Duct Exit Aspect Ratio (A/R) Effects 1013.3. Expanding-Contracting Duct 1023.4. Pressure effects 1033.5. Reynolds number effects 103
4. Ducts bends 1054.1. Geometry and Computational Model 1054.2. Results 105
5. Conclusions and recommendations 1066. Acknowledgements 106References 106
Investigation of the influence of gas composition on heat uniformityand mean 111
1. Introduction 1112. Problem statement 1123. Mathematical model 1144. Numerical method 1155. Results 1176. Conclusion 123Acknoledgements 124References 124
Heat transfer correlation within gas quenching furnace 1291. Introduction 1292. Problem statement 1313. Mathematical model 1334. Boundary conditions and numerical method 1335. Results 1346. Discussion, recommendation, and future work 142Acknowledgments 144References 144
Large eddy simulation of flow and heat transfer over a cylinderin axial flow 149
1. Introduction 1492. Problem statement 1503. Mathematical model 151

“thesisdraft” — 2005/5/9 — 8:51 — page xii — #12ii
ii
ii
ii
xii CONTENTS
4. Numerical method 1525. Results 1536. Conclusion 157Acknowledgements 159References 159
“thesisdraft” — 2005/5/9 — 8:51 — page 1 — #14ii
ii
ii
ii
CHAPTER 1
Introduction
This thesis is concerned with flow and heat transfer modeling for the hardeningof metal pieces by gases. To set the stage for the presentation of the work thathas been undertaken, I therefore think it is appropriate to dedicate the firstchapter of this thesis to an introduction to the science of phase transformationwithin metals. As will become evident, the cooling process is given a morelengthy presentation, since it has been the main focus area of the conductedresearch.
1.1. Heat treatment of steels
Most carbon, low-alloy, high-alloy steel and ceramic parts produced today areheat treated, both to enhance particular properties, such as hardness, tough-ness, and corrosion resistance, and to improve uniformity properties. The treat-ment depends on both the type of alloy and the intended service consitions. Ingeneral heat treatment is an operation involving heating to an elevated temper-ature followed by controlled cooling to obtain particular microstructures andcombinations of properties. The utility of steel lies largely in the relative easewith which properties can be altered by controlling the way parts are heatedand then cooled. The changes in properties occur principally because differentmicrostructural constituents are achieved with different cooling rates. A gooddescription of the operations performed during heat treating of steel is availablein Totten et al. (1993).
1.1.1. Heating temperatures and phase transformation
Most carbon and low-alloy steels contain less than 0.83 % C. As a consequencethe microstructure is a two-phase mixture consisting of α iron, also calledferrite, and perlite. Ferrite is a body-centered cubic (bcc) phase, and perlite isa mixture of ferrite and cementite, Fe3C, existing as alternating lamellae. Ifsuch a steel is heated to a moderate temperature of about 425 to 650 oC (800to 1200oF), internal stresses may be relieved without substantially altering themicrostructure or physical properties.
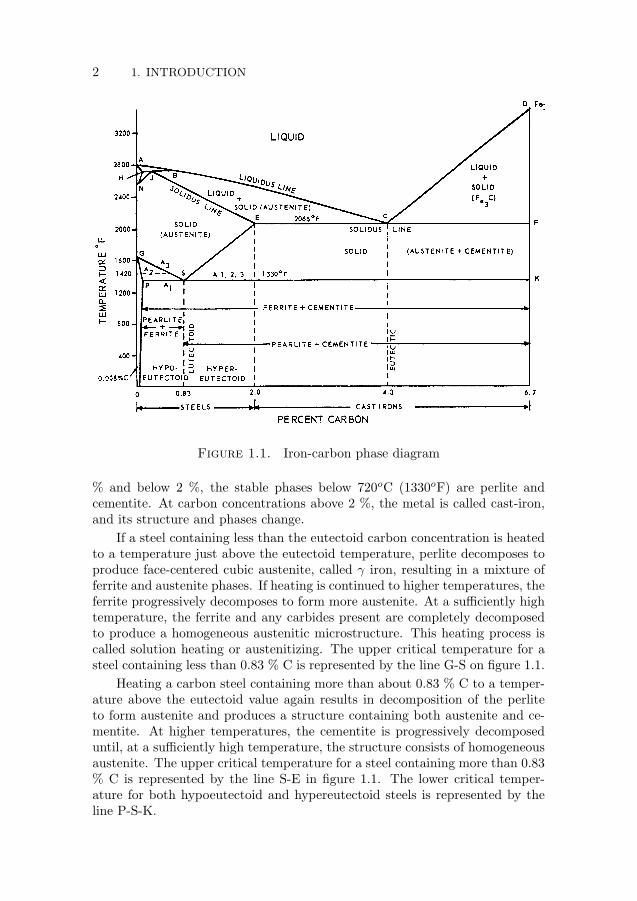
The iron-carbon phase diagram is shown in figure 1.1. The iron-carbondiagram is a map that depicts the phases present as a function of carbonconcentration and temperature. At carbon concentrations below about 0.83% and temperatures below the eutectoid value of 720 oC (1330oF), the stablephases are ferrite and perlite. At carbon concentrations above about 0.83
1
“thesisdraft” — 2005/5/9 — 8:51 — page 2 — #15ii
ii
ii
ii
2 1. INTRODUCTION
Figure 1.1. Iron-carbon phase diagram
% and below 2 %, the stable phases below 720oC (1330oF) are perlite andcementite. At carbon concentrations above 2 %, the metal is called cast-iron,and its structure and phases change.
If a steel containing less than the eutectoid carbon concentration is heatedto a temperature just above the eutectoid temperature, perlite decomposes toproduce face-centered cubic austenite, called γ iron, resulting in a mixture offerrite and austenite phases. If heating is continued to higher temperatures, theferrite progressively decomposes to form more austenite. At a sufficiently hightemperature, the ferrite and any carbides present are completely decomposedto produce a homogeneous austenitic microstructure. This heating process iscalled solution heating or austenitizing. The upper critical temperature for asteel containing less than 0.83 % C is represented by the line G-S on figure 1.1.
Heating a carbon steel containing more than about 0.83 % C to a temper-ature above the eutectoid value again results in decomposition of the perliteto form austenite and produces a structure containing both austenite and ce-mentite. At higher temperatures, the cementite is progressively decomposeduntil, at a sufficiently high temperature, the structure consists of homogeneousaustenite. The upper critical temperature for a steel containing more than 0.83% C is represented by the line S-E in figure 1.1. The lower critical temper-ature for both hypoeutectoid and hypereutectoid steels is represented by theline P-S-K.

“thesisdraft” — 2005/5/9 — 8:51 — page 3 — #16ii
ii
ii
ii
1.1. HEAT TREATMENT OF STEELS 3
Figure 1.2. Microscopic structure called austenite magni-fied 500 times.
Induction heating and radiation heating are two of the most used heatingmethods. Induction heating is the process of heating a metal object by placinga wound coil carrying high alternating current at close proximity to the objectto be heated. This technology is being adopted into the domestic kitchenheating in the form of the induction cooker. This process can also be usedfor eliminating unwanted oxygen gas in vacuum tubes and for high volumeindustrial welding.
Radiation heating consists in using the propagation of heat through in-frared waves to heat up the metal pieces from within the quenching chamber.Other methods include flame heating, laser beam heating, and electron beamheating.
1.1.2. Cooling rate and phase transformations
If a solution-treated steel, also called austenitized steel, containing less thanabout 0.83 % C is slowly cooled from the austenite temperature region, the firstphase to precipate from the austenite is ferrite. This transformation results in achange in the atomic arrangement from the fcc austenite to bcc ferrite. Becauseferrite can dissolve only a small amount of carbon, the concentration of carbonin austenite increases during cooling, until at the eutectoid temperature ofabout of about 720 oC (1330oF), the remaining austenite transforms to perlite.
“thesisdraft” — 2005/5/9 — 8:51 — page 4 — #17ii
ii
ii
ii
4 1. INTRODUCTION
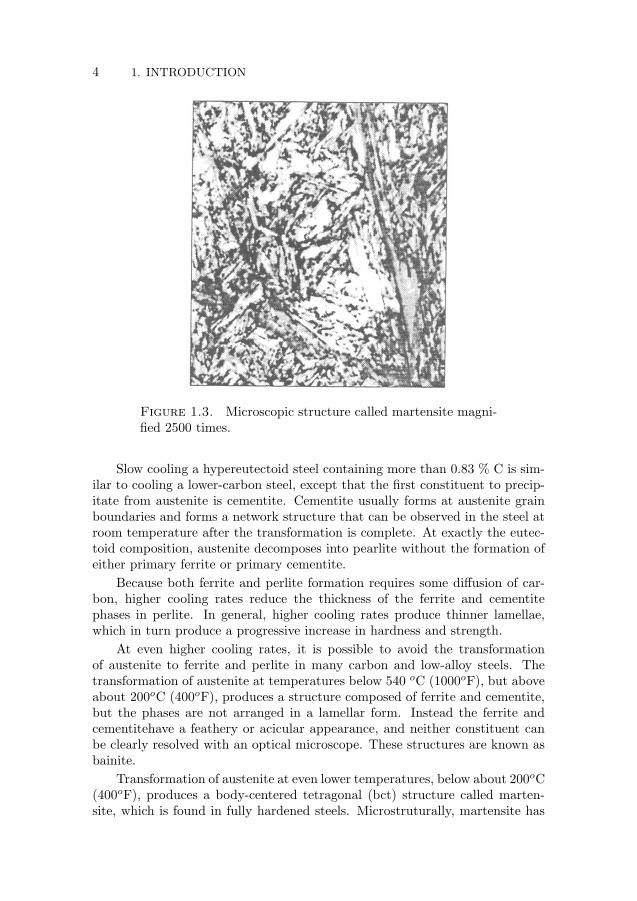
Figure 1.3. Microscopic structure called martensite magni-fied 2500 times.
Slow cooling a hypereutectoid steel containing more than 0.83 % C is sim-ilar to cooling a lower-carbon steel, except that the first constituent to precip-itate from austenite is cementite. Cementite usually forms at austenite grainboundaries and forms a network structure that can be observed in the steel atroom temperature after the transformation is complete. At exactly the eutec-toid composition, austenite decomposes into pearlite without the formation ofeither primary ferrite or primary cementite.
Because both ferrite and perlite formation requires some diffusion of car-bon, higher cooling rates reduce the thickness of the ferrite and cementitephases in perlite. In general, higher cooling rates produce thinner lamellae,which in turn produce a progressive increase in hardness and strength.
At even higher cooling rates, it is possible to avoid the transformationof austenite to ferrite and perlite in many carbon and low-alloy steels. Thetransformation of austenite at temperatures below 540 oC (1000oF), but aboveabout 200oC (400oF), produces a structure composed of ferrite and cementite,but the phases are not arranged in a lamellar form. Instead the ferrite andcementitehave a feathery or acicular appearance, and neither constituent canbe clearly resolved with an optical microscope. These structures are known asbainite.
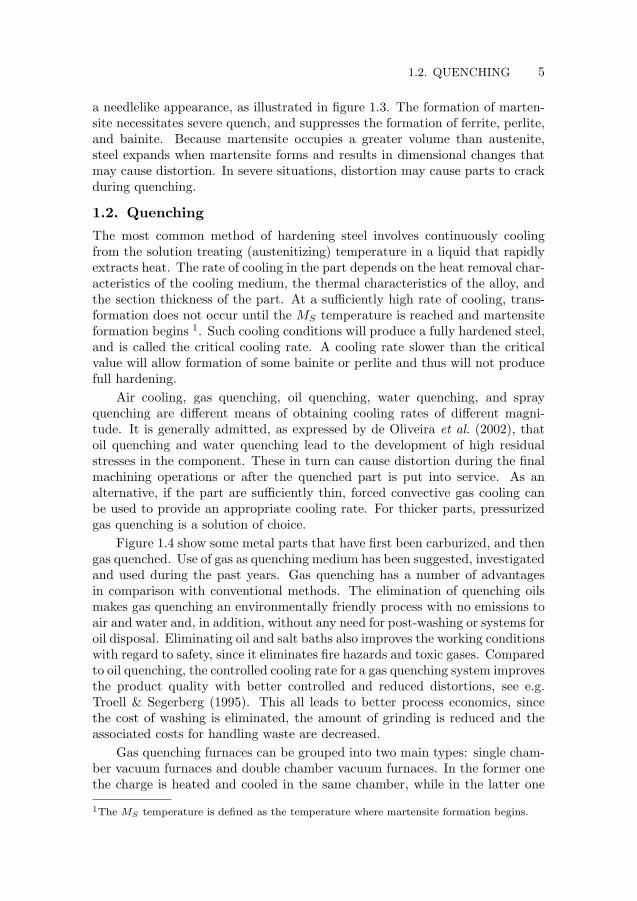
Transformation of austenite at even lower temperatures, below about 200oC(400oF), produces a body-centered tetragonal (bct) structure called marten-site, which is found in fully hardened steels. Microstruturally, martensite has
“thesisdraft” — 2005/5/9 — 8:51 — page 5 — #18ii
ii
ii
ii
1.2. QUENCHING 5
a needlelike appearance, as illustrated in figure 1.3. The formation of marten-site necessitates severe quench, and suppresses the formation of ferrite, perlite,and bainite. Because martensite occupies a greater volume than austenite,steel expands when martensite forms and results in dimensional changes thatmay cause distortion. In severe situations, distortion may cause parts to crackduring quenching.
1.2. Quenching
The most common method of hardening steel involves continuously coolingfrom the solution treating (austenitizing) temperature in a liquid that rapidlyextracts heat. The rate of cooling in the part depends on the heat removal char-acteristics of the cooling medium, the thermal characteristics of the alloy, andthe section thickness of the part. At a sufficiently high rate of cooling, trans-formation does not occur until the MS temperature is reached and martensiteformation begins 1. Such cooling conditions will produce a fully hardened steel,and is called the critical cooling rate. A cooling rate slower than the criticalvalue will allow formation of some bainite or perlite and thus will not producefull hardening.
Air cooling, gas quenching, oil quenching, water quenching, and sprayquenching are different means of obtaining cooling rates of different magni-tude. It is generally admitted, as expressed by de Oliveira et al. (2002), thatoil quenching and water quenching lead to the development of high residualstresses in the component. These in turn can cause distortion during the finalmachining operations or after the quenched part is put into service. As analternative, if the part are sufficiently thin, forced convective gas cooling canbe used to provide an appropriate cooling rate. For thicker parts, pressurizedgas quenching is a solution of choice.
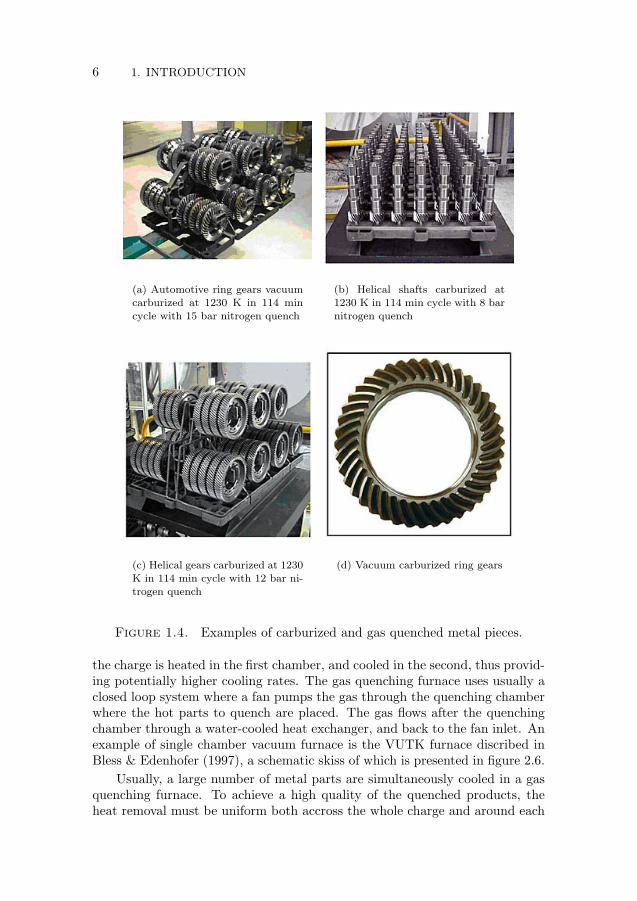
Figure 1.4 show some metal parts that have first been carburized, and thengas quenched. Use of gas as quenching medium has been suggested, investigatedand used during the past years. Gas quenching has a number of advantagesin comparison with conventional methods. The elimination of quenching oilsmakes gas quenching an environmentally friendly process with no emissions toair and water and, in addition, without any need for post-washing or systems foroil disposal. Eliminating oil and salt baths also improves the working conditionswith regard to safety, since it eliminates fire hazards and toxic gases. Comparedto oil quenching, the controlled cooling rate for a gas quenching system improvesthe product quality with better controlled and reduced distortions, see e.g.Troell & Segerberg (1995). This all leads to better process economics, sincethe cost of washing is eliminated, the amount of grinding is reduced and theassociated costs for handling waste are decreased.
Gas quenching furnaces can be grouped into two main types: single cham-ber vacuum furnaces and double chamber vacuum furnaces. In the former onethe charge is heated and cooled in the same chamber, while in the latter one
1The MS temperature is defined as the temperature where martensite formation begins.
“thesisdraft” — 2005/5/9 — 8:51 — page 6 — #19ii
ii
ii
ii
6 1. INTRODUCTION
(a) Automotive ring gears vacuumcarburized at 1230 K in 114 min
cycle with 15 bar nitrogen quench
(b) Helical shafts carburized at1230 K in 114 min cycle with 8 bar
nitrogen quench
(c) Helical gears carburized at 1230K in 114 min cycle with 12 bar ni-
trogen quench
(d) Vacuum carburized ring gears
Figure 1.4. Examples of carburized and gas quenched metal pieces.
the charge is heated in the first chamber, and cooled in the second, thus provid-ing potentially higher cooling rates. The gas quenching furnace uses usually aclosed loop system where a fan pumps the gas through the quenching chamberwhere the hot parts to quench are placed. The gas flows after the quenchingchamber through a water-cooled heat exchanger, and back to the fan inlet. Anexample of single chamber vacuum furnace is the VUTK furnace discribed inBless & Edenhofer (1997), a schematic skiss of which is presented in figure 2.6.
Usually, a large number of metal parts are simultaneously cooled in a gasquenching furnace. To achieve a high quality of the quenched products, theheat removal must be uniform both accross the whole charge and around each
“thesisdraft” — 2005/5/9 — 8:51 — page 7 — #20ii
ii
ii
ii
1.2. QUENCHING 7
part. These two issues must be considered in both design of the furnace andthe arrangement of the parts relative to each other in the charge basket.
Thuvander et al Thuvander et al. (1998) studied the gas quenching processand showed how flow homogeneity influences the uniformity of the mechanicalproperties, in particular the hardness, of gas-quenched metal parts. Two mainfactors can contribute to the lack of flow uniformity in a gas quenching fur-nace. Firstly, the design of the furnace must insure a uniform distribution offlow around the charge. The design of the furnace usually reflects considerationof a large number of factors such as cost, weight and size. Strong optimizationwith respect to other factors can sometimes result in complex flow paths givingrise to strong variations in the gas velocity. Secondly, as most bodies to quenchare bluff bodies, occurance of flow separations results in local varition of heattransfer properties. See e.g. Igarashi (1981), Roshko (1955), Roshko (1993),and Koenig & Roshko (1985).
The aim of this thesis is to present a review of the phenomena taking placewithin a gas quenching chamber, from a fluid dynamics and heat transfer per-spective. For a start one considers the hydrodynamics and heat transfer withina gas quenching chamber, with a focus on the emergence of non uniformitiesboth within the flow and heat transfer fields. Then the focus is put on how gasmixtures may affect the global performance of a gas quenching furnace, bothin terms of mean and uniform heat transfer.
In the present chapter, chapter 1, the process of gas quenching has beenintroduced. In chapter 2 the fundamentals of the gas quenching process and ofthe design of a gas quenching chamber are presented. Chapter 3 presents themathematical models that underlines the study of such flows numerically. Inchapter 4, a summary of papers 1 to 8 is performed, with a focus on the flow andheat transfer around bluff bodies, the flow and heat transfer in a gas quenchingchamber, and the influence of the design of the entrance to the furnace on theflow homogeneity at its exit plane. Finally, chapter 5 summarizes the studiesthat were performed in the course of this thesis, and gives a perspective onfuture research on the topic of gas quenching. Aspects of the applicabilityof the work performed here to the more general industry of gas cooling areconsidered.
“thesisdraft” — 2005/5/9 — 8:51 — page 8 — #21ii
ii
ii
ii
CHAPTER 2
Quenching chamber and performance parameters
2.1. Gas quenching furnaces
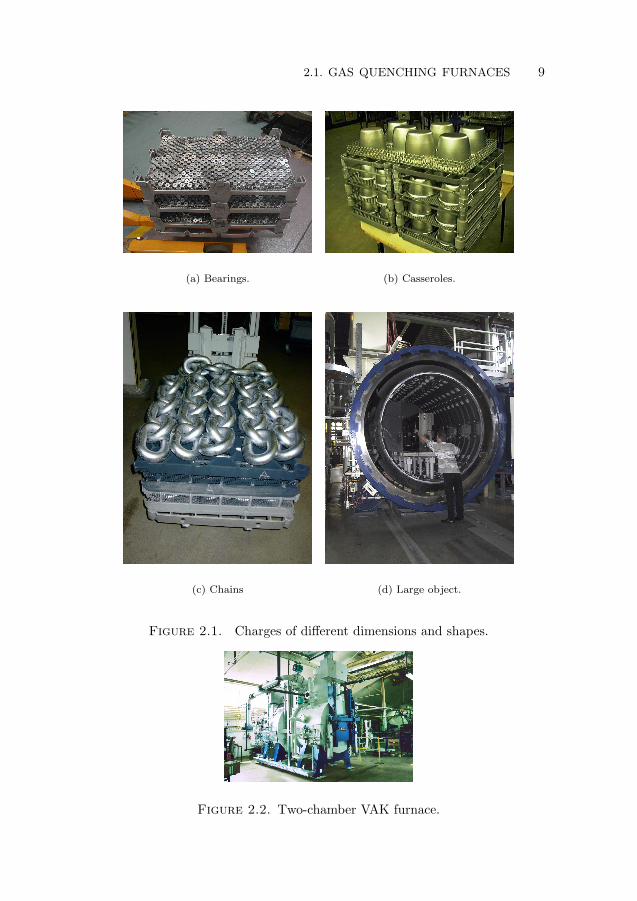
The metal pieces to quench are characterized by a large diversity of shapes anddimensions. As it can be seen on figures 2.1(a), 2.1(b), 2.1(c), and 2.1(d), thedimensions and number of pieces to quench can vary a lot, going from a fewcentimeters to the order of the meter. Quenching furnace manufacturers solvethis problem by making available different furnace architectures specificallymanufactured for a kind of metal pieces, and for different cooling rates. Tohelp the reader in following the discussion presented in this work, a few termsproper to quenching manufacturer jargon are defined. The term single-chamberfurnace refers to furnaces where the heating to solution-treating temperatureand quenching occur in the same chamber. The term two-chambers furnacesrefers to furnaces where heating and quenching take place in two adjoiningchambers, as in the VAK furnace presented in figure 2.2.
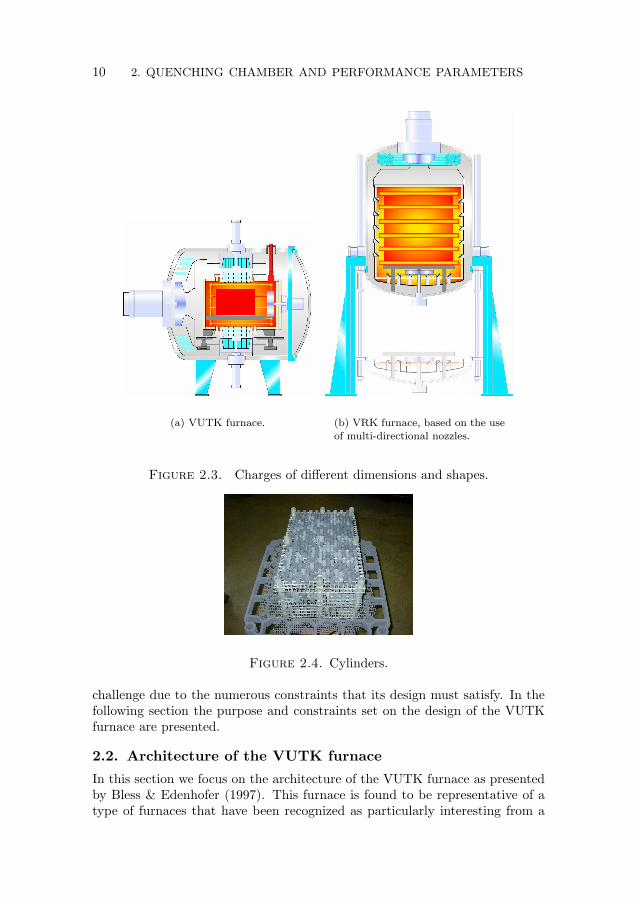
On figure 2.3, two examples of furnace construction are presented. Thefurnaces presented in figure 2.3 have the specific features of all single-chamberquenching furnaces, and which are (1) a fan, (2) a heat exchanger, (3) an innerchamber. The heating and quenching processes take place in the inner chamber,where heating resistances will provide the electromagnetic energy necessary tothe heating process. The differences between the two architectures presentedin figure 2.3 lie in the cooling apparatus. In the VUTK furnace presented infigure 2.3(a), the cooling is performed by a column of high velocity flow drivenfrom the top to the bottom of the quenching chamber by the fan. In the VRKfurnace presented in figure 2.3(b), the cooling is performed by a series of nozzlesplaced on the periphery of the quenching chamber, also called heating zone.
The different types of furnaces are manufactured for specific needs andpiece shapes. For instance the VUTK furnace, presented in schematic formon figure 2.3(a), is specifically well suited for long pieces like the cylinderspresented in figure 2.4. While the furnace of the type presented in figure 2.5are specially well suited for quenching of large metal pieces, as the flow comesfrom different directions through directing nozzles.
In this work, the focus was set on the VUTK furnace. The VUTK furnaceis a single chamber furnace, which is a concept that IPSEN International GmbHhas found to be of great interest as it involves reduced size and weight comparedto the other types of furnaces presented earlier. At the same time it presents a
8
“thesisdraft” — 2005/5/9 — 8:51 — page 9 — #22ii
ii
ii
ii
2.1. GAS QUENCHING FURNACES 9
(a) Bearings. (b) Casseroles.
(c) Chains (d) Large object.
Figure 2.1. Charges of different dimensions and shapes.
Figure 2.2. Two-chamber VAK furnace.
“thesisdraft” — 2005/5/9 — 8:51 — page 10 — #23ii
ii
ii
ii
10 2. QUENCHING CHAMBER AND PERFORMANCE PARAMETERS
(a) VUTK furnace. (b) VRK furnace, based on the useof multi-directional nozzles.
Figure 2.3. Charges of different dimensions and shapes.
Figure 2.4. Cylinders.
challenge due to the numerous constraints that its design must satisfy. In thefollowing section the purpose and constraints set on the design of the VUTKfurnace are presented.
2.2. Architecture of the VUTK furnace
In this section we focus on the architecture of the VUTK furnace as presentedby Bless & Edenhofer (1997). This furnace is found to be representative of atype of furnaces that have been recognized as particularly interesting from a
“thesisdraft” — 2005/5/9 — 8:51 — page 11 — #24ii
ii
ii
ii
2.2. ARCHITECTURE OF THE VUTK FURNACE 11
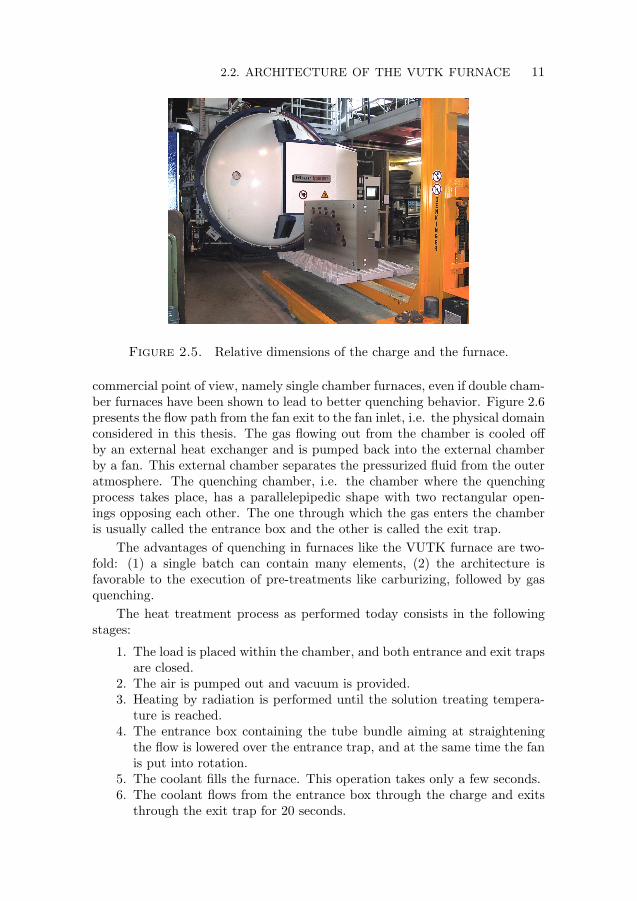
Figure 2.5. Relative dimensions of the charge and the furnace.
commercial point of view, namely single chamber furnaces, even if double cham-ber furnaces have been shown to lead to better quenching behavior. Figure 2.6presents the flow path from the fan exit to the fan inlet, i.e. the physical domainconsidered in this thesis. The gas flowing out from the chamber is cooled offby an external heat exchanger and is pumped back into the external chamberby a fan. This external chamber separates the pressurized fluid from the outeratmosphere. The quenching chamber, i.e. the chamber where the quenchingprocess takes place, has a parallelepipedic shape with two rectangular open-ings opposing each other. The one through which the gas enters the chamberis usually called the entrance box and the other is called the exit trap.
The advantages of quenching in furnaces like the VUTK furnace are two-fold: (1) a single batch can contain many elements, (2) the architecture isfavorable to the execution of pre-treatments like carburizing, followed by gasquenching.
The heat treatment process as performed today consists in the followingstages:
1. The load is placed within the chamber, and both entrance and exit trapsare closed.
2. The air is pumped out and vacuum is provided.3. Heating by radiation is performed until the solution treating tempera-
ture is reached.4. The entrance box containing the tube bundle aiming at straightening
the flow is lowered over the entrance trap, and at the same time the fanis put into rotation.
5. The coolant fills the furnace. This operation takes only a few seconds.6. The coolant flows from the entrance box through the charge and exits
through the exit trap for 20 seconds.
“thesisdraft” — 2005/5/9 — 8:51 — page 12 — #25ii
ii
ii
ii
12 2. QUENCHING CHAMBER AND PERFORMANCE PARAMETERS
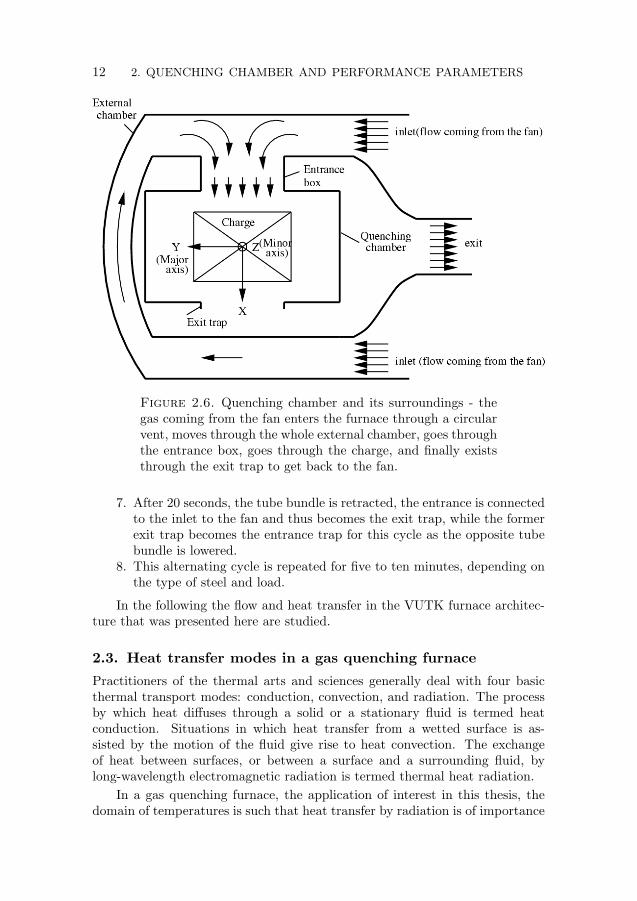
Figure 2.6. Quenching chamber and its surroundings - thegas coming from the fan enters the furnace through a circularvent, moves through the whole external chamber, goes throughthe entrance box, goes through the charge, and finally existsthrough the exit trap to get back to the fan.
7. After 20 seconds, the tube bundle is retracted, the entrance is connectedto the inlet to the fan and thus becomes the exit trap, while the formerexit trap becomes the entrance trap for this cycle as the opposite tubebundle is lowered.
8. This alternating cycle is repeated for five to ten minutes, depending onthe type of steel and load.
In the following the flow and heat transfer in the VUTK furnace architec-ture that was presented here are studied.
2.3. Heat transfer modes in a gas quenching furnace
Practitioners of the thermal arts and sciences generally deal with four basicthermal transport modes: conduction, convection, and radiation. The processby which heat diffuses through a solid or a stationary fluid is termed heatconduction. Situations in which heat transfer from a wetted surface is as-sisted by the motion of the fluid give rise to heat convection. The exchangeof heat between surfaces, or between a surface and a surrounding fluid, bylong-wavelength electromagnetic radiation is termed thermal heat radiation.
In a gas quenching furnace, the application of interest in this thesis, thedomain of temperatures is such that heat transfer by radiation is of importance
“thesisdraft” — 2005/5/9 — 8:51 — page 13 — #26ii
ii
ii
ii
2.3. HEAT TRANSFER MODES IN A GAS QUENCHING FURNACE 13
only in an early stage of the quenching process. Only heat transfer by conduc-tion within the metal and by convection between the metal to be quenched andthe quenching fluid is of interest in the present study.
Thermal conduction within a solid body to quench is governed by Fourier’slaw of conduction,
q = −k∇T, (2.1)where q is the heat flux, expressed in W·m−2, k is the thermal conductivity ofthe material, and T is the temperature, expressed in Kelvins, K.
Convective thermal transport from a surface to a fluid in motion can berelated to the heat transfer coefficient h, the surface-to-fluid temperature dif-ference, and the wetted surface area S in the form
q = hS(Ts − Tf ). (2.2)
The differences between convection to a rapidly moving fluid, a slowlyflowing fluid, or a stagnant fluid, as well as variations in the convective heattransfer rate among various fluids, are reflected in the values of h. For aparticular geometry and flow regime, h may be found from available empiricalcorrelations, theoretical relations, or, as it has been done in this study, bysolution of the equations of motion and energy presented in chapter 3.
Common dimensionless quantities that are used in the correlation of heattransfer data are the Nusselt number Nu, which relates the convective heattransfer coefficient to the conduction in the fluid:
Nu ≡ h
k/L=hL
k(2.3)
The Prandtl number Pr, which is a fluid property parameter:
Pr ≡ Cpµ
k=ν
α(2.4)
and the Reynolds number Re, which relates the momentum in the flow to theviscous dissipation:
Re ≡ ρUbL
µ(2.5)
All thermal properties in the foregoing dimensionless groups apply to the fluidat its bulk temperature. The quantity L is a characteristic dimension of thesystem under consideration, and Ub is the bulk velocity of the fluid in motion.
Other numbers, like the Grashof number Gr, which accounts for the buoy-ancy effect:
Gr ≡ ρ2βgL3∆Tµ2
(2.6)
have been introduced to characterize systems where no fan is forcing the flow.In gas quenching furnaces, flow velocities are within the range 15-30 m·s−1,which lead to Reynolds numbers of the order Re = 106 for air and at highpressure, P = 10 bar for instance. This means that the buoyancy effects canbe safely neglected. This affirmation can be shortly demonstrated by taking

“thesisdraft” — 2005/5/9 — 8:51 — page 14 — #27ii
ii
ii
ii
14 2. QUENCHING CHAMBER AND PERFORMANCE PARAMETERS
the ratio of the buoyancy and inertia forces, which are of equal magnitude inthe case of a vertical wall if
− (ρ0 − ρ∞) gρ∞U2
∞/L∼ 1. (2.7)
In terms of Grashof and Reynolds number, this translates intoGr
Re2∼ 1 (2.8)
Therefore, if Gr/Re2 1, then the buoyancy forces will be much smaller thanthe inertia forces. The flow will be determined by the inertia and friction forces.In the case of free convection, Gr/Re2 1, and the buoyancy forces are muchlarger than the inertia forces. The flow is determined by the buoyancy andfriction forces. In gas quenching furnaces, the typical Reynolds number is Re= 106, while the Grashof number is of order unity.
Laminar flows are structured, ordered flows, where the direction of motionat any point remains constant as if the fluid were moving in a series of layerssliding over one another without mixing. Beyond a critical Reynolds number,usually of order 103, the flow begins to lose its organized structure and becomesturbulent. The structure of a turbulent flow, its behavior, and its effects onheat and mass transfer change drastically when compared to a laminar flow inthe same geometrical set-up. As written earlier, the typical Reynolds numberin a gas quenching furnace is Re = 106.
According to Tennekes & Lumley (1972) , the main features of turbulenceare
1. Randomness of the turbulent fluctuations.2. Diffusivity that causes mixing and improves the momentum, mass and
heat exchange.3. The large Reynolds number range where such turbulence occurs.4. The three dimensional characteristic of the fluctuations with transfer of
turbulence between the directions.5. The dissipation which occurs at the end of the turbulent cascade and
which smoothes the fluctuations under the turbulent ultimate lengthscale.
6. The continuum characteristics of this ultimate length scale is higherthan a molecular mean free path and allows a treatment through thegeneral continuum mechanics equations.
7. Turbulence is induced by the flow configurations and not by by a physi-cal property of the fluid. This feature should be kept in mind as it givesrise to the underlying hypothesis of the different turbulence models.
One of the main features pointed out by Tennekes & Lumley (1972) is thefact that turbulence should improve the heat exchange between the fluid used asquenchant and the metal pieces to quench. Numerous experimental evidenceof such phenomenon has been given. Some good references are the worksperformed by Hunt (1973) , Arts et al. (1990), Hancock & Bradshaw (1983),
“thesisdraft” — 2005/5/9 — 8:51 — page 15 — #28ii
ii
ii
ii
2.5. HEAT TRANSFER UNIFORMITY 15
Van Fossen & Ching (1994), Van Fossen & Simoneau (1994), Van Fossen et al.(1995), and Butler et al. (2001). The studies reviewed evidenced the influenceof turbulence on heat transfer and the influence that surfaces and strain fieldshave on turbulence.
2.4. Convective heat transfer and fluid properties
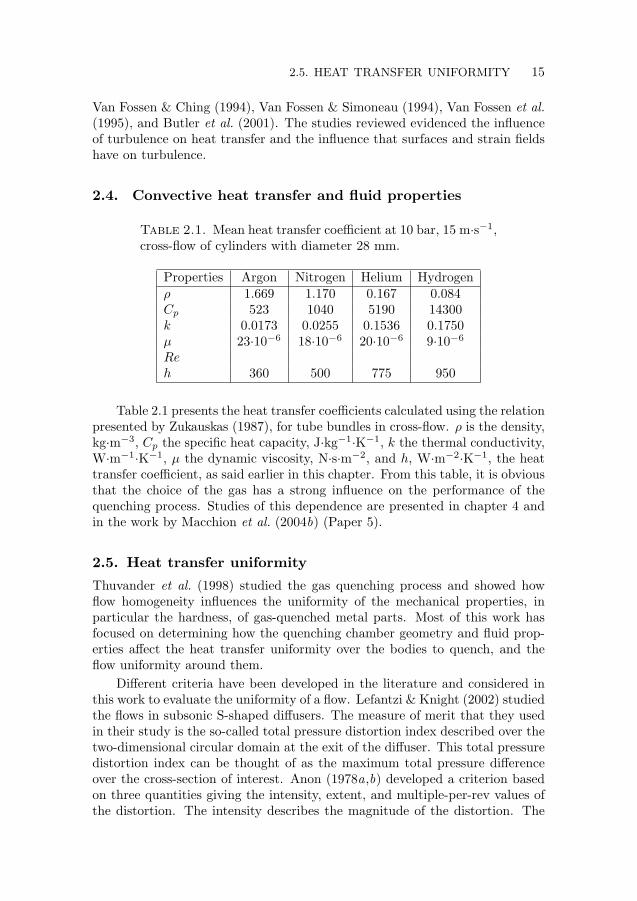
Table 2.1. Mean heat transfer coefficient at 10 bar, 15 m·s−1,cross-flow of cylinders with diameter 28 mm.
Properties Argon Nitrogen Helium Hydrogenρ 1.669 1.170 0.167 0.084Cp 523 1040 5190 14300k 0.0173 0.0255 0.1536 0.1750µ 23·10−6 18·10−6 20·10−6 9·10−6
Reh 360 500 775 950
Table 2.1 presents the heat transfer coefficients calculated using the relationpresented by Zukauskas (1987), for tube bundles in cross-flow. ρ is the density,kg·m−3, Cp the specific heat capacity, J·kg−1·K−1, k the thermal conductivity,W·m−1·K−1, µ the dynamic viscosity, N·s·m−2, and h, W·m−2·K−1, the heattransfer coefficient, as said earlier in this chapter. From this table, it is obviousthat the choice of the gas has a strong influence on the performance of thequenching process. Studies of this dependence are presented in chapter 4 andin the work by Macchion et al. (2004b) (Paper 5).
2.5. Heat transfer uniformity
Thuvander et al. (1998) studied the gas quenching process and showed howflow homogeneity influences the uniformity of the mechanical properties, inparticular the hardness, of gas-quenched metal parts. Most of this work hasfocused on determining how the quenching chamber geometry and fluid prop-erties affect the heat transfer uniformity over the bodies to quench, and theflow uniformity around them.
Different criteria have been developed in the literature and considered inthis work to evaluate the uniformity of a flow. Lefantzi & Knight (2002) studiedthe flows in subsonic S-shaped diffusers. The measure of merit that they usedin their study is the so-called total pressure distortion index described over thetwo-dimensional circular domain at the exit of the diffuser. This total pressuredistortion index can be thought of as the maximum total pressure differenceover the cross-section of interest. Anon (1978a,b) developed a criterion basedon three quantities giving the intensity, extent, and multiple-per-rev values ofthe distortion. The intensity describes the magnitude of the distortion. The
“thesisdraft” — 2005/5/9 — 8:51 — page 16 — #29ii
ii
ii
ii
16 2. QUENCHING CHAMBER AND PERFORMANCE PARAMETERS
extent describes the area covered by a low-pressure region, and the multiple-per-rev value describes the number of low-pressure regions there are in one360-deg revolution.
These criteria were found to give a very good overview of the flow unifor-mity, but were difficult to implement over complex geometries. Measures ofuniformity like the standard deviation, presented in equation (2.9), constitutea sufficiently good judge of the uniformity of a flow field.
N =1
uavg
√1S
∫S
(u− uavg)2dS, (2.9)
The uniformity of a heat transfer field is difficult to estimate without per-forming a calculation of the residual stresses inside the metal that is to bequenched. However, Thuvander et al. (1998) established that a uniform flowwill result in lower residual stresses, and as such it was decided to focus thework on finding out which parameters would influence in a beneficial way flowuniformity.
“thesisdraft” — 2005/5/9 — 8:51 — page 17 — #30ii
ii
ii
ii
CHAPTER 3
Mathematical modeling of flow and heat transfer
In this thesis the turbulent flow of a viscous, incompressible fluid is considered.The hydrodynamics of the flow field is described by the Navier-Stokes equations
ρ
(∂ui
∂t+ uj
∂ui
∂xj
)= − ∂p
∂xi+ µ∇2ui, (3.1)
and the continuity equation∂ui
∂xi= 0, (3.2)
where ρ is the density of the fluid, µ is the kinematic viscosity of the fluid, andxi is the spatial coordinate. Note that the Einstein notation is applied in allequations.
The thermal field is described by the energy equation
ρCp
(∂T
∂t+ ui
∂T
∂xi
)=
∂
∂xi
(k∂T
∂xi
). (3.3)
where T is the temperature of the fluid, and k is the thermal conductivity ofthe fluid.
Velocity, pressure, and temperature are decomposed into mean and fluctu-ating parts as
φ = Φ + φ, (3.4)
where Φ denotes the mean value of the flow or temperature variable. Forgeneral turbulent flows that are neither statistically steady not homogeneous,the mean value of any variable φ is taken to be the ensemble average
φ = φ(E)
(x) = limN→∞
1N
N∑k=1
φ(x, t)(k), (3.5)
where the average is taken over N repeated experiments. The mean value ofa statistically steady turbulent variable φ can simply be taken to be the timeaverage
φ = φ(T )
(x) = limT→∞
12T
∫ T
−T
φ(x, t)dt, (3.6)
whereas for spatially homogeneous turbulence, a volume average can be used,
φ = φ(V )
(x) = limV→∞
1V
∫V
φ(x, t)d3x. (3.7)
17
“thesisdraft” — 2005/5/9 — 8:51 — page 18 — #31ii
ii
ii
ii
18 3. MATHEMATICAL MODELING OF FLOW AND HEAT TRANSFER
The ergodic hypothesis is assumed to apply, namely, that in a statisticallysteady turbulent flow, it is assumed that
φ(T )
= φ(E), (3.8)
and in a homogeneous turbulent flow is is assumed that
φ(V )
= φ(E). (3.9)
The Reynolds-averaged Navier-Stokes equations, which physically corre-sponds to the conservation of mean momentum, takes the form
ρUj∂Ui
∂xj= − ∂P
∂xi+ µ∇2Ui − ρ
∂uiuj
∂xj, (3.10)
where uiuj is the Reynolds-stress tensor. Equation 3.10 is obtained by sub-stituting the decomposition 3.4 into the Navier-Stokes equations 3.1 and thentaking an ensemble average. The mean continuity equation is given by
∂Ui
∂xi= 0, (3.11)
and is obtained by taking the ensemble average of equation 3.2.The steady energy equation is given by
Cp∂
∂xiρUiT =
∂
∂xi
(k∂T
∂xi− CpρuiT
). (3.12)
Methods of determination of the dynamic viscosity and thermal conduc-tivity of pure gases and mixtures of pure gases are presented in section 3.1.
Equations (3.10), (3.11), and (3.12) do not represent a closed system forthe determination of the mean velocity Ui, the mean pressure P , and the meantemperature T , since there are six additional unknowns contained within theReynolds stress tensor which has its origin in the non-linear, advective term ofthe Navier-Stokes equations. In section 3.2 several models for the Reynolds-stress are presented, and their use is discussed in relation to the present work.
3.1. Gas properties
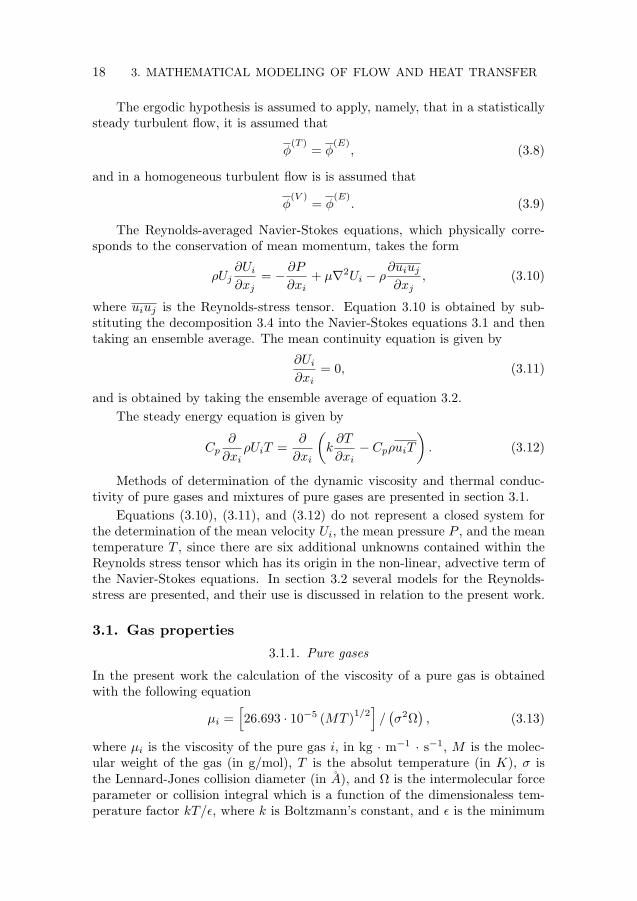
3.1.1. Pure gases
In the present work the calculation of the viscosity of a pure gas is obtainedwith the following equation
µi =[26.693 · 10−5 (MT )1/2
]/(σ2Ω
), (3.13)
where µi is the viscosity of the pure gas i, in kg · m−1 · s−1, M is the molec-ular weight of the gas (in g/mol), T is the absolut temperature (in K), σ isthe Lennard-Jones collision diameter (in A), and Ω is the intermolecular forceparameter or collision integral which is a function of the dimensionaless tem-perature factor kT/ε, where k is Boltzmann’s constant, and ε is the minimum

“thesisdraft” — 2005/5/9 — 8:51 — page 19 — #32ii
ii
ii
ii
3.1. GAS PROPERTIES 19
of the potential energy of interaction between two like molecules as they ap-proach each other. The theoretical background and experimental validation ofthis formula can be found in the book by Bird et al. (2002).
A simple semiempirical method of accounting for the energy exchange inpolyatomic gases was developed by Eucken, and is presented in the book byReid et al. (1987). Eucken’s equation for thermal conductivity of a polyatomicgas at low density reads
ki =(Cp +
54R
M
)µ (3.14)
where ki is the thermal conductivity of the pure gas i, in W · m−1 · K−1. µis the viscosity defined by equation (3.13). This Eucken formula includes themonatomic expression k = 15Rµ/4M as a special case, because Cp = 5R/2Mfor monatomic gases.
3.1.2. Mixtures of pure gases
The calculation of the transport properties of gas mixtures is a complex subject.Thorough reviews on the subject can be found in publications by Copeland(2003) and Monnery et al. (1995).
The viscosity of a gas mixture is calculated by the semi-empirical formula,equation (3.15), proposed by Wilke (1950).
µ =n∑
i=1
xiµi/
n∑j=1
(xjΦij)
, (3.15)
while the thermal conductivity of a gas mixture is given by the formula, seeMason & Saxena (1958),
k =n∑
i=1
xiki/
n∑j=1
(xjΦij)
, (3.16)
In the two formulae 3.15 and 3.16 the dimensionless quantities Φij are:
Φij =18
(1 +
Mi
Mj
)−1/2[1 +
(µi
µj
)1/2(Mj
Mi
)1/4]2
, (3.17)
where xi is the mole fraction of the component i, µi is the viscosity of the purecomponent i at the system temperature and pressure. The Φij are functionsrelated to the molecular weights and viscosities of each pure component in themixture. The previous set of formulae is valid only for non polar gases. For thecalculation of the transport properties of polar gases please refer to the workby Copeland (2003).
In this thesis, mixtures of only hydrogen and nitrogen were considered. Fol-lowing of Faura et al. (1998), the thermal capacity Cp of mixtures of hydrogenand nitrogen is calculated from the relation
Cp = XH2 × CpH2+ (1−XH2)× CpN2
, (3.18)
“thesisdraft” — 2005/5/9 — 8:51 — page 20 — #33ii
ii
ii
ii
20 3. MATHEMATICAL MODELING OF FLOW AND HEAT TRANSFER
where CpH2is the thermal capacity of pure hydrogen, while CpN2
is the thermalcapacity of pure nitrogen.
3.2. Turbulence modeling
In this thesis, two kinds of turbulence models were used. These two models arepresented and discussed in detail in the following sections.
3.2.1. Shear-Stress Transport model
The Reynolds stress, −uiuj , is modelled using the Shear Stress Transport (SST)model proposed by Menter (1993). In this model, additional transport equa-tions are solved for the turbulent kinetic energy, k, and the turbulence fre-quency, ω.
The SST model is a further advancement of the baseline (BSL) k-ω modelby Menter (1993). The BSL model is identical to the k-ω model of Wilcox(1988) for the inner region of a boundary layer, up to y+ = 11.02, and graduallychanges to the standard k-ε model in the outer wake region. The addition ofa limiter on the value of the turbulent viscosity νt gives the SST model. Thestructure of the model is outlined in the following and for a more detaileddiscussion the reader is refered to the original paper by Menter (1993) and theone by Vieser et al. (2001).
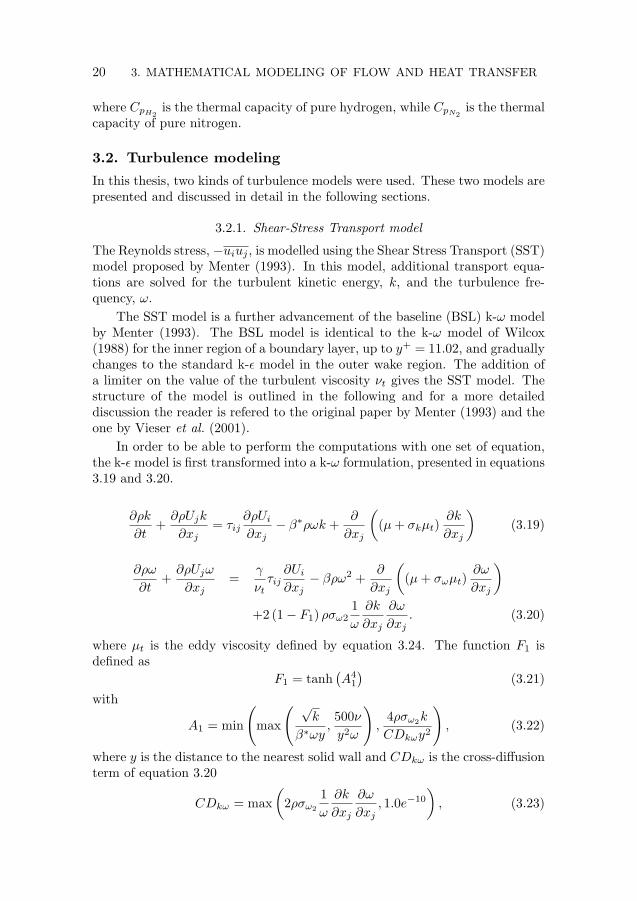
In order to be able to perform the computations with one set of equation,the k-ε model is first transformed into a k-ω formulation, presented in equations3.19 and 3.20.
∂ρk
∂t+∂ρUjk
∂xj= τij
∂ρUi
∂xj− β∗ρωk +
∂
∂xj
((µ+ σkµt)
∂k
∂xj
)(3.19)
∂ρω
∂t+∂ρUjω
∂xj=
γ
νtτij∂Ui
∂xj− βρω2 +
∂
∂xj
((µ+ σωµt)
∂ω
∂xj
)+2 (1− F1) ρσω2
1ω
∂k
∂xj
∂ω
∂xj. (3.20)
where µt is the eddy viscosity defined by equation 3.24. The function F1 isdefined as
F1 = tanh(A4
1
)(3.21)
with
A1 = min
(max
( √k
β∗ωy,500νy2ω
),
4ρσω2k
CDkωy2
), (3.22)
where y is the distance to the nearest solid wall and CDkω is the cross-diffusionterm of equation 3.20
CDkω = max(
2ρσω2
1ω
∂k
∂xj
∂ω
∂xj, 1.0e−10
), (3.23)
“thesisdraft” — 2005/5/9 — 13:24 — page 21 — #34!!
!!
!!
!!
3.2. TURBULENCE MODELING 21
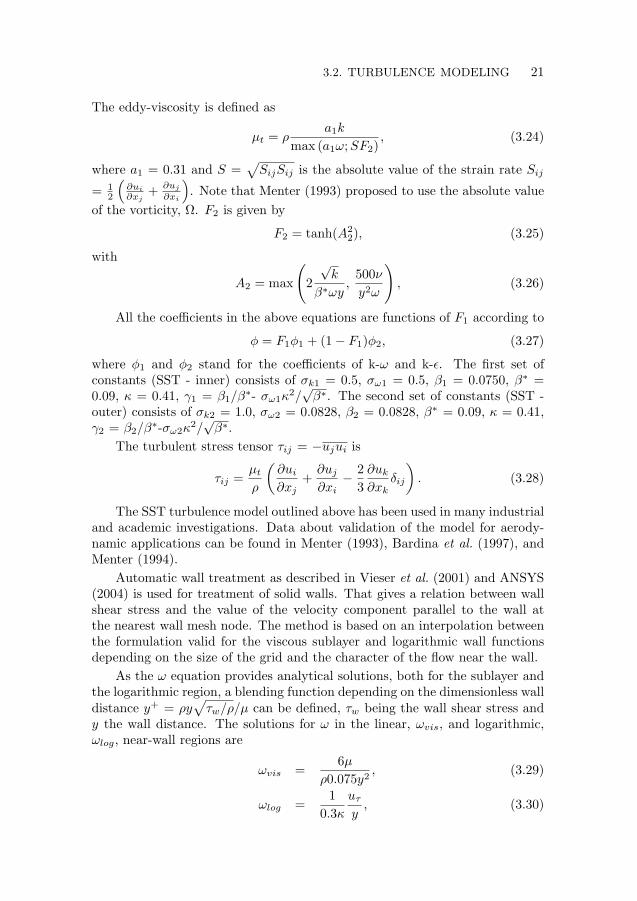
The eddy-viscosity is defined as
µt = ρa1k
max (a1ω;SF2), (3.24)
where a1 = 0.31 and S =√
SijSij is the absolute value of the strain rate Sij
= 12
(∂ui∂xj
+ ∂uj
∂xi
). Note that Menter (1993) proposed to use the absolute value
of the vorticity, Ω. F2 is given by
F2 = tanh(A22), (3.25)
with
A2 = max
(2√
k
β∗ωy,
500ν
y2ω
), (3.26)
All the coefficients in the above equations are functions of F1 according to
φ = F1φ1 + (1− F1)φ2, (3.27)
where φ1 and φ2 stand for the coefficients of k-ω and k-ε. The first set ofconstants (SST - inner) consists of σk1 = 0.5, σω1 = 0.5, β1 = 0.0750, β∗ =0.09, κ = 0.41, γ1 = β1/β∗- σω1κ2/
√β∗. The second set of constants (SST -
outer) consists of σk2 = 1.0, σω2 = 0.0828, β2 = 0.0828, β∗ = 0.09, κ = 0.41,γ2 = β2/β∗-σω2κ2/
√β∗.
The turbulent stress tensor τij = −ujui is
τij =µt
ρ
(∂ui
∂xj+
∂uj
∂xi− 2
3∂uk
∂xkδij
). (3.28)
The SST turbulence model outlined above has been used in many industrialand academic investigations. Data about validation of the model for aerody-namic applications can be found in Menter (1993), Bardina et al. (1997), andMenter (1994).
Automatic wall treatment as described in Vieser et al. (2001) and ANSYS(2004) is used for treatment of solid walls. That gives a relation between wallshear stress and the value of the velocity component parallel to the wall atthe nearest wall mesh node. The method is based on an interpolation betweenthe formulation valid for the viscous sublayer and logarithmic wall functionsdepending on the size of the grid and the character of the flow near the wall.
As the ω equation provides analytical solutions, both for the sublayer andthe logarithmic region, a blending function depending on the dimensionless walldistance y+ = ρy
√τw/ρ/µ can be defined, τw being the wall shear stress and
y the wall distance. The solutions for ω in the linear, ωvis, and logarithmic,ωlog, near-wall regions are
ωvis =6µ
ρ0.075y2, (3.29)
ωlog =1
0.3κ
uτ
y, (3.30)
“thesisdraft” — 2005/5/9 — 8:51 — page 22 — #35ii
ii
ii
ii
22 3. MATHEMATICAL MODELING OF FLOW AND HEAT TRANSFER
which can be reformulated in terms of y+ and a smooth blending function as
ω(y+) =(ω2
vis(y+) + ω2
log(y+))0.5
, (3.31)
can be defined. It is of importance to notice that no explicit reference to thelimiting y+ = 11.02 is made. A similar formulation is used for the velocityprofile near the wall, as stated in equations 3.32, 3.33, and 3.34.
uvisτ =
Ut
y+, (3.32)
ulogτ =
Ut1κ ln(y+) + C
, (3.33)
uτ =[(uvis
τ
)4+(ulog
τ
)4]0.25
(3.34)
where C = 5.0. This formulation gives the relation between the velocity at thefirst node near the wall, Ut, and the wall shear stress. For the k-equation 3.19a zero flux boundary condition is applied, as this is correct both for the lowReynolds number and the logarithmic limit.
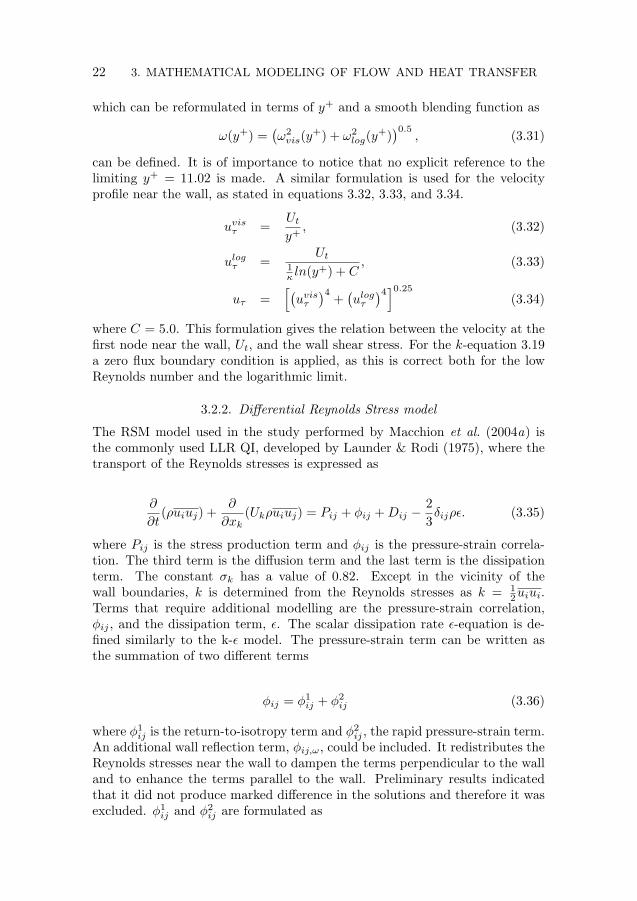
3.2.2. Differential Reynolds Stress model
The RSM model used in the study performed by Macchion et al. (2004a) isthe commonly used LLR QI, developed by Launder & Rodi (1975), where thetransport of the Reynolds stresses is expressed as
∂
∂t(ρuiuj) +
∂
∂xk(Ukρuiuj) = Pij + φij +Dij −
23δijρε. (3.35)
where Pij is the stress production term and φij is the pressure-strain correla-tion. The third term is the diffusion term and the last term is the dissipationterm. The constant σk has a value of 0.82. Except in the vicinity of thewall boundaries, k is determined from the Reynolds stresses as k = 1
2uiui.Terms that require additional modelling are the pressure-strain correlation,φij , and the dissipation term, ε. The scalar dissipation rate ε-equation is de-fined similarly to the k-ε model. The pressure-strain term can be written asthe summation of two different terms
φij = φ1ij + φ2
ij (3.36)
where φ1ij is the return-to-isotropy term and φ2
ij , the rapid pressure-strain term.An additional wall reflection term, φij,ω, could be included. It redistributes theReynolds stresses near the wall to dampen the terms perpendicular to the walland to enhance the terms parallel to the wall. Preliminary results indicatedthat it did not produce marked difference in the solutions and therefore it wasexcluded. φ1
ij and φ2ij are formulated as
“thesisdraft” — 2005/5/9 — 8:51 — page 23 — #36ii
ii
ii
ii
3.3. SOLUTION METHODOLOGY 23
φ1ij = −C1ρ
ε
k
[uiuj −
23δijk
], (3.37)
where C1 is 1.8, and
φ2ij = −C2
[(Pij − Cij)−
13δij (Pkk − Ckk)
], (3.38)
where C2 is 0.60. Cij is the convection term defined as the second term on theleft hand side of equation (3.35).
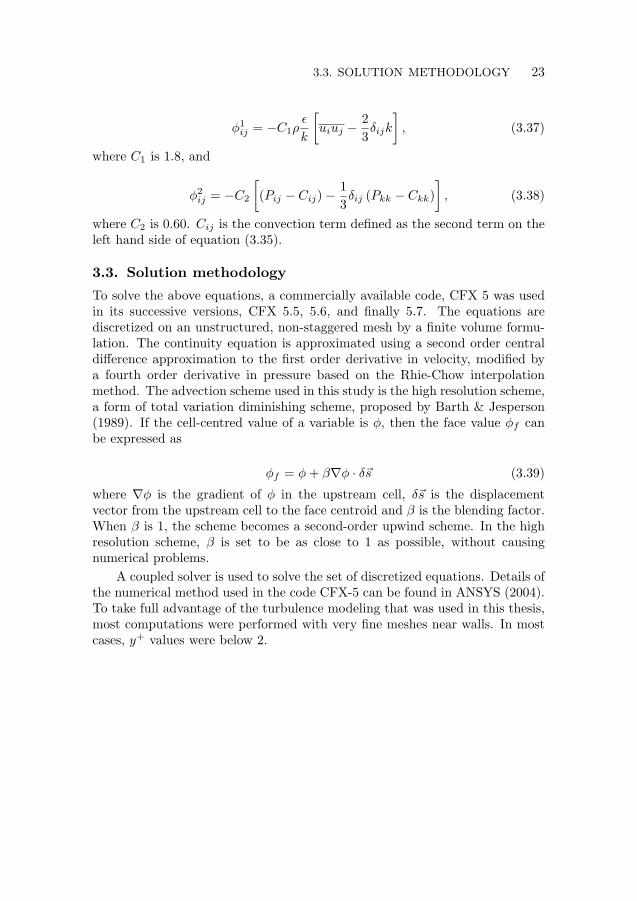
3.3. Solution methodology
To solve the above equations, a commercially available code, CFX 5 was usedin its successive versions, CFX 5.5, 5.6, and finally 5.7. The equations arediscretized on an unstructured, non-staggered mesh by a finite volume formu-lation. The continuity equation is approximated using a second order centraldifference approximation to the first order derivative in velocity, modified bya fourth order derivative in pressure based on the Rhie-Chow interpolationmethod. The advection scheme used in this study is the high resolution scheme,a form of total variation diminishing scheme, proposed by Barth & Jesperson(1989). If the cell-centred value of a variable is φ, then the face value φf canbe expressed as
φf = φ+ β∇φ · δ~s (3.39)
where ∇φ is the gradient of φ in the upstream cell, δ~s is the displacementvector from the upstream cell to the face centroid and β is the blending factor.When β is 1, the scheme becomes a second-order upwind scheme. In the highresolution scheme, β is set to be as close to 1 as possible, without causingnumerical problems.
A coupled solver is used to solve the set of discretized equations. Details ofthe numerical method used in the code CFX-5 can be found in ANSYS (2004).To take full advantage of the turbulence modeling that was used in this thesis,most computations were performed with very fine meshes near walls. In mostcases, y+ values were below 2.
“thesisdraft” — 2005/5/9 — 8:51 — page 24 — #37ii
ii
ii
ii
CHAPTER 4
Summary of results
In this chapter a summary of the results directly applicable to gas quenchingfurnace design is presented. In addition to the work summarized here, the largeeddy simulation methodology has been evaluated as a tool for investigation ofturbulence fluctuations. The result of that study is only discussed in the workby Macchion (2005) (Paper 7).
The factors influencing the heat transfer around a bluff body are discussedstarting with the difficulty of modeling flows around blunt bodies in section 4.1.Section 4.2 presents some features of the axial flow and heat transfer around acylinder placed in a periodic stack. In section 4.3 the influence of gas mixturecomposition is presented. These sections summarize the work presented inMacchion & Zahrai (2004) (Paper 3) and Macchion et al. (2004b) (Paper 5).
The hydrodynamics and heat transfer within the VUTK gas quenchingfurnace follows in section 4.4. In section 4.4.1 the numerical method presentedin chapter 3 is validated, the case being the empty VUTK furnace. Section 4.4.2presents summarized results of the work presented in the texts by Macchionet al. (2004c) (Paper 1) and Macchion et al. (2005b) (Paper 2), where the flowand heat transfer around and over two types of charges, one made of plates, theother of cylinders, were computed. A focus on the influence of the dimensionsof the quenching chamber is performed in sectionch:quenchcorr, parts of theresults presented here being taken from Macchion et al. (2005a) (Paper 6).
Sections 4.6 and 4.7 focus on the influence of the design of the entrance tothe quenching chamber on flow uniformity. Detailed studies of such topic canbe found in the studies performed by Macchion et al. (2004a) (Paper 4) andMacchion et al. (2004c) (Paper 1).
4.1. Heat transfer around a cylinder in axial homogeneousflow
The prediction of the flow around a bluff body has triggered a large interest inthe past years. Lots of research has been performed on models describing withaccuracy the complex flows arising around objects like cars, buses, and trains.In gas quenching, most metal pieces to quench are bluff bodies, giving riseto massive flow separations, See e.g. Igarashi (1981), Roshko (1955), Roshko(1993), and Koenig & Roshko (1985).
24
“thesisdraft” — 2005/5/9 — 8:51 — page 25 — #38ii
ii
ii
ii
4.1. HEAT TRANSFER AROUND A CYLINDER IN
AXIAL HOMOGENEOUS FLOW
25
In this work the focus has been on the use of eddy-viscosity models, rel-atively more simple than Reynolds stress models. The choice of the eddy-viscosity models was done both to save computational resources, and to ensurethat one obtains a converged result in a reasonable time. This ensures that themethod validated in the present section can be used in an industrial context.
In the following, numerical predictions of the flow and heat transfer arounda cylinder in axial flow are discussed. The test cylinder dimensions are D =0.15 m, L = 0.3 m.
Table 4.1. Mesh sizes.
Mesh Size U1 [m/s] T [K]1 1225800 -3.3 2602 2500000 -3.3 2723 3580000 -3.2 275
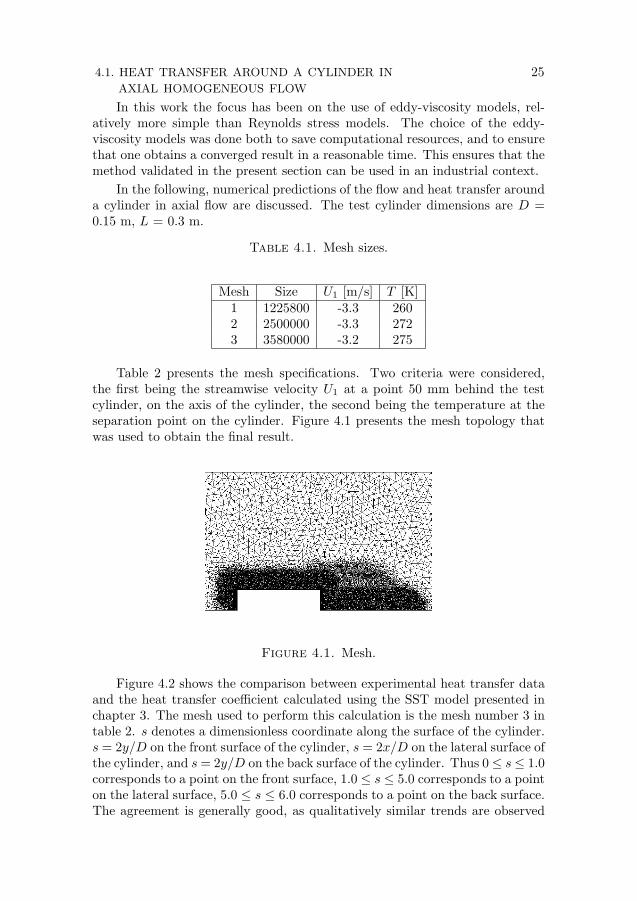
Table 2 presents the mesh specifications. Two criteria were considered,the first being the streamwise velocity U1 at a point 50 mm behind the testcylinder, on the axis of the cylinder, the second being the temperature at theseparation point on the cylinder. Figure 4.1 presents the mesh topology thatwas used to obtain the final result.
Figure 4.1. Mesh.
Figure 4.2 shows the comparison between experimental heat transfer dataand the heat transfer coefficient calculated using the SST model presented inchapter 3. The mesh used to perform this calculation is the mesh number 3 intable 2. s denotes a dimensionless coordinate along the surface of the cylinder.s = 2y/D on the front surface of the cylinder, s = 2x/D on the lateral surface ofthe cylinder, and s= 2y/D on the back surface of the cylinder. Thus 0≤ s≤ 1.0corresponds to a point on the front surface, 1.0 ≤ s ≤ 5.0 corresponds to a pointon the lateral surface, 5.0 ≤ s ≤ 6.0 corresponds to a point on the back surface.The agreement is generally good, as qualitatively similar trends are observed
“thesisdraft” — 2005/5/9 — 8:51 — page 26 — #39ii
ii
ii
ii
26 4. SUMMARY OF RESULTS
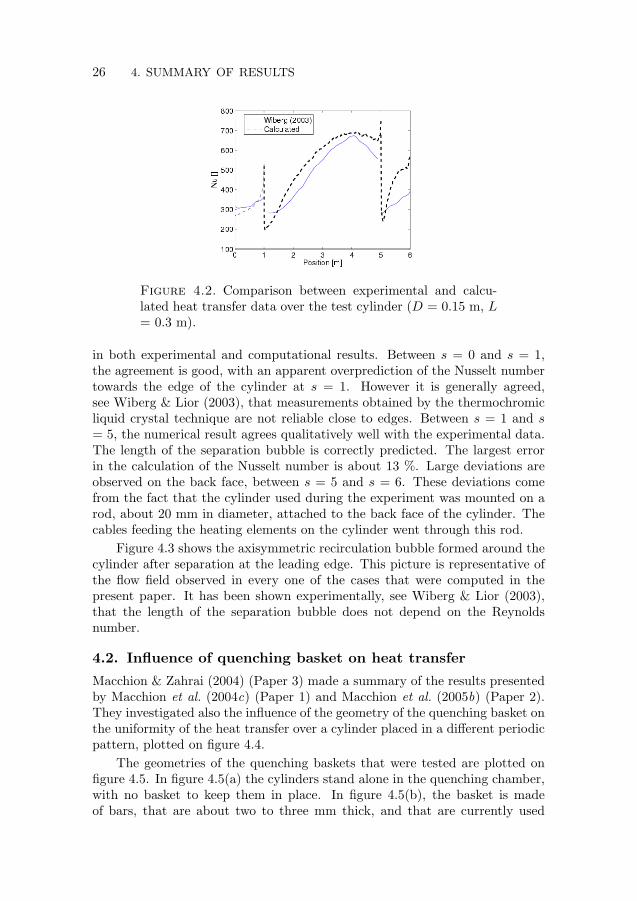
Figure 4.2. Comparison between experimental and calcu-lated heat transfer data over the test cylinder (D = 0.15 m, L= 0.3 m).
in both experimental and computational results. Between s = 0 and s = 1,the agreement is good, with an apparent overprediction of the Nusselt numbertowards the edge of the cylinder at s = 1. However it is generally agreed,see Wiberg & Lior (2003), that measurements obtained by the thermochromicliquid crystal technique are not reliable close to edges. Between s = 1 and s= 5, the numerical result agrees qualitatively well with the experimental data.The length of the separation bubble is correctly predicted. The largest errorin the calculation of the Nusselt number is about 13 %. Large deviations areobserved on the back face, between s = 5 and s = 6. These deviations comefrom the fact that the cylinder used during the experiment was mounted on arod, about 20 mm in diameter, attached to the back face of the cylinder. Thecables feeding the heating elements on the cylinder went through this rod.
Figure 4.3 shows the axisymmetric recirculation bubble formed around thecylinder after separation at the leading edge. This picture is representative ofthe flow field observed in every one of the cases that were computed in thepresent paper. It has been shown experimentally, see Wiberg & Lior (2003),that the length of the separation bubble does not depend on the Reynoldsnumber.
4.2. Influence of quenching basket on heat transfer
Macchion & Zahrai (2004) (Paper 3) made a summary of the results presentedby Macchion et al. (2004c) (Paper 1) and Macchion et al. (2005b) (Paper 2).They investigated also the influence of the geometry of the quenching basket onthe uniformity of the heat transfer over a cylinder placed in a different periodicpattern, plotted on figure 4.4.
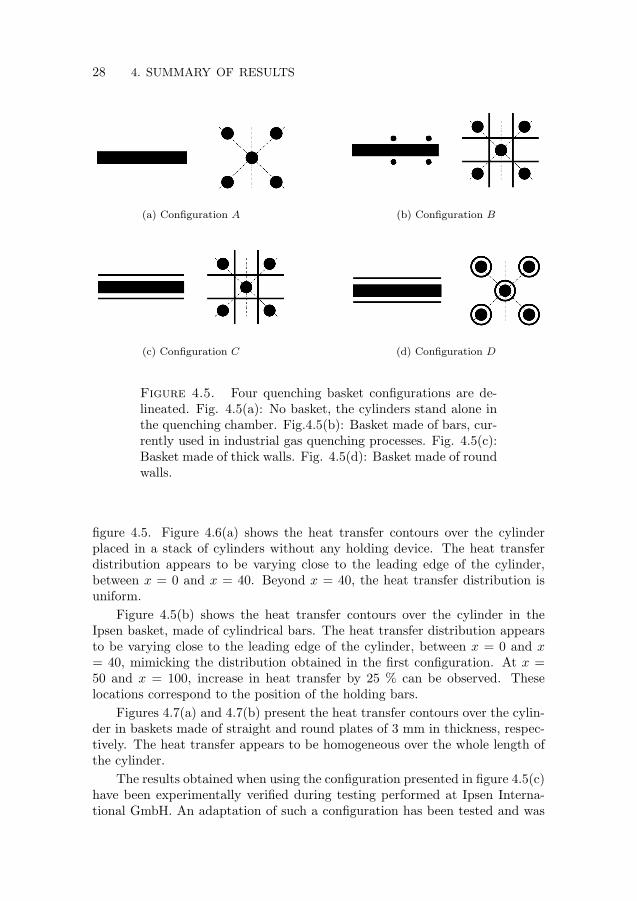
The geometries of the quenching baskets that were tested are plotted onfigure 4.5. In figure 4.5(a) the cylinders stand alone in the quenching chamber,with no basket to keep them in place. In figure 4.5(b), the basket is madeof bars, that are about two to three mm thick, and that are currently used
“thesisdraft” — 2005/5/9 — 8:51 — page 27 — #40ii
ii
ii
ii
4.2. INFLUENCE OF QUENCHING BASKET ON HEAT TRANSFER 27
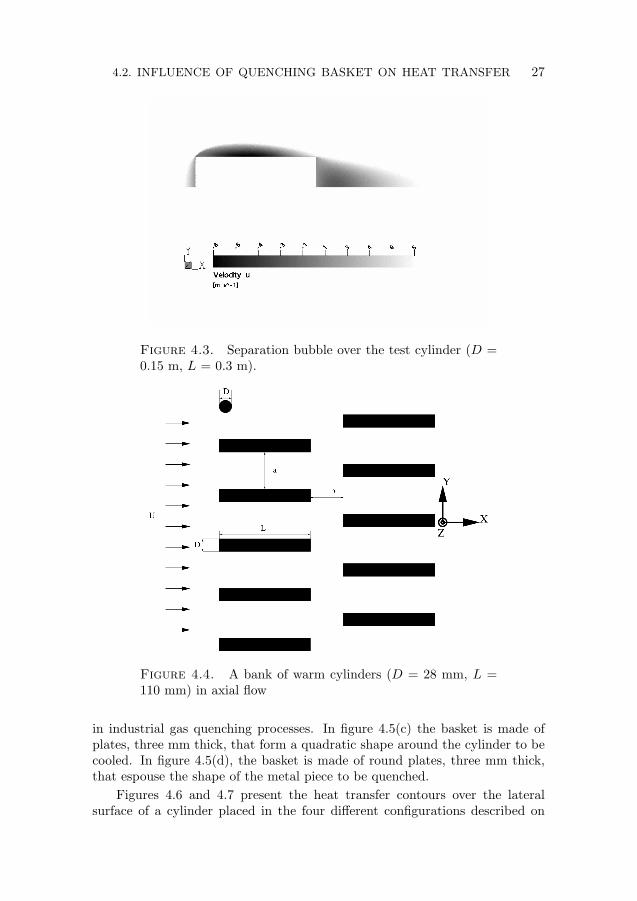
Figure 4.3. Separation bubble over the test cylinder (D =0.15 m, L = 0.3 m).
Figure 4.4. A bank of warm cylinders (D = 28 mm, L =110 mm) in axial flow
in industrial gas quenching processes. In figure 4.5(c) the basket is made ofplates, three mm thick, that form a quadratic shape around the cylinder to becooled. In figure 4.5(d), the basket is made of round plates, three mm thick,that espouse the shape of the metal piece to be quenched.
Figures 4.6 and 4.7 present the heat transfer contours over the lateralsurface of a cylinder placed in the four different configurations described on
“thesisdraft” — 2005/5/9 — 8:51 — page 28 — #41ii
ii
ii
ii
28 4. SUMMARY OF RESULTS
(a) Configuration A (b) Configuration B
(c) Configuration C (d) Configuration D
Figure 4.5. Four quenching basket configurations are de-lineated. Fig. 4.5(a): No basket, the cylinders stand alone inthe quenching chamber. Fig.4.5(b): Basket made of bars, cur-rently used in industrial gas quenching processes. Fig. 4.5(c):Basket made of thick walls. Fig. 4.5(d): Basket made of roundwalls.
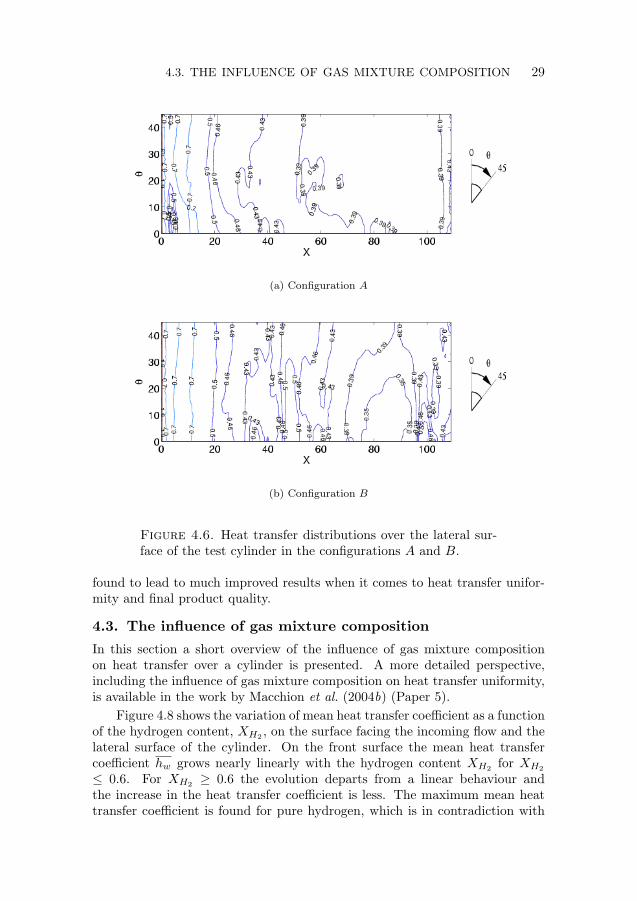
figure 4.5. Figure 4.6(a) shows the heat transfer contours over the cylinderplaced in a stack of cylinders without any holding device. The heat transferdistribution appears to be varying close to the leading edge of the cylinder,between x = 0 and x = 40. Beyond x = 40, the heat transfer distribution isuniform.
Figure 4.5(b) shows the heat transfer contours over the cylinder in theIpsen basket, made of cylindrical bars. The heat transfer distribution appearsto be varying close to the leading edge of the cylinder, between x = 0 and x= 40, mimicking the distribution obtained in the first configuration. At x =50 and x = 100, increase in heat transfer by 25 % can be observed. Theselocations correspond to the position of the holding bars.
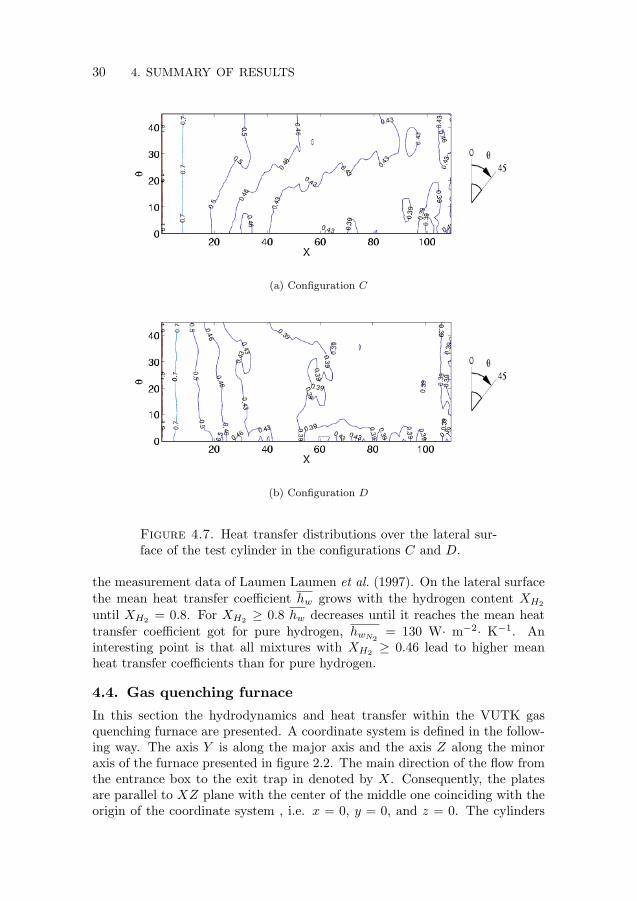
Figures 4.7(a) and 4.7(b) present the heat transfer contours over the cylin-der in baskets made of straight and round plates of 3 mm in thickness, respec-tively. The heat transfer appears to be homogeneous over the whole length ofthe cylinder.
The results obtained when using the configuration presented in figure 4.5(c)have been experimentally verified during testing performed at Ipsen Interna-tional GmbH. An adaptation of such a configuration has been tested and was
“thesisdraft” — 2005/5/9 — 8:51 — page 29 — #42ii
ii
ii
ii
4.3. THE INFLUENCE OF GAS MIXTURE COMPOSITION 29
(a) Configuration A
(b) Configuration B
Figure 4.6. Heat transfer distributions over the lateral sur-face of the test cylinder in the configurations A and B.
found to lead to much improved results when it comes to heat transfer unifor-mity and final product quality.
4.3. The influence of gas mixture composition
In this section a short overview of the influence of gas mixture compositionon heat transfer over a cylinder is presented. A more detailed perspective,including the influence of gas mixture composition on heat transfer uniformity,is available in the work by Macchion et al. (2004b) (Paper 5).
Figure 4.8 shows the variation of mean heat transfer coefficient as a functionof the hydrogen content, XH2 , on the surface facing the incoming flow and thelateral surface of the cylinder. On the front surface the mean heat transfercoefficient hw grows nearly linearly with the hydrogen content XH2 for XH2
≤ 0.6. For XH2 ≥ 0.6 the evolution departs from a linear behaviour andthe increase in the heat transfer coefficient is less. The maximum mean heattransfer coefficient is found for pure hydrogen, which is in contradiction with
“thesisdraft” — 2005/5/9 — 8:51 — page 30 — #43ii
ii
ii
ii
30 4. SUMMARY OF RESULTS
(a) Configuration C
(b) Configuration D
Figure 4.7. Heat transfer distributions over the lateral sur-face of the test cylinder in the configurations C and D.
the measurement data of Laumen Laumen et al. (1997). On the lateral surfacethe mean heat transfer coefficient hw grows with the hydrogen content XH2
until XH2 = 0.8. For XH2 ≥ 0.8 hw decreases until it reaches the mean heattransfer coefficient got for pure hydrogen, hwN2
= 130 W· m−2· K−1. Aninteresting point is that all mixtures with XH2 ≥ 0.46 lead to higher meanheat transfer coefficients than for pure hydrogen.
4.4. Gas quenching furnace
In this section the hydrodynamics and heat transfer within the VUTK gasquenching furnace are presented. A coordinate system is defined in the follow-ing way. The axis Y is along the major axis and the axis Z along the minoraxis of the furnace presented in figure 2.2. The main direction of the flow fromthe entrance box to the exit trap in denoted by X. Consequently, the platesare parallel to XZ plane with the center of the middle one coinciding with theorigin of the coordinate system , i.e. x = 0, y = 0, and z = 0. The cylinders

“thesisdraft” — 2005/5/9 — 8:51 — page 31 — #44ii
ii
ii
ii
4.4. GAS QUENCHING FURNACE 31
Figure 4.8. Variation of the mean heat transfer coefficientover the front and lateral surfaces of the cylinder, as a functionof gas mixture composition.
are placed at three different Y Z planes with three cylinders in the direction ofY and five cylinders in the direction of Z. The center of the cylinder in themiddle of the second plane coincides with the origin of the coordinate system.In the first case the empty furnace is modeled as a reference for comparisonwith experimental data. In the second case, the furnace is charged with 7 platesof dimensions 500 × 500 × 70 mm, half of which included in the computationaldomain. These plates are refered to as P(−3) to P(+3); P(0) will be the platesituated in the middle of the chamber. The third case consists of the VUTKfurnace charged with 45 cylinders, of length 150 mm and diameter 120 mm,where only 15 complete cylinders and 15 half-cylinders are included in the sim-ulation. The cylinders are refered to by a C with three indices denoting thelocation of the cylinder. As an example, C(0)(0)(0) will be the one in the middleof the charge, C(−1)(0)(0) will be the one in the middle of the plane near theentrance and C(+1)(+2)(+1) will be the cylinder located at the lower corner ofthe charge.
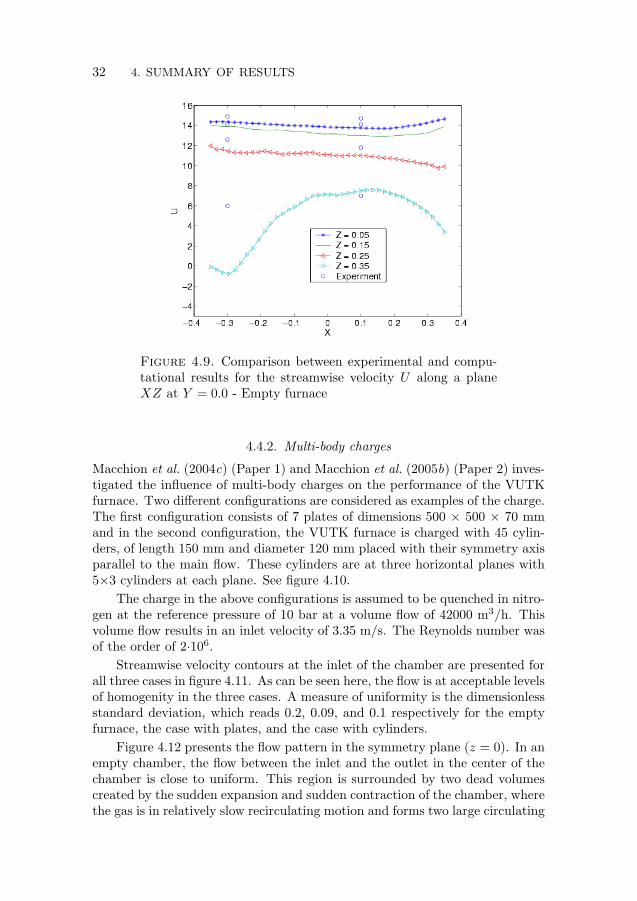
4.4.1. Validation of the computational model
Two series of velocity measurements were performed in the empty furnacepresented in section 2.2, using a Pitot tube. The first set of measurements wasdone just below the entrance trap, the second was performed at x = 0.1 m.Comparison of the results presented in figure 4.9 with this set of measurementsshows that the average velocity across the core of the chamber is correctlypredicted by the numerical model, the relative error being within 10 % of theexperimental results. Large deviations observed at x = -0.3 and z = 0.35 couldbe caused by eddies generated in that region as will be discussed below.
“thesisdraft” — 2005/5/9 — 8:51 — page 32 — #45ii
ii
ii
ii
32 4. SUMMARY OF RESULTS
Figure 4.9. Comparison between experimental and compu-tational results for the streamwise velocity U along a planeXZ at Y = 0.0 - Empty furnace
4.4.2. Multi-body charges
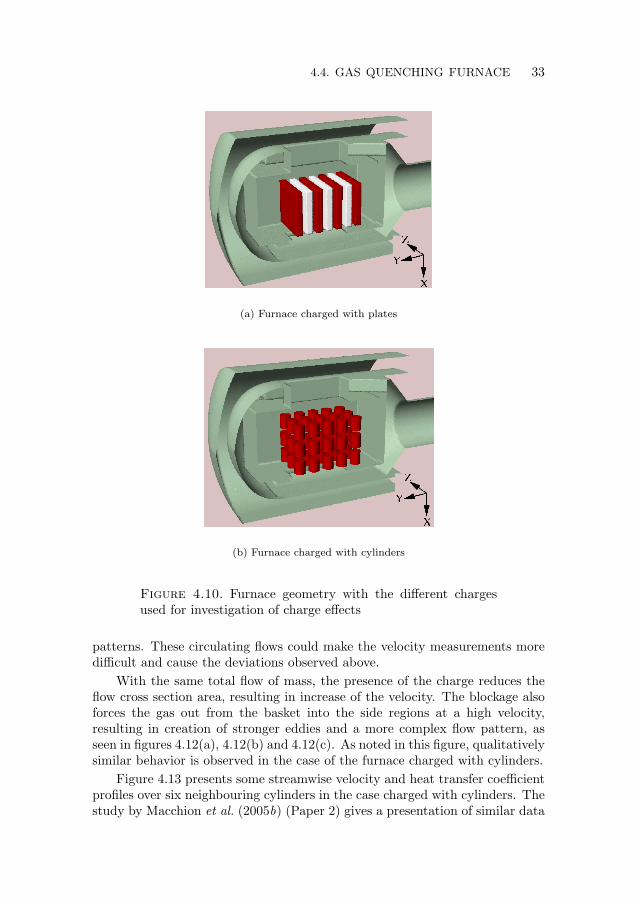
Macchion et al. (2004c) (Paper 1) and Macchion et al. (2005b) (Paper 2) inves-tigated the influence of multi-body charges on the performance of the VUTKfurnace. Two different configurations are considered as examples of the charge.The first configuration consists of 7 plates of dimensions 500 × 500 × 70 mmand in the second configuration, the VUTK furnace is charged with 45 cylin-ders, of length 150 mm and diameter 120 mm placed with their symmetry axisparallel to the main flow. These cylinders are at three horizontal planes with5×3 cylinders at each plane. See figure 4.10.
The charge in the above configurations is assumed to be quenched in nitro-gen at the reference pressure of 10 bar at a volume flow of 42000 m3/h. Thisvolume flow results in an inlet velocity of 3.35 m/s. The Reynolds number wasof the order of 2·106.
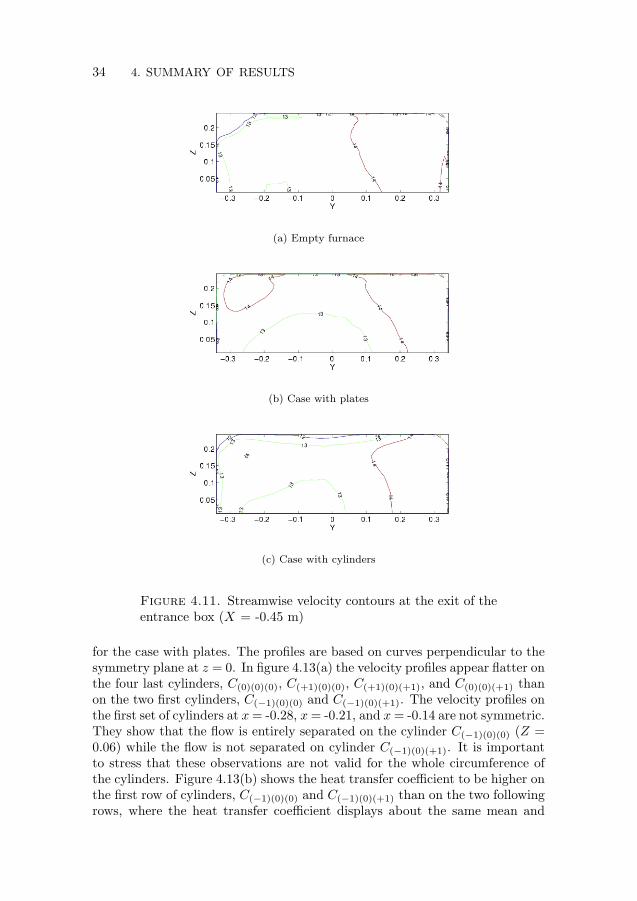
Streamwise velocity contours at the inlet of the chamber are presented forall three cases in figure 4.11. As can be seen here, the flow is at acceptable levelsof homogenity in the three cases. A measure of uniformity is the dimensionlessstandard deviation, which reads 0.2, 0.09, and 0.1 respectively for the emptyfurnace, the case with plates, and the case with cylinders.
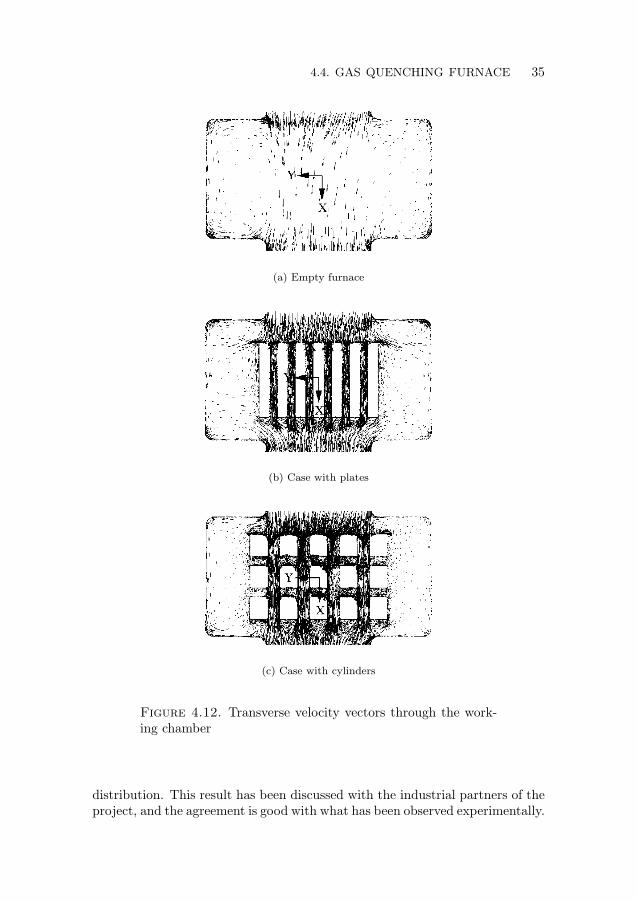
Figure 4.12 presents the flow pattern in the symmetry plane (z = 0). In anempty chamber, the flow between the inlet and the outlet in the center of thechamber is close to uniform. This region is surrounded by two dead volumescreated by the sudden expansion and sudden contraction of the chamber, wherethe gas is in relatively slow recirculating motion and forms two large circulating
“thesisdraft” — 2005/5/9 — 8:51 — page 33 — #46ii
ii
ii
ii
4.4. GAS QUENCHING FURNACE 33
(a) Furnace charged with plates
(b) Furnace charged with cylinders
Figure 4.10. Furnace geometry with the different chargesused for investigation of charge effects
patterns. These circulating flows could make the velocity measurements moredifficult and cause the deviations observed above.
With the same total flow of mass, the presence of the charge reduces theflow cross section area, resulting in increase of the velocity. The blockage alsoforces the gas out from the basket into the side regions at a high velocity,resulting in creation of stronger eddies and a more complex flow pattern, asseen in figures 4.12(a), 4.12(b) and 4.12(c). As noted in this figure, qualitativelysimilar behavior is observed in the case of the furnace charged with cylinders.
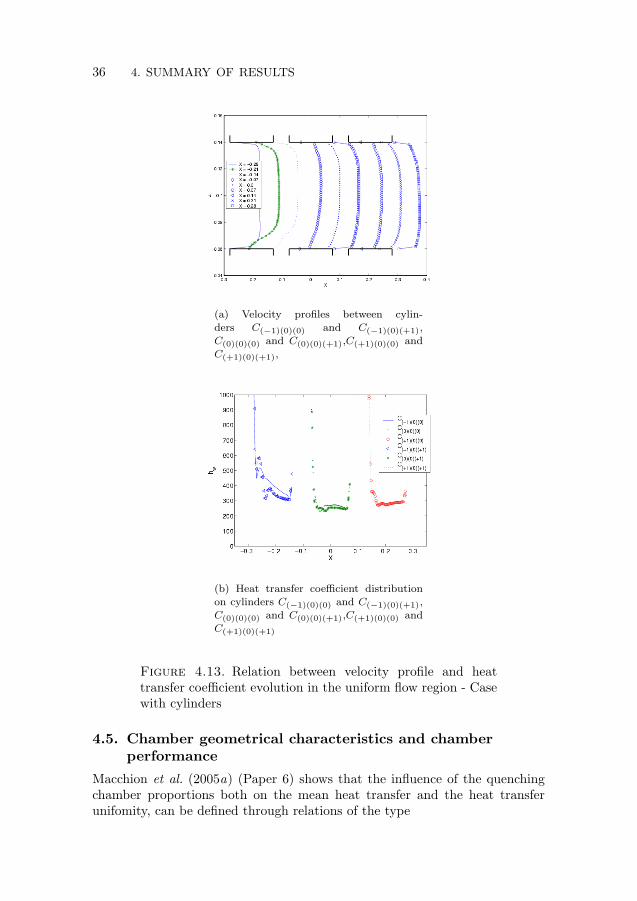
Figure 4.13 presents some streamwise velocity and heat transfer coefficientprofiles over six neighbouring cylinders in the case charged with cylinders. Thestudy by Macchion et al. (2005b) (Paper 2) gives a presentation of similar data
“thesisdraft” — 2005/5/9 — 8:51 — page 34 — #47ii
ii
ii
ii
34 4. SUMMARY OF RESULTS
(a) Empty furnace
(b) Case with plates
(c) Case with cylinders
Figure 4.11. Streamwise velocity contours at the exit of theentrance box (X = -0.45 m)
for the case with plates. The profiles are based on curves perpendicular to thesymmetry plane at z = 0. In figure 4.13(a) the velocity profiles appear flatter onthe four last cylinders, C(0)(0)(0), C(+1)(0)(0), C(+1)(0)(+1), and C(0)(0)(+1) thanon the two first cylinders, C(−1)(0)(0) and C(−1)(0)(+1). The velocity profiles onthe first set of cylinders at x= -0.28, x= -0.21, and x= -0.14 are not symmetric.They show that the flow is entirely separated on the cylinder C(−1)(0)(0) (Z =0.06) while the flow is not separated on cylinder C(−1)(0)(+1). It is importantto stress that these observations are not valid for the whole circumference ofthe cylinders. Figure 4.13(b) shows the heat transfer coefficient to be higher onthe first row of cylinders, C(−1)(0)(0) and C(−1)(0)(+1) than on the two followingrows, where the heat transfer coefficient displays about the same mean and
“thesisdraft” — 2005/5/9 — 8:51 — page 35 — #48ii
ii
ii
ii
4.4. GAS QUENCHING FURNACE 35
(a) Empty furnace
(b) Case with plates
(c) Case with cylinders
Figure 4.12. Transverse velocity vectors through the work-ing chamber
distribution. This result has been discussed with the industrial partners of theproject, and the agreement is good with what has been observed experimentally.
“thesisdraft” — 2005/5/9 — 8:51 — page 36 — #49ii
ii
ii
ii
36 4. SUMMARY OF RESULTS
(a) Velocity profiles between cylin-
ders C(−1)(0)(0) and C(−1)(0)(+1),
C(0)(0)(0) and C(0)(0)(+1),C(+1)(0)(0) andC(+1)(0)(+1),
(b) Heat transfer coefficient distribution
on cylinders C(−1)(0)(0) and C(−1)(0)(+1),C(0)(0)(0) and C(0)(0)(+1),C(+1)(0)(0) and
C(+1)(0)(+1)
Figure 4.13. Relation between velocity profile and heattransfer coefficient evolution in the uniform flow region - Casewith cylinders
4.5. Chamber geometrical characteristics and chamberperformance
Macchion et al. (2005a) (Paper 6) shows that the influence of the quenchingchamber proportions both on the mean heat transfer and the heat transferunifomity, can be defined through relations of the type
“thesisdraft” — 2005/5/9 — 8:51 — page 37 — #50ii
ii
ii
ii
4.5. CHAMBER GEOMETRICAL CHARACTERISTICS
AND CHAMBER PERFORMANCE
37
(a) (b)
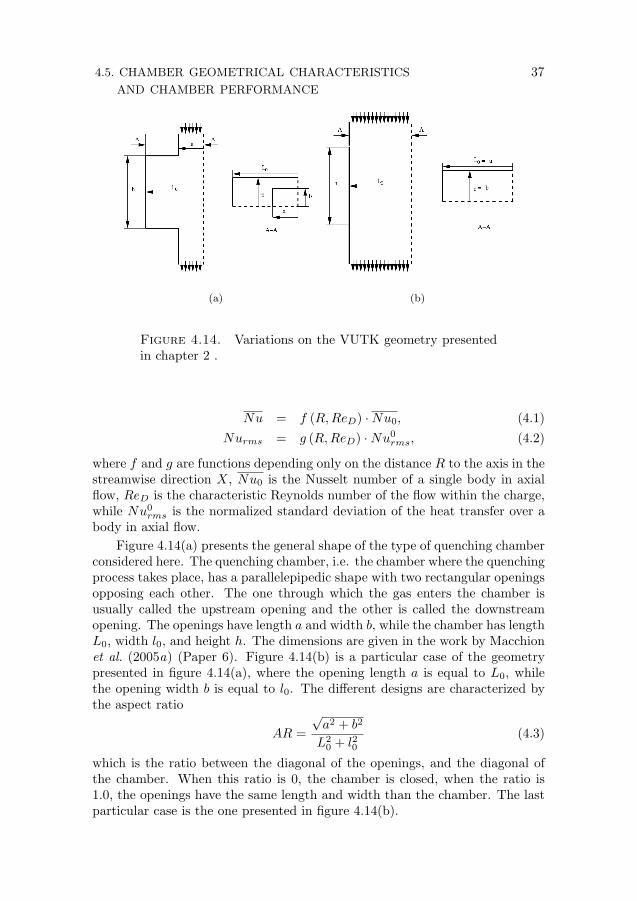
Figure 4.14. Variations on the VUTK geometry presentedin chapter 2 .
Nu = f (R,ReD) ·Nu0, (4.1)Nurms = g (R,ReD) ·Nu0
rms, (4.2)
where f and g are functions depending only on the distance R to the axis in thestreamwise direction X, Nu0 is the Nusselt number of a single body in axialflow, ReD is the characteristic Reynolds number of the flow within the charge,while Nu0
rms is the normalized standard deviation of the heat transfer over abody in axial flow.
Figure 4.14(a) presents the general shape of the type of quenching chamberconsidered here. The quenching chamber, i.e. the chamber where the quenchingprocess takes place, has a parallelepipedic shape with two rectangular openingsopposing each other. The one through which the gas enters the chamber isusually called the upstream opening and the other is called the downstreamopening. The openings have length a and width b, while the chamber has lengthL0, width l0, and height h. The dimensions are given in the work by Macchionet al. (2005a) (Paper 6). Figure 4.14(b) is a particular case of the geometrypresented in figure 4.14(a), where the opening length a is equal to L0, whilethe opening width b is equal to l0. The different designs are characterized bythe aspect ratio
AR =√a2 + b2
L20 + l20
(4.3)
which is the ratio between the diagonal of the openings, and the diagonal ofthe chamber. When this ratio is 0, the chamber is closed, when the ratio is1.0, the openings have the same length and width than the chamber. The lastparticular case is the one presented in figure 4.14(b).
“thesisdraft” — 2005/5/9 — 8:51 — page 38 — #51ii
ii
ii
ii
38 4. SUMMARY OF RESULTS
(a) AR = 0.44, ReD = 52000 (b) AR = 0.51, ReD = 52000
(c) AR = 0.70, ReD = 52000 (d) AR = 1.0, ReD = 52000
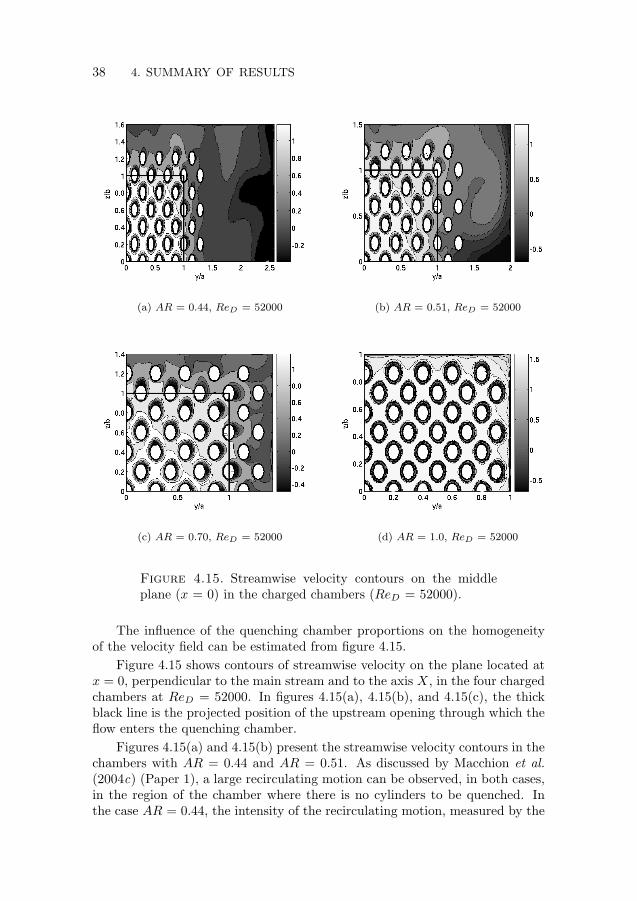
Figure 4.15. Streamwise velocity contours on the middleplane (x = 0) in the charged chambers (ReD = 52000).
The influence of the quenching chamber proportions on the homogeneityof the velocity field can be estimated from figure 4.15.
Figure 4.15 shows contours of streamwise velocity on the plane located atx = 0, perpendicular to the main stream and to the axis X, in the four chargedchambers at ReD = 52000. In figures 4.15(a), 4.15(b), and 4.15(c), the thickblack line is the projected position of the upstream opening through which theflow enters the quenching chamber.
Figures 4.15(a) and 4.15(b) present the streamwise velocity contours in thechambers with AR = 0.44 and AR = 0.51. As discussed by Macchion et al.(2004c) (Paper 1), a large recirculating motion can be observed, in both cases,in the region of the chamber where there is no cylinders to be quenched. Inthe case AR = 0.44, the intensity of the recirculating motion, measured by the

“thesisdraft” — 2005/5/9 — 8:51 — page 39 — #52ii
ii
ii
ii
4.6. FLOW UNIFORMITY AND DUCT GEOMETRY. 39
Figure 4.16. Example of the geometry of the circular-to-rectangular transition ducts that have been tested. Here AL= L/D = 1.5, AR= a/b = 2.0.
minimum velocity obtained in the dead zone, is -0.3. In the case AR = 0.44the intensity of the recirculating motion is -0.6.
Figures 4.15(c) and 4.15(d) present the streamwise velocity contours inthe chambers with AR = 0.7 and AR = 1.0. Large differences in the velocitycontours can be observed. Contrary to what is reported by Macchion et al.(2004c), no large recirculating motion is visible. On figure 4.15(c) areas ofnegative velocities, that is to say separation bubbles, are visible on the sidesof the cylinders looking away from the axis X. Such observation is not madeon figure 4.15(d). The velocity contours appear to be more uniform on figure4.15(d) than on figure 4.15(c).
4.6. Flow uniformity and duct geometry.
The computational sensitivity analysis performed in Macchion et al. (2004a)(Paper 4) aimed at investigating the influence of the design of circular-to-rectangular transition ducts, see figure 4.16, on the flow uniformity upstream ofthe charge, in furnaces of the type manufactured by Ipsen International GmbHfor research purposes, today installed in Bremen, Germany. Influence of lengthwas tested by varying the length aspect ratio AL = L/D between 0.7 and 1.5.Influence of AL was shown by computing the flow in ducts whose exit AR= a/bwas varied from 1.0 to 4.0 (square shape to rather flat rectangle). Here L is thelength of the transition duct, while D is the inlet diameter. The parametersa and b are the semi-major and semi-minor axis, respectively. Comparison offlows in an expanding-contracting duct and a constant cross-sectional area ductwas performed. Influence of pressure (1, 6, and 20 bar) and Reynolds numberin the range (1.3)105 < Re < (7.8)105 (10, 20, 30 and 60 m s−1 at the inletplane) were studied.
Flows in several transition ducts have been studied. The transition ducts’cross sectional shapes were designed by using a sequence of superelliptic cross
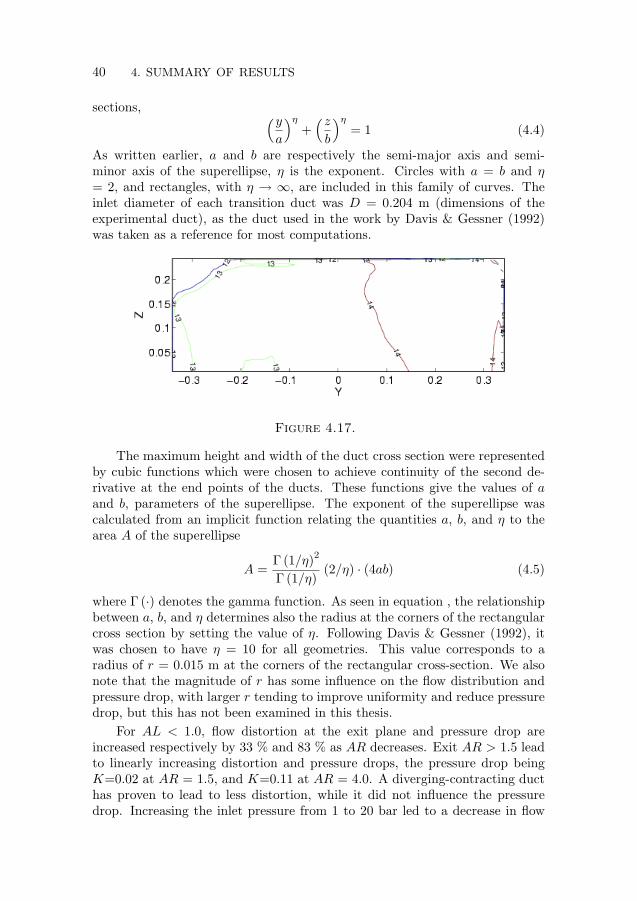
“thesisdraft” — 2005/5/9 — 8:51 — page 40 — #53ii
ii
ii
ii
40 4. SUMMARY OF RESULTS
sections, (ya
)η
+(zb
)η
= 1 (4.4)
As written earlier, a and b are respectively the semi-major axis and semi-minor axis of the superellipse, η is the exponent. Circles with a = b and η= 2, and rectangles, with η → ∞, are included in this family of curves. Theinlet diameter of each transition duct was D = 0.204 m (dimensions of theexperimental duct), as the duct used in the work by Davis & Gessner (1992)was taken as a reference for most computations.
Figure 4.17.
The maximum height and width of the duct cross section were representedby cubic functions which were chosen to achieve continuity of the second de-rivative at the end points of the ducts. These functions give the values of aand b, parameters of the superellipse. The exponent of the superellipse wascalculated from an implicit function relating the quantities a, b, and η to thearea A of the superellipse
A =Γ (1/η)2
Γ (1/η)(2/η) · (4ab) (4.5)
where Γ (·) denotes the gamma function. As seen in equation , the relationshipbetween a, b, and η determines also the radius at the corners of the rectangularcross section by setting the value of η. Following Davis & Gessner (1992), itwas chosen to have η = 10 for all geometries. This value corresponds to aradius of r = 0.015 m at the corners of the rectangular cross-section. We alsonote that the magnitude of r has some influence on the flow distribution andpressure drop, with larger r tending to improve uniformity and reduce pressuredrop, but this has not been examined in this thesis.
For AL < 1.0, flow distortion at the exit plane and pressure drop areincreased respectively by 33 % and 83 % as AR decreases. Exit AR > 1.5 leadto linearly increasing distortion and pressure drops, the pressure drop beingK=0.02 at AR = 1.5, and K=0.11 at AR = 4.0. A diverging-contracting ducthas proven to lead to less distortion, while it did not influence the pressuredrop. Increasing the inlet pressure from 1 to 20 bar led to a decrease in flow
“thesisdraft” — 2005/5/9 — 8:51 — page 41 — #54ii
ii
ii
ii
4.7. FLOW UNIFORMITY UPSTREAM OF THE CHARGE. 41
distortion by 11 % at the duct exit planes. At atmospheric pressure, increasingthe Reynolds number from (1.3)105 to (7.8)105 increased distortion by 8 %.For a detailed account of the results obtained in this study, refer to Macchionet al. (2004a) (Paper 4).
4.7. Flow uniformity upstream of the charge.
Streamwise velocity contours at the inlet of the chamber are presented forthe empty VUTK furnace in figure 4.17. As can be seen here, the flow is atacceptable levels of homogenity. The measure of uniformity presented in section2.5 reads 0.2. This value, compared with the sensitivity analysis performed byMacchion et al. (2004a) (Paper 4) and briefly presented in section 4.6, showsthat the present design of the VUTK furnace leads to flow uniformity upstreamof the charge close to the best achievable uniformity.
“thesisdraft” — 2005/5/9 — 8:51 — page 42 — #55ii
ii
ii
ii
CHAPTER 5
Concluding remarks
Numerical predictions of the flow and heat transfer over bluff bodies and withingas quenching chambers have been performed, using commercial codes. Goodagreement between experimental data and computational results has been ob-tained.
The main focus has been set on one particular type of single-chamberfurnace, the VUTK furnace, commercialized by Ipsen International GmbH,one of the industry partners of this project. It has been found that some ofthe design choices that were made during the conception of the VUTK led tonon-homogeneous flow distribution, and thus non-homogeneous heat transferwithin the load area.
These observations led to suggestions for improvements, which after dis-cussion with the industrial partners, Linde Gas and Ipsen International GmbH,have led to the following set of recommendations regarding the future designof single-chamber furnaces:
1. The upstream and downstream doors should be larger than the dimen-sions of the basket containing the metal pieces to quench.
2. The distance between the quenching chamber walls and the quenchingbasket should be kept to a minimum, determined by the constraintsplaced on the heating apparatus located in the chamber.
On the basis of these two simple recommendations, the start of a new designproject has been initiated.
Concerning the arrangement of the metal pieces within the chamber, thefollowing set of recommendations could be given:
1. The use of dummies on the first row of the quenching basket arrange-ment would seem to be beneficial, at least from the point of view of theuniformity of the mean heat transfer through the charge.
2. As demonstrated by the work performed by Macchion et al. (2005a), thearrangement of the metal pieces and the dimensions of the basket shouldbe such that the distance between objects and quenching chamber wallsbe the same.
Further studies were performed on the influence of the quenching basketholding the metal pieces to be quenched within the quenching chamber. It wasfound that the geometry of the quenching basket has a strong influence on the
42
“thesisdraft” — 2005/5/9 — 8:51 — page 43 — #56ii
ii
ii
ii
5. CONCLUDING REMARKS 43
heat transfer distribution over the metal piece to be quenched. It is suggestedthat the quenching basket may be used as an enhancement device.
This study has mainly focused on the influence of the furnace design pa-rameters on the performance of the quenching process. As discussed in chapter2, gas quenching of low-alloy steels necessitates the use of large over-pressures,typically 20 bar, which lead to the need for expensive safety equipment. Fu-ture research in this branch should focus on obtaining high cooling rates atatmospheric pressure. Examples of such methods exist for the quenching ofirons, where water sprays are used. The study by de Oliveira et al. (2002) hasshown that such method leads to controlled homogeneous quenching of piecesof complex shapes. The challenge would be to develop spray quenching usingnon-corrosive coolants for steels instead of irons.
Another avenue of research would consist in developing cooling apparatusfor continuous processes, like the weld seam of steel tubes, which necessitateshigh cooling rates over short times after annealing of the tubes. Studies byother researchers, like the work performed by Su et al. (2003), have shownthat heat transfer coefficients of the order of 850 W·m−2s−1 can be obtainedat atmospheric pressure with jets of air charged with liquid nitrogen droplets.For comparison, such high heat transfer rates can be obtained with nitrogengas at 20 bar over-pressure.

“thesisdraft” — 2005/5/9 — 8:51 — page 44 — #57ii
ii
ii
ii
44 5. CONCLUDING REMARKS
“thesisdraft” — 2005/5/9 — 8:51 — page 45 — #58ii
ii
ii
ii
Acknowledgments
This work was financed by the VINNOVA competence centre, Faxenlaboratoriet,with the two main industrial partners of this project, Ipsen International GmbH,and Linde Gas.
I would like to thank my supervisor Said Zahrai for all the valuable feed-back, help, and friendship, he has given me from the moment when he tookover the supervision of my work.
I would also like to thank Jan Bouwman at Ipsen International GmbH,today retired, but who has helped me in many ways.
Efforts of Anders Astrom, at Linde Gas, resulted in a tight collaborationbetween Faxenlaboratoriet and the industrial partners giving me a real inspri-ration for carrying out the work in this thesis. I want to thank him for thatand all discussions and help I could have during the course of my work.
I would like to address many thanks to Michael Vynnycky, for the inter-esting discussions on the value of research, the trips to the forest, and hisfriendship. I have learnt a lot from you for which I am very grateful.
I want to thank all my colleagues at the department for providing a goodworking atmosphere and interesting discussions, in particular Jordan Ko, OlaDanielsson, and Mattias Jansson. I would like to address special thanks toNiklas Mellgren, for his help and friendship during the long hours spent overweekends at the office, especially these last six months.
Professor Fritz Bark is acknowledged for his interest in my work and hisleading role within Faxenlaboratoriet. I am also grateful to Professor ArthurRizzi for his support and advice during the early stages of my doctoral studies.
I would like to address special thanks to Ingunn Wester, Viviana Wallin,and Par Ekstrand for their professional attitude and hard work at the depart-ment.
I would also like to thank my parents for their support.Last but not least. Boel, thank you for your love and your patience.
“thesisdraft” — 2005/5/9 — 8:51 — page 46 — #59ii
ii
ii
ii
Bibliography
Anon 1978a Gas turbine engine inlet flow distortion guidelines. In Society of Auto-motive Engineers, SAE ARP - 1420 .
Anon 1978b Inlet total pressure distortion considerations for gas turbine engine. InSociety of Automotive Engineers, SAE AIR - 1419 .
ANSYS 2004 ANSYS CFX Reference Manual . [email protected].
Arts, T., Lambert de Rouvroit, M. & Utherford, A. W. 1990 Aero-thermalinvestigation of a highly loaded transonic linear turbine guide vane cascade. Tech.Rep.. von Karman Institute for Fluid Dynamics, Belgium, technival Note 174.
Bardina, J. E., Huang, P. G. & Coakley, T. J. 1997 Turbulence modeling vali-dation. AIAA Paper 97-2121 28th AIAA Fluid Dynamics Conference, 4th AIAAShear Flow Control Conference.
Barth, T. & Jesperson, D. 1989 The design and application of upwind schemes onunstructured meshes. AIAA Paper 89-0366 .
Bird, R. B., Stewart, E. W. & Lightfoot, E. N. 2002 Transport phenomena.New York: Wiley & Sons.
Bless, F. & Edenhofer, B. 1997 Advances in increasing the quenching speed ofsingle-chamber vacuum furnaces with high-pressure gas-quench systems. HeatTreatment of Metals 1997.4, 89–91.
Butler, R. J., Byerley, A. R., VanTreuren, K. & Baughn, J. W. 2001 Theeffect of turbulence intensity and length scale on low-pressure turbine bladeaerodynamics. International Journal of Heat and Fluid Flow 22, 123–133.
Copeland, D. A. 2003 New approximate formulas for viscosity and thermal conduc-tivity of dilute gas mixtures. AIAA Journal 41 (3), 525–537.
Davis, D. O. & Gessner, F. B. 1992 Experimental investigation of turbulent flowthrough a circular-to-rectangular transition duct. AIAA Journal 30, 367–375.
Faura, F., Campo, A. & Zamora, B. 1998 A mixture of pure gases that pro-duce maximum heat transfer characteristics for quenching. Journal of MaterailsEngineering and Performance 7 (3), 420–424.
Hancock, P. E. & Bradshaw, P. 1983 The effect of free-stream turbulence onturbulent boundary layer flow and heat transfer. Journal of Fluids Engineering105, 284.
Hunt, J. C. R. 1973 A theory of turbulent flow round two-dimensional bluff bodies.Journal of Fluid Mechanics 61, 625, part 4.
46
“thesisdraft” — 2005/5/9 — 8:51 — page 47 — #60ii
ii
ii
ii
BIBLIOGRAPHY 47
Igarashi, T. 1981 Characteristics of the flow around two circular cylinders arrangedin tandem (1st report). Bulletin of JSME 24 (188), 1858–1865.
Koenig, K. & Roshko, A. 1985 An experimental study of geometrical effects onthe drag and flow field of two bluff bodies separated by a gap. Journal of FluidMechanics 156, 167–204.
Laumen, C., Midea, S. J., Lubben, T., Hoffmann, F. & Mayr, P. 1997 Measuredheat transfer coefficients by using hydrogen as quenchant in comparison withhelium and nitrogen. In ASM Heat Treatment Conference. Indianapolis.
Launder, B.E. Reece, G. & Rodi, W. 1975 Progress in the development of areynolds-stress turbulence closure. Journal of Fluid Mechanics 68 (3), 537 –566.
Lefantzi, S. & Knight, D. D. 2002 Austomated design optimization of a three-dimensional s-shaped subsonic diffuser. Journal of Propulsion and Power 18 (4).
Macchion, O. 2005 Large eddy simulation of flow and heat transfer over a cylinderin axial flow. to be submitted .
Macchion, O., Lior, N. & Rizzi, A. 2004a Computational study of velocity dis-tribution and pressure drop for designing some gas quench chamber and furnaceducts. Journal of Materials Processing Technology In Press.
Macchion, O. & Zahrai, S. 2004 Cfd for the design of gas quenching furnaces. 17thNordic Seminar on Computational Mechanics .
Macchion, O., Zahrai, S. & Astrom, A. 2004b On the influence of gas mixturecomposition on gas quenching uniformity and mean. To be published.
Macchion, O., Zahrai, S., Astrom, A. & Rink, M. 2005a Heat transfer correla-tion in gas quenching chamber. to be submitted .
Macchion, O., Zahrai, S. & Bouwman, J. 2004c On hydrodynamics within gasquenching furnace. Submitted to the Journal of Materials Processing Technology.
Macchion, O., Zahrai, S. & Bouwman, J. 2005b Thermal effects within gasquenching furnace. Submitted to the Journal of Materials Processing Technol-ogy , short version published in IASME Transactions 1(2), January 2005, p.137-142.
Mason, E. A. & Saxena, S. C. 1958 Thermal conductivity of mixtures. Physics ofFluids 1, 361–369.
Menter, F. 1993 Zonal two equation k-ω turbulence models for aerodynamic flows.AIAA Paper 93-2906 24th Fluid Dynamics Conference (Orlando).
Menter, F. R. 1994 Two-equation eddy-viscosity turbulence models for engineeringapplications. AIAA Journal 32 (8), 1598–1605.
Monnery, W. D., Svrcek, W. Y. & Mehrotra, A. K. 1995 Viscosity: a criticalreview of practical predictive and correlative methods. The Canadian Journal ofChemical Engineering 73, 3–40.
de Oliveira, M., Ward, J., Garwood, D. R. & Wallis, R. A. 2002 Quenchingof aerospace forgings from high temperatures using air-assisted, atomized watersprays. Journal of Materials Engineering and Performance 11 (1), 80–85.
Reid, R. C., Prausnitz, J. M. & Poling, B. E. 1987 The properties of gases andliquids, 4th edn. New-York: McGraw-Hill.
Roshko, A. 1955 On the wake and drag of bluff bodies. Journal of the aeronauticalsciences (2), 124–132.
“thesisdraft” — 2005/5/9 — 8:51 — page 48 — #61ii
ii
ii
ii
Roshko, A. 1993 Perspectives on bluff body aerodynamics. Journal of Wind Engi-neering and Industrial Aerodynamics 49, 79–100.
Su, L., Chang, S., Yeh, C. & Hsu, Y. 2003 Heat transfer of impinging air andliquid nitrogen mist jet onto superheated flat surface. International Journal ofHeat and Mass Transfer 46, 4845–4862.
Tennekes, H. & Lumley, J. L. 1972 A first course in turbulence. Cambridge: MITPress, iSBN 0262200198.
Thuvander, A., Melander, A., Lind, M., Lior, N. & Bark, F. 1998 Prediction ofconvective heat transfer coefficients and examination of their effects on distortionof tubes quenched by gas cooling. In 4th ASM Heat Treatment and Surface Eng.Conf. in Europe. Florence, Italy.
Totten, G. E., Bates, C. E. & Clinton, N. A. 1993 Quenchants and QuenchingTechnology . ASM International, iSBN 0-87170-448-X.
Troell, E. & Segerberg, S. 1995 Cooling in nitrogen and helium under highpressure. Tech. Rep. IVF-Skrift 95845. The Swedish Institute of Production En-gineering Research (IVF), Gothenburg.
Van Fossen, G. J. & Ching, C. Y. 1994 Measurements of the influence of integrallength scale on stagnation region heat transfer. Fifth Int. Sym. on TransportPhenomena and Dynamics of Rotating Machinery (ISROMAC-5) Paper No. TP-16.
Van Fossen, G. J. & Simoneau, R. J. 1994 Stagnation region heat transfer:The influence of turbulence parameters, reynolds number, and body shape.AIAA/ASME Thermophysics and Heat Transfer Conference Colorado Springs,Colorado.
Van Fossen, G. J., Simoneau, R. J. & Ching, C. Y. 1995 Influence of turbu-lence parameters, reynolds number, and body shape on stagnation-region heattransfer. ASME J. Heat TRansfer 117, 597–603.
Vieser, W., Esch, T. & Menter, F. 2001 Heat transfer predictions using advancedtwo-equation turbulence models. Tech. Rep. CFX-VAL10/0602. CFX.
Wiberg, R. & Lior, N. 2003 Convection heat transfer coefficients for axial flow gasquenching of a cylinder. In Proceedings of the Fourth International Conferenceon Quenching and the Control of Distortion.
Wilcox, D. C. 1988 Reassessment of the scale-determining equation for advancedturbulence models. AIAA Journal 26 (11), 1299–1310.
Wilke, C. R. 1950 A viscosity equation for gas mixtures. Journal of Chemical Physics18, 517–519.
Zukauskas, A. A. 1987 Convective heat transfer in cross flow. In Handbook of Single-Phase Convective Heat Transfer (ed. S. Kakac, R. K. Shah & W. Aung), chap. 6.New York: Wiley.