Embed Size (px)
Citation preview

Eleventh International Conference on CFD in the Minerals and Process Industries
CSIRO, Melbourne, Australia
7-9 December 2015
Copyright © 2015 CSIRO Australia 1
CFD BASED FIRE CONSEQUENCE ASSESSMENT
Piotr TKACZYK1* and Craig PREGNALATO 1
1 MMI ENGINEERING, Melbourne, Victoria 3000, AUSTRALIA
*Corresponding author, E-mail address: [email protected]
ABSTRACT
The fire exposure of pressurised vessels used in offshore
oil and gas production structures can lead to personnel
life/safety incidents, environmental release, and facility
damage. This paper discusses a Computational Fluid
Dynamics (CFD) based consequence assessment of the
time to failure for flare knock out drums under pool and
jet fire impingement. The ANSYS FLUENT software was
used to solve conjugate heat transfer problems such as
those posed by fire impingement on flare knock out drums
during emergency depressurisation. This allows a
determination of whether the vessels can survive the
design accident heat load from pool or jet fire and assists
in designing fire protection systems.
NOMENCLATURE
MLG mass transfer from liquid to gas
T temperature
TG gas temperature
TL liquid temperature
Q heat flux
QIL heat flux from wall to the gas phase
QG heat flux from wall to the liquid phase
QO heat load from fire
VL the volume of liquid
VG the volume of gas
u velocity
v gas inlet velocity
p pressure
density
dynamic viscosity
qLoc local heat load applied to the KO drum
qGlob global heat load applied to the KO drum
ATS Allowable Tensile Strength
BLEVE Boiling Liquid Expanding Vapour Explosion
KO Knock Out drum
UTS Ultimate Tensile Strength
Subscripts
G gas phase
L liquid phase
INTRODUCTION
The process areas of offshore oil and gas platforms are
characterised by complex geometry, highly congested
areas and difficult escape routes. Although there are safety
systems installed on the platforms, the process area is
never completely safe (Pula et al., 2006). Among the loss
producing events, fire is one of the most frequent reported
(Pula et al., 2005). A relatively small fire can escalate to
larger and uncontrollable fire that can cause serious injury
to personnel, major damage to equipment and can
endanger the whole platform. The main objective in this
context is to prevent escalation to nearby process
equipment resulting in loss of containment and release of
significant quantities of combustibles.
The fire begins with the release of liquid or gaseous
hydrocarbons into the environment following by an
ignition. Two types fire are usually considered for
offshore platforms, namely a jet fire and a pool fire
(Health and Safety Executive, 2007). The jet fire typically
results from the combustion of a material (gas or liquid
hydrocarbons) as it is being released from a pressurised
process unit and formed jet that is subsequently ignited.
The pool fire develops when liquid flammable inventory
released on deck forms a pool. The pool fire is continuous
following ignition until either all the hydrocarbons are
consumed or the ventilation conditions cause the fire to be
extinguished (American Bureau of Shipment, 2013). The
jet and pool fires represent a significant element of the risk
associated with major accidents on offshore installations.
The high heat fluxes from either the jet fire or the pool fire
to engulfed as well as non-engulfed objects can lead to
vessels and pipework failure. Figure 1 shows a schematic
representation of pressurised vessel exposed to external
fires.
Convection
+
Radiation
Q0
MLG
QIG
QIL
TG VG
TL VL
Figure 1: Schematic illustration of fire heat-up of a
pressurised gas vessel.
As shown in the figure above, the vessel is heated by
radiation and convection received from fire, 𝑄0. Heat
conducted through the vessel wall is transferred to the gas
and liquid zone and results in liquid evaporation and
causes vapour temperature and pressure increase. The
convective heat transfer coefficient between vapour and
wall is low, so the vessel wall temperature rises, lowering
the amount of stress the wall material is able to maintain at
elevated temperature. On the same time, the pressure
growth is increasing the stress intensity on the vessel. In
case of severe vessel heat up a boiling liquid expanding
vapour explosions (BLEVEs) may occur resulting in the
loss of containment (Landucci et al., 2009).

Copyright © 2015 CSIRO Australia 2
The methodology presented in this paper, seek to quantify
the time to failure of the vapour-liquid separator (KO
drum) when exposed to the fire loads.
MODEL DESCRIPTION
Set up of CFD simulations
During emergency shutdown of the offshore platform the
hydrocarbons inventory is diverted to the knock out drum
where after separation the gas phase is sent to the flare and
liquid is directed to the storage tanks.
In the present study, cylindrical vessels containing only a
gas phase are considered. The gas enters the KO drum
through inlet pipe and it is removed from the tank by
outlet pipe, as seen in Figure 2.
INLET
OUTLET
CLOSED
PIPES CLOSED
PIPE
Figure 2: Knock-out drum geometry.
Pressure boundary condition is used for the outlet and
velocity inlet boundary for the inlet. As it was mentioned
before, during the emergency shutdown, the inventory
send to the KO drum is decreasing with time, therefore, a
time varying inlet velocity was used at the inlet, see Figure
5.
The external flow (flame and combustion) which applies
the heat to the KO drum surface is not modelled directly.
Instead, the heat load is applied as boundary conditions for
KO drum walls. The specified heat loads aligned with the
design accidental load specification document. Case 1 was
defined as a jet fire and Case 2 defined as a pool fire. The
heat fluxes applied to the inventory were:
Local peak heat load = 350kW/m2
Global average heat load = 100 kW/m2
for a jet fire case, and
Local peak heat load = 150 kW/m2
Global average heat load = 100 kW/m2
for a pool fire case.
The location of the local heat load was chosen from the
characteristic of the pool and jet fires. The pool fire
develops when liquid inventory released on deck forms a
pool. Therefore the local heat load is applied to the bottom
of the drum in the case of pool fire, while the local heat
load from the jet fire is applied to the side of the drum.
A commercial CFD tool, ANSYS FLUENT (ANSYS,
2014), is used to set up the fluid dynamics model. The
main equations considered here are: continuity equation,
energy equation, momentum equation. The gas phase
participation to the radiative heat transfer is not
considered. A realizable k-ε model with standard wall
functions is used to account for the turbulence.
Table 1 summarizes the features of the CFD model and the
geometry of the KO drum. Figure 3 and Figure 4 show the
computational grid used for the calculations. Each
simulation is run for 60 minutes.
Item Description or selected value
Vessel geometry Cylindrical vessel
KO Drum No. 1 External diameter = 1.412 m
Wall thickness = 1.4 m
KO Drum No. 2 External diameter = 2.826 m
Wall thickness = 2.8 m
Material properties - Mixture of hydrocarbons
Molecular weight 21.17 kg/kmol
Viscosity 1.08e-5 kg/(ms)
Density Ideal gas density
Boundary conditions
Walls Heat flux
Inlet Velocity inlet
v = 28.68m/s for time < 15s
and
v = 28.68*exp(-0.0231*(t-15.0)
for time > 15s
Inlet temperature = 294K
Outlet Pressure outlet = atmospheric
pressure
Convergence
criteria
10-6 for all equations
Number of elements 463,351
Table 1: Summary of the features of the CFD model
Figure 3: Mesh adopted in the present study.
Copyright © 2015 CSIRO Australia 3
Figure 4: Mesh adopted in the present study.
0
5
10
15
20
25
30
35
0 10 20 30 40 50 60
Inle
t V
elo
cit
y (
m/s
)
Time (minutes)
Figure 5: Time varying inlet velocity.
RESULTS
The present section discusses the CFD results obtained for
pressurised knock-out drum under heat load from fires.
Figure 6 reports the maximum wall temperature of the
vessel for all cases as a function of time. The figure shows
the increase in wall temperature is more severe for jet
fires. In fact, the highest wall temperature is predicted for
LP drum under the jet fire impingement.
The advantage of CFD modelling of KO drums engulfed
by fires is related to the possibility of obtaining local
predictions of temperature and relatively easy
identification of critical areas of the vessel that might
require passive fire protection. An example of calculated
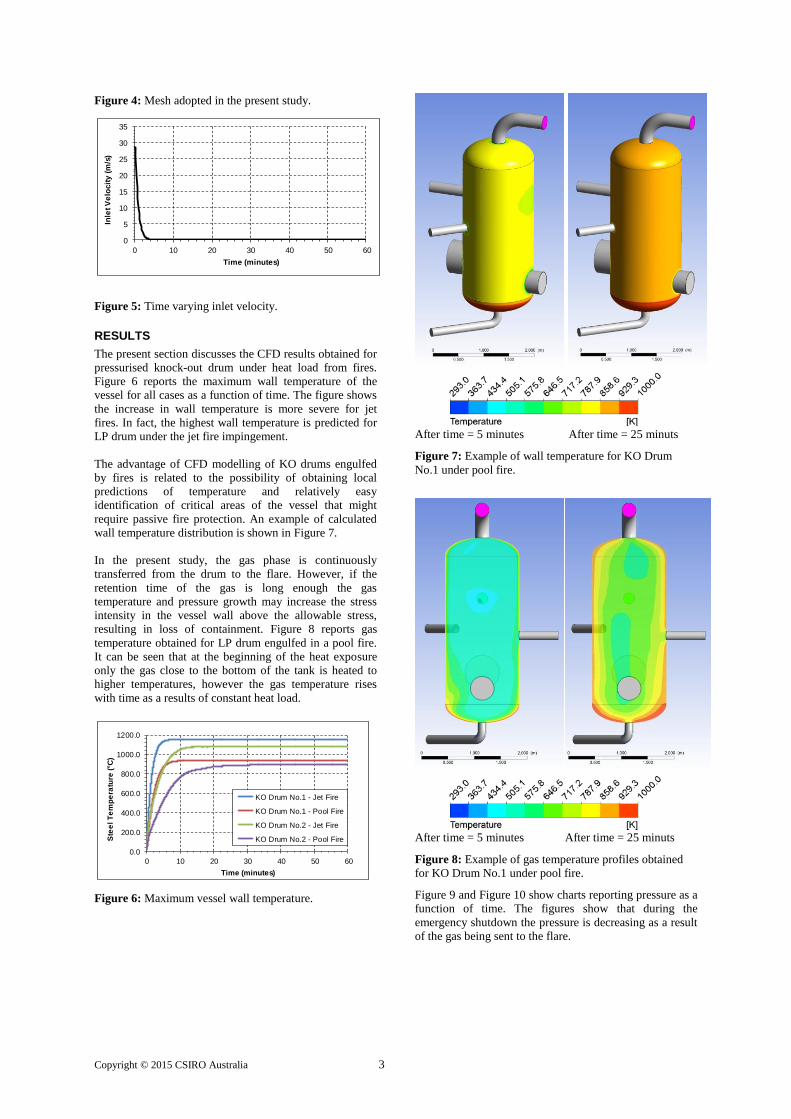
wall temperature distribution is shown in Figure 7.
In the present study, the gas phase is continuously
transferred from the drum to the flare. However, if the
retention time of the gas is long enough the gas
temperature and pressure growth may increase the stress
intensity in the vessel wall above the allowable stress,
resulting in loss of containment. Figure 8 reports gas
temperature obtained for LP drum engulfed in a pool fire.
It can be seen that at the beginning of the heat exposure
only the gas close to the bottom of the tank is heated to
higher temperatures, however the gas temperature rises
with time as a results of constant heat load.
0.0
200.0
400.0
600.0
800.0
1000.0
1200.0
0 10 20 30 40 50 60
Ste
el T
em
pe
ratu
re ( C
)
Time (minutes)
KO Drum No.1 - Jet Fire
KO Drum No.1 - Pool Fire
KO Drum No.2 - Jet Fire
KO Drum No.2 - Pool Fire
Figure 6: Maximum vessel wall temperature.
After time = 5 minutes After time = 25 minuts
Figure 7: Example of wall temperature for KO Drum
No.1 under pool fire.
After time = 5 minutes After time = 25 minuts
Figure 8: Example of gas temperature profiles obtained
for KO Drum No.1 under pool fire.
Figure 9 and Figure 10 show charts reporting pressure as a
function of time. The figures show that during the
emergency shutdown the pressure is decreasing as a result
of the gas being sent to the flare.

Copyright © 2015 CSIRO Australia 4
0.0E+00
5.0E+05
1.0E+06
1.5E+06
2.0E+06
2.5E+06
3.0E+06
0 10 20 30 40 50 60
Pre
ssu
re (
Pa
)
Time (minutes)
KO Drum No.1 - Pool Fire
KO Drum No.2 - Pool Fire
Figure 9: Pressure variation with time for KO drum under
pool fire.
0.0E+00
2.0E+05
4.0E+05
6.0E+05
8.0E+05
1.0E+06
1.2E+06
1.4E+06
1.6E+06
0 10 20 30 40 50 60
Pre
ssu
re (
Pa
)
Time (minutes)
KO Drum No.1 - Jet fire
KO Drum No.2 - Jet Fire
Figure 10: Pressure variation with time for KO drum
under jet fire.
To complement the analysis of the KO drum behaviour
during the fire exposure, the operating stress and
allowable stress have been calculated and shown in Figure
11 and Figure 12 for KO Drum No.1 and Figure 13 and
Figure 14 for KO Drum No. 2. To account for the
uncertainties in the Ultimate Tensile Strength (UTS) of the
material, it is recommended in the industry guidelines
(Hekkelstrand and Skulstad, 2004) that it is reduced by a
safety factor, ks equal to 0.85. It can be seen that the
allowable stress limit is dropping very fast during the
vessel heat up, approaching the vessel operation stress
levels. The calculated operating wall stress does not
exceed the allowable stress limit during the simulation
time for any of the analysed cases, indicating correct
operation of the emergency shutdown system.
0.0
100.0
200.0
300.0
400.0
500.0
600.0
700.0
0 10 20 30 40 50 60
Str
ess
(M
Pa
)
Time (minutes)
Pool Fire ATS
Pool Fire Operating Stress
Figure 11: Wall stress variation with time for KO Drum
No. 1 under pool fire.
0.00
100.00
200.00
300.00
400.00
500.00
600.00
700.00
0 10 20 30 40 50 60
Str
ess
(M
Pa
)
Time (minutes)
Jet Fire ATS
Jet Fire Operating Stress
Figure 12: Wall stress variation with time for KO Drum
No. 1 under jet fire.
0.00
100.00
200.00
300.00
400.00
500.00
600.00
700.00
0 10 20 30 40 50 60
Str
ess
(M
Pa
)
Time (minutes)
Pool Fire ATS
Pool Fire Operating Stress
Figure 13: Wall stress variation with time for KO Drum
No. 2 under pool fire.
0
100
200
300
400
500
600
700
0 10 20 30 40 50 60
Str
ess
(M
Pa
)
Time (minutes)
Jet Fire ATS
Jet Fire Operating Stress
Figure 14: Wall stress variation with time for KO Drum
No. 2 under jet fire.
CONCLUSION
In the present study the CFD modelling of pressurised
vessel engulfed by fires is presented. The model was
developed for pressurised gas, therefore considering only
one phase in the domain. The case studies analysed
demonstrate the possibilities of the modelling tool in
providing detailed information about the behaviour of the
KO drum during the fire exposure. A future development
will be modelling of the vessel containing gas and liquid
phase and take into account evaporation of the liquid
phase.
REFERENCES
AMERICAN BUREAU OF SHIPMENT (2013),
“Guidelines notes on accidental load analysis and design
for offshore structures” .
ANSYS Inc. (2014), “ANSYS FLUENT User’s
guide”.

Copyright © 2015 CSIRO Australia 5
HEALTH & SAFETY EXECUTIVE (2007),
“Hazardous installations directorate – Fire and explosion
strategy” .
HEKKELSTRAND, B. and SKULSTAD, P. (2004),
“Guidelines for the Protection of Pressurised Systems
Exposed to Fire”, Scandpower report No. 27.207.291/R1.
LANDUCCI, G., GUBINELLI, G., ANTONIONI,
G., COZZANI, V., (2009), “The assessment of damage
probability of storage tanks in domino events triggered by
fire”, Acc. Anal. Prev., 41, 1206-1215.
PULA, R., KHAN, F.I., VEITCH, B. AMYOTTE,
P.R. (2005), “Revised fire consequence models for
offshore quantitative risk assessment” Journal of Loss
Prevention in the Process Industries, 18, 443-454.
PULA R., KHAN F.I., VEITCH, B. AMYOTTE P.R.
(2006), “A grid based approach for fire and explosion
consequence analysis”, Journal of Process Safety and
Environmental Protection, 84, 79-91.