Embed Size (px)
Citation preview

CFD analysis on a direct spring-loaded safetyvalve to determine flow forces
Tamas Pusztaip and Zoltan Simenfalvi
Department of Chemical Machinery, Faculty of Mechanical Engineering and Informatics, Universityof Miskolc, H-3515, Miskolc-Egyetemv�aros, Hungary
Received: December 19, 2019 • Revised manuscript received: April 17, 2020 • Accepted: April 17, 2020Published online: February 24, 2021
ABSTRACT
Safety valves are the most important safety devices of the pressure system. For safety valves in the vastmajority of cases in industrial environment, direct spring-loaded safety valves are used. The mostimportant parameter of the equation of motion is the flow force. The main goal of the analysis was tocompare the simulated flow forces with the measured results and validating the computational fluiddynamics model. Simulations were made in ANSYS 2019 R1 code for numerous fixed valve diskpositions on different pressures. Results are in good agreement with the measured data.
KEYWORDS
safety valve, flow force, computational fluid dynamics simulation, flow force simulation, computational fluiddynamics analysis
1. INTRODUCTION
Safety valves are the most important safety devices of pressure systems against critical over-pressure. These overpressure protection devices can save pressure equipment and/or pressuresystem from the final damage. Safety valves are opening when the pressure in the protectedequipment has reached set pressure of the safety valve. Safety valves have to blow down unnec-essary mass flow from the protected equipment in the atmosphere or in a blowdown-pipe system.
Safety valves can be classified in several ways; the most common way is from the actingload on the valve disc as:
� direct spring-loaded safety valve;� weight loaded safety valve;� pilot operated safety valve [1].
For safety valves in the vast majority of cases in the industrial environment, direct spring-loaded safety valves are used [2].
Knowing the dynamical behavior of these safety valves is very important. This dynamicbehavior can be described with the equation of motion of the valve. This equation containsmany parameters, including the flow force, which is acting on the disc. The aim of the studyis to determine this flow force using Computational Fluid Dynamics (CFD) simulation byANSYS 2019 R1 Fluent code, compare the simulated results with measured data and vali-dating the simulation model for further investigations.
In this paper a direct spring-loaded safety valve was investigated by CFD simulation.
2. MECHANICAL MODEL
Direct spring-loaded safety valve can be modeled by a one-degree of freedom mechanicaloscillating system. Figure 1 shows a schematic view of the mechanical model of the analyzedsafety valve.
Pollack Periodica •
An International Journalfor Engineering andInformation Sciences
16 (2021) 1, 109–113
DOI:10.1556/606.2020.00122© 2020 The Author(s)
ORIGINAL RESEARCHPAPER
pCorresponding author.E-mail: [email protected]
Unauthenticated | Downloaded 01/08/22 04:22 PM UTC

Equation of motion of the valve can be written by Eq. (1),where m is the total mass of the moving parts; €y is theacceleration (second derivative of the y-direction displace-ment); Fs is the spring force; Fd is the damping force; Ff is theflow force; FG is the gravity force; Ffr is the friction forcebetween mechanical parts; Fv is the viscous force, which isacting on the surface of the spindle as a result of themovement of fluid and Fb is the back pressure which isacting on the top of the disk and the top of the spindle [3, 4],
m$€y ¼ FS þ Fd þ Ff þ FG: (1)
In this study, the flow force was determined by CFDanalysis. Knowing this flow force will be important infurther research work when the dynamic behavior of thesafety valve will be investigated. The flow force is the onlycomponent in the equation of motion, which is acting in theopening direction. In further investigations, this equation ofthe motion will be solved.
3. CFD SIMULATION ON THE SAFETY VALVE
CFD simulations were made in ANSYS 2019 R1 Fluent code.The type of the analyzed safety valve is full lifted and directspring-loaded. The size of the safety valve is DN50/DN80,which means that the size of the inlet nozzle is DN50 andthe size of the outlet nozzle is DN80. This safety valve wasdesigned based on EN-ISO-4126 standard [5]. In Fig. 2 the3D model of the solid part of the safety valve can be seen andin Fig. 2 the 3D model of the fluid part of the safety valve canbe seen. Figure 3 is shown where the fluid is flowing throughin the valve. The safety valve is symmetric for the x-y plane,
therefore only half of the valve was simulated. With thissimplification, the number of elements, nodes and the sim-ulations running time were significantly reduced [6].
Simulations were made at 5 different fixed disc positions(1, 2, 5, 8, and 11.2 mm) and in every fixed disc positionwith 9 different inlet pressure values (1.5, 2, 2.5, 3, 3.5, 4, 4.5,5, and 5.5 barg). It means all 45 simulations. At 11.2 mmfixed disc position the safety valve is totally opened.
3.1. Mesh of the model
Because of the 5 different disc positions, 5 meshes had to becreated. The method of meshing in every model was the same.
The first step was a body sizing in the whole domainwhere the size of one element was set to 2 mm. The second
Fig. 1. Mechanical model of the analyzed safety valve
Fig. 2. 3D model of the safety valve's solid part
Fig. 3. 3D model of the safety valve's fluid part
110 Pollack Periodica 16 (2021) 1, 109–113
Unauthenticated | Downloaded 01/08/22 04:22 PM UTC

step was another body sizing but only in the middle regionof the valve. For that sphere of influence definition type wasused where the origin of the sphere was the middle of thedisc, the radius of the sphere was 50 mm. In each case, theelement size in the sphere was set to 0.4 mm. The third stepwas the inflation setting near the walls where the maximumthickness and the number of the layers were defined. Theinflation was different on every fixed disc position. Forsmaller fixed disc positions smaller maximum thickness andfewer layers were used comparing to higher fixed disc po-sitions. Due to these different inflation settings, the numberof the elements and the nodes were different in every model.
The values of the maximum thickness of inflation, numberof layers, number of elements and number of nodes can be seenin Table 1. The meshed model of the 2 mm disc displacementcan be seen in Fig. 4 and the meshed gap between the seat andthe disc in Fig. 5 can be seen from closer. In Figs 2 and 5 thedisc is fixed at 2 mm displacement from the seat can be seen.
3.2. Fluent set ups
For the CFD simulations, realizable k–« turbulence model wasused because this turbulence model is more stable in higher
Reylnods-number zones as other turbulence models. Pressurebased solver type was set [7]. The simulated medium was airand for the density value ideal gas model was used.
Inlet and outlet pressures were set up for boundary con-ditions. On the x–y plane symmetry boundary condition andon the other faces wall boundary conditions were set. Thepressure inlet values were set as it was mentioned in paragraph3, and pressure outlet value in every simulation was set for0 barg. The temperature value was set to 293 K in every case.
Absolute convergence criteria were set and the conver-gence tolerance was set to 105. Typical CPU time was 6.813 s.
4. RESULTS OF THE CFD SIMULATION ANDCOMPARISON WITH MEASURED DATA
In Fig. 6 the results of the simulated flow forces are shown.From Fig. 6 it can be seen that characteristics of e flow forcesare almost linearly increasing in every fixed disc position. InFigs 7–11 the solid line means the simulated flow force andthe dashed line means the measured flow force.
In Figs 7–11 the compared results of the simulated andmeasured flow forces are shown. In these figures, it is visiblethat the simulated flow forces are converging very well to themeasured flow forces. In these figures, a 5% tolerance rateswere added in the investigated points to show the differencebetween simulated and measured flow forces. The measuredforces are the total sum of acting forces.
Table 1. Data for inflation, elements and nodes
Displacement[mm]
Maximumthickness ofinflation[mm]
Numberof layers
Elements[million]
Nodes[million]
1 1 15 5.14 8.562 1.5 15 6.34 11.575 2 30 5.76 10.758 2.5 30 6.14 11.3911.2 4 30 10.63 19.05
Fig. 4. The meshed model
Fig. 5. The center region of the meshed model
200
400
600
800
1000
1200
1400
1600
1800
2000
1 2 3 4 5 6
]N[ ecroF
Pressure [barg]1 mm 2 mm 5 mm 8 mm 11.2 mm
Fig. 6. Simulated flow forces at investigated fixed disc displacements
Pollack Periodica 16 (2021) 1, 109–113 111
Unauthenticated | Downloaded 01/08/22 04:22 PM UTC
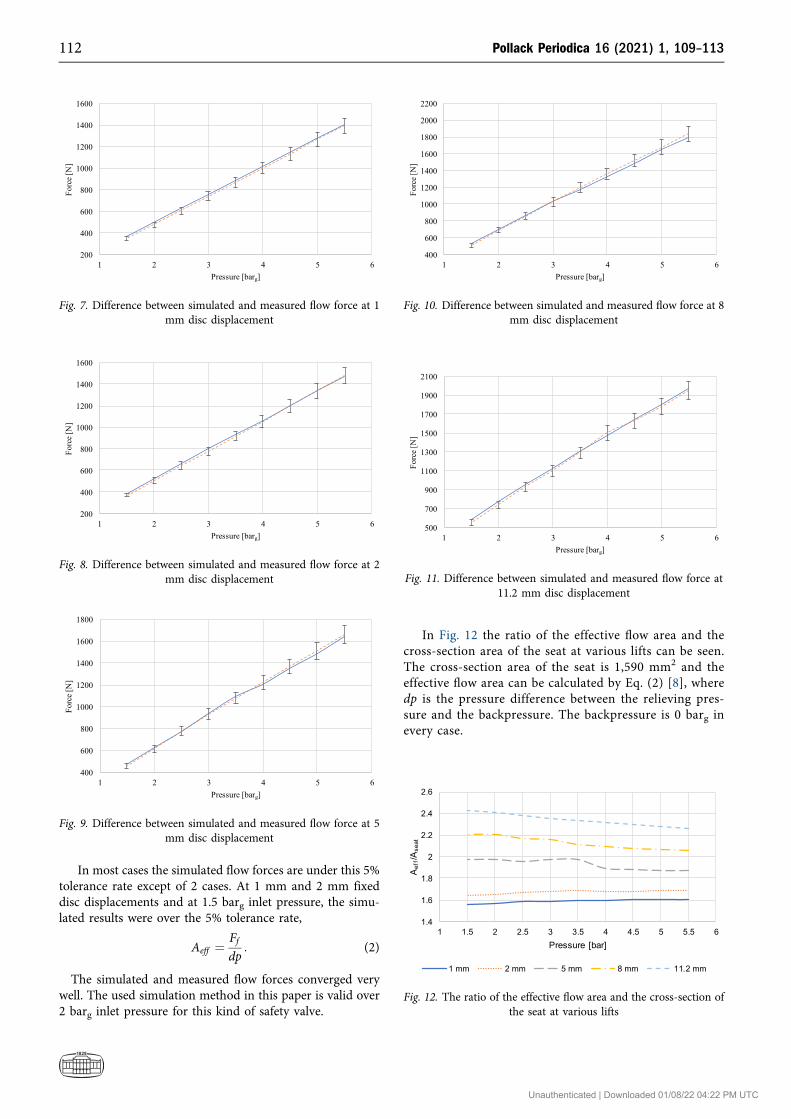
In most cases the simulated flow forces are under this 5%tolerance rate except of 2 cases. At 1 mm and 2 mm fixeddisc displacements and at 1.5 barg inlet pressure, the simu-lated results were over the 5% tolerance rate,
Aeff ¼Ffdp
: (2)
The simulated and measured flow forces converged verywell. The used simulation method in this paper is valid over2 barg inlet pressure for this kind of safety valve.
In Fig. 12 the ratio of the effective flow area and thecross-section area of the seat at various lifts can be seen.The cross-section area of the seat is 1,590 mm2 and theeffective flow area can be calculated by Eq. (2) [8], wheredp is the pressure difference between the relieving pres-sure and the backpressure. The backpressure is 0 barg inevery case.
200
400
600
800
1000
1200
1400
1600
1 2 3 4 5 6
]N[ ecroF
Pressure [barg]
Fig. 7. Difference between simulated and measured flow force at 1mm disc displacement
200
400
600
800
1000
1200
1400
1600
1 2 3 4 5 6
]N[ ecroF
Pressure [barg]
Fig. 8. Difference between simulated and measured flow force at 2mm disc displacement
400
600
800
1000
1200
1400
1600
1800
1 2 3 4 5 6
]N[ ecroF
Pressure [barg]
Fig. 9. Difference between simulated and measured flow force at 5mm disc displacement
400
600
800
1000
1200
1400
1600
1800
2000
2200
1 2 3 4 5 6
]N[ ecroF
Pressure [barg]
Fig. 10. Difference between simulated and measured flow force at 8mm disc displacement
500
700
900
1100
1300
1500
1700
1900
2100
1 2 3 4 5 6
]N[ ecroF
Pressure [barg]
Fig. 11. Difference between simulated and measured flow force at11.2 mm disc displacement
1.4
1.6
1.8
2
2.2
2.4
2.6
1 1.5 2 2.5 3 3.5 4 4.5 5 5.5 6
Aef
f/Ase
at
Pressure [bar]
1 mm 2 mm 5 mm 8 mm 11.2 mm
Fig. 12. The ratio of the effective flow area and the cross-section ofthe seat at various lifts
112 Pollack Periodica 16 (2021) 1, 109–113
Unauthenticated | Downloaded 01/08/22 04:22 PM UTC
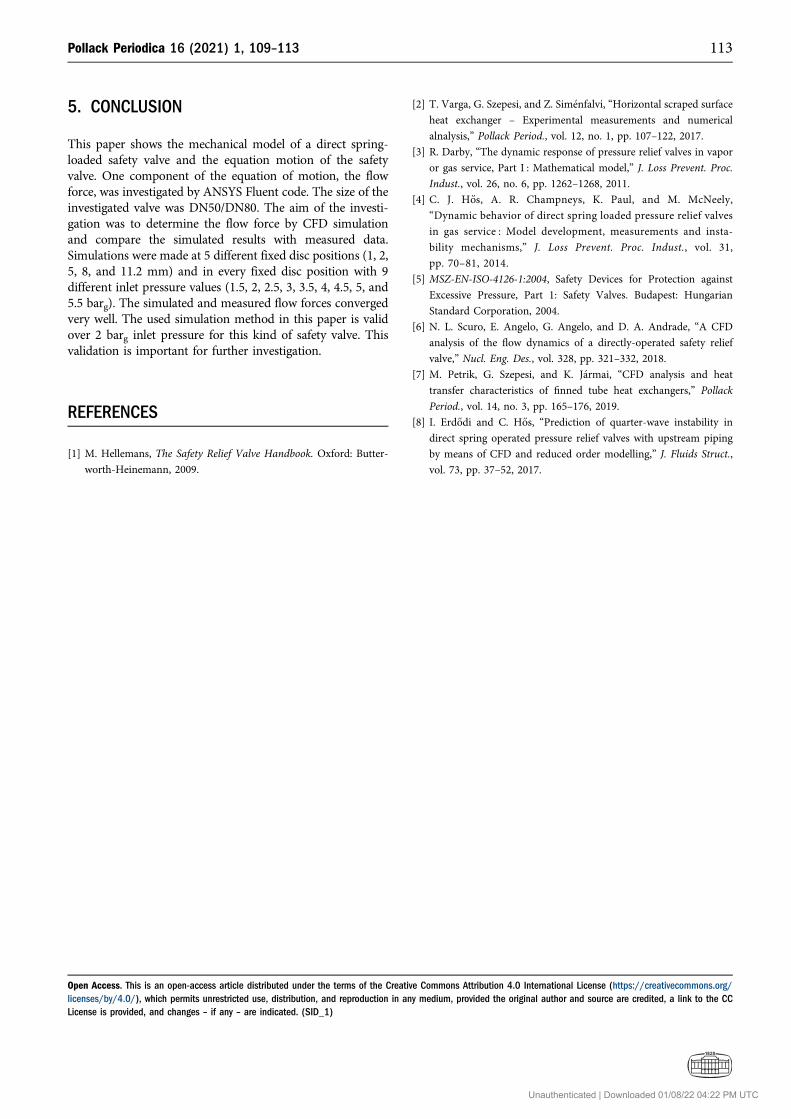
5. CONCLUSION
This paper shows the mechanical model of a direct spring-loaded safety valve and the equation motion of the safetyvalve. One component of the equation of motion, the flowforce, was investigated by ANSYS Fluent code. The size of theinvestigated valve was DN50/DN80. The aim of the investi-gation was to determine the flow force by CFD simulationand compare the simulated results with measured data.Simulations were made at 5 different fixed disc positions (1, 2,5, 8, and 11.2 mm) and in every fixed disc position with 9different inlet pressure values (1.5, 2, 2.5, 3, 3.5, 4, 4.5, 5, and5.5 barg). The simulated and measured flow forces convergedvery well. The used simulation method in this paper is validover 2 barg inlet pressure for this kind of safety valve. Thisvalidation is important for further investigation.
REFERENCES
[1] M. Hellemans, The Safety Relief Valve Handbook. Oxford: Butter-
worth-Heinemann, 2009.
[2] T. Varga, G. Szepesi, and Z. Sim�enfalvi, “Horizontal scraped surface
heat exchanger – Experimental measurements and numerical
alnalysis,” Pollack Period., vol. 12, no. 1, pp. 107–122, 2017.
[3] R. Darby, “The dynamic response of pressure relief valves in vapor
or gas service, Part I : Mathematical model,” J. Loss Prevent. Proc.
Indust., vol. 26, no. 6, pp. 1262–1268, 2011.
[4] C. J. H}os, A. R. Champneys, K. Paul, and M. McNeely,
“Dynamic behavior of direct spring loaded pressure relief valves
in gas service : Model development, measurements and insta-
bility mechanisms,” J. Loss Prevent. Proc. Indust., vol. 31,
pp. 70–81, 2014.
[5] MSZ-EN-ISO-4126-1:2004, Safety Devices for Protection against
Excessive Pressure, Part 1: Safety Valves. Budapest: Hungarian
Standard Corporation, 2004.
[6] N. L. Scuro, E. Angelo, G. Angelo, and D. A. Andrade, “A CFD
analysis of the flow dynamics of a directly-operated safety relief
valve,” Nucl. Eng. Des., vol. 328, pp. 321–332, 2018.
[7] M. Petrik, G. Szepesi, and K. J�armai, “CFD analysis and heat
transfer characteristics of finned tube heat exchangers,” Pollack
Period., vol. 14, no. 3, pp. 165–176, 2019.
[8] I. Erd}odi and C. H}os, “Prediction of quarter-wave instability in
direct spring operated pressure relief valves with upstream piping
by means of CFD and reduced order modelling,” J. Fluids Struct.,
vol. 73, pp. 37–52, 2017.
Open Access. This is an open-access article distributed under the terms of the Creative Commons Attribution 4.0 International License (https://creativecommons.org/licenses/by/4.0/), which permits unrestricted use, distribution, and reproduction in any medium, provided the original author and source are credited, a link to the CCLicense is provided, and changes – if any – are indicated. (SID_1)
Pollack Periodica 16 (2021) 1, 109–113 113
Unauthenticated | Downloaded 01/08/22 04:22 PM UTC