Embed Size (px)
Citation preview

1
CFD ANALYSIS OF TURBULENCE EFFECT ON REACTION IN STIRRED TANK REACTORS
Udaya Bhaskar Reddy R*, Gopalakrishnan S, Ramasamy E Department of Chemical Engineering, Coimbatore Institute of Technology, Coimbatore- 641014, INDIA.
ABSTRACT
Stirred tank reactors are one of the most commonly used equipments in industry for
achieving mixing and reaction. Flow fields in a stirred reactor are obtained via computational fluid
dynamics. In this work CFD is used for the simulation of a reactive flow process consisting of a
second order reaction. The extent of reaction is found to depend on impeller speed and its position
from the bottom of the reactor and therefore on the mixing behavior during the steady state
process. The flow field based simulations performed led to predictions that are very well compared
with the experimental data. These results are obtained by modeling through finite volume method
using FLUENT (version 5.5). Impeller induced boundary conditions are important aspects that
significantly enriches the mathematical representation of the primary source of motion in tanks. The
results are compared with experimental values obtained from a laboratory stainless steel reactor
employed with marine impeller.
KEY WORDS: Computational fluid dynamics, Stirred tank reactor, Marine impeller
* Corresponding author C/O International Research centre, Akzo Nobel car refinishes (I) Pvt. Ltd., Plot no. 62P, Hoskote Industrial area, Bangalore -562114. INDIA. Ph: 91-80-7971941-3 Mobile: 91-98456 13630 E-mail address: [email protected]

2
1. INTRODUCTION Mixing is an important unit operation in many chemical engineering applications. Mixing
operation has been the subject of many investigations.
The limitations associated with the lumping process are avoided by using the distributed
parameter models, which are based on the actual hydrodynamics inside the tank. A huge amount
of information about these hydrodynamics cannot be obtained via experimentations. The
continuing development of commercial codes for computational fluid dynamics applied to the case
of mixing give accurate results. Two advanced modeling approaches were tested by Brucato et.
al., (1999) using STAR-CD code. A k-ε model was used to analyze turbulence and the SIMPLEC
method to solve pressure linked equations and proved that mixing depends on agitation rate and
position of impellers. Brucato et. al.,(2000) extended the CFD three dimensional simulations for
competitive reactions in a batch process and the results obtained are based on macro mixing
assumption and they showed that there was a good agreement between simulation results and
experimental values by using k-ε model with CFDS flow 3D code.
The results of Eddy contact model (Forney L J, and Nafia N, 2000) for parallel reactions
between acid –base – ester in a nearly homogeneous turbulence is as accurate as Monte Carlo
/PDF methods and is comparable to a mixture fraction technique. A 2D hydrodynamic model of a
mixing vessel for pitched blade turbines operating in laminar range of motion is presented
(Kunnecewicz, pietzykowski, 2001) to account for the additional forces acting on liquid in the
impeller region using the Navier - Stokes equation. The model was verified by measuring the
power consumption and axial forces acting on the bottom and wall of the vessel.
A combined experimental and computational approach to simulation (Yoon H S et. al.,
2001) was performed on six different r – z planes locked at different angles from 0o to 50o and it
was reported that the impeller induced flow is dominated by circumferential flow, tangential jet and
3
pairs of tip velocity using FLUENT at an impeller Reynolds Number of 4000. The computational
values were verified with PIV. A two compartment model ( Kiparissides et. al., 2002) for particle
size distribution in polymerization reactors by taking into account the variations in turbulent kinetic
energy and its dissipation rate in the vessel, using k-ε with FLUENT and time evolution of the
droplet distribution in the mixing vessel was also measured.
In the present work, k-ε model is used which accounts for the turbulent flow field in the
possible manner. The reaction is modeled by Finite Rate/ Eddy dissipation volume mixed ness
model. The simulations were carried out using FLUENT (version 5.5) with the k-ε model for
turbulence and multiple reference frame model for impeller induced flow, to analyze the reaction
between Ethyl acetate and sodium hydroxide. The following sections deals with the experimental
procedure, governing equations and results obtained.
2. EXPERIMENTAL STUDIES
Experiments were carried out in a laboratory scale 306 stainless steel reactor of height
26.5 cm and 14.7 cm diameter, provided with a marine impeller of 2 cm diameter as shown in fig.1,
stirred by universal motor. The experiments were conducted for the reaction between Ethyl acetate
and Sodium hydroxide, which is a second order reaction. The reactor contains two inlets through
which Ethyl acetate and Sodium hydroxide of 0.05 mol/lit concentration each were pumped using
valve less metering pumps to maintain constant flow rate. The concentration at the exit of the
reactor in a steady state process was measured using standard analytical technique (Kolthoff I M,
Stenger V A, 1947). Concentration at the exit was measured for different impeller speeds of the viz.
500, 750, 1000 and 2000 rpm and for different locations of the impeller such as 2cm, 7cm and
11cm from the bottom of the reactor.

4
3. GOVERNING EQUATIONS
The reactor was modeled with the following assumptions
1. Constant density
2. Axi-symmetricity of the reactor with its inlet/outlet boundaries
3. The impeller is assumed as a disc
The paper discusses the 2D modeling and simulation of the reaction vessel for a single
reaction with horizontal three blade marine impeller, which rotates along the horizontal direction. In
this case, the equations solved for a CFD solution are continuity equation (both component and
overall) and momentum equation. A turbulence model for the calculation of turbulent flows
supplements these. A standard k-ε model is used, in which the species concentration associated
with turbulent flow is calculated in terms of additional parameters namely, turbulent kinetic energy
and its dissipation rate via Finite Rate/Eddy dissipation model. The concentration of species is
calculated by solving the generalized scalar transport equation ( Verstteeg H K, Malalasekera,
1998) given by the following equation
∂(ρ mi) + ∂(ρuimi’) = ∂ ji+ Ri’ + Si’ ∂t ∂xi ∂x
The influence of turbulence of on the reaction rate is taken into account by employing the
Finite rate/ Eddy dissipation model. The reaction rate is given by
R i,k = -ν’i,k M’i A B ρ ε Σ P mP
k Σ ν’’j,k M’j j
4. RESULTS AND DISCUSSION
Impeller speed and its height from the bottom are two important parameters. Here,
FLUENT was used to simulate the influence of the two parameters and therefore the influence of

5
turbulence on the reaction between Ethyl acetate and Sodium hydroxide. Both impeller speed and
its position from bottom were varied keeping the flow rate constant. The stirrer speed was varied
from 500 – 2000 rpm, whereas its position varied from 2-11 cm from the bottom of the reactor.
Several simulations of the reactive process under investigation were carried out, covering
the experimental range of values of reactant concentrations, their dependence on agitation speeds
and the position of impeller from the bottom of the reactor.
Table 1 gives the results obtained in experiments and simulation values.
Experimental values CFD Simulation Results S. No Height of impeller
from bottom
Speed of impeller Exit mass
fraction of NaOH
mAx 10+4
Conversion of NaOH
XA
%
Exit mass fraction of
NaOH mAx 10+4
Conversion of NaOH
XA %
2 cm 500 750 1000 2000
6.335 5.813 6.147
6.7696
36.65 41.95
38.522 32.31
6.21 6.06 6.37 7.10
37.93 39.41 36.31 29.00
7 cm 500 750 1000 2000
6.822 6.102 6.693 7.203
31.86 39.08 33.18 28.07
6.89 6.191 6.43 7.51
31.21 38.19 35.82 24.06
1 2 3 4 5 6 7 8 9 10 11 12
11 cm 500 750 1000 2000
7.192 6.908 7.396 7.782
28.00 30.86 25.97 22.11
7.09 7.02 7.72 8.10
28.53 29.75 22.84 18.98
Table 1 - Comparison of Experimental values with Simulation Results

6
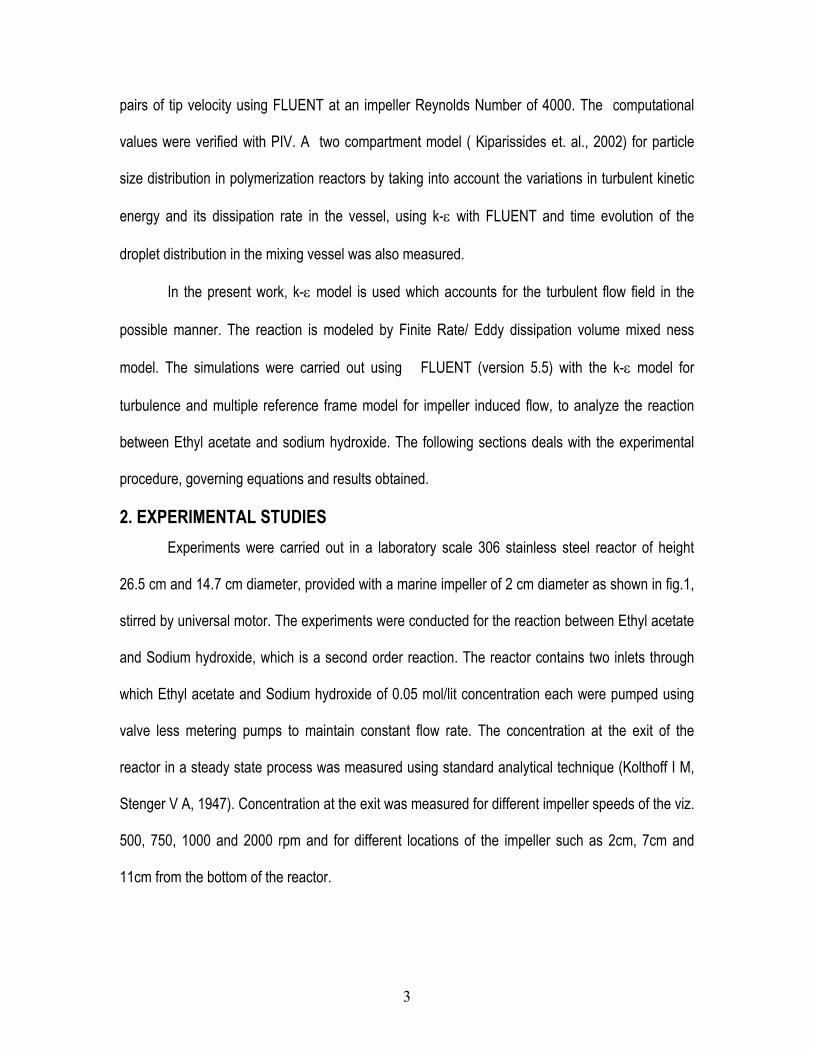
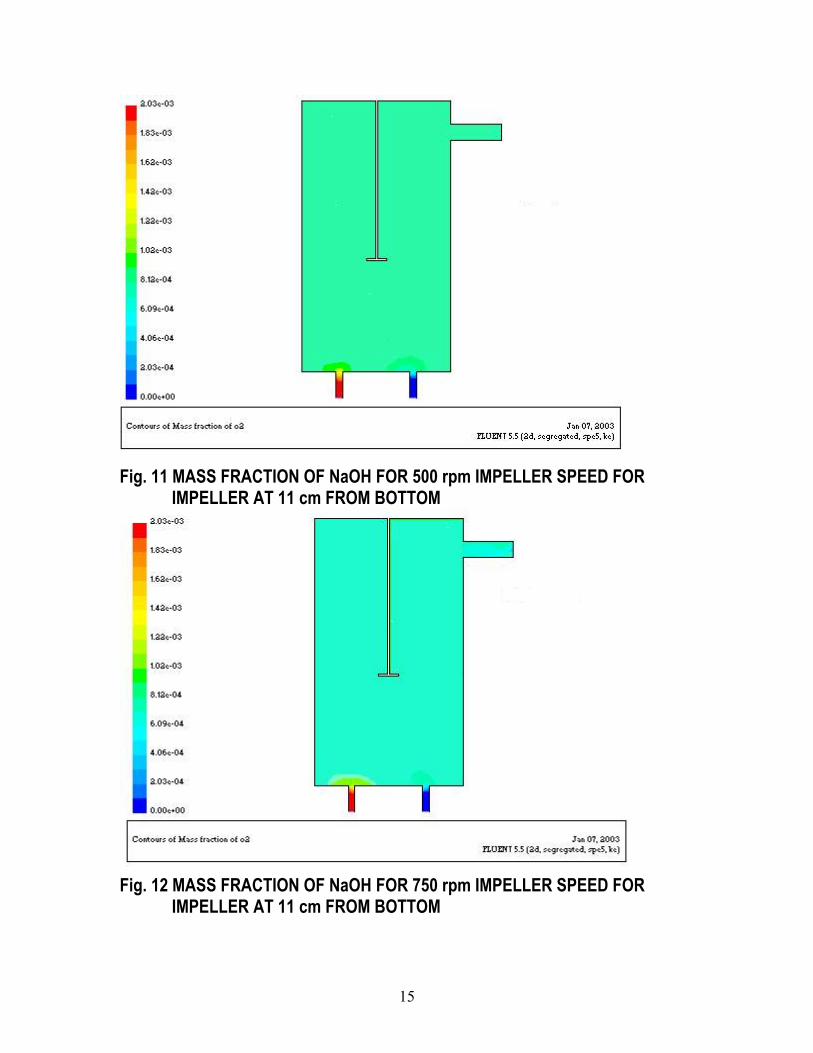
The CFD simulation results obtained as shown in the fig.2 to 14. Fig. 2 shows the velocity
contours in side the reactor for 500 rpm speed and 2 cm position from the bottom of the reactor.
Fig.3 to14 shows the concentration distribution of NaOH in side the reactor for different speeds of
the stirrer and different positions of the stirrer from the bottom of the reactor. The contour values
were viewed from color code. Simulation results of sodium hydroxide concentration do practically
coincide with experimental values. The deviation between experimental values and simulation
results tends to increase at high agitation speeds, which implies some under estimation of mixing
intensity. The simulation results of conversion of sodium hydroxide for different runs conducted for
different impeller positions viz., 2 cm, 7 cm and 11 cm from bottom and for different speeds of
impeller from 500 to 2000 rpm are compared with the experimentally observed trend. From fig. 3, it
is observed that the mass fraction of sodium hydroxide near the impeller region is somewhat higher
than the other regions. This is happened for all impeller speeds for the impeller position of 2 cm
from the bottom of the reactor. This may be due to the fact that when the impeller is located near
the reactor inlet, there is a tendency for the impeller to pickup reactant molecules and drop them in
the vicinity of the impeller. The results obtained by CFD simulations are again in good trend with
experimental data.
It is observed that the speed has adverse effect on reaction. As the speed increases, the
conversion increases up to 750 rpm for all different impeller locations and then decreases.
Maximum conversion is obtained at 750rpm for all impeller locations. It is also observed that, the
conversion is high for 2 cm position of impeller from bottom than that at 11 cm position of impeller
from bottom and the same for 7 cm position of impeller is in between 2 cm and 11 cm height from
the bottom of the reactor for all impeller speeds.

7
The good agreement obtained between simulated and experimental values can therefore
be regarded as a proof of the fact that CFD technique is powerful tool for proper accounting of such
phenomena.
CONCLUSION
CFD based simulations of turbulence effect in a stirred tank reactor employed with a three
blade marine impeller was carried out. Experiments were conducted for different positions of the
impeller from bottom and various speeds of impeller in a 14.7 cm diameter and 26.5 cm height
laboratory scale stainless steel reactor. A very good agreement between the experimental values
and simulation results was found. The small deviation may be due to the assumption of axi-
symmetry of the reactor with its inlet and exit.
Simulations were carried out with FLUENT (version 5.5) using standard k-ε model, Finite
Rate/ Eddy dissipation model and multiple reference frame model for turbulence, reaction and
moving zone (impeller) respectively and the equations were discretized using first order up- wind
scheme.
An approximate 2 Dimensional simulation with 39931, 40125, 41257 nodes for 2cm, 7 cm
and11cm impeller position respectively, was performed assuming axis-symmetry.
The observations led to conclusion that the impeller speed and its height affect the
conversion. It is also concluded that the impeller positioned at 2 cm from the bottom and rotated at
750 rpm gives the maximum conversion.
The trend between simulated and experimental values substantiates the fact that CFD is a
powerful technique for proper accounting of turbulence effect on reaction in stirred tank reactors.

8
NOMENCLATURE A Constant for Finite Rate/Eddy dissipation model B Constant for Finite Rate/Eddy dissipation model C1µ, C2µ,Cµ Constants for k- ε model Dil’ Diffusivity of ith species, m2/sec Eij Reynolds Stresses ji,i Flux of ith species mA Exit mass fraction of Sodium hydroxide mi Mass fraction of ith species mp Mass fraction of product Mi’ Mass fraction of Reactant NRe Reynolds number P Product, moles Ri,k Rate of production of ith species, moles /time Rp Residual of flow property Sct Schmidt Number Si Source term for ith species t Time U Velocity vector x Direction XA Conversion of Sodium hydroxide Yi Mole fraction of ith species GREEK LETTERS k Turbulent kinetic energy, m2/s2 ε Turbulence dissipation rate, m2/s3 ρ Density, kg/m3 µ Viscosity, kg/ m sec µt Turbulent Viscosity, kg/ m sec σk , σε Constants for k- ε model ν’ Stoichiometric Co-efficient for reactant ν” Stoichiometric Co-efficient for product BIBLIOGRAPHY [1] Ranade V V (1997) Computational Flow Modeling for Chemical Reactor Engineering, 1st ed. [2] Giorgio Micale et. al.,( March 1999) Predictions of flow fields in a dual- impeller stirred vessel, AIChEJ, Volume 45, Issue3, Pages 445- 464 [3] Brucato et. al., (January 2000)On the Simulation of Stirred tank Reactors via Computational

9
Fluid Dynamics, Chemical Engineering Science, Volume 55, Issue 2, Pages291 - 302
[4] Forney L J, Nafia N (December 2000) Eddy Contact model: CFD simulations of Liquid reactions in nearly homogeneous turbulence Chemical Engineering Science, Volume 55,
Issue24, Pages 6049 – 6058
[5] Lamberto D J, Alvarez M M, Muzzio F J (August 2001), Computational Analysis of regular and chaotic mixing in Stirred tank reactor, Chemical Engineering Science, Volume 56,
Issue 16 , Pages 4887- 4899
[6] Yoon H S et. al., (December 2001)Integrated experimental and Computational approach to simulation of flow in a stirred tank, Chemical Engineering Science, Volume 57, Issue 23, ,
Pages 6635 – 6649 [7] Stephen Bugay et. al.,(March 2002) Experimental analysis of Hydrodynamics in axially agitatedTank,AICHEJ, Volume 48, Issue 3, Pages 463-475
[8] Alexo Poulos A H, (May 2002) CFD analysis of turbulence non- homogeneity in mixing vessels, A two – Compartment model, Chemical Engineering Science, Volume 57,
Issue 10, Pages 1735- 1752 [9] Versteeg H K MalalaSekera W (1995) An Introduction to Computational Fluid Dynamics-
The Finite Volume Method, Longman group Limited, [10] FLUENT users Manual (1998), Fluent Inc., [11] FLUENT SOLVER (2002) – Training Lecture Notes, Fluent India Pvt. Ltd., [12] Kolthoff I M, Stenger V A (1947), Volumetric analysis, Volume I & II, Inter science Publishers, Inc., New York, [13] Keith J Laidler, (1987) Chemical kinetics, Harper& Row Publishers, Newyork, [14] John D Anderson Jr. (1995) Computational Fluid Dynamics – The basics with applications, McGraw- Hill, Inc.,

10
Fig.1 Experimental set up
LEGEND KEY:
1. Reactor 2. Valve less metering pumps 3. FMI Stroke rate Controller 4. Reactor Inlets 5. Reactor Outlet 6. Universal motor 7. Speed Regulator 8. Sodium hydroxide storage tank 9. Ethyl acetate storage tank
SIMULATION RESULTS
Fig.2 Velocity profile for impeller at 2 cm from bottom for 500 rpm speed

11
Fig. 3 MASS FRACTION OF NaOH FOR 500 rpm IMPELLER SPEED FOR IMPELLER AT 2 cm FROM BOTTOM
Fig. 4 MASS FRACTION OF NaOH FOR 750 rpm IMPELLER SPEED FOR IMPELLER AT 2 cm FROM BOTTOM

12
Fig.5 MASS FRACTION OF NaOH FOR 1000 rpm IMPELLER SPEED FOR IMPELLER AT 2 cm FROM BOTTOM
Fig. 6 MASS FRACTION OF NaOH FOR 2000 rpm IMPELLER SPEED FOR IMPELLER AT 2 cm FROM BOTTOM

13
Fig. 7 MASS FRACTION OF NaOH FOR 500 rpm IMPELLER SPEED FOR IMPELLER AT 7 cm FROM BOTTOM
Fig. 8 MASS FRACTION OF NaOH FOR 750 rpm IMPELLER SPEED FOR IMPELLER AT 7 cm FROM BOTTOM

14
Fig. 9 MASS FRACTION OF NaOH FOR 1000 rpm IMPELLER SPEED FOR IMPELLER AT 7 cm FROM BOTTOM
Fig. 10 MASS FRACTION OF NaOH FOR 2000 rpm IMPELLER SPEED FOR IMPELLER AT 7 cm FROM BOTTOM
15
Fig. 11 MASS FRACTION OF NaOH FOR 500 rpm IMPELLER SPEED FOR IMPELLER AT 11 cm FROM BOTTOM
Fig. 12 MASS FRACTION OF NaOH FOR 750 rpm IMPELLER SPEED FOR IMPELLER AT 11 cm FROM BOTTOM

16
Fig. 13 MASS FRACTION OF NaOH FOR 1000 rpm IMPELLER SPEED FOR IMPELLER AT 11 cm FROM BOTTOM
Fig. 14 MASS FRACTION OF NaOH FOR 2000 rpm IMPELLER SPEED FOR IMPELLER AT 11 cm FROM BOTTOM

17
SPEED VS. CONVERSION OF NaOH FOR IMPELLER AT 2 cm FROM BOTTOM
2530354045
0 500 1000 1500 2000 2500
IMPELLER SPEED rpmC
ON
VER
SIO
N O
F N
aOH
%Experimental Values Simulation Results
Fig.15 EFFECT OF IMPELLER SPEED ON CONVERSION OF NaOH FOR
MPELLER AT 2 cm FROM BOTTOM SPEED VS. CONVERSION OF NaOH FOR
IMPELLER AT 7 cm FROM BOTTOM
20
2530
3540
45
0 500 1000 1500 2000 2500
IMPELLER SPEED rpm
CO
NVE
RSI
ON
OF
NaO
H %
Experimental Values Simulation Results
Fig.16 EFFECT OF IMPELLER SPEED ON CONVERSION OF NaOH FOR
IMPELLER AT 7 cm FROM BOTTOM
SPEED VS. CONVERSION OF NaOH FOR IMPELLER AT 11 cm FROM BOTTOM
1520253035
0 500 1000 1500 2000 2500IMPELLER SPEED rpm
CO
NVE
RSI
ON
OF
NaO
H %
Experimental Values Simulation Results
Fig.17 EFFECT OF IMPELLER SPEED ON CONVERSION OF NaOH FOR
IMPELLER AT 11 cm FROM BOTTOM