Embed Size (px)
Citation preview
CFD ANALYSIS OF A TRICKLE BED WITH AIR-CMC
SYSTEM
A THESIS SUBMITTED IN PARTIAL FULFILLMENT OF THE
REQUIREMENTS FOR THE DEGREE OF
Bachelor of Technology
in
Chemical Engineering
Submitted by
Subhashree Sahoo
110CH0086
Under the guidance
of
Dr. Hara Mohan Jena
Department of Chemical Engineering
National Institute of Technology
Rourkela
2014
i
CERTIFICATE
This is to certify that the thesis entitled, “CFD ANALYSIS OF A TRICKLE BED WITH
AIR-CMC SYSTEM”, submitted by Subhashree Sahoo, Roll no. 110CH0086, in partial
fulfilment of the requirements for the award of degree of Bachelor of Technology in
Chemical Engineering at National Institute of Technology, Rourkela is an authentic work
carried out by her under my supervision and guidance.
To the best of my knowledge, the matter embodied in the report has not been submitted to
any other University / Institute for the award of any Degree or Diploma.
Date: 15.5.2014 Prof. Dr. H. M. Jena
Assistant Professor
Place: Rourkela Department of Chemical Engineering
National Institute of Technology
Rourkela - 769008
INDIA
ii
ACKNOWLEDGEMENT
I wish to express my sincere thanks and gratitude to Prof. Dr. H. M. Jena (Project Guide) for
suggesting me the topic and providing me valuable guidance, motivation and constructive
criticsm throughout the course of the project. I would also like to thank Rahul Omar
(PhD guide) for his constant help and support.
I also express my sincere gratitude to Prof. Dr. R.K.Singh (HOD & Project Coordinator), of
Department of Chemical Engineering, National Institute of Technology, Rourkela, for his
valuable guidance and timely suggestions during the entire duration of my project work. I am
also grateful to Department, Chemical Engineering for providing me the necessary
opportunities for the completion of my project.
SUBHASHREE SAHOO
110CH0086
iii
ABSTRACT
Trickle Bed Reactors have wide scale application in chemical process industries mainly in
petrochemical and refinery process because of their flexibility and simplicity of
operation. Pressure drop and liquid holdup are the basic parameters for design, scale up and
operation of trickle bed reactors. However multiphase flow in trickle bed reactor is known to
be extremely complex and depends on various effects including the physico-chemical
properties of gas, liquid and solid phases, ratio of column diameter to particle diameter and
most importantly gas and liquid superficial velocities. Since most of the fluids encountered in
industrial processes are non Newtonian, simulations have been carried out for air- Carboxy
Methyl Cellulose system. In the present work an attempt has been made to study the
hydrodynamics of a co-current gas-liquid-solid trickle bed reactor. CFD simulations have
been done using Eulerian-Eulerian approach for a trickle bed system. The contours of volume
fraction for the different phases are shown. Also the effect of liquid and gas velocity on the
phase hold up and pressure drop are represented in graphical form and studied. The results
obtained from simulations have been compared with the experimental data available in
literature and there is a close agreement between the two.
Keywords: Trickle bed reactor, Computational Fluid Dynamics, Hydrodynamics
iv
CONTENTS
Certificate i
Acknowledgement
ii
Abstract
iii
Contents
iv
List of Figures
vi
List of Tables
viii
Nomenclature ix
1.Introduction and Literature Review
1.1 Trickle Bed Reactors
1.2 Advantages of Trickle Bed Reactors
1.3 Disadvantages of Trickle Bed Reactors
1.4 Applications of Trickle Bed Reactors
1.5 Hydrodynamics of Trickle Bed Reactors
1.6 Scope of the present work
1.7 Objective of the present work
1
1
2
3
3
4
10
10
2. CFD Modeling and Simulation of Trickle Bed System
2.1 CFD Modeling
2.1.1 Elements of CFD Codes
2.1.2 Advantages of CFD
2.1.3 Multiphase flow: Eulerian Model
2.1.4 Conservation Equations in Eulerian Model
2.1.5 Turbulence Modeling
2.1.6 Flow Model
2.1.7 Assumptions
2.1.8 Problem Description
2.1.9 Porous Media Conditions
2.2 CFD Simulation
2.2.1 Geometry and Mesh
2.2.2 Solution
2.2.3 Cell Zone Conditions and Boundary Conditions
11
11
11
11
12
13
13
14
14
14
15
16
16
17
18
v
3. Results and Discussions
3.1 Liquid Holdup
3.2 Gas Holdup
3.3 Pressure Drop
3.4 Comparison with Literature Data
19
20
23
26
30
4. Conclusions
31
References 33
vi
LIST OF FIGURES
Figure 1.1 Schematic diagram of a Trickle Bed 1
Figure 1.2 Various flow regimes in a Trickle Bed 5
Figure 1.3 Schematic illustration of the several liquid flow textures during
Trickle flow operation 5
Figure 2.1 Schematic of the set-up 15
Figure 2.2 Mesh used in the problem 17
Figure 3.1 Contours of volume fraction of air for air velocity 0.05 m/s
and liquid velocity 0.004 m/s 19
Figure 3.2 Contours of volume fraction of gas and liquid phases
at air velocity 0.06 m/s and liquid velocity 0.006 m/s 20
Figure 3.3 Variation of liquid holdup with liquid velocity 21
Figure 3.4 Variation of liquid holdup with gas velocity 21
Figure 3.5 Variation of liquid holdup with column height for air velocity
0.08 m/s and liquid velocity 0.004 m/s 22
Figure 3.6 Variation of liquid holdup with column height for air velocity
0.08 m/s and liquid velocity 0.006 m/s 22
Figure 3.7 Radial variation of liquid holdup at bed height 0.2 m for air
velocity 0.1 m/s and liquid velocity 0.004 m/s 23
Figure 3.8 Radial variation of liquid holdup at bed height 0.2 m for air
velocity 0.1 m/s and liquid velocity 0.006 m/s 23
Figure 3.9 Variation of gas holdup with liquid velocity 24
Figure 3.10 Variation of gas holdup with gas velocity 24
Figure 3.11 Variation of gas holdup with column height for air velocity
0.1 m/s and liquid velocity 0.004 m/s 25
Figure 3.12 Variation of gas holdup with column height for gas velocity
0.1 m/s and liquid velocity 0.006 m/s 25
vii
Figure 3.13 Radial variation of gas holdup at column height 0.4m for gas
velocity 0.06 m and liquid velocity 0.004 m/s 26
Figure 3.14 Radial variation of gas holdup at column height 0.4m for gas
velocity 0.06 m/s and liquid velocity 0.006 m/s 26
Figure 3.15 Variation of pressure drop with liquid velocity 27
Figure 3.16 Variation of pressure drop along column height for gas velocity
0.03 m/s and liquid velocity 0.01 m/s 28
Figure 3.17 Variation of pressure drop along column height for gas velocity
0.03 m/s and liquid velocity 0.012 m/s 28
Figure 3.18 Radial variation of pressure drop at bed heights 0.2m and 0.4m
for gas velocity 0.03 m/s and liquid velocity 0.01 m/s 29
Figure 3.19 Radial variation of pressure drop at bed heights 0.2m and 0.4m
for gas velocity 0.03 m/s and liquid velocity 0.012 m/s 29
Figure 3.20 Comparison of pressure drop with literature data 30
viii
LIST OF TABLES
Table 2.1 Model Constants used for turbulence modeling 14
Table 2.2 Properties of air, CMC and glass beads 15
Table 2.3 Models used for considering force interaction among phases 17
Table 2.4 Solution Method 18
Table 2.5 Solution Control Parameters 18
Table 3.1 Comparison of Pressure Drop Data 30
ix
NOMENCLATURE
g= Acceleration due to gravity, m/s2
ρq = Density of phase, kg/m3
ε= Dissipation rate of turbulent kinetic energy, m2s
-3
μeff = Effective viscosity, kg/m-s
αq = Volume fraction of phase (dimensionless)
vq = velocity of phase q, m/s
mpq = mass transfer rate from pth
to qth
phase, kg/s
mqp = mass transfer rate from qth
to pth
phase, kg/s
Sq = Source term, J/K
τq = stress-strain tensor for qth
phase, Pa
p = Pressure, Pa
t= Time, s
Fq = External body force, N
Flift,q = Lift force, N
Fvm,q = Virtual mass force, N
Rpq = Interaction force between phases, N
hq = Specific enthalpy of qth
phase, J/kg
qq = Heat flux, W/m2
Qpq = Intensity of heat exchange between pth
and qth
phase, W
hpq = Interphase enthalpy, J/kg
k= Turbulent kinetic energy, J
U= Velocity of phase, m/s
D = Diameter of the column, m
Dp = Diameter of particle, mm
x
ϵ = void fraction (dimensionless)
C2 = Inertial Resistance term, m-1
CMC = Carboxy Methyl Cellulose
TBR = Trickle Bed Reactor
1
CHAPTER 1
INTRODUCTION AND LITERATURE REVIEW
1.1 TRICKLE BED REACTORS
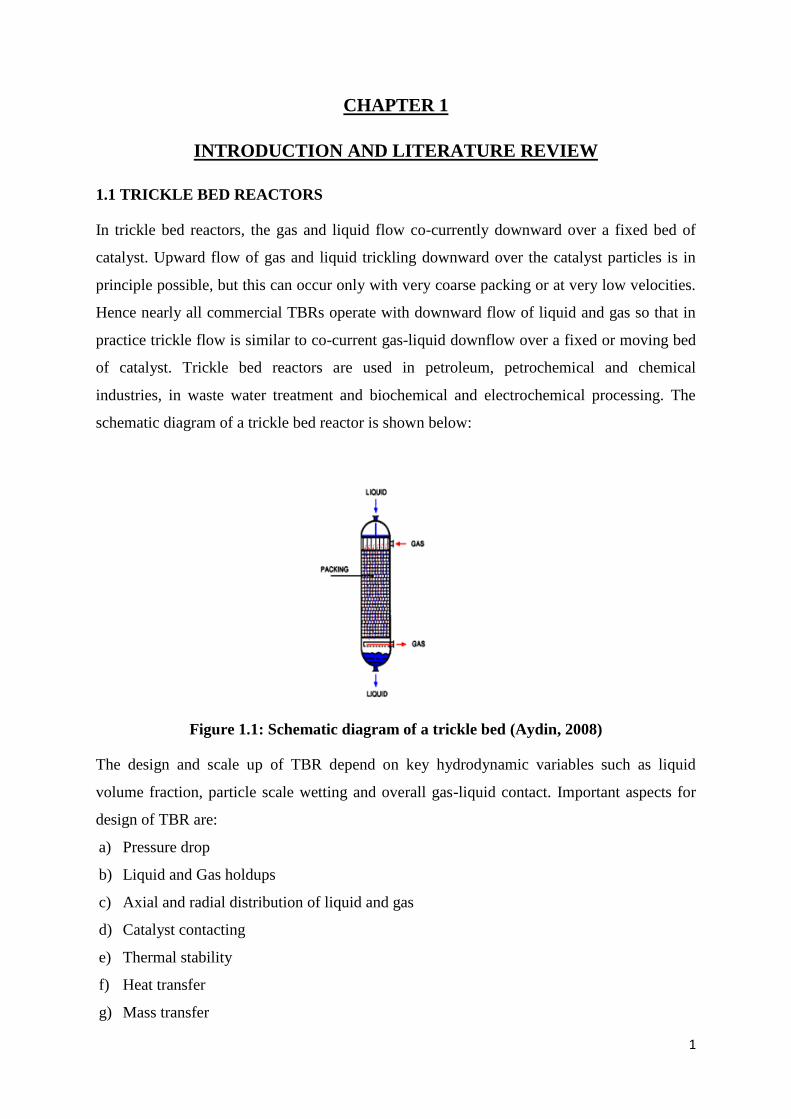
In trickle bed reactors, the gas and liquid flow co-currently downward over a fixed bed of
catalyst. Upward flow of gas and liquid trickling downward over the catalyst particles is in
principle possible, but this can occur only with very coarse packing or at very low velocities.
Hence nearly all commercial TBRs operate with downward flow of liquid and gas so that in
practice trickle flow is similar to co-current gas-liquid downflow over a fixed or moving bed
of catalyst. Trickle bed reactors are used in petroleum, petrochemical and chemical
industries, in waste water treatment and biochemical and electrochemical processing. The
schematic diagram of a trickle bed reactor is shown below:
Figure 1.1: Schematic diagram of a trickle bed (Aydin, 2008)
The design and scale up of TBR depend on key hydrodynamic variables such as liquid
volume fraction, particle scale wetting and overall gas-liquid contact. Important aspects for
design of TBR are:
a) Pressure drop
b) Liquid and Gas holdups
c) Axial and radial distribution of liquid and gas
d) Catalyst contacting
e) Thermal stability
f) Heat transfer
g) Mass transfer
2
Performance of TBR depends on various factors such as:
a) Porosity: liquid and gas holdup, pressure drop, mal-distribution factor and wetting
deficiency decreases with increase in porosity, however gas-liquid mass transfer rate,
liquid solid mass transfer rate and axial dispersion of fluid increases with increase in
porosity.
b) Surface tension: pressure drop increases with increase in surface tension of liquid but gas-
liquid mass transfer and wetting efficiency decreases.
c) Liquid superficial velocity: liquid holdup, pressure drop, mass-transfer, wetting
efficiency and axial dispersion increases with liquid superficial velocity but mal-
distribution of liquid decreases.
d) Gas superficial velocity: liquid holdup and mal-distribution decreases with increase in gas
superficial velocity but pressure drop, mass transfer and wetting efficiency increases.
e) Particle size: liquid and gas holdup, pressure drop, mass transfer rate and wetting
efficiency decreases with increase in particle size but axial dispersion and mal-distribution
factor increases.
f) Liquid density: pressure drop increases with increase in liquid density and performance in
mass transfer and wetting efficiency becomes poor.
g) Liquid viscosity: holdup, pressure drop, gas-liquid mass transfer and wetting efficiency
increases with increase in liquid viscosity but axial dispersion of liquid decreases.
h) Gas viscosity: holdup, pressure drop, liquid-gas mass transfer rate increases with increase
in gas viscosity.
i) Pressure (gas density): liquid holdup, liquid-solid mass transfer rate and liquid mass
transfer rate decreases with increase in pressure but pressure drop, gas-solid mass transfer
rate and wetting efficiency increases.
1.2 ADVANTAGES OF TRICKLE BED REACTORS
The advantages of trickle bed reactors include (Saroha et al., 1996):
a) The absence of moving parts in trickle bed reactors results in lower maintenance cost.
b) Plug flow operation and effective catalyst wetting result in higher reaction conversions.
c) Liquid holdup is less i.e, ratio of liquid to solid is less, which reduces the possibility of
homogeneous side reactions.
d) Trickle bed reactors have large capacities.
3
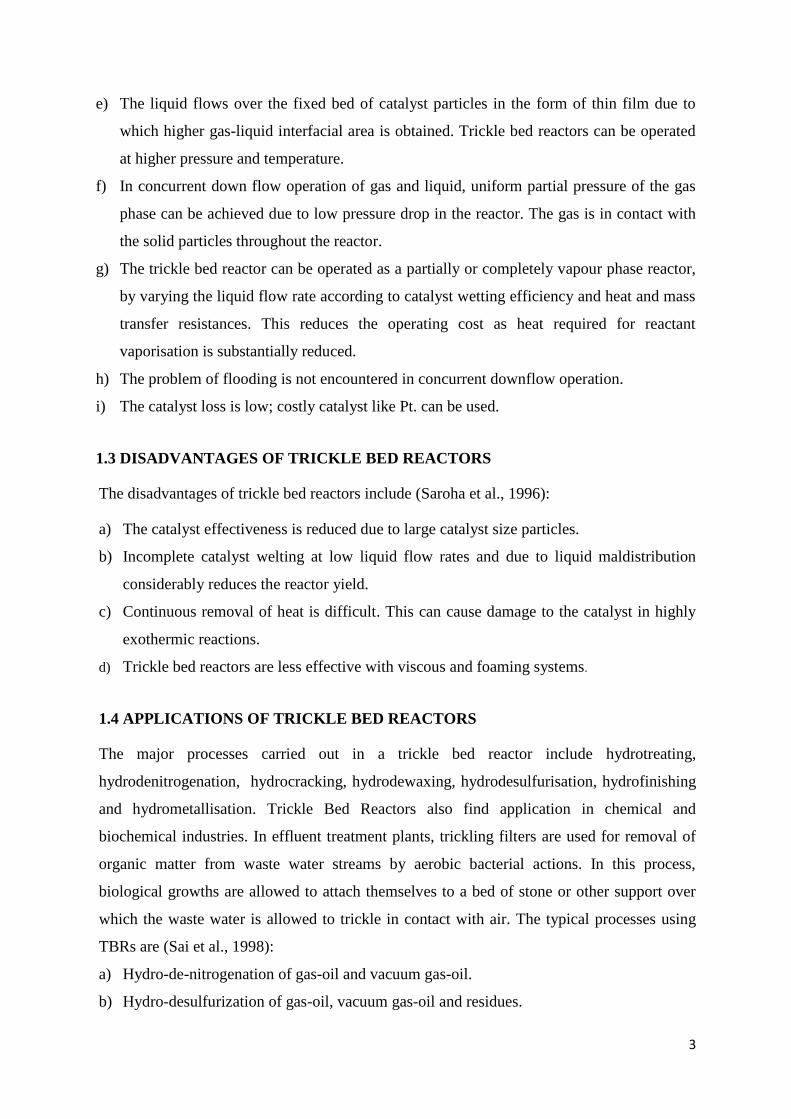
e) The liquid flows over the fixed bed of catalyst particles in the form of thin film due to
which higher gas-liquid interfacial area is obtained. Trickle bed reactors can be operated
at higher pressure and temperature.
f) In concurrent down flow operation of gas and liquid, uniform partial pressure of the gas
phase can be achieved due to low pressure drop in the reactor. The gas is in contact with
the solid particles throughout the reactor.
g) The trickle bed reactor can be operated as a partially or completely vapour phase reactor,
by varying the liquid flow rate according to catalyst wetting efficiency and heat and mass
transfer resistances. This reduces the operating cost as heat required for reactant
vaporisation is substantially reduced.
h) The problem of flooding is not encountered in concurrent downflow operation.
i) The catalyst loss is low; costly catalyst like Pt. can be used.
1.3 DISADVANTAGES OF TRICKLE BED REACTORS
The disadvantages of trickle bed reactors include (Saroha et al., 1996):
a) The catalyst effectiveness is reduced due to large catalyst size particles.
b) Incomplete catalyst welting at low liquid flow rates and due to liquid maldistribution
considerably reduces the reactor yield.
c) Continuous removal of heat is difficult. This can cause damage to the catalyst in highly
exothermic reactions.
d) Trickle bed reactors are less effective with viscous and foaming systems.
1.4 APPLICATIONS OF TRICKLE BED REACTORS
The major processes carried out in a trickle bed reactor include hydrotreating,
hydrodenitrogenation, hydrocracking, hydrodewaxing, hydrodesulfurisation, hydrofinishing
and hydrometallisation. Trickle Bed Reactors also find application in chemical and
biochemical industries. In effluent treatment plants, trickling filters are used for removal of
organic matter from waste water streams by aerobic bacterial actions. In this process,
biological growths are allowed to attach themselves to a bed of stone or other support over
which the waste water is allowed to trickle in contact with air. The typical processes using
TBRs are (Sai et al., 1998):
a) Hydro-de-nitrogenation of gas-oil and vacuum gas-oil.
b) Hydro-desulfurization of gas-oil, vacuum gas-oil and residues.
4
c) FCC feed hydro-treating.
d) Hydrocracking of catalytically cracked gas-oil and vacuum gas-oil.
e) Hydro-cracking of residual oil.
f) Hydro-metallization of residual oil.
g) Hydro-processing of shale oils
h) Hydro-cracking/Hydro-fining of lubeoils
i) Oxidative Treatment of Waste water.
j) Paraffin Synthesis by Fischer-Tropsch.
k) Synthesis of diols.
1.5 HYDRODYNAMICS OF TRICKLE BED REACTORS
Hydrodynamics of TBR is quantified in terms of hydrodynamic parameters like pressure
drop, liquid or gas hold up, liquid maldistribution, which are related to gas-liquid-solid
contacting efficiency and operational efficiency of reactor column. Pressure drop and liquid
hold up depends both on operation condition and flow history of the bed. Flow distributions
are closely related to studies of hysteresis in TBR, which is attributed to change in flow
distribution and related flow patterns with flow history.
1.5.1 Flow Regimes:
In a TBR, various flow regimes are distinguished depending on gas/ liquid flow rates (most
influential), fluid properties and packing characteristics. These flow regimes are (Saroha et
al., 1996):
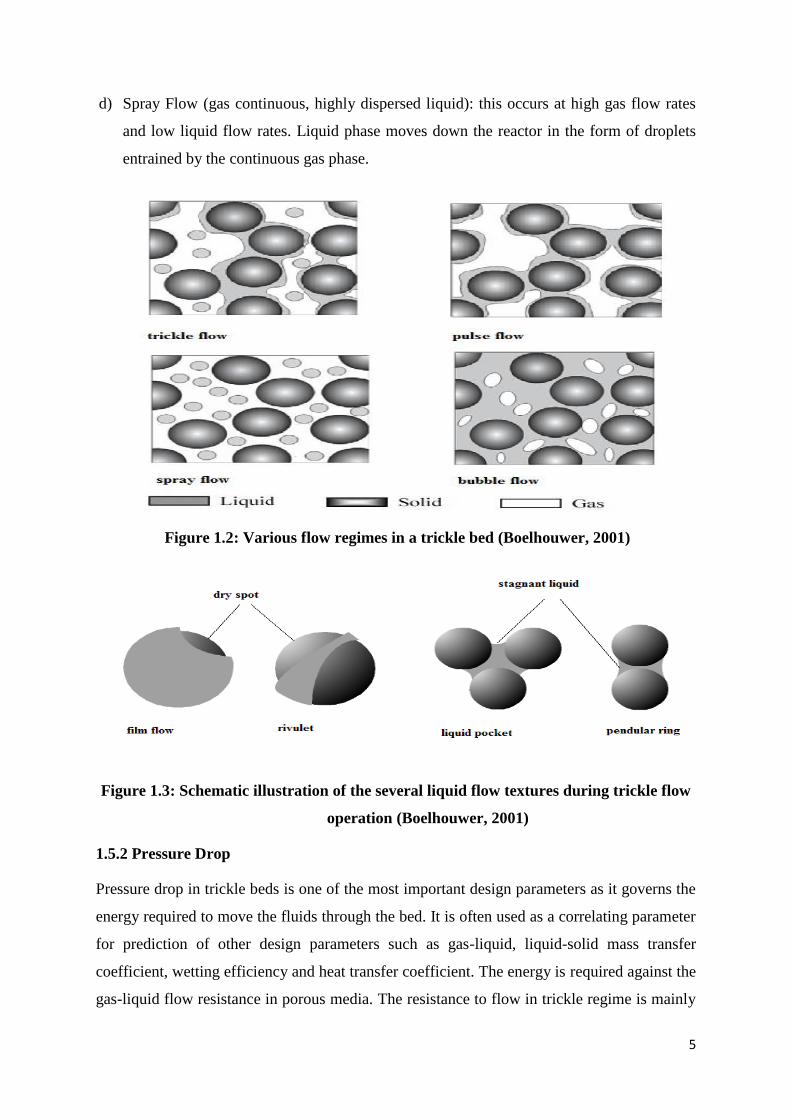
a) Trickle Flow (gas continuous): it occurs at low liquid and gas flow rates. Liquid flows
down the reactor on the surface of the packing in the form of rivulets and films while the
gas travels in the remaining void space. There is very little interaction between gas and
liquid in this regime.
b) Pulse Flow (unstable regime with partly gas continuous and partly liquid continuous): it
occurs at relatively high gas and liquid input flow rates. It refers to pulsing behaviour of
gas and liquid slugs traversing the reactor alternately. It is also called rippling or
slugging.
c) Dispersed Bubble Flow: this occurs at high liquid flow rate and low gas flow rates. Entire
bed is filled with the liquid and the gas phase is in the form of slightly elongated bubbles.
5
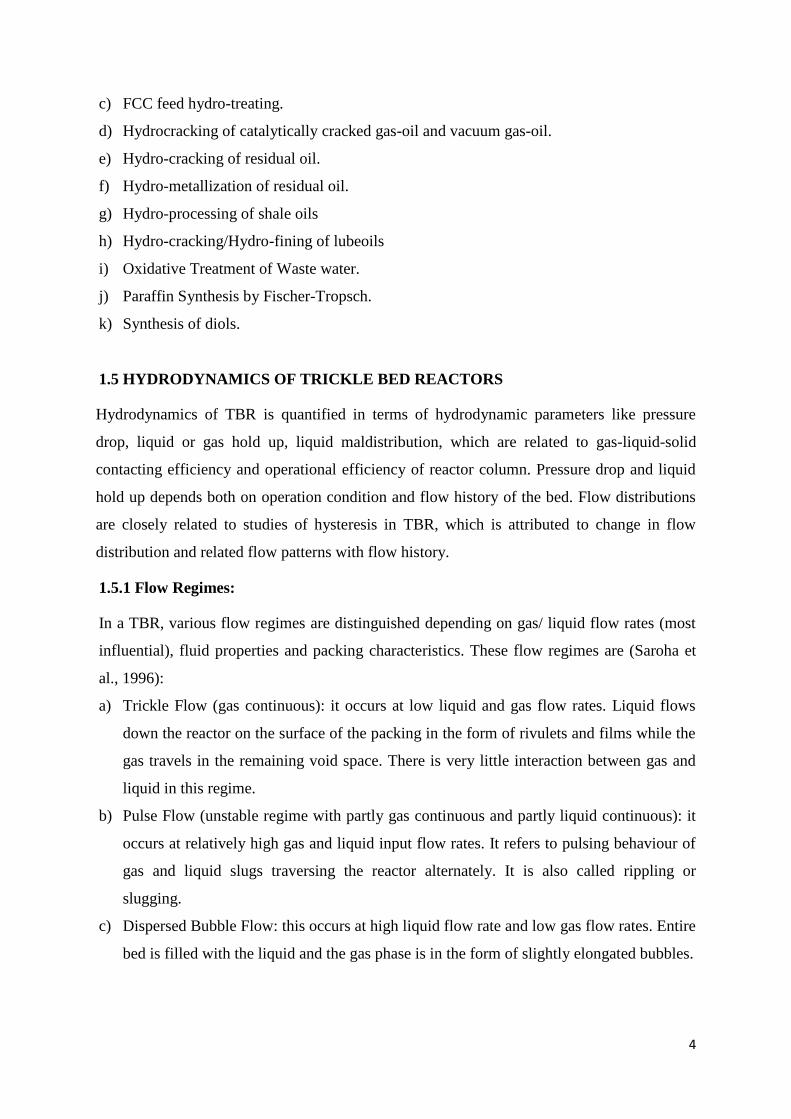
d) Spray Flow (gas continuous, highly dispersed liquid): this occurs at high gas flow rates
and low liquid flow rates. Liquid phase moves down the reactor in the form of droplets
entrained by the continuous gas phase.
Figure 1.2: Various flow regimes in a trickle bed (Boelhouwer, 2001)
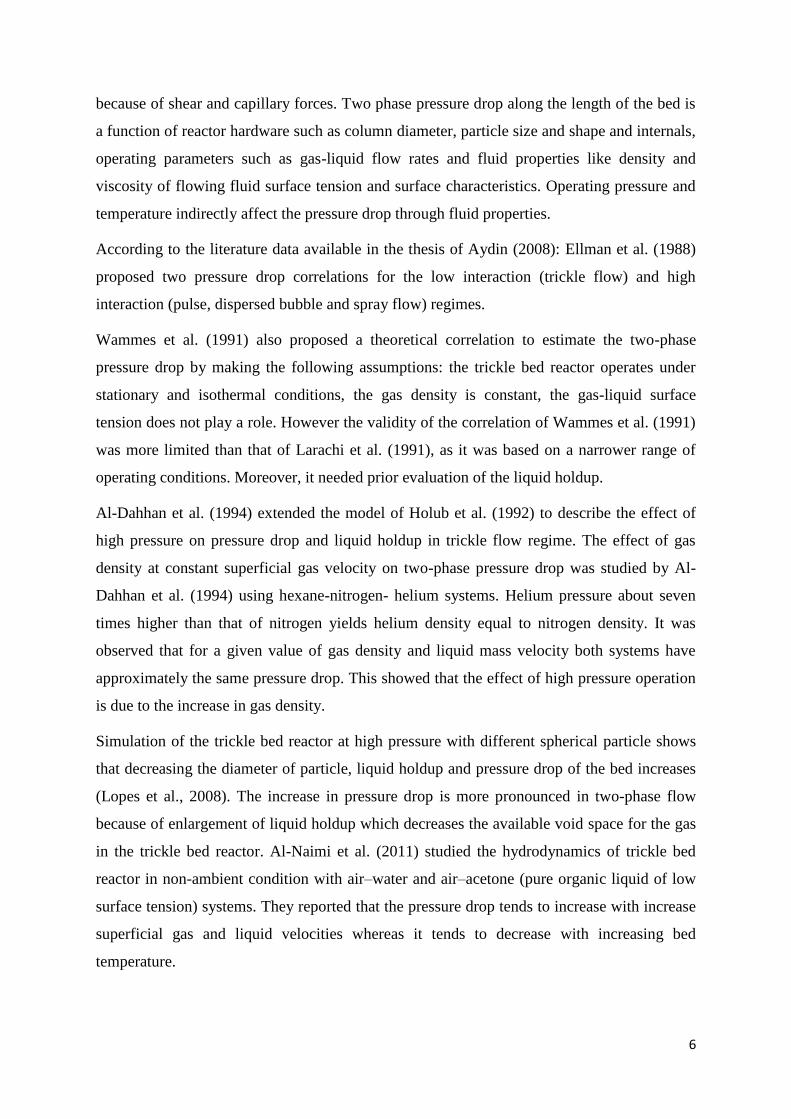
Figure 1.3: Schematic illustration of the several liquid flow textures during trickle flow
operation (Boelhouwer, 2001)
1.5.2 Pressure Drop
Pressure drop in trickle beds is one of the most important design parameters as it governs the
energy required to move the fluids through the bed. It is often used as a correlating parameter
for prediction of other design parameters such as gas-liquid, liquid-solid mass transfer
coefficient, wetting efficiency and heat transfer coefficient. The energy is required against the
gas-liquid flow resistance in porous media. The resistance to flow in trickle regime is mainly
6
because of shear and capillary forces. Two phase pressure drop along the length of the bed is
a function of reactor hardware such as column diameter, particle size and shape and internals,
operating parameters such as gas-liquid flow rates and fluid properties like density and
viscosity of flowing fluid surface tension and surface characteristics. Operating pressure and
temperature indirectly affect the pressure drop through fluid properties.
According to the literature data available in the thesis of Aydin (2008): Ellman et al. (1988)
proposed two pressure drop correlations for the low interaction (trickle flow) and high
interaction (pulse, dispersed bubble and spray flow) regimes.
Wammes et al. (1991) also proposed a theoretical correlation to estimate the two-phase
pressure drop by making the following assumptions: the trickle bed reactor operates under
stationary and isothermal conditions, the gas density is constant, the gas-liquid surface
tension does not play a role. However the validity of the correlation of Wammes et al. (1991)
was more limited than that of Larachi et al. (1991), as it was based on a narrower range of
operating conditions. Moreover, it needed prior evaluation of the liquid holdup.
Al-Dahhan et al. (1994) extended the model of Holub et al. (1992) to describe the effect of
high pressure on pressure drop and liquid holdup in trickle flow regime. The effect of gas
density at constant superficial gas velocity on two-phase pressure drop was studied by Al-
Dahhan et al. (1994) using hexane-nitrogen- helium systems. Helium pressure about seven
times higher than that of nitrogen yields helium density equal to nitrogen density. It was
observed that for a given value of gas density and liquid mass velocity both systems have
approximately the same pressure drop. This showed that the effect of high pressure operation
is due to the increase in gas density.
Simulation of the trickle bed reactor at high pressure with different spherical particle shows
that decreasing the diameter of particle, liquid holdup and pressure drop of the bed increases
(Lopes et al., 2008). The increase in pressure drop is more pronounced in two-phase flow
because of enlargement of liquid holdup which decreases the available void space for the gas
in the trickle bed reactor. Al-Naimi et al. (2011) studied the hydrodynamics of trickle bed
reactor in non-ambient condition with air–water and air–acetone (pure organic liquid of low
surface tension) systems. They reported that the pressure drop tends to increase with increase
superficial gas and liquid velocities whereas it tends to decrease with increasing bed
temperature.
7
Giri et al. (2014) have made an attempt to study the flow regime map in TBR with air-
Newtonian and air-non-Newtonian liquid systems, the influence of dynamic variables with
Newtonian and non-Newtonian liquid systems on pressure drop, analyze the pressure drop by
a mechanistic model and analyze the degree of pressure reduction in a trickle bed reactor. A
bed of height 0.6 m and diameter 0.08 m has been used having 3 mm diameter glass beads as
solid packing. Polyethylene oxide has been used as the pressure reducing agent. It is observed
that percentage of pressure drop reduction increases with increasing surfactant concentration.
However there is a critical concentration (30 ppm) above which no more reduction can be
obtained.
1.5.3 Liquid Holdup
Liquid holdup in trickle bed is expressed in two ways: total liquid holdup defined as volume
of liquid per unit bed volume and liquid saturation defined as volume of liquid per unit void
volume. Liquid holdup varies with reactor hardware such as column diameter, particle shape
and size and internals, operating parameters such as gas and liquid flow rates and physico-
chemical properties of fluids. It is considerably sensitive to particle diameter than bed
diameter due to higher specific area of solid particles for smaller sized particles which lead to
higher liquid phase retention and holdup.
Again from the thesis of Aydin (2008): Ellman et al. (1990) derived two correlations for
liquid holdup, one for the high and the other for the low interaction regimes. Wammes et al.
(1991) investigated static and non-capillary liquid holdups by the stop-flow technique and
bed drainage for the same operating conditions as used in the two-phase pressure drop
studies. They reported that liquid holdup decreased when the pressure was increased for
given gas and liquid superficial velocities. Such a decrease was interpreted as due to a shift in
the reactor fluid dynamics from a state predominantly controlled by gravity (trickle flow with
zero gas flow rate) to a state controlled by gas-liquid shear stress (or pressure drop). The
Specchia et al. (1977) correlation for the low interaction regime described correctly their two-
phase flow liquid holdup data.
Al-Dahhan et al. (1994) measured liquid holdups using the stop-flow technique and bed
drainage for the same conditions as for the pressure drops, i.e. trickle flow regime. Their high
pressure data were well described with the parameter-free phenomenological model of Holub
et al. (1992).
8
The experimental reported results of Larachi et al. (1991) confirm observations made by
Wammes et al. (1991), but over a wider range of operating conditions: at very low gas
velocities, the total liquid holdup is independent of pressure regardless of the type of gas-
liquid system. However for larger gas superficial velocities, the influence of pressure has to
be taken into account.
Moreover, Larachi et al. (1991) found that at given gas and liquid mass flow rates, the total
liquid holdup increases with pressure, owing to the lower superficial gas velocity as a
consequence of the increase in gas density. The total liquid holdup is reduced when the liquid
viscosity decreases. The total liquid holdup is much smaller for foaming liquids, regardless of
the operating pressure, owing to the high stability of fine gas bubbles adhering to the solid
particles.
In brief, the external liquid holdup is an increasing function of liquid velocity, viscosity and
particle diameter. It is a decreasing function of the gas superficial velocity and of the liquid
surface tension. Liquid holdup reduces as the gas density increases, except for very low gas
velocities, where it is insensitive to gas density. Non-coalescing liquids exhibit much smaller
holdups than coalescing liquids. Gas viscosity appears to have a marginal effect on the liquid
holdup.
1.5.4 CFD Prediction of Pressure Drop and Liquid Holdup
Gunjal et al. (2005) proposed an Euler–Euler CFD model to predict hydrodynamic
parameters in TBRs. Using this model, parametric analysis of the hysteresis phenomena in
pressure drop and liquid holdup was performed at various operating conditions. The CFD
model predictions were compared with three different data sets in the literature (Specchia and
Baldi, 1977; Rao et al., 1983; Szady and Sundaresan, 1991). The model predictions generally
showed good agreement with the experimental data on pressure drop and liquid saturation.
Aydin et al. (2005) carried out hydrodynamic measurements that concerned flow regime
changeover from trickle to pulse flow, two phase pressure drop, liquid holdup and liquid axial
dispersion coefficient using air as the process gas and water and 0.25% CMC solution
(inelastic pseudoplastic behaviour) as the process liquid. They observed that the transition
boundary was more distinct for air-CMC system and shifts to higher fluid velocity with
increasing temperature. Two phase pressure drop and liquid holdup values were higher for
air-CMC system as compared to air-water system due to higher viscosity and the values
9
decrease with increase in temperature. Thus both Newtonian and power law non-Newtonian
fluids behaved qualitatively similarly regarding the effect of temperature.
Iluita et al. (2006) analysed the transition between trickle and pulse flow regimes in trickle
bed reactor involving gas-non-Newtonian liquid system using a stability analysis of the
solution of a transient trickle bed, two-fluid hydrodynamic model around the equilibrium
state of trickle flow. Special solution for plastic Bingham, power law shear thinning and
thickening and Newtonian can be derived from this. They found that increasing temperature
and pressure promote pulse flow at increasing superficial liquid and gas velocity. Conversely
an increase in yield stress, flow consistency index or power law index was found to induce
pulse flow at lower liquid velocity.
Atta et al. (2007) developed a 2 phase Eulerian CFD model based on porous media concept
based on porous media concept to simulate gas-liquid flow through packed beds. The porous
media model is advantageous to handle gas-liquid interaction terms due to its ability to lump
the adjustable parameter as compared to conventional k-fluid CFD treatment of the problem.
The two phase Eulerian model describing the flow domain as a porous region has been used
to simulate the macroscale multiphase flow in trickle bed operating under trickle flow regime
using FLUENT 6.2 software. While being simple in structure, this CFD model is flexible and
predictive for large body of experimental data. They also developed a 3-D CFD simulation in
pilot scale TBR using porous media flow, for predicting the meso-scale liquid
maldistribution. Numerical simulation were carried out for air-water system with several
initial liquid distribution and over the liquid and gas superficial velocity range of 0.001-0.006
m/s and 0.02-0.154 m/s, respectively. It was found that for low liquid and gas velocity, the
details of particle wetting phenomenon seems to have more significant effect in case of large
diameter column rather than in a smaller diameter column. For higher velocity, better
accuracy is obtained.
Rodrigo et al. (2008) developed a 3-dimensional Euler-Euler model to study the
hydrodynamic behaviour of TBR at high pressure (30 bar) in terms of pressure drop and
liquid hold up. TBR operation was found to be more sensible to pressure drop than to liquid
hold up results when performing same deviation scale in the cell number. It is found that as
particle size of packing decreases, specific surface area of bed increases and therefore liquid
hold up and pressure drop also increases. Deviation of local velocity near solid surfaces were
observed which showed existence of stagnant zones near points of approximation retained
10
from the packing spheres which enables the unsteady state behaviour exhibited by TBR in
trickling flow condition.
1.6 SCOPE OF THE PRESENT WORK:
Aside from air and water, most of the fluids encountered in physical and industrial processes
are non-Newtonian. TBR with downward flow of gas and liquid have wide applications in the
petroleum and petrochemical industries. Many petroleum products like kerosene, naphtha,
diesel fuels and lubricating oils have foam forming tendency during processing and behave as
non-Newtonian fluid. Moreover TBR is also used in biochemical processes and the initial
liquid behaving like a Newtonian fluid could turn into a non-Newtonian fluid after various
biochemical processes. Hence it is essential to study TBR hydrodynamics with non-
Newtonian systems. Here CMC (carboxyl methyl cellulose) is used as the liquid phase, which
is a Non-Newtonian (pseudoplastic) fluid.
1.7 OBJECTIVE OF THE PRESENT WORK
The aim of the present work can be stated as follows:
a) To study the hydrodynamic parameters in a trickle bed reactor for air-CMC system.
b) To determine liquid holdup and pressure drop in a gas-liquid-solid cocurrent trickle bed
system.
c) To examine the effect of superficial liquid and gas velocity on the individual phase
holdup and pressure drop.
d) To study the variation of hydrodynamic properties with column height and also along the
radial direction.
The present work is concentrated on understanding the phase holdup and pressure drop
behaviours in a three phase Co-current Trickle bed. Trickle bed of height 0.6 m with diameter
of 0.08 m has been used having glass beads of diameter 3 mm as the solid packing. Gas (air)
is taken as the continuous phase. Liquid (CMC) and gas (air) are injected at the top with
different superficial velocities. In all the cases the solid (glass bead) volume fraction has been
taken to be 0.63. CFD simulations have been carried out using ANSYS FLUENT 13.0.
11
CHAPTER 2
CFD MODELING AND SIMULATION OF TRICKLE BED SYSTEM
CFD is a branch of fluid mechanics that uses numerical methods and algorithms to solve and
analyse problems that involve fluid flow. Computers are used to perform the calculations
required to simulate the interaction of liquids and gases with surface defined by boundary
conditions. The fundamental basis of almost all CFD problems are the Navier-Stokes
equation, which define any single phase fluid flow. These equations can be simplified by
removing terms describing viscous actions to yield the Euler equation. Vorticity terms can
then be removed to get full potential equations. They can be linearised to yield the linearised
potential equation. CFD is used in a variety of disciplines and industries, including
aerospace, automotive, power generation, chemical manufacturing, polymer processing,
petroleum exploration, pulp and paper operation, medical research, meteorology and
astrophysics.
2.1 CFD MODELING
2.1.1 ELEMENTS OF CFD CODES
All CFD codes consist of three main elements:
a) A pre-processor which is used to generate the grid, input the problem geometry, define
the flow parameters and the boundary conditions to the code.
b) A flow solver (for example: FLUENT, CFX, POLYFLOW, etc.) which is used to solve
the governing equations of the flow subject to the conditions provided. There are four
different methods used as a flow solver: finite difference method, finite element method,
finite volume method and spectral method.
c) A post processor which is used to interpret the data and show the results in graphical and
easy to read format.
2.1.2 ADVANTAGES OF CFD
The main advantages of CFD include:
1. CFD is very much helpful in cases when it is not possible to design a working model and
test its performance.
12
2. There is no size and scale restriction in CFD simulation. So it avoids pilot scale simulation
and the difficulties of upgrading pilot scale plant to large scale plant.
3. It provides the much needed flexibility in changing design parameters without the expense
of onsite changes.
4. It gives results faster as compared to the practical experiment.
5. It reduces the cost of experiment very effectively by allowing changes to variable
parameter such as flow rates, temperature.
2.1.3 MULTPHASE FLOW: Eulerian Model
In the Euler-Euler approach, the different phases are treated mathematically as
interpenetrating continua. Since the volume of a phase cannot be occupied by the other
phases, the concept of phase volume fraction is introduced. These volume fractions are
assumed to be continuous functions of space and time and their sum is equal to one.
Conservation equations for each phase are derived to obtain a set of equations, which have
similar structure for all phases. These equations are closed by providing constitutive relations
that are obtained from empirical information, or, in the case of granular flows, by application
of kinetic theory. In ANSYS FLUENT, three different Euler-Euler multiphase models are
available: the volume of fluid (VOF) model, the mixture model, and the Eulerian model. In
the present work, the Eulerian model has been used for carrying out the simulations.
The Eulerian model is the most complex of the multiphase models in ANSYS FLUENT. It
solves a set of n momentum and continuity equations for each phase. Coupling is achieved
through the pressure and interphase exchange coefficients. The manner in which this
coupling is handled depends upon the type of phases involved; granular (fluid-solid) flows
are handled differently than non-granular (fluid-fluid) flows. For granular flows, the
properties are obtained from application of kinetic theory. Momentum exchange between the
phases is also dependent upon the type of mixture being modeled. ANSYS FLUENT’s user-
defined functions allow you to customize the calculation of the momentum exchange.
Applications of the Eulerian multiphase model include bubble columns, risers, particle
suspension, and fluidized beds.
13
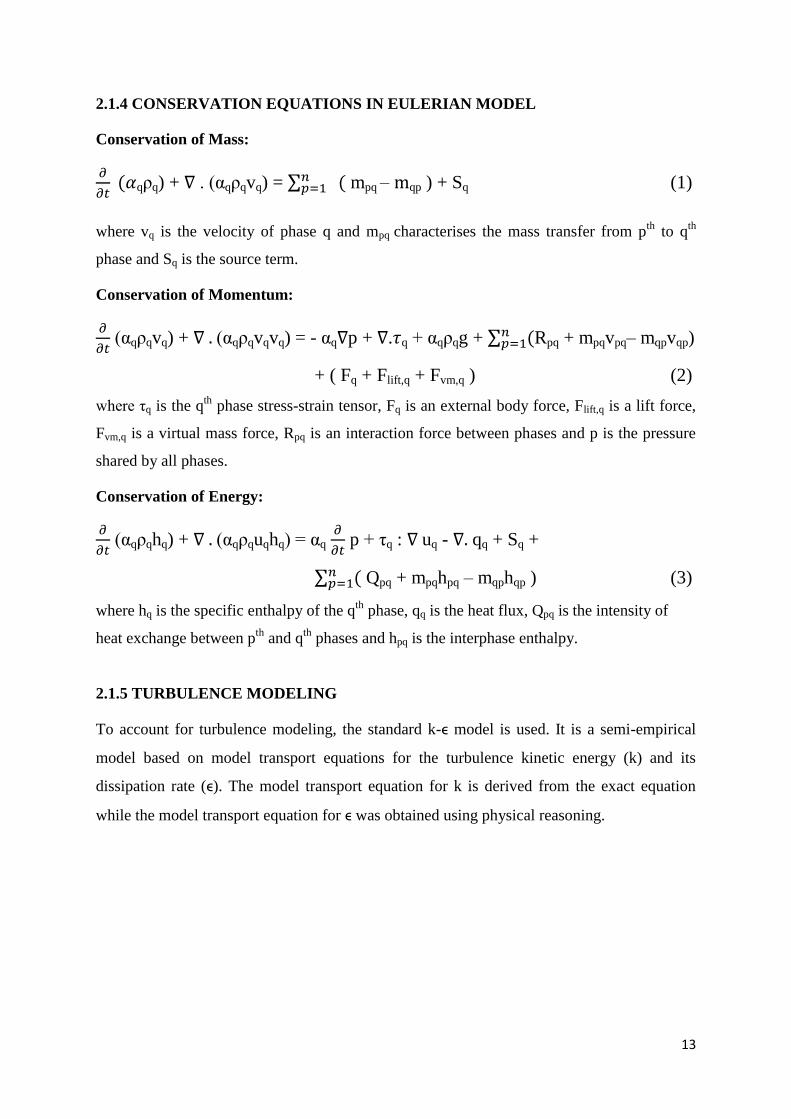
2.1.4 CONSERVATION EQUATIONS IN EULERIAN MODEL
Conservation of Mass:
qρq) + . (αqρqvq) = ∑
mpq – mqp ) + Sq (1)
where vq is the velocity of phase q and mpq characterises the mass transfer from pth
to qth
phase and Sq is the source term.
Conservation of Momentum:
(αqρqvq) + (αqρqvqvq) = - αq p + . q + αqρqg + ∑
Rpq + mpqvpq– mqpvqp)
+ ( Fq + Flift,q + Fvm,q ) (2)
where τq is the qth
phase stress-strain tensor, Fq is an external body force, Flift,q is a lift force,
Fvm,q is a virtual mass force, Rpq is an interaction force between phases and p is the pressure
shared by all phases.
Conservation of Energy:
(αqρqhq) + (αqρquqhq) = αq
p + τq : uq - qq + Sq +
∑ Qpq + mpqhpq – mqphqp ) (3)
where hq is the specific enthalpy of the qth
phase, qq is the heat flux, Qpq is the intensity of
heat exchange between pth
and qth
phases and hpq is the interphase enthalpy.
2.1.5 TURBULENCE MODELING
To account for turbulence modeling, the standard k-ϵ model is used. It is a semi-empirical
model based on model transport equations for the turbulence kinetic energy (k) and its
dissipation rate (ϵ). The model transport equation for k is derived from the exact equation
while the model transport equation for ϵ was obtained using physical reasoning.
14
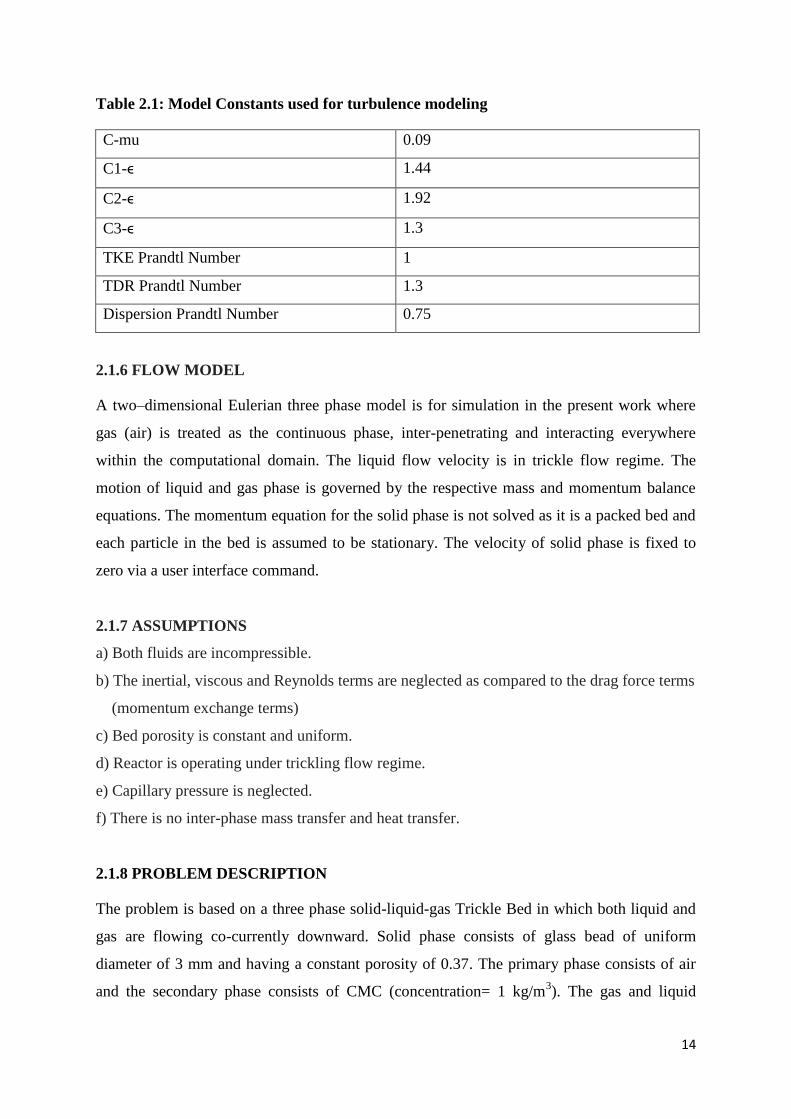
Table 2.1: Model Constants used for turbulence modeling
C-mu 0.09
C1-ϵ 1.44
C2-ϵ 1.92
C3-ϵ 1.3
TKE Prandtl Number 1
TDR Prandtl Number 1.3
Dispersion Prandtl Number 0.75
2.1.6 FLOW MODEL
A two–dimensional Eulerian three phase model is for simulation in the present work where
gas (air) is treated as the continuous phase, inter-penetrating and interacting everywhere
within the computational domain. The liquid flow velocity is in trickle flow regime. The
motion of liquid and gas phase is governed by the respective mass and momentum balance
equations. The momentum equation for the solid phase is not solved as it is a packed bed and
each particle in the bed is assumed to be stationary. The velocity of solid phase is fixed to
zero via a user interface command.
2.1.7 ASSUMPTIONS
a) Both fluids are incompressible.
b) The inertial, viscous and Reynolds terms are neglected as compared to the drag force terms
(momentum exchange terms)
c) Bed porosity is constant and uniform.
d) Reactor is operating under trickling flow regime.
e) Capillary pressure is neglected.
f) There is no inter-phase mass transfer and heat transfer.
2.1.8 PROBLEM DESCRIPTION
The problem is based on a three phase solid-liquid-gas Trickle Bed in which both liquid and
gas are flowing co-currently downward. Solid phase consists of glass bead of uniform
diameter of 3 mm and having a constant porosity of 0.37. The primary phase consists of air
and the secondary phase consists of CMC (concentration= 1 kg/m3). The gas and liquid
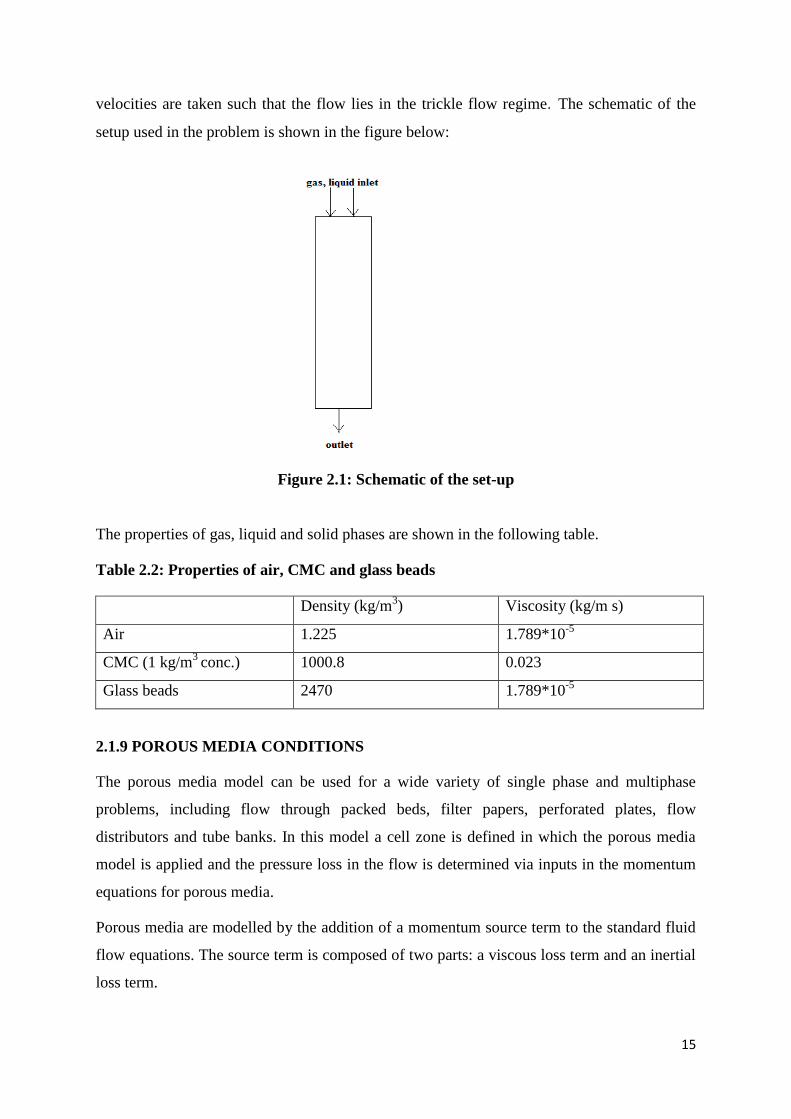
15
velocities are taken such that the flow lies in the trickle flow regime. The schematic of the
setup used in the problem is shown in the figure below:
Figure 2.1: Schematic of the set-up
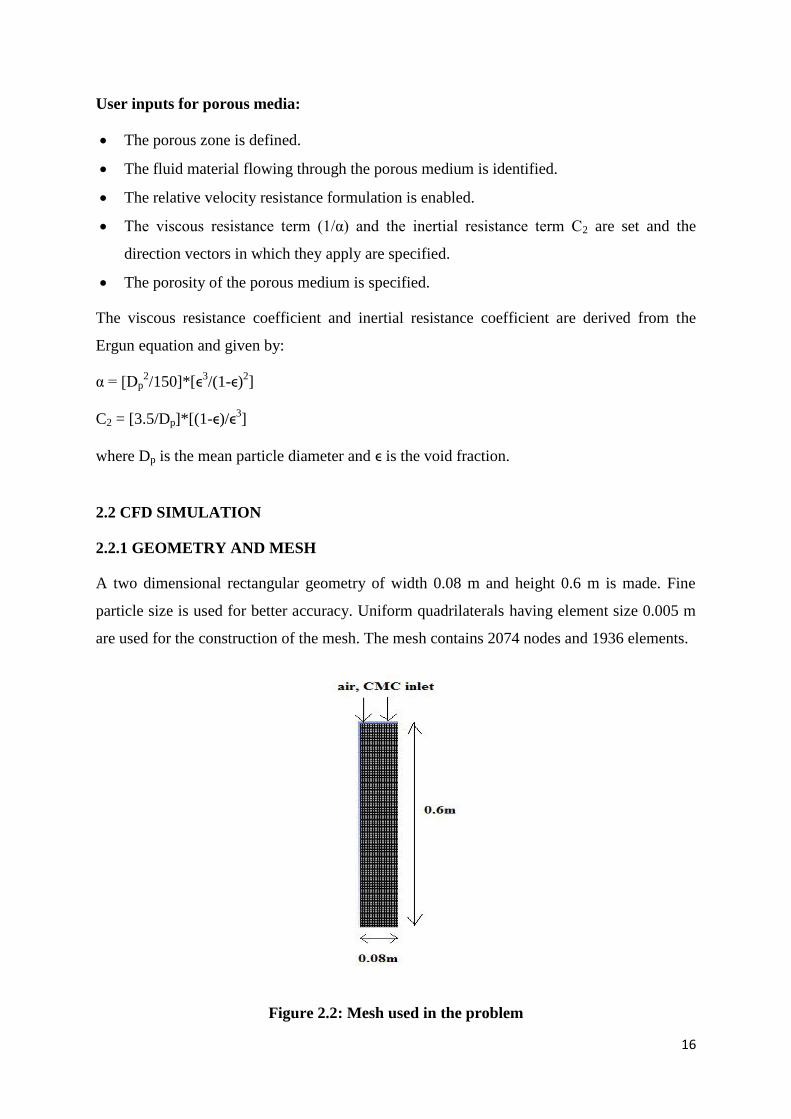
The properties of gas, liquid and solid phases are shown in the following table.
Table 2.2: Properties of air, CMC and glass beads
Density (kg/m3) Viscosity (kg/m s)
Air 1.225 1.789*10-5
CMC (1 kg/m3
conc.) 1000.8 0.023
Glass beads 2470 1.789*10-5
2.1.9 POROUS MEDIA CONDITIONS
The porous media model can be used for a wide variety of single phase and multiphase
problems, including flow through packed beds, filter papers, perforated plates, flow
distributors and tube banks. In this model a cell zone is defined in which the porous media
model is applied and the pressure loss in the flow is determined via inputs in the momentum
equations for porous media.
Porous media are modelled by the addition of a momentum source term to the standard fluid
flow equations. The source term is composed of two parts: a viscous loss term and an inertial
loss term.
16
User inputs for porous media:
The porous zone is defined.
The fluid material flowing through the porous medium is identified.
The relative velocity resistance formulation is enabled.
The viscous resistance term (1/α) and the inertial resistance term C2 are set and the
direction vectors in which they apply are specified.
The porosity of the porous medium is specified.
The viscous resistance coefficient and inertial resistance coefficient are derived from the
Ergun equation and given by:
α = [Dp2/150]*[ϵ3
/(1-ϵ)2]
C2 = [3.5/Dp]*[(1-ϵ)/ϵ3]
where Dp is the mean particle diameter and ϵ is the void fraction.
2.2 CFD SIMULATION
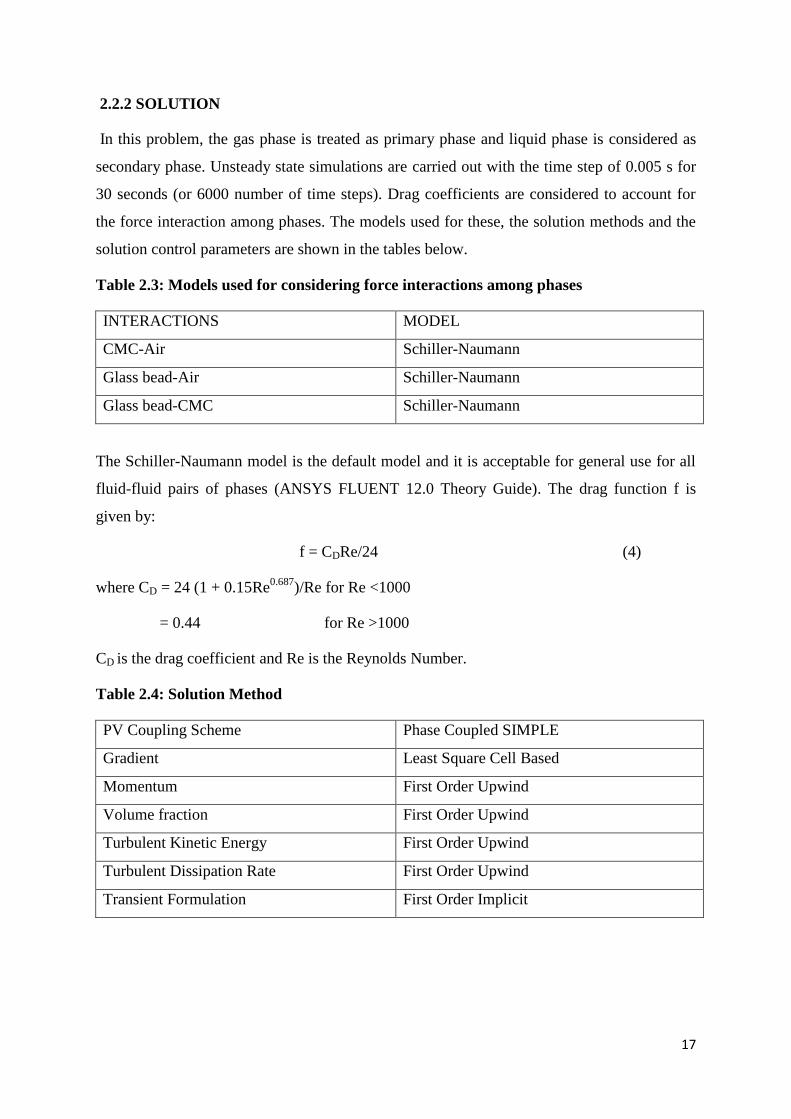
2.2.1 GEOMETRY AND MESH
A two dimensional rectangular geometry of width 0.08 m and height 0.6 m is made. Fine
particle size is used for better accuracy. Uniform quadrilaterals having element size 0.005 m
are used for the construction of the mesh. The mesh contains 2074 nodes and 1936 elements.
Figure 2.2: Mesh used in the problem
17
2.2.2 SOLUTION
In this problem, the gas phase is treated as primary phase and liquid phase is considered as
secondary phase. Unsteady state simulations are carried out with the time step of 0.005 s for
30 seconds (or 6000 number of time steps). Drag coefficients are considered to account for
the force interaction among phases. The models used for these, the solution methods and the
solution control parameters are shown in the tables below.
Table 2.3: Models used for considering force interactions among phases
INTERACTIONS MODEL
CMC-Air Schiller-Naumann
Glass bead-Air Schiller-Naumann
Glass bead-CMC Schiller-Naumann
The Schiller-Naumann model is the default model and it is acceptable for general use for all
fluid-fluid pairs of phases (ANSYS FLUENT 12.0 Theory Guide). The drag function f is
given by:
f = CDRe/24 (4)
where CD = 24 (1 + 0.15Re0.687
)/Re for Re <1000
= 0.44 for Re >1000
CD is the drag coefficient and Re is the Reynolds Number.
Table 2.4: Solution Method
PV Coupling Scheme Phase Coupled SIMPLE
Gradient Least Square Cell Based
Momentum First Order Upwind
Volume fraction First Order Upwind
Turbulent Kinetic Energy First Order Upwind
Turbulent Dissipation Rate First Order Upwind
Transient Formulation First Order Implicit
18
Table 2.5: Solution Control Parameters
Pressure 0.3
Density 1.0
Body Forces 1.0
Momentum 0.7
Volume Fraction 0.5
Turbulent Kinetic Energy 0.8
Turbulent Dissipation Rate 0.8
Turbulent Viscosity 1.0
2.2.3 CELL ZONE CONDITIONS AND BOUNDARY CONDITIONS:
The cell zone (interior of the body) is defined as fluid, through which the gas-liquid mixture
flows. Porosity is specified to be 0.37 which remains constant throughout. For the gas and
liquid phases, source terms in the form of viscous and inertial resistance terms are specified
as described in section 2.1.9. Inlet boundary conditions are specified in terms of inlet velocity
of air and CMC and the volume fraction of CMC. At the outlet, the gauge pressure is
specified to zero by default. No slip boundary condition for the wall is specified.
19
CHAPTER 3
RESULTS AND DISCUSSIONS
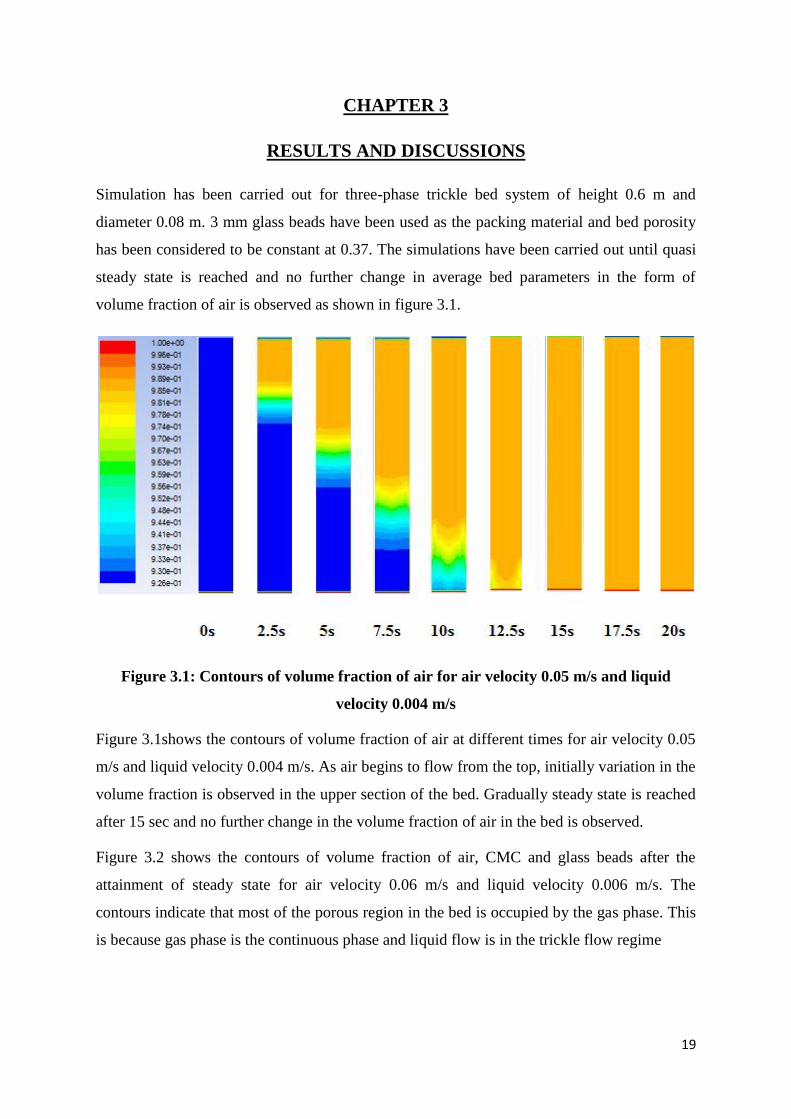
Simulation has been carried out for three-phase trickle bed system of height 0.6 m and
diameter 0.08 m. 3 mm glass beads have been used as the packing material and bed porosity
has been considered to be constant at 0.37. The simulations have been carried out until quasi
steady state is reached and no further change in average bed parameters in the form of
volume fraction of air is observed as shown in figure 3.1.
Figure 3.1: Contours of volume fraction of air for air velocity 0.05 m/s and liquid
velocity 0.004 m/s
Figure 3.1shows the contours of volume fraction of air at different times for air velocity 0.05
m/s and liquid velocity 0.004 m/s. As air begins to flow from the top, initially variation in the
volume fraction is observed in the upper section of the bed. Gradually steady state is reached
after 15 sec and no further change in the volume fraction of air in the bed is observed.
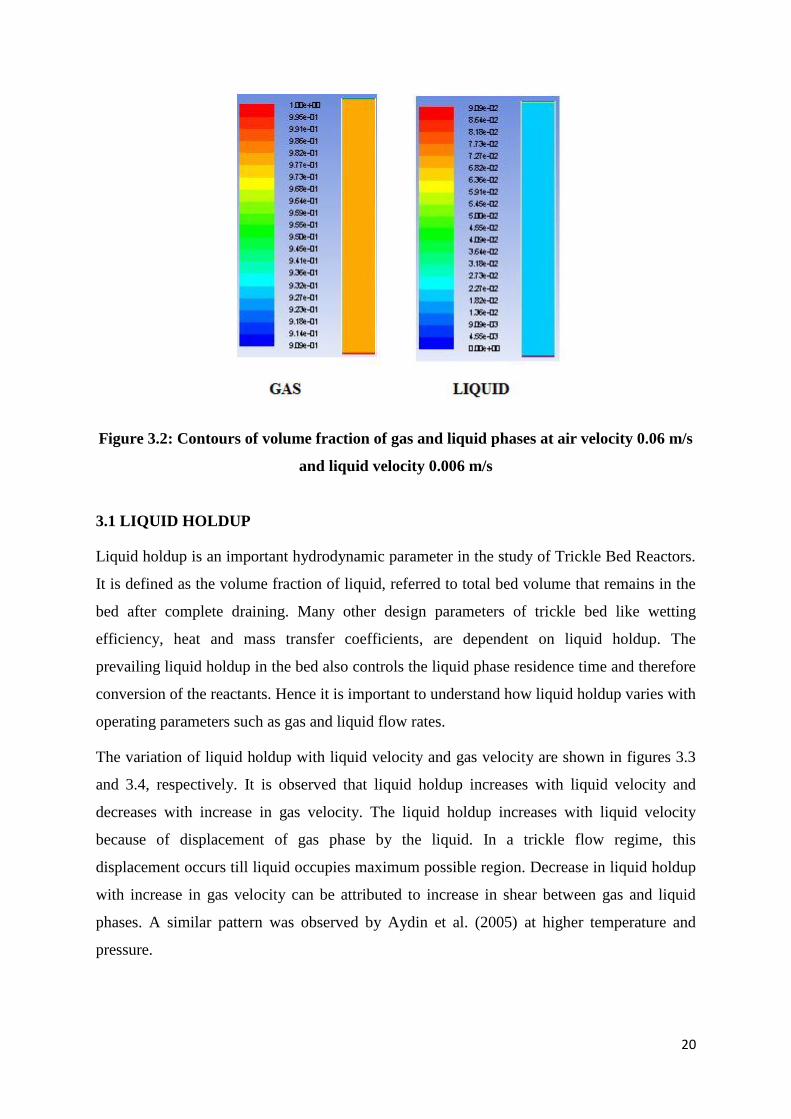
Figure 3.2 shows the contours of volume fraction of air, CMC and glass beads after the
attainment of steady state for air velocity 0.06 m/s and liquid velocity 0.006 m/s. The
contours indicate that most of the porous region in the bed is occupied by the gas phase. This
is because gas phase is the continuous phase and liquid flow is in the trickle flow regime
20
Figure 3.2: Contours of volume fraction of gas and liquid phases at air velocity 0.06 m/s
and liquid velocity 0.006 m/s
3.1 LIQUID HOLDUP
Liquid holdup is an important hydrodynamic parameter in the study of Trickle Bed Reactors.
It is defined as the volume fraction of liquid, referred to total bed volume that remains in the
bed after complete draining. Many other design parameters of trickle bed like wetting
efficiency, heat and mass transfer coefficients, are dependent on liquid holdup. The
prevailing liquid holdup in the bed also controls the liquid phase residence time and therefore
conversion of the reactants. Hence it is important to understand how liquid holdup varies with
operating parameters such as gas and liquid flow rates.
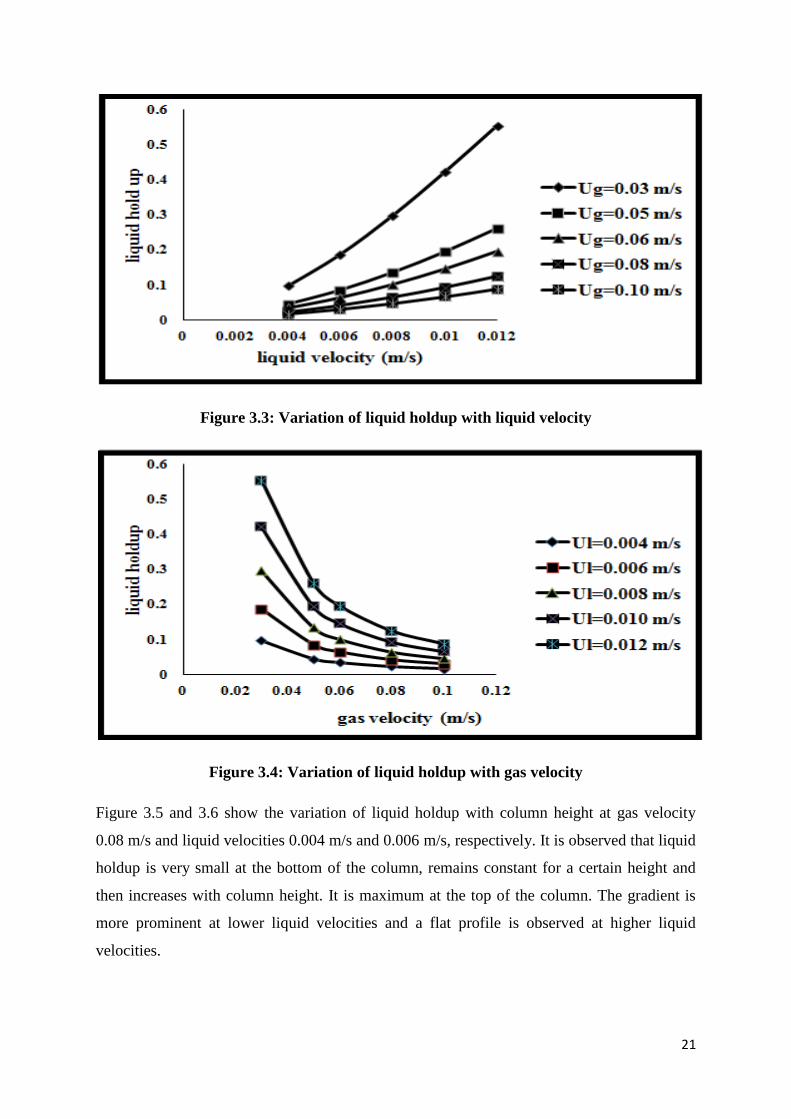
The variation of liquid holdup with liquid velocity and gas velocity are shown in figures 3.3
and 3.4, respectively. It is observed that liquid holdup increases with liquid velocity and
decreases with increase in gas velocity. The liquid holdup increases with liquid velocity
because of displacement of gas phase by the liquid. In a trickle flow regime, this
displacement occurs till liquid occupies maximum possible region. Decrease in liquid holdup
with increase in gas velocity can be attributed to increase in shear between gas and liquid
phases. A similar pattern was observed by Aydin et al. (2005) at higher temperature and
pressure.
21
Figure 3.3: Variation of liquid holdup with liquid velocity
Figure 3.4: Variation of liquid holdup with gas velocity
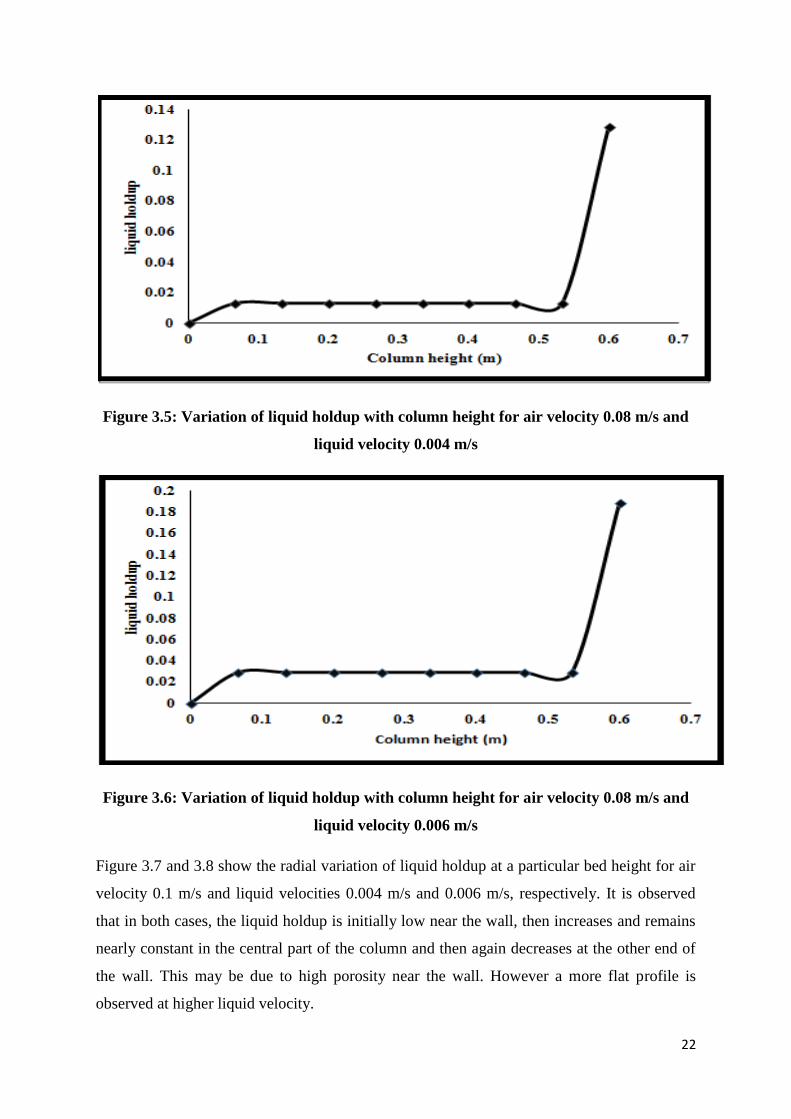
Figure 3.5 and 3.6 show the variation of liquid holdup with column height at gas velocity
0.08 m/s and liquid velocities 0.004 m/s and 0.006 m/s, respectively. It is observed that liquid
holdup is very small at the bottom of the column, remains constant for a certain height and
then increases with column height. It is maximum at the top of the column. The gradient is
more prominent at lower liquid velocities and a flat profile is observed at higher liquid
velocities.
22
Figure 3.5: Variation of liquid holdup with column height for air velocity 0.08 m/s and
liquid velocity 0.004 m/s
Figure 3.6: Variation of liquid holdup with column height for air velocity 0.08 m/s and
liquid velocity 0.006 m/s
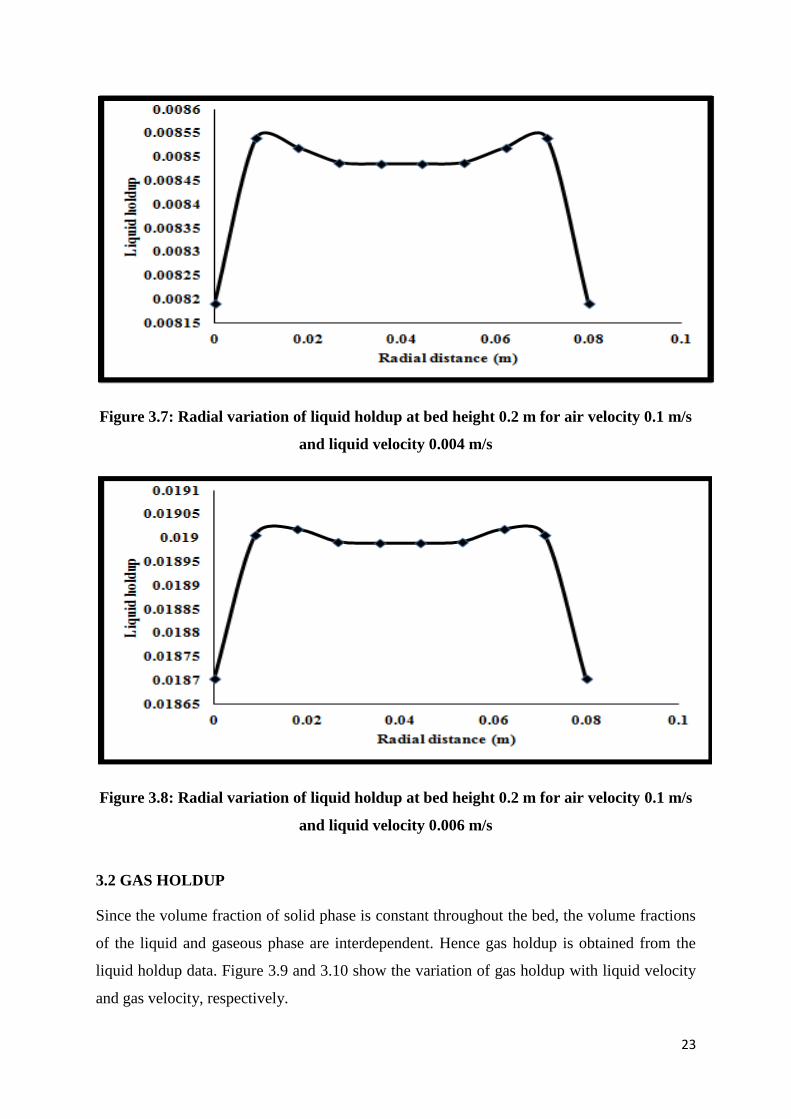
Figure 3.7 and 3.8 show the radial variation of liquid holdup at a particular bed height for air
velocity 0.1 m/s and liquid velocities 0.004 m/s and 0.006 m/s, respectively. It is observed
that in both cases, the liquid holdup is initially low near the wall, then increases and remains
nearly constant in the central part of the column and then again decreases at the other end of
the wall. This may be due to high porosity near the wall. However a more flat profile is
observed at higher liquid velocity.
23
Figure 3.7: Radial variation of liquid holdup at bed height 0.2 m for air velocity 0.1 m/s
and liquid velocity 0.004 m/s
Figure 3.8: Radial variation of liquid holdup at bed height 0.2 m for air velocity 0.1 m/s
and liquid velocity 0.006 m/s
3.2 GAS HOLDUP
Since the volume fraction of solid phase is constant throughout the bed, the volume fractions
of the liquid and gaseous phase are interdependent. Hence gas holdup is obtained from the
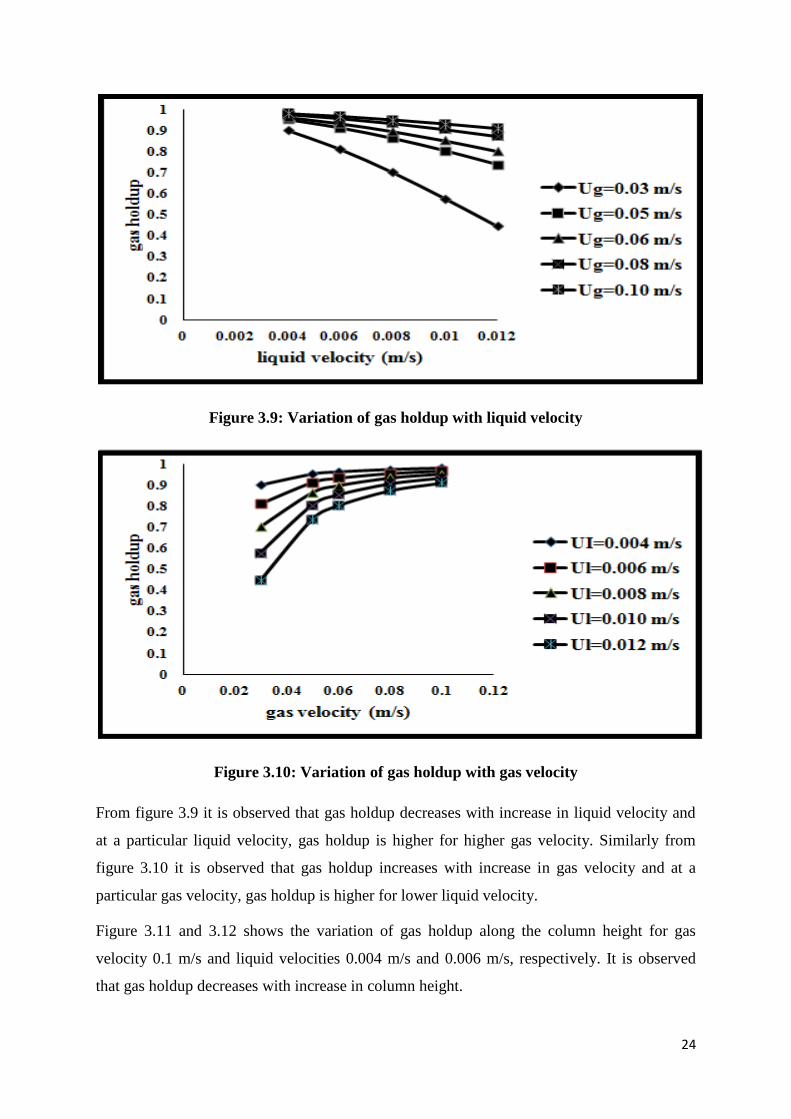
liquid holdup data. Figure 3.9 and 3.10 show the variation of gas holdup with liquid velocity
and gas velocity, respectively.
24
Figure 3.9: Variation of gas holdup with liquid velocity
Figure 3.10: Variation of gas holdup with gas velocity
From figure 3.9 it is observed that gas holdup decreases with increase in liquid velocity and
at a particular liquid velocity, gas holdup is higher for higher gas velocity. Similarly from
figure 3.10 it is observed that gas holdup increases with increase in gas velocity and at a
particular gas velocity, gas holdup is higher for lower liquid velocity.
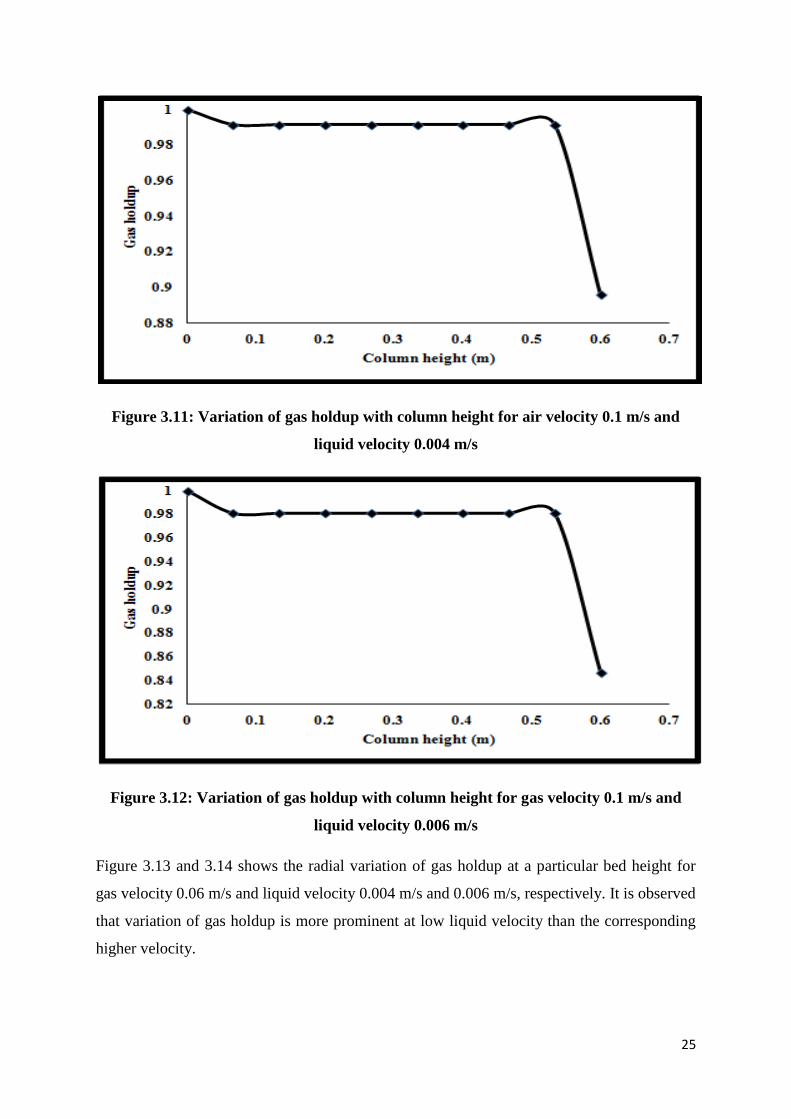
Figure 3.11 and 3.12 shows the variation of gas holdup along the column height for gas
velocity 0.1 m/s and liquid velocities 0.004 m/s and 0.006 m/s, respectively. It is observed
that gas holdup decreases with increase in column height.
25
Figure 3.11: Variation of gas holdup with column height for air velocity 0.1 m/s and
liquid velocity 0.004 m/s
Figure 3.12: Variation of gas holdup with column height for gas velocity 0.1 m/s and
liquid velocity 0.006 m/s
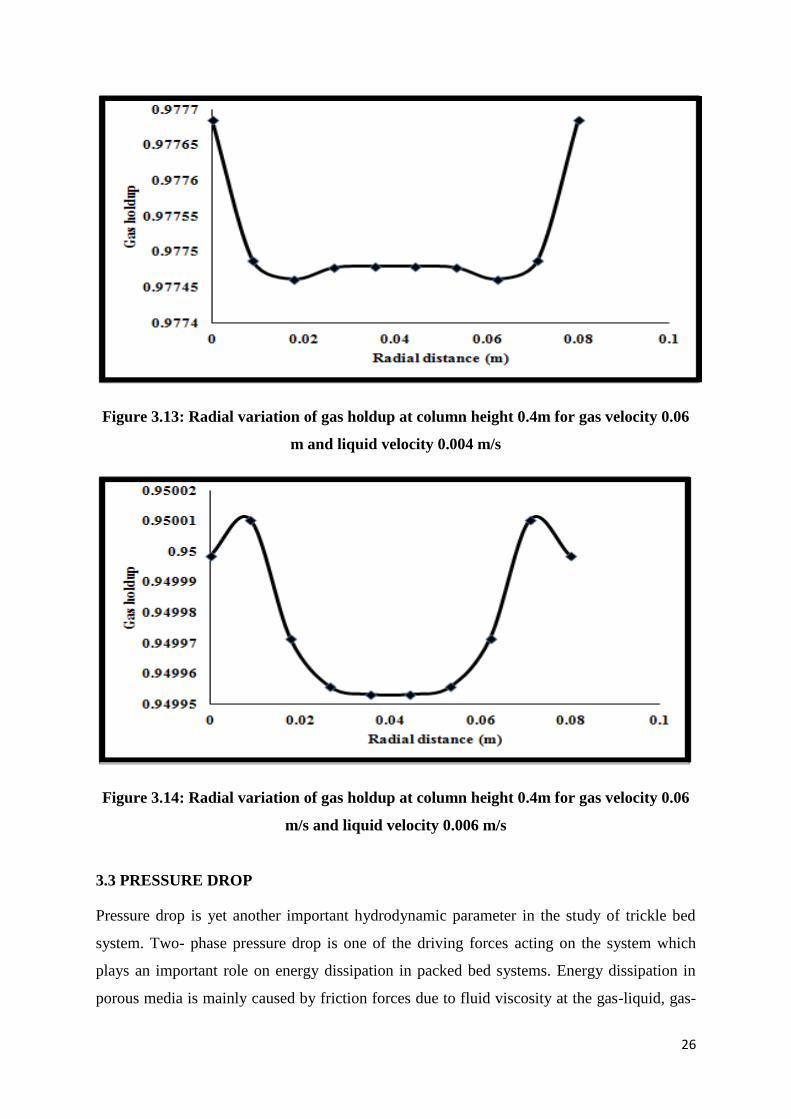
Figure 3.13 and 3.14 shows the radial variation of gas holdup at a particular bed height for
gas velocity 0.06 m/s and liquid velocity 0.004 m/s and 0.006 m/s, respectively. It is observed
that variation of gas holdup is more prominent at low liquid velocity than the corresponding
higher velocity.
26
Figure 3.13: Radial variation of gas holdup at column height 0.4m for gas velocity 0.06
m and liquid velocity 0.004 m/s
Figure 3.14: Radial variation of gas holdup at column height 0.4m for gas velocity 0.06
m/s and liquid velocity 0.006 m/s
3.3 PRESSURE DROP
Pressure drop is yet another important hydrodynamic parameter in the study of trickle bed
system. Two- phase pressure drop is one of the driving forces acting on the system which
plays an important role on energy dissipation in packed bed systems. Energy dissipation in
porous media is mainly caused by friction forces due to fluid viscosity at the gas-liquid, gas-
27
solid and liquid-solid interfaces. In the trickling regime, the resistance to flow is essentially
controlled by shear and capillary forces. The liquid and gas phase experience pressure in
trickle bed because of friction at the gas-liquid, liquid-solid and solid-gas interfaces. The
pressure is more for liquid of high surface tension and high solid-liquid interaction. Figures
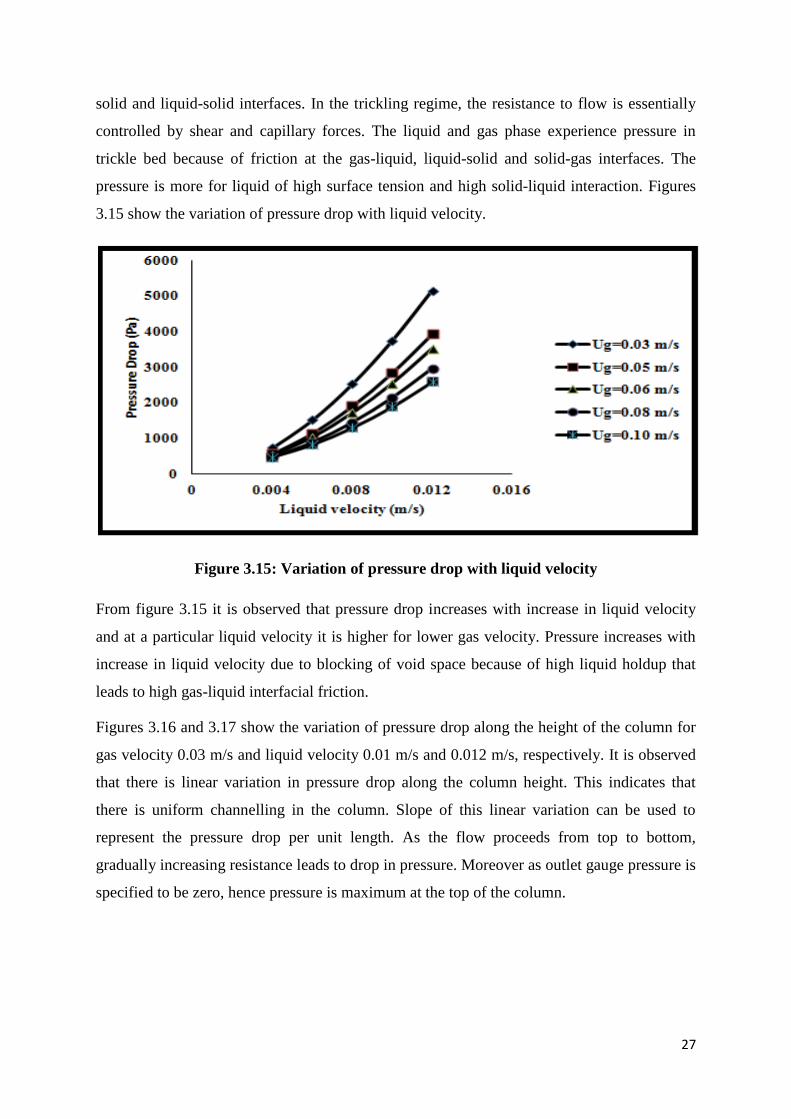
3.15 show the variation of pressure drop with liquid velocity.
Figure 3.15: Variation of pressure drop with liquid velocity
From figure 3.15 it is observed that pressure drop increases with increase in liquid velocity
and at a particular liquid velocity it is higher for lower gas velocity. Pressure increases with
increase in liquid velocity due to blocking of void space because of high liquid holdup that
leads to high gas-liquid interfacial friction.
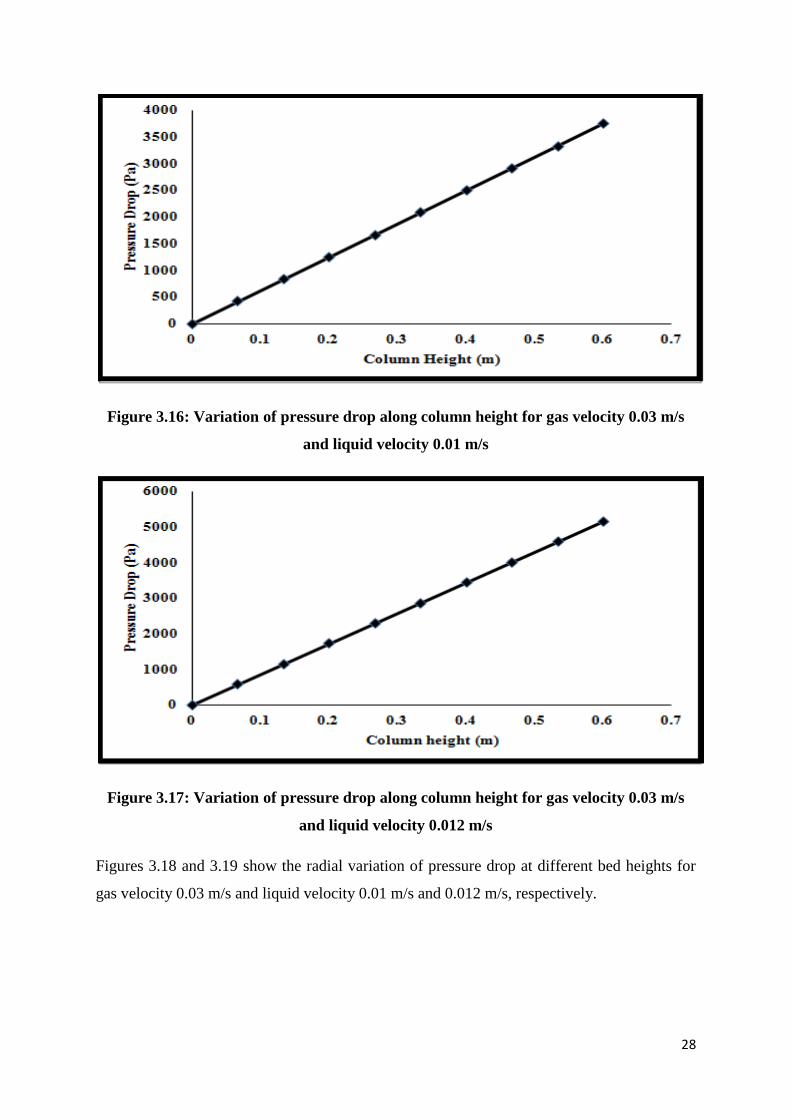
Figures 3.16 and 3.17 show the variation of pressure drop along the height of the column for
gas velocity 0.03 m/s and liquid velocity 0.01 m/s and 0.012 m/s, respectively. It is observed
that there is linear variation in pressure drop along the column height. This indicates that
there is uniform channelling in the column. Slope of this linear variation can be used to
represent the pressure drop per unit length. As the flow proceeds from top to bottom,
gradually increasing resistance leads to drop in pressure. Moreover as outlet gauge pressure is
specified to be zero, hence pressure is maximum at the top of the column.
28
Figure 3.16: Variation of pressure drop along column height for gas velocity 0.03 m/s
and liquid velocity 0.01 m/s
Figure 3.17: Variation of pressure drop along column height for gas velocity 0.03 m/s
and liquid velocity 0.012 m/s
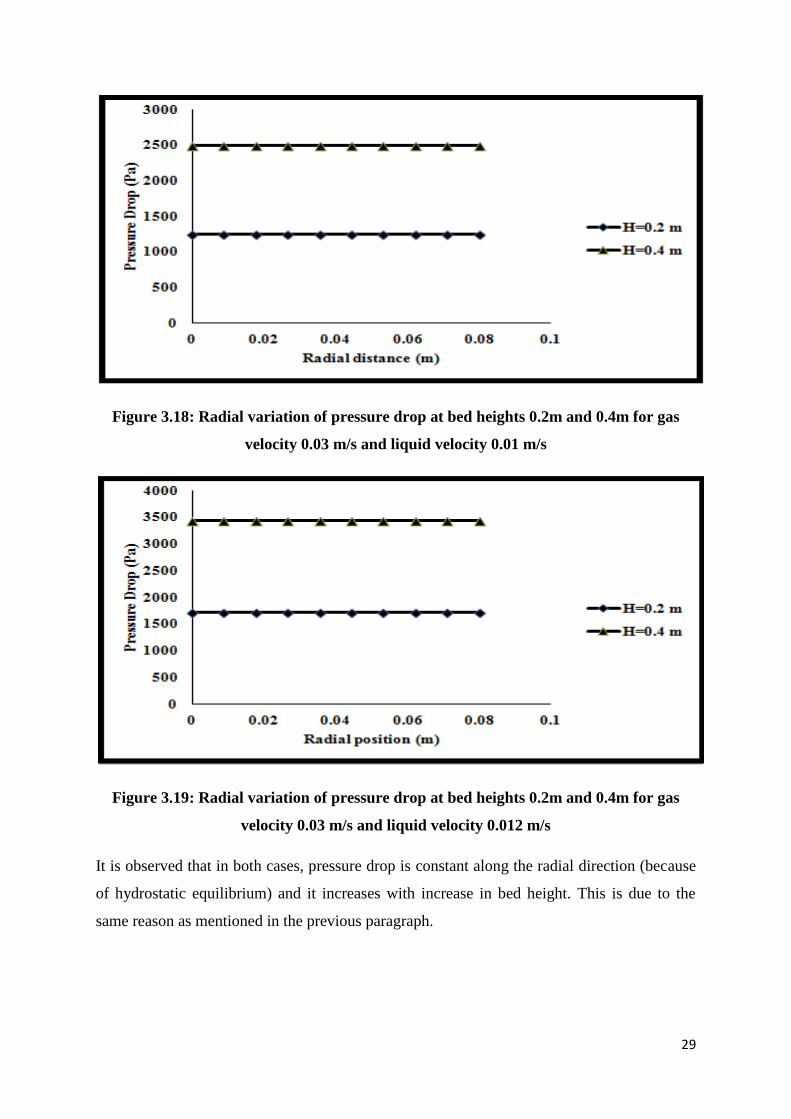
Figures 3.18 and 3.19 show the radial variation of pressure drop at different bed heights for
gas velocity 0.03 m/s and liquid velocity 0.01 m/s and 0.012 m/s, respectively.
29
Figure 3.18: Radial variation of pressure drop at bed heights 0.2m and 0.4m for gas
velocity 0.03 m/s and liquid velocity 0.01 m/s
Figure 3.19: Radial variation of pressure drop at bed heights 0.2m and 0.4m for gas
velocity 0.03 m/s and liquid velocity 0.012 m/s
It is observed that in both cases, pressure drop is constant along the radial direction (because
of hydrostatic equilibrium) and it increases with increase in bed height. This is due to the
same reason as mentioned in the previous paragraph.
30
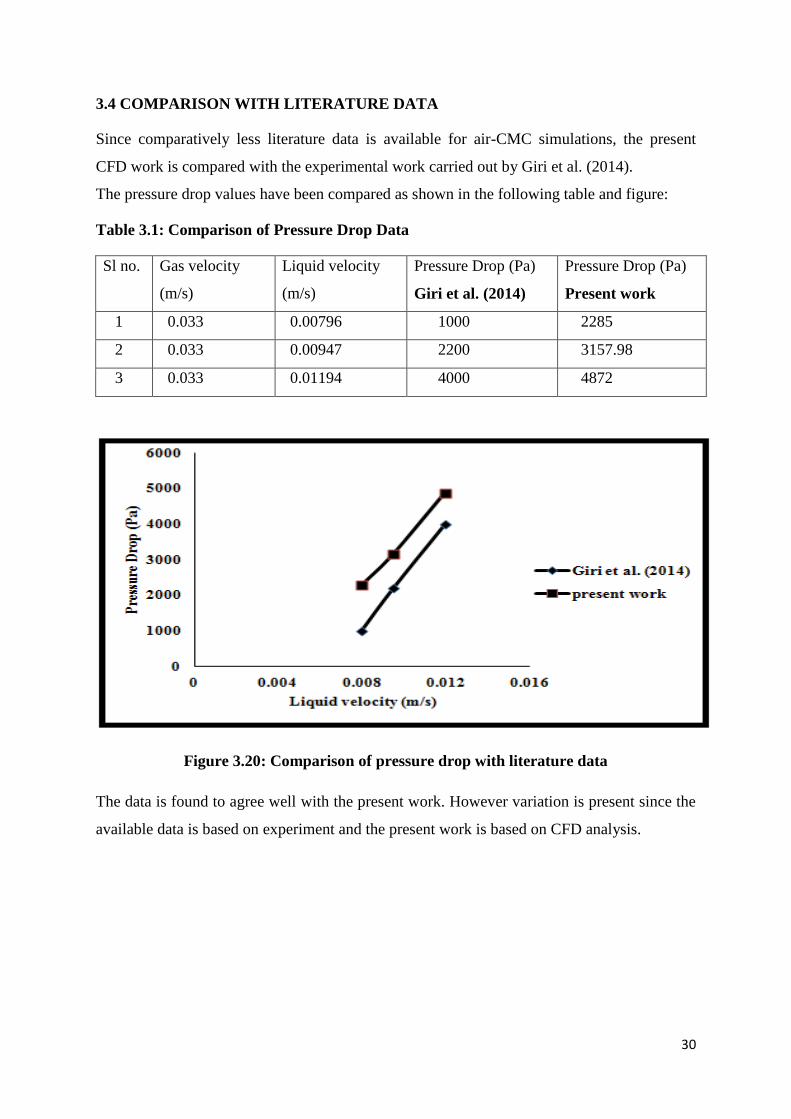
3.4 COMPARISON WITH LITERATURE DATA
Since comparatively less literature data is available for air-CMC simulations, the present
CFD work is compared with the experimental work carried out by Giri et al. (2014).
The pressure drop values have been compared as shown in the following table and figure:
Table 3.1: Comparison of Pressure Drop Data
Sl no. Gas velocity
(m/s)
Liquid velocity
(m/s)
Pressure Drop (Pa)
Giri et al. (2014)
Pressure Drop (Pa)
Present work
1 0.033 0.00796 1000 2285
2 0.033 0.00947 2200 3157.98
3 0.033 0.01194 4000 4872
Figure 3.20: Comparison of pressure drop with literature data
The data is found to agree well with the present work. However variation is present since the
available data is based on experiment and the present work is based on CFD analysis.
31
CHAPTER 4
CONCLUSIONS
CFD simulations of three phase trickle-bed reactor have been carried out by using Eulerian-
Eulerian approach for different flow conditions. Air, CMC and glass beads are used as the
gas, liquid and solid phase, respectively. Important hydrodynamic parameters such as
pressure drop, liquid holdup and gas holdup have been studied. The results obtained are
represented in graphical form and analysed.
The main conclusions that can be drawn are:
Liquid holdup increases with increase in liquid velocity and decreases with increase in
gas velocity.
Liquid holdup is very small at the bottom of the column, remains constant for a certain
height and then increases with column height. It is maximum at the top of the column.
The gradient is more prominent at lower liquid velocities and a flat profile is observed at
higher liquid velocities.
The radial variation of liquid holdup is somewhat parabolic in nature. It is relatively
lower near the walls and remains constant in the central region of the column.
Gas holdup increases with increase in gas velocity and decreases with increase in liquid
velocity.
Gas holdup decreases with increase in column height and radial variation of gas holdup
is more prominent at low liquid velocity than the corresponding higher velocity.
Pressure drop increases with increase in liquid velocity and decreases with increase in
gas velocity.
There is linear variation of pressure drop along the column height which indicates that
there is uniform channeling. Slope of this linear variation can be used to represent the
pressure drop per unit length.
Pressure drop is constant along the radial direction and it increases with increase in bed
height.
The results obtained from simulations have been compared with the experimental data as
obtained from the work of Giri et al. (2014) and there is a close agreement between the
two.
32
Scope for Future Work
In the present work, CFD simulations have been carried out for air-CMC system at ambient
conditions. However, high temperature and pressure conditions are encountered in most
industrial processes. Hence simulations can be carried out at higher operating conditions for
better understanding of the performance of trickle bed reactors. Moreover bed porosity has
been considered to be constant and uniform throughout. Simulations can be done to study the
effect of porosity distribution on hydrodynamic parameters such as pressure drop and phase
holdup. Effect of change of packing material and particle size on various hydrodynamic
properties can also be analysed.
33
REFERENCES
Al-Dahhan, M.H., Dudukovic, M.P., 1994. Pressure drop and liquid holdup in high pressure
trickle bed reactors. Chemical Engineering Science 49, 5681-5698.
Al-Naimi, S.A., Al-Sudani, F.T.J., Halabia, E.K., 2011. Hydrodynamics and flow regime
transition study of trickle bed reactor at elevated temperature and pressure. Chemical
Engineering Research and Design 89, 930–939.
Ansys Fluent 13.0 User’s Guide, USA 2010, 221-233.
Atta, A., Roy, S., Nigam, K.D.P., 2007. Prediction of pressure drop and liquid holdup in
trickle bed reactor using relative permeability concept in CFD. Chemical Engineering
Science 59, 5870-5879.
Atta, A., Roy, S., Nigam, K.D.P., 2007. Investigation of liquid maldistribution in trickle bed
reactors using porous media concept in CFD. Chemical Engineering Science 62, 7033-7044.
Aydin, B., 2008. Hydrodynamics in a trickle bed reactor, Steady and Non steady-State
Operations. PhD thesis.
Aydin, B., Larachi, F., 2005. Trickle Bed Hydrodynamics and flow regime transition at
elevated temperature for a Newtonian and non-Newtonian fluid. Chemical Engineering
Science 60, 6687-6701.
Boelhouwer, J.G., Piepers, H.W., Drinkenburg, A.A.H., 2002. Nature and Characteristics of
pulsing flow in trickle bed reactors. Chemical Engineering Science 57, 4865-4876.
Ellman, M.J., Midoux, N., Laurent, A., Charpentier, J.C., 1988. A new, improved pressure
drop correlation for trickle bed reactors. Chemical Engineering Science 43, 2201-2206.
Ellman, M.J., Midoux, N., Wild, G., Laurent, A., Charpentier, J.C., 1990. A new, improved
liquid holdup correlation for trickle bed reactors, Chemical Engineering Science 45, 1677.
34
Giri, A.K., Majumder, S.K., 2014. Pressure drop and its reduction of gas non-Newtonian
liquid flow in downflow trickle bed reactor (DTBR). Chemical Engineering Research and
Design 92, 34-42.
Gunjal, P.R., Kashid, M.N., Ranade, V.V., Chaudhari, R.V., 2005. Hydrodynamics of trickle
bed reactors: Experiment and CFD modelling. Ind. Eng. Chem. Res. 44, 6278-6294.
Holub, R.A., Dudukovic, M.P., Ramachandran, P.A., 1992. Phenomenological Model of
Pressure Drop, Liquid Holdup and Flow Regime Transition in Gas-Liquid Trickle Flow,
Chemical Engineering Science 47, 2343-2348.
Iliuta, I., Aydin, B., Larachi, F., 2006. Onset of pulsing in Trickle Beds with non-Newtonian
liquid at elevated temperature and pressure-Modeling and Experimental verification.
Chemical Engineering Science 61, 526-537.
Boelhouwer, J.G., 2001. Nonsteady operation of trickle-bed reactors: hydrodynamics, mass
and heat transfer, Eindhoven : Technische Universiteit Eindhoven. 24-30.
Larachi, F., Laurent, A., Midoux, N., Wild, G., 1991. Experimental Study of a Trickle Bed
Reactor Operating at High Pressure: Two-Phase Pressure Drop and Liquid Saturation.
Chemical Engineering Science 46, 1233-1246.
Meher, B.B., 2011. Hydrodynamic Characteristic Study of a three phase co-current Trickle
Bed Reactor: CFD Analysis, B.Tech Thesis, NIT Rourkela.
Multiphase Flows: ANSYS FLUENT 12.0, Theory Guide, April 2009.
Lopes, J.G.L., Quinta-Ferreira, R.M., 2008. Three Dimensional numerical simulation of
pressure drop and liquid holdup for high pressure Trickle Bed Reactor. Chemical Engineering
Science 145, 112-120.
Sai, S.T., Krishna, R., 1998. Scale up and scale down of trickle bed processes. Rev. Chem.
Eng. 14, 203-252.
35
Saroha, A.K., Nigam, K.D.P., 1996. Trickle Bed Reactors, Department Of Chemical
Engineering, IIT Delhi, India.
Soudania, A., Latifi, M.A., 2001. Analysis of two phase flow distribution in trickle bed
reactor, Chemical Engineering Science 56, 5977-5985.
Specchia, V., Baldi, G., 1977. Pressure drop and liquid holdup for two-phase concurrent
flow in packed beds. Chemical Engineering Science 32, 515-523.
Wammes, W.J.A., Middekamp, J., Huisman, W.J., Debaas, C.M., Westerterp, K.R., 1991.
Hydrodynamics in a cocurrent gas-liquid trickle bed at elevated pressures, Part 2: liquid
holdup, pressure drop, flow regimes. AIChE J. 37, 1855-1868.
Wammes, W.J.A., Mechielsen, S.J., Westerterp, K.R., 1991. The Influence of Pressure on
the Liquid Holdup in a Cocurrent Gas-Liquid Trickle Bed Reactor Operating at Low Gas
Velocities. Chemical Engineering Science 46, 409-417.
Wang, Y., Chen, J., Larachi, F., 2013. Modeling and Simulation of Trickle Bed Reactors
using CFD, A State-of-the-Art Review, The Canadian Journal of Chemical Engineering 91,
150-168.