Embed Size (px)
Citation preview
CFD Analysis for ITER FW/Shield Designs
Alice Ying, Ryan Hunt, Hongjie Zhang (UCLA)Dennis Youchison James Bullock,
Mike Ulrickson (SNL)
July 8, 2009MIT, Boston
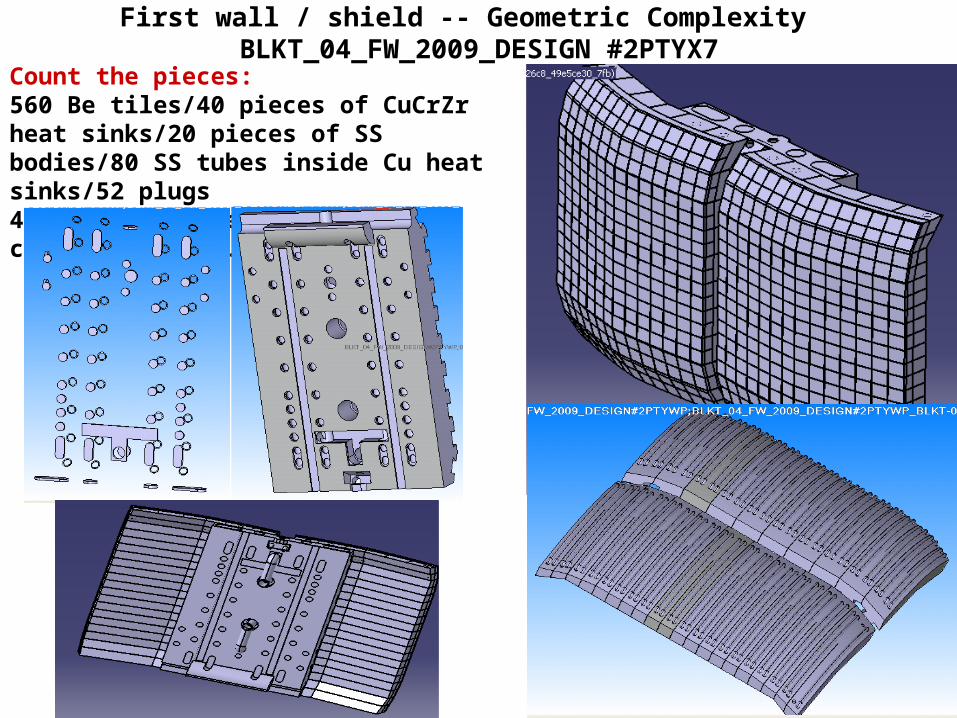
Count the pieces: 560 Be tiles/40 pieces of CuCrZr heat sinks/20 pieces of SS bodies/80 SS tubes inside Cu heat sinks/52 plugs40 welding pieces/Manifold, connectors, etc.
First wall / shield -- Geometric Complexity BLKT_04_FW_2009_DESIGN #2PTYX7
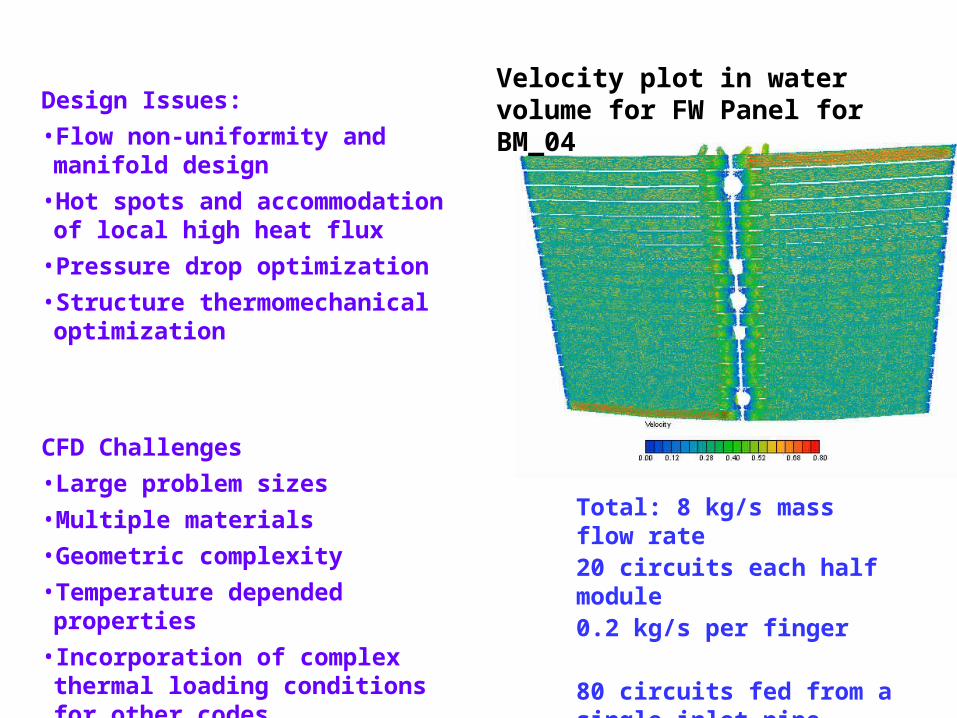
Total: 8 kg/s mass flow rate20 circuits each half module 0.2 kg/s per finger
80 circuits fed from a single inlet pipe
Velocity plot in water volume for FW Panel for BM_04 Design Issues:
• Flow non-uniformity and manifold design
• Hot spots and accommodation of local high heat flux
• Pressure drop optimization
• Structure thermomechanical optimization
CFD Challenges
• Large problem sizes
• Multiple materials
• Geometric complexity
• Temperature depended properties
• Incorporation of complex thermal loading conditions for other codes
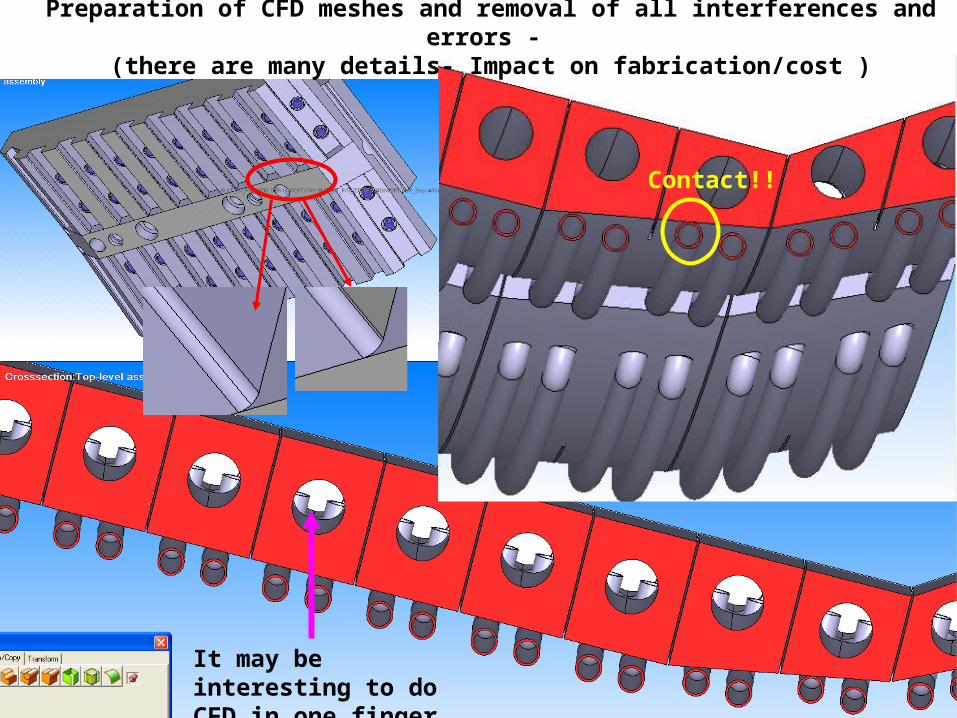
Contact!!
It may be interesting to do CFD in one finger.
Preparation of CFD meshes and removal of all interferences and errors - (there are many details- Impact on fabrication/cost )
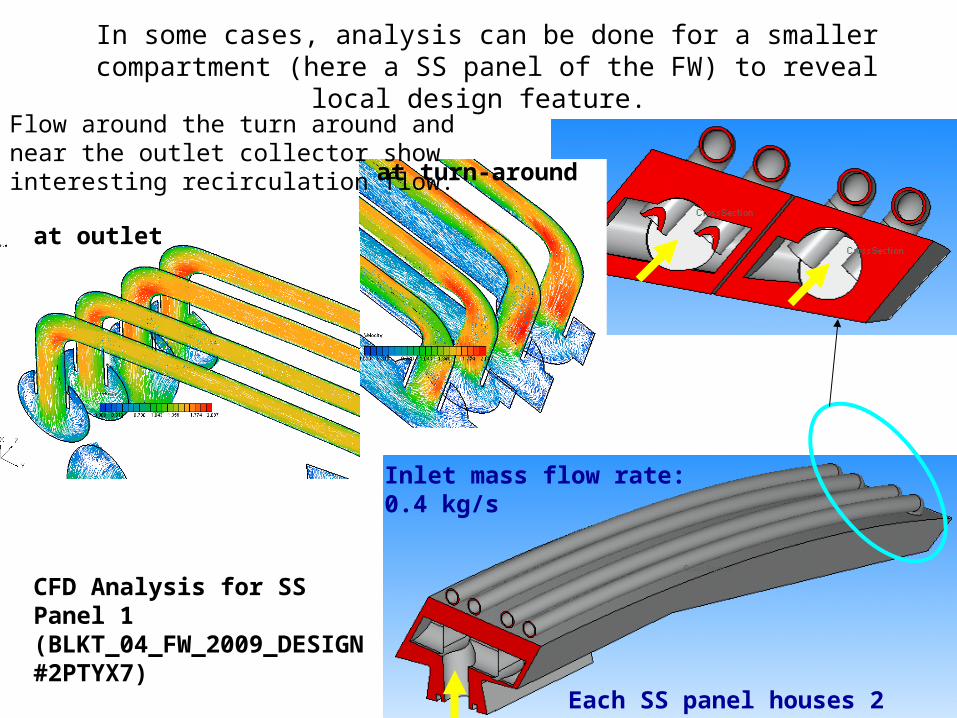
In some cases, analysis can be done for a smaller compartment (here a SS panel of the FW) to reveal local design feature.
at outlet
at turn-around
Each SS panel houses 2 fingers
Inlet mass flow rate: 0.4 kg/s
CFD Analysis for SS Panel 1 (BLKT_04_FW_2009_DESIGN #2PTYX7)
Flow around the turn around and near the outlet collector show interesting recirculation flow.
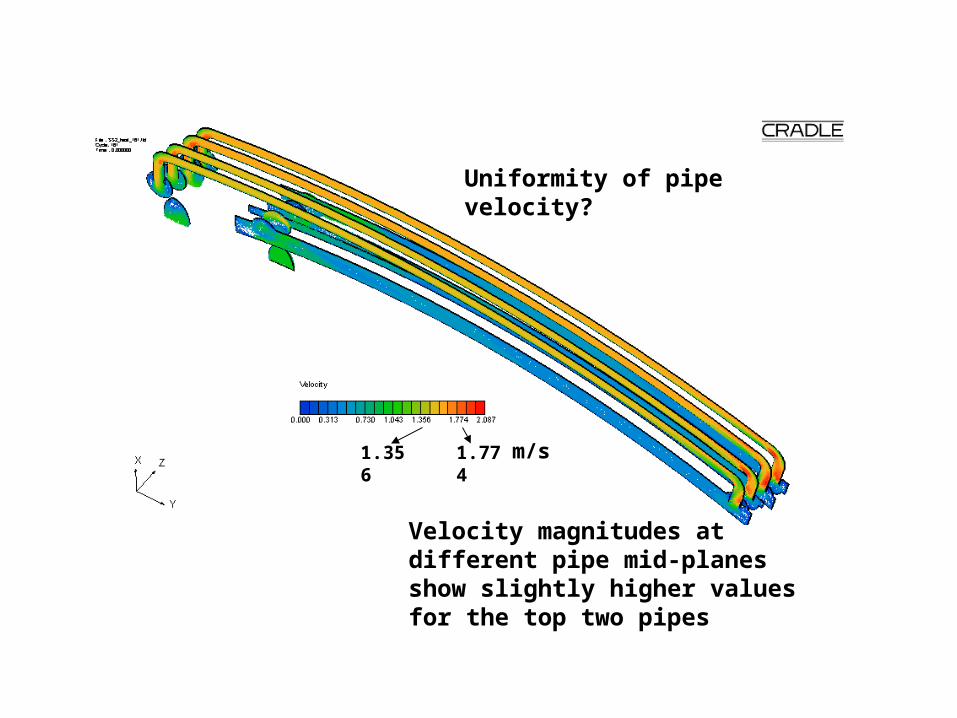
Velocity magnitudes at different pipe mid-planes show slightly higher values for the top two pipes
1.7741.356 m/s
Uniformity of pipe velocity?
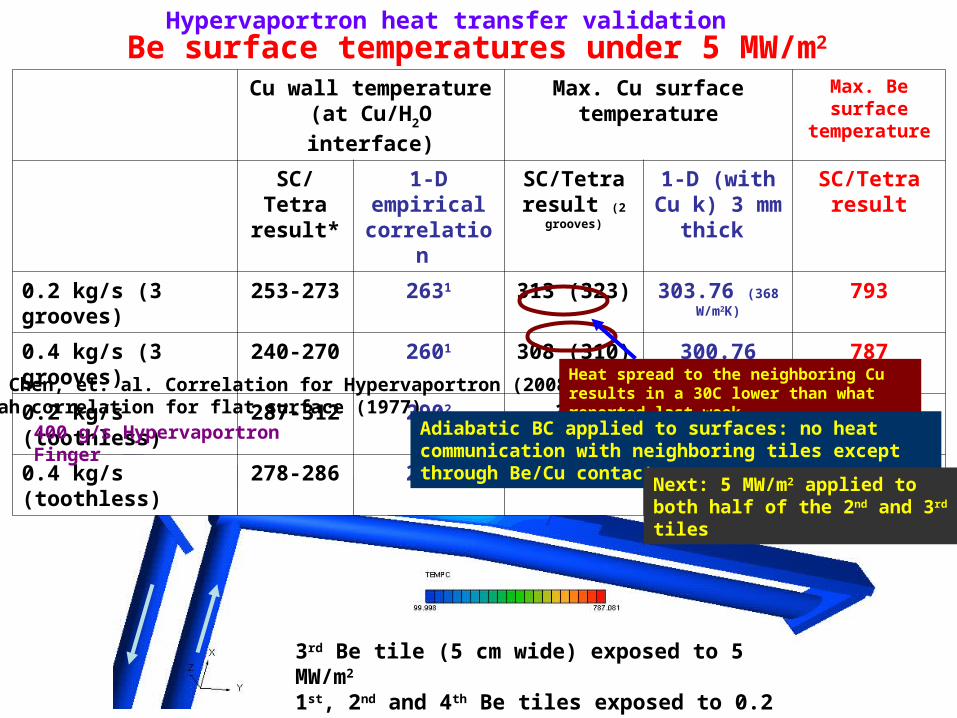
Be surface temperatures under 5 MW/m2
Cu wall temperature (at Cu/H2O interface)
Max. Cu surface temperature Max. Be surface temperature
SC/Tetra result*
1-D empirical correlation
SC/Tetra result (2 grooves)
1-D (with Cu k) 3 mm thick
SC/Tetra result
0.2 kg/s (3 grooves) 253-273 2631 313 (323) 303.76 (368 W/m2K)
793
0.4 kg/s (3 grooves) 240-270 2601 308 (310) 300.76 (368) 787
0.2 kg/s (toothless) 287-312 2902 350 330.92 (366.5) 839
0.4 kg/s (toothless) 278-286 2802 322 320.87 (367) 804
1.P. Chen, et. al. Correlation for Hypervaportron (2008)2.Shah correlation for flat surface (1977)
3rd Be tile (5 cm wide) exposed to 5 MW/m2 1st, 2nd and 4th Be tiles exposed to 0.2 MW/m2
400 g/s Hypervaportron Finger
Heat spread to the neighboring Cu results in a 30C lower than what reported last week
Adiabatic BC applied to surfaces: no heat communication with neighboring tiles except through Be/Cu contact
Next: 5 MW/m2 applied to both half of the 2nd and 3rd tiles
Hypervaportron heat transfer validation
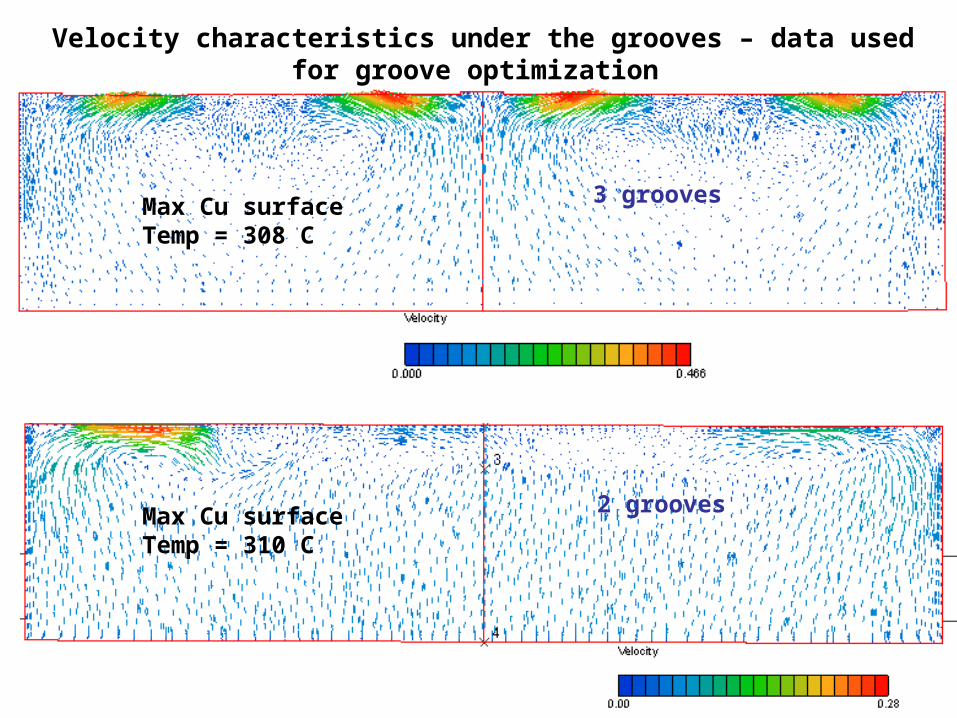
3 grooves
2 grooves
Max Cu surface Temp = 308 C
Max Cu surface Temp = 310 C
Velocity characteristics under the grooves – data used for groove optimization
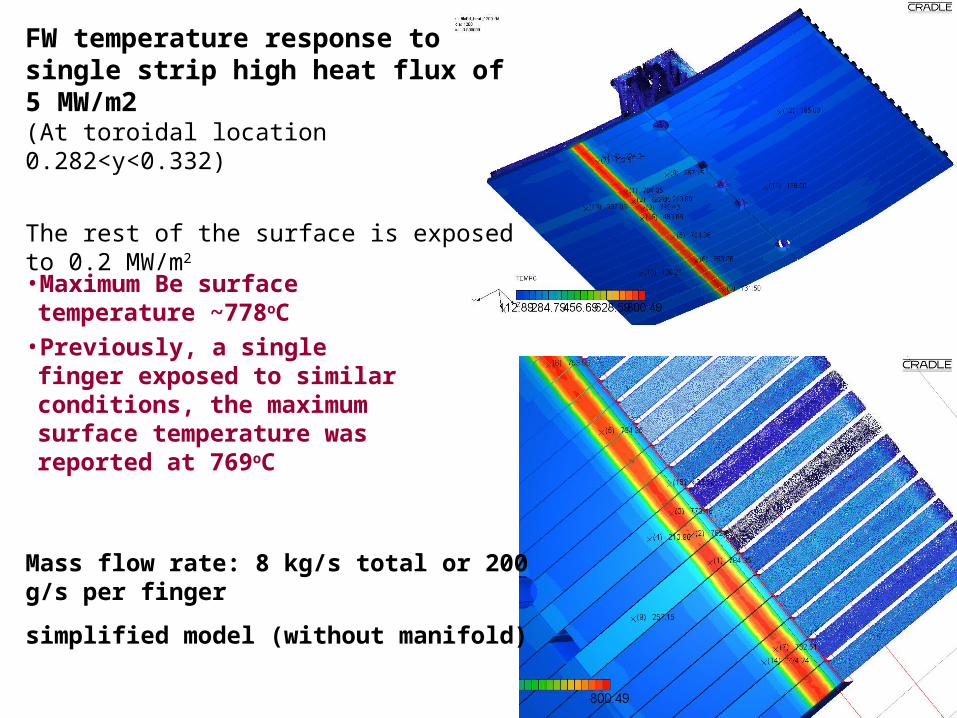
FW temperature response to single strip high heat flux of 5 MW/m2 (At toroidal location 0.282<y<0.332)
The rest of the surface is exposed to 0.2 MW/m2
Mass flow rate: 8 kg/s total or 200 g/s per finger
simplified model (without manifold)
• Maximum Be surface temperature ~778oC
• Previously, a single finger exposed to similar conditions, the maximum surface temperature was reported at 769oC
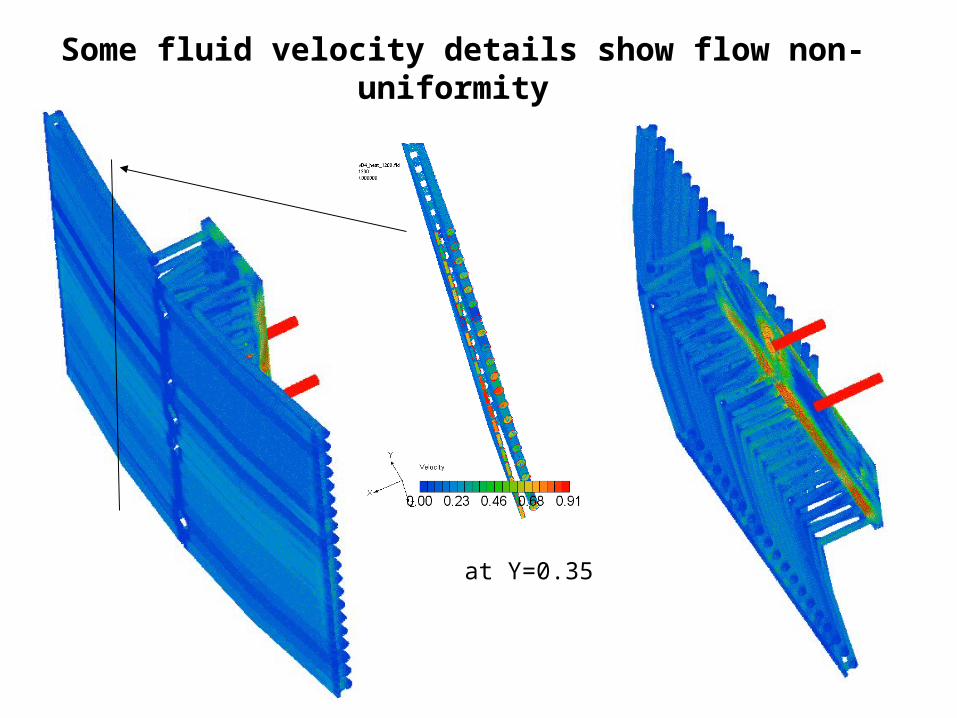
at Y=0.35
Some fluid velocity details show flow non-uniformity
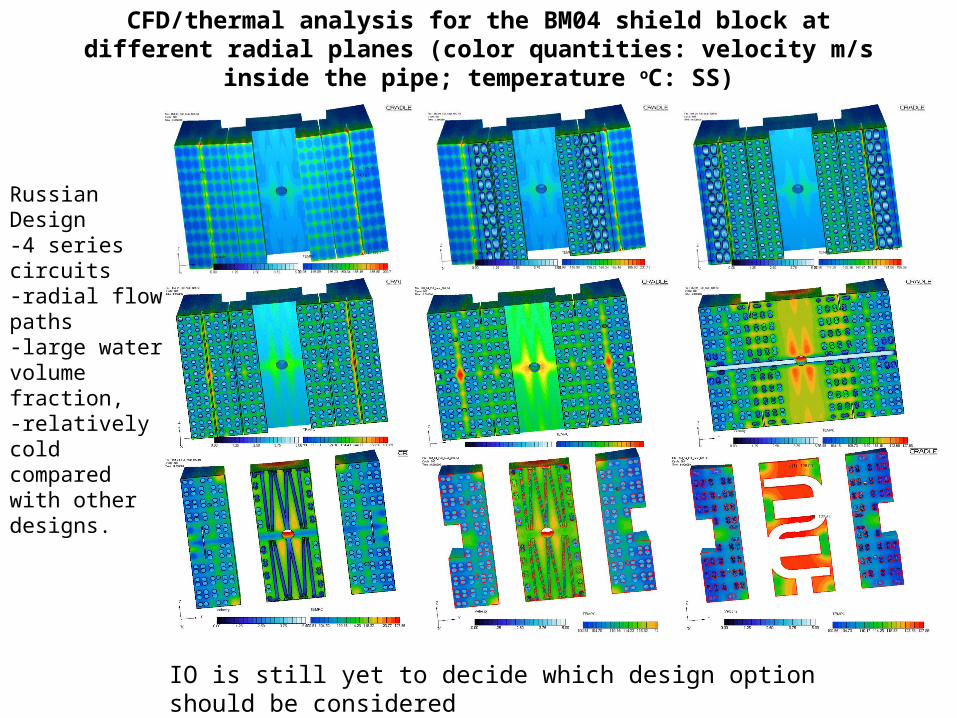
CFD/thermal analysis for the BM04 shield block at different radial planes (color quantities: velocity m/s inside the pipe; temperature oC: SS)
Russian Design-4 series circuits -radial flow paths-large water volume fraction, -relatively cold compared with other designs.
IO is still yet to decide which design option should be considered
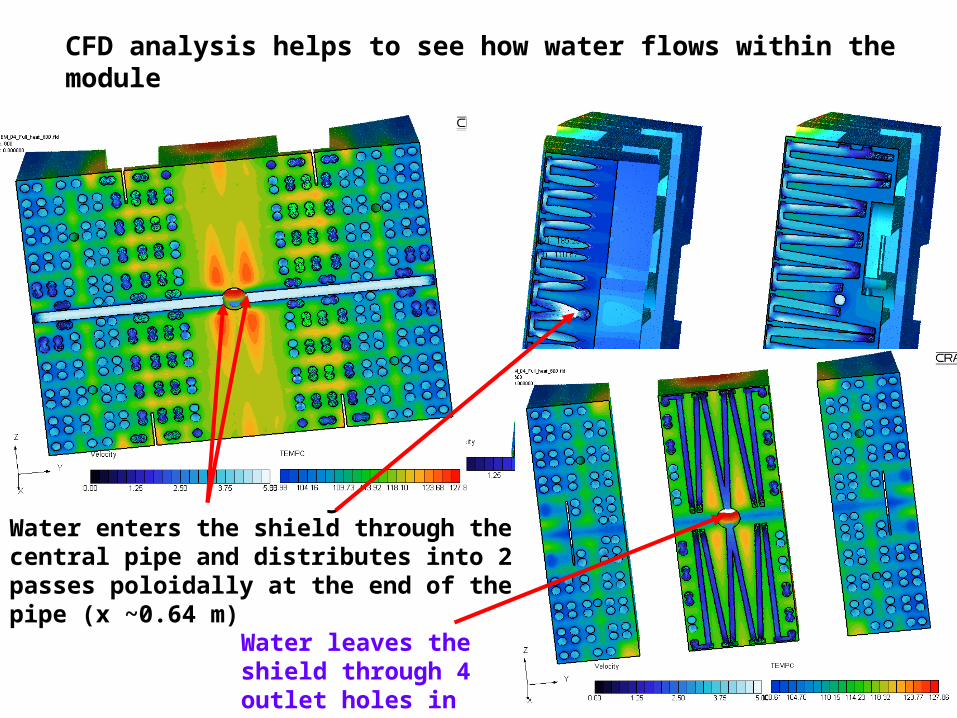
2 inlets each with 4 kg/s Water enters the shield through the central pipe and distributes into 2 passes poloidally at the end of the pipe (x ~0.64 m)
Water leaves the shield through 4 outlet holes in this model
CFD analysis helps to see how water flows within the module
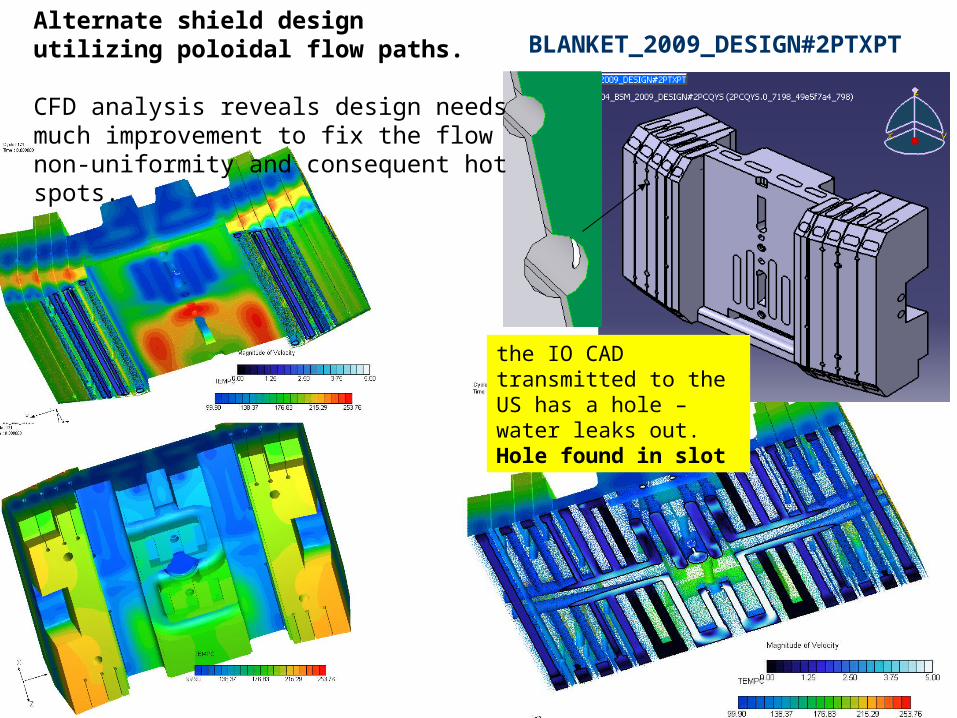
BLANKET_2009_DESIGN#2PTXPT
the IO CAD transmitted to the US has a hole – water leaks out. Hole found in slot
Alternate shield design utilizing poloidal flow paths.
CFD analysis reveals design needs much improvement to fix the flow non-uniformity and consequent hot spots.
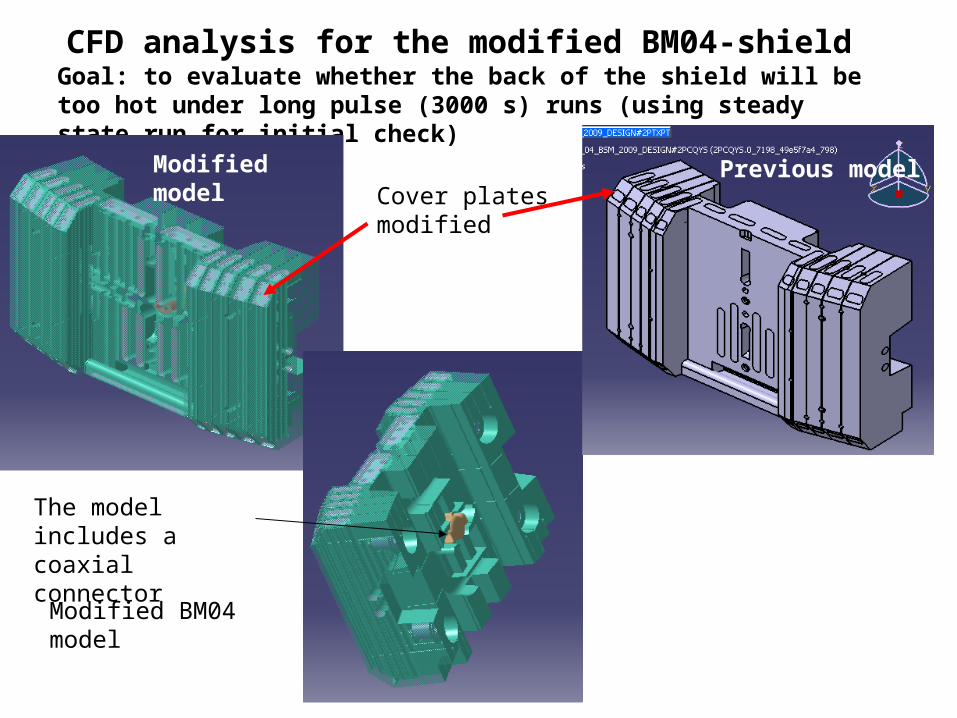
CFD analysis for the modified BM04-shield Goal: to evaluate whether the back of the shield will be too hot under long pulse (3000 s) runs (using steady state run for initial check)
The model includes a coaxial connector
Cover plates modified
Modified BM04 model
Previous model Modified model
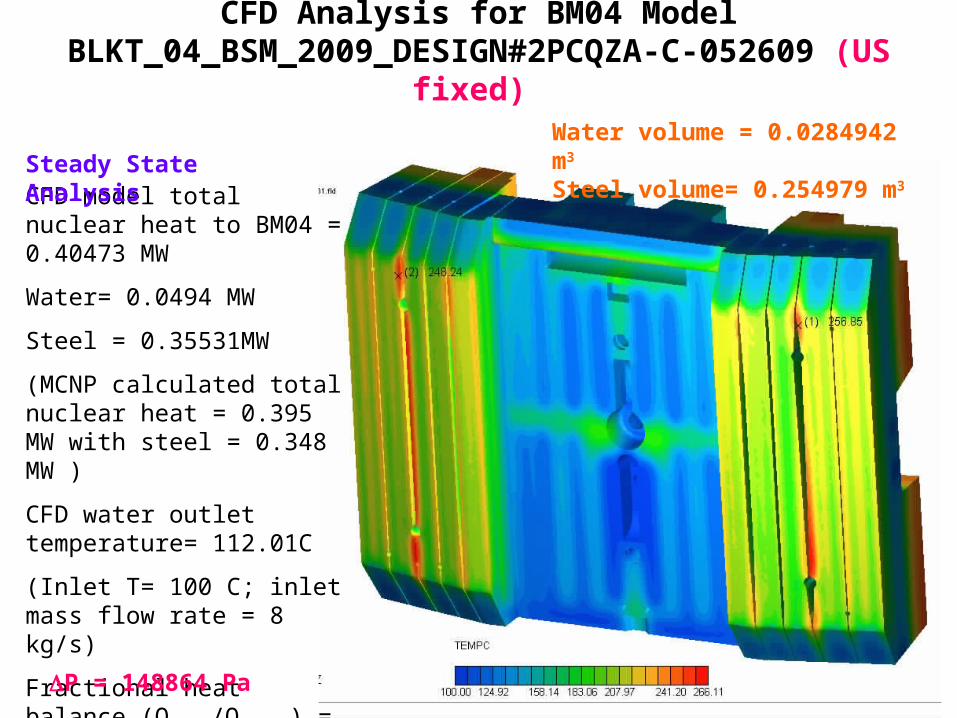
CFD Analysis for BM04 Model BLKT_04_BSM_2009_DESIGN#2PCQZA-C-052609 (US fixed)
CFD model total nuclear heat to BM04 = 0.40473 MW
Water= 0.0494 MW
Steel = 0.35531MW
(MCNP calculated total nuclear heat = 0.395 MW with steel = 0.348 MW )
CFD water outlet temperature= 112.01C
(Inlet T= 100 C; inlet mass flow rate = 8 kg/s)
Fractional heat balance (Qinput/Qoutout) = 1.0006
Steady State AnalysisWater volume = 0.0284942 m3
Steel volume= 0.254979 m3
P = 148864 Pa
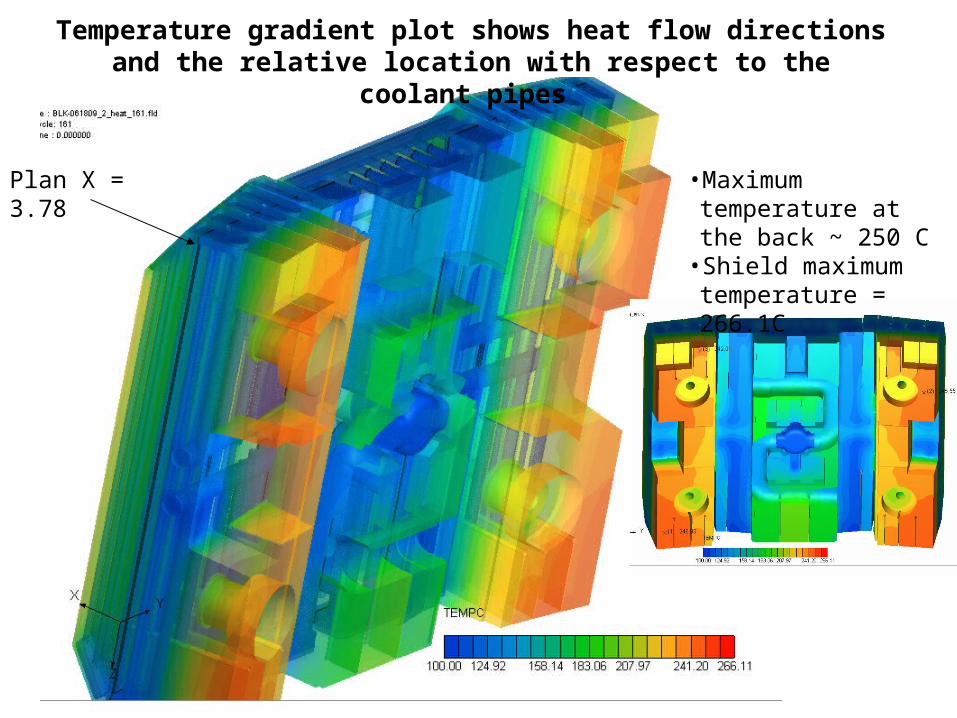
Plan X = 3.78
Temperature gradient plot shows heat flow directions and the relative location with respect to the coolant pipes
•Maximum temperature at the back ~ 250 C
•Shield maximum temperature = 266.1C
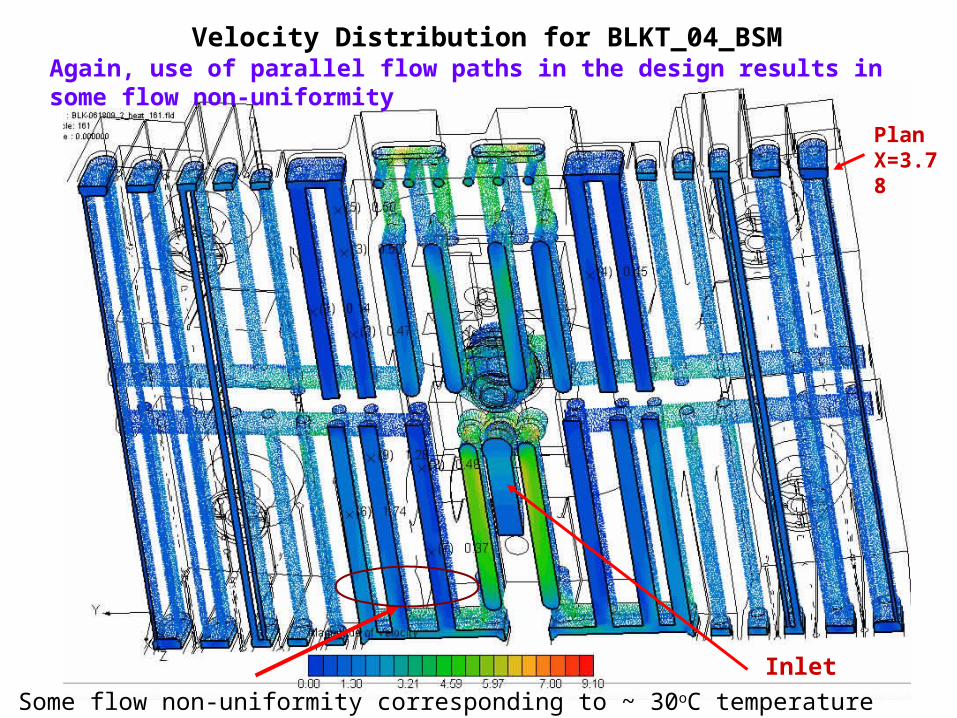
Velocity Distribution for BLKT_04_BSM
Inlet
Plan X=3.78
Some flow non-uniformity corresponding to ~ 30oC temperature non-uniformity
Again, use of parallel flow paths in the design results in some flow non-uniformity
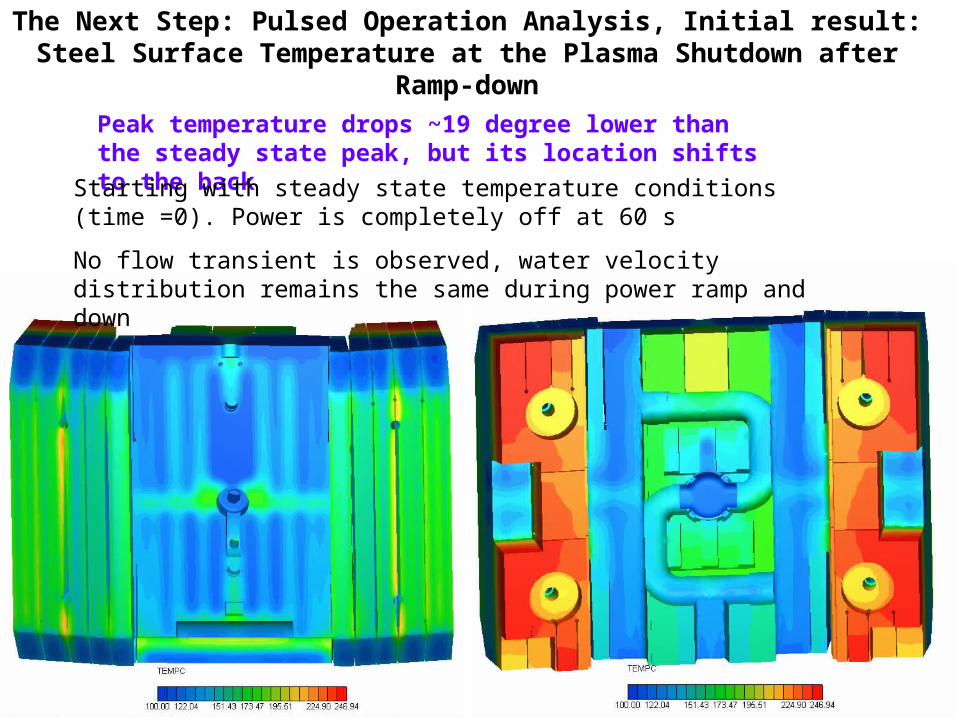
The Next Step: Pulsed Operation Analysis, Initial result: Steel Surface Temperature at the Plasma Shutdown after Ramp-down
Peak temperature drops ~19 degree lower than the steady state peak, but its location shifts to the back
Starting with steady state temperature conditions (time =0). Power is completely off at 60 s
No flow transient is observed, water velocity distribution remains the same during power ramp and down
Main areas of future work for FW / Blanket / Divertor
• He cooled first wall and divertor simulations for TBMs and Demo Divertors
• Coupled HIMAG / CFD / Neutronics / Structural codes for virtual blanket


![arXiv · arXiv:1702.07045v1 [math.AP] 22 Feb 2017 WEIGHTED Lq-ESTIMATES FOR STATIONARY STOKES SYSTEM WITH PARTIALLY BMO COEFFICIENTS HONGJIE DONG …](https://img.pdfslide.us/doc/110x75/613b08e2f8f21c0c8268c6b1/arxiv-arxiv170207045v1-mathap-22-feb-2017-weighted-lq-estimates-for-stationary.jpg)