Embed Size (px)
Citation preview
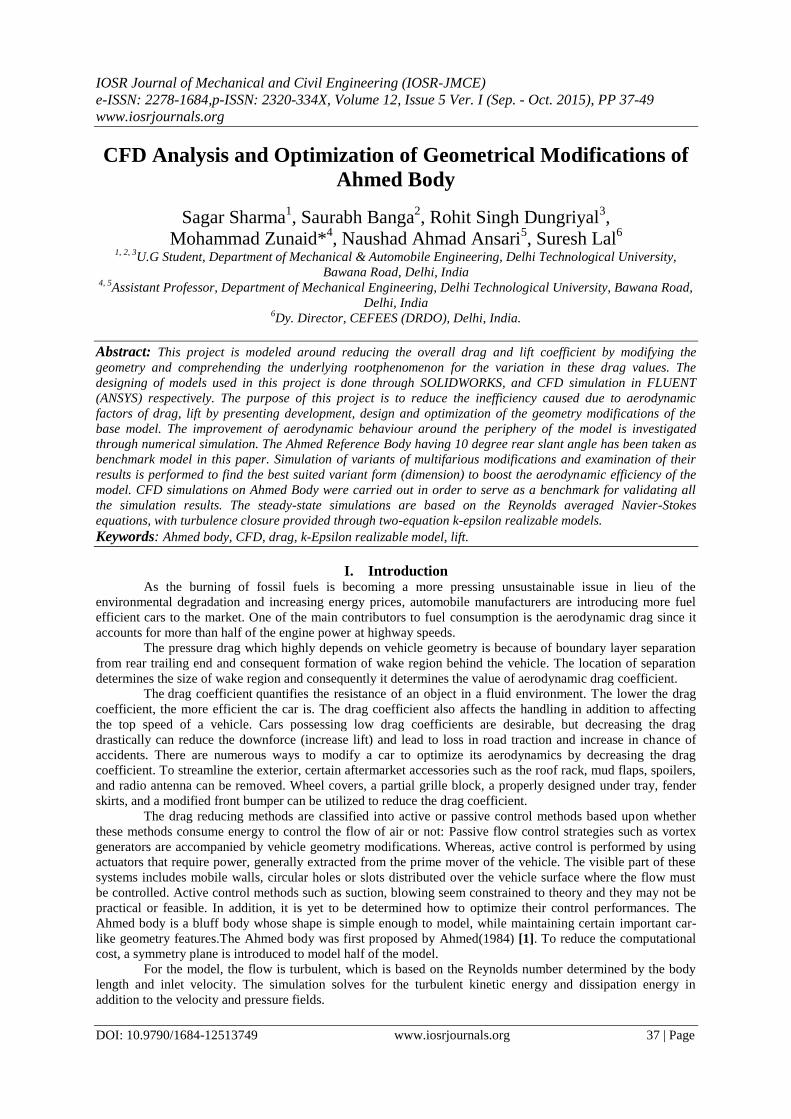
IOSR Journal of Mechanical and Civil Engineering (IOSR-JMCE)
e-ISSN: 2278-1684,p-ISSN: 2320-334X, Volume 12, Issue 5 Ver. I (Sep. - Oct. 2015), PP 37-49
www.iosrjournals.org
DOI: 10.9790/1684-12513749 www.iosrjournals.org 37 | Page
CFD Analysis and Optimization of Geometrical Modifications of
Ahmed Body
Sagar Sharma1, Saurabh Banga
2, Rohit Singh Dungriyal
3,
Mohammad Zunaid*4, Naushad Ahmad Ansari
5, Suresh Lal
6
1, 2, 3U.G Student, Department of Mechanical & Automobile Engineering, Delhi Technological University,
Bawana Road, Delhi, India
4, 5Assistant Professor, Department of Mechanical Engineering, Delhi Technological University, Bawana Road,
Delhi, India
6Dy. Director, CEFEES (DRDO), Delhi, India.
Abstract: This project is modeled around reducing the overall drag and lift coefficient by modifying the
geometry and comprehending the underlying rootphenomenon for the variation in these drag values. The
designing of models used in this project is done through SOLIDWORKS, and CFD simulation in FLUENT
(ANSYS) respectively. The purpose of this project is to reduce the inefficiency caused due to aerodynamic
factors of drag, lift by presenting development, design and optimization of the geometry modifications of the
base model. The improvement of aerodynamic behaviour around the periphery of the model is investigated
through numerical simulation. The Ahmed Reference Body having 10 degree rear slant angle has been taken as
benchmark model in this paper. Simulation of variants of multifarious modifications and examination of their
results is performed to find the best suited variant form (dimension) to boost the aerodynamic efficiency of the
model. CFD simulations on Ahmed Body were carried out in order to serve as a benchmark for validating all
the simulation results. The steady-state simulations are based on the Reynolds averaged Navier-Stokes
equations, with turbulence closure provided through two-equation k-epsilon realizable models.
Keywords: Ahmed body, CFD, drag, k-Epsilon realizable model, lift.
I. Introduction As the burning of fossil fuels is becoming a more pressing unsustainable issue in lieu of the
environmental degradation and increasing energy prices, automobile manufacturers are introducing more fuel
efficient cars to the market. One of the main contributors to fuel consumption is the aerodynamic drag since it
accounts for more than half of the engine power at highway speeds.
The pressure drag which highly depends on vehicle geometry is because of boundary layer separation
from rear trailing end and consequent formation of wake region behind the vehicle. The location of separation
determines the size of wake region and consequently it determines the value of aerodynamic drag coefficient.
The drag coefficient quantifies the resistance of an object in a fluid environment. The lower the drag
coefficient, the more efficient the car is. The drag coefficient also affects the handling in addition to affecting
the top speed of a vehicle. Cars possessing low drag coefficients are desirable, but decreasing the drag
drastically can reduce the downforce (increase lift) and lead to loss in road traction and increase in chance of
accidents. There are numerous ways to modify a car to optimize its aerodynamics by decreasing the drag
coefficient. To streamline the exterior, certain aftermarket accessories such as the roof rack, mud flaps, spoilers,
and radio antenna can be removed. Wheel covers, a partial grille block, a properly designed under tray, fender
skirts, and a modified front bumper can be utilized to reduce the drag coefficient.
The drag reducing methods are classified into active or passive control methods based upon whether
these methods consume energy to control the flow of air or not: Passive flow control strategies such as vortex
generators are accompanied by vehicle geometry modifications. Whereas, active control is performed by using
actuators that require power, generally extracted from the prime mover of the vehicle. The visible part of these
systems includes mobile walls, circular holes or slots distributed over the vehicle surface where the flow must
be controlled. Active control methods such as suction, blowing seem constrained to theory and they may not be
practical or feasible. In addition, it is yet to be determined how to optimize their control performances. The
Ahmed body is a bluff body whose shape is simple enough to model, while maintaining certain important car-
like geometry features.The Ahmed body was first proposed by Ahmed(1984) [1]. To reduce the computational
cost, a symmetry plane is introduced to model half of the model.
For the model, the flow is turbulent, which is based on the Reynolds number determined by the body
length and inlet velocity. The simulation solves for the turbulent kinetic energy and dissipation energy in
addition to the velocity and pressure fields.
CFD Analysis And Optimization Of Geometrical Modifications Of Ahmed Body
DOI: 10.9790/1684-12513749 www.iosrjournals.org 38 | Page
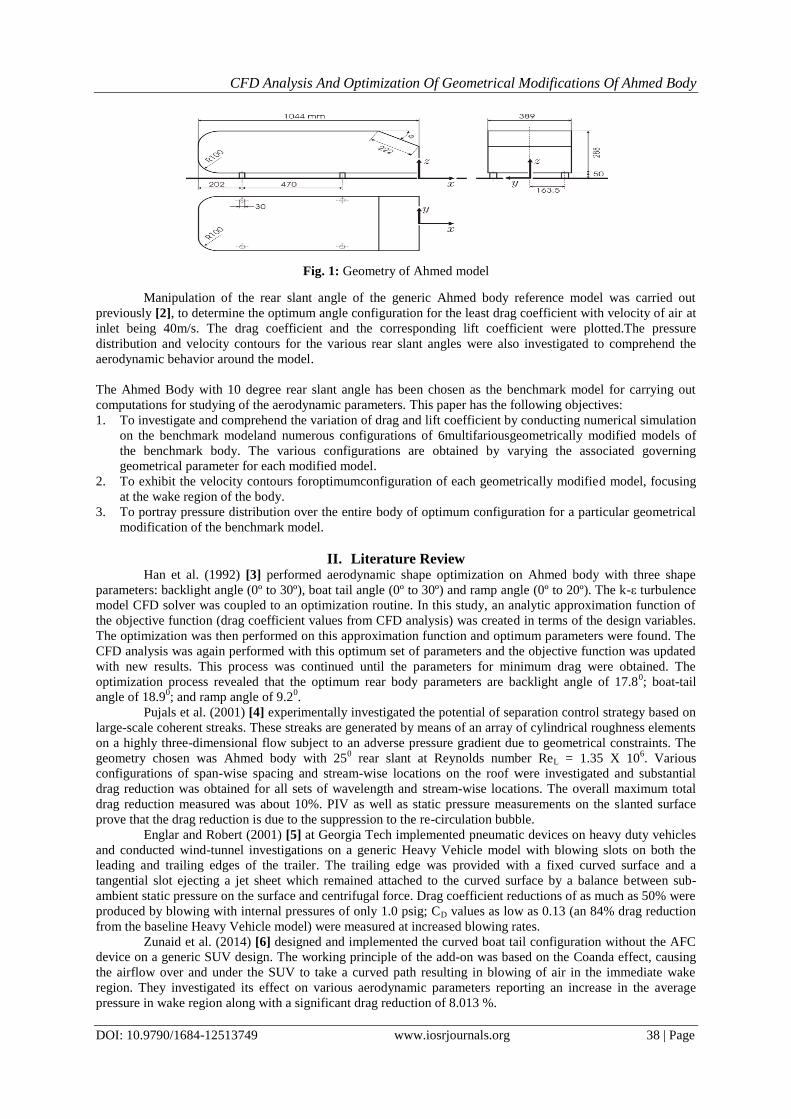
Manipulation of the rear slant angle of the generic Ahmed body reference model was carried out
previously [2], to determine the optimum angle configuration for the least drag coefficient with velocity of air at
inlet being 40m/s. The drag coefficient and the corresponding lift coefficient were plotted.The pressure
distribution and velocity contours for the various rear slant angles were also investigated to comprehend the
aerodynamic behavior around the model.
The Ahmed Body with 10 degree rear slant angle has been chosen as the benchmark model for carrying out
computations for studying of the aerodynamic parameters. This paper has the following objectives:
1. To investigate and comprehend the variation of drag and lift coefficient by conducting numerical simulation
on the benchmark modeland numerous configurations of 6multifariousgeometrically modified models of
the benchmark body. The various configurations are obtained by varying the associated governing
geometrical parameter for each modified model.
2. To exhibit the velocity contours foroptimumconfiguration of each geometrically modified model, focusing
at the wake region of the body.
3. To portray pressure distribution over the entire body of optimum configuration for a particular geometrical
modification of the benchmark model.
II. Literature Review Han et al. (1992) [3] performed aerodynamic shape optimization on Ahmed body with three shape
parameters: backlight angle (0º to 30º), boat tail angle (0º to 30º) and ramp angle (0º to 20º). The k-ε turbulence
model CFD solver was coupled to an optimization routine. In this study, an analytic approximation function of
the objective function (drag coefficient values from CFD analysis) was created in terms of the design variables.
The optimization was then performed on this approximation function and optimum parameters were found. The
CFD analysis was again performed with this optimum set of parameters and the objective function was updated
with new results. This process was continued until the parameters for minimum drag were obtained. The
optimization process revealed that the optimum rear body parameters are backlight angle of 17.80; boat-tail
angle of 18.90; and ramp angle of 9.2
0.
Pujals et al. (2001) [4] experimentally investigated the potential of separation control strategy based on
large-scale coherent streaks. These streaks are generated by means of an array of cylindrical roughness elements
on a highly three-dimensional flow subject to an adverse pressure gradient due to geometrical constraints. The
geometry chosen was Ahmed body with 250 rear slant at Reynolds number ReL = 1.35 X 10
6. Various
configurations of span-wise spacing and stream-wise locations on the roof were investigated and substantial
drag reduction was obtained for all sets of wavelength and stream-wise locations. The overall maximum total
drag reduction measured was about 10%. PIV as well as static pressure measurements on the slanted surface
prove that the drag reduction is due to the suppression to the re-circulation bubble.
Englar and Robert (2001) [5] at Georgia Tech implemented pneumatic devices on heavy duty vehicles
and conducted wind-tunnel investigations on a generic Heavy Vehicle model with blowing slots on both the
leading and trailing edges of the trailer. The trailing edge was provided with a fixed curved surface and a
tangential slot ejecting a jet sheet which remained attached to the curved surface by a balance between sub-
ambient static pressure on the surface and centrifugal force. Drag coefficient reductions of as much as 50% were
produced by blowing with internal pressures of only 1.0 psig; CD values as low as 0.13 (an 84% drag reduction
from the baseline Heavy Vehicle model) were measured at increased blowing rates.
Zunaid et al. (2014) [6] designed and implemented the curved boat tail configuration without the AFC
device on a generic SUV design. The working principle of the add-on was based on the Coanda effect, causing
the airflow over and under the SUV to take a curved path resulting in blowing of air in the immediate wake
region. They investigated its effect on various aerodynamic parameters reporting an increase in the average
pressure in wake region along with a significant drag reduction of 8.013 %.
Fig. 1: Geometry of Ahmed model
CFD Analysis And Optimization Of Geometrical Modifications Of Ahmed Body
DOI: 10.9790/1684-12513749 www.iosrjournals.org 39 | Page
Lamond et al. (2009) [7] conducted a preliminary investigation into the use of base bleed on a
production SUV using CFD analysis.For the geometry studied, a bleed outlet applied to the upper portion was
found to be most effective in reducing drag but there may be difficulty in implementation as bleeding air from a
high pressure region towards the top would be difficult. It was found that bleed through the sides of the vehicle
was also effective and this would allow venting from the sides, underside or roof The paper portrayed that the
reduction in drag increased as the mass flow rate of air increased, when the flow was deflected at the outlet; a
mass flow rate of under 1.5kg/s could reduce the drag coefficient by 10.7% for an outlet on the upper section of
the rear of the vehicle.
Bahram et al. (2001) [8] experimented with a square back bluff body using tail and boat plate like add-
on for drag reduction. The mean pressure results showed a significant increase in the base pressure with the drag
reduction device and it also suppresses large-scale turbulent motions in the wake. The results also showed a
reduction of the turbulence intensity as well as a rapid upward deflection of the underbody flow with the device
in place and confirmed that the separated flow from the trailing edge of the model reattached on the extended
plate (add-on device) which is similar to that of a boat-tail effect using the concept of Coanda effect [9] for drag
reduction by up to 20%.
Al-Marzooqi et al. (2012) performed an experiment on Ahmed body to improve the aerodynamic
efficiency of the SUV model which he used in his paper [10]. The add-on device in the form of lateral guide
vanes were installed at the rear end of the SUV to direct the air flow into the low pressure wake region at the
rear of the vehicle. This would improve the pressure recovery in the wake due to mass addition of the directed
air, which in turn would reduce form drag and hence the overall drag of the box. The chord length of the guide
vanes was taken as L/8, where L represents the length of the car box. The angle of attack of the lateral guide
vanes was also subjected to various manipulations of angles and consequently, significant reduction in the drag
coefficient up to 17% was noted.
Gustavsson and Melin (2006) [11] at KTH performed the experiments to find the advantages of the
VGs when applied to blunt bodies. Wind tunnel was used to perform the simulation of the bluntbody with the
VG located at the rear slant angle, behind the shoulder of the body.The dimensions of the main body were given
as L=0.95m, W=0.50m and H=0.30m, with rear slant angle of 40 degree. There were two wind tunnel tests
conducted by them. In the first test, the main objective was to determine the effectiveness of VGs at redirecting
airflow which wassuccessfully confirmed after the test. The second wind tunnel test was conducted with the
VGs placed before the rear slant angles in conjunction with a combination of boat tail angles of 20, 40, 60 and
90 degrees and different VG height and length were tested. The least drag coefficient of 0.4540 was obtained in
the results.
III. Geometry Modifications Of Ahmed Body 3.1 Benchmark Model
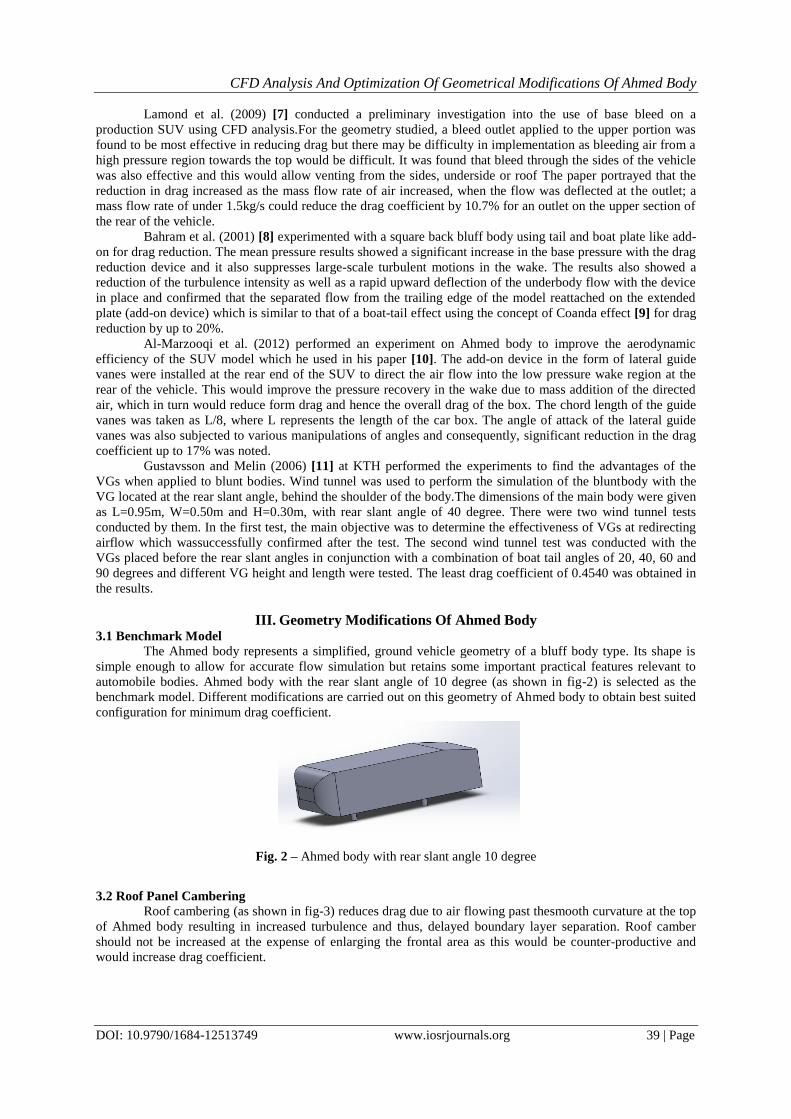
The Ahmed body represents a simplified, ground vehicle geometry of a bluff body type. Its shape is
simple enough to allow for accurate flow simulation but retains some important practical features relevant to
automobile bodies. Ahmed body with the rear slant angle of 10 degree (as shown in fig-2) is selected as the
benchmark model. Different modifications are carried out on this geometry of Ahmed body to obtain best suited
configuration for minimum drag coefficient.
3.2 Roof Panel Cambering
Roof cambering (as shown in fig-3) reduces drag due to air flowing past thesmooth curvature at the top
of Ahmed body resulting in increased turbulence and thus, delayed boundary layer separation. Roof camber
should not be increased at the expense of enlarging the frontal area as this would be counter-productive and
would increase drag coefficient.
Fig. 2 – Ahmed body with rear slant angle 10 degree
CFD Analysis And Optimization Of Geometrical Modifications Of Ahmed Body
DOI: 10.9790/1684-12513749 www.iosrjournals.org 40 | Page
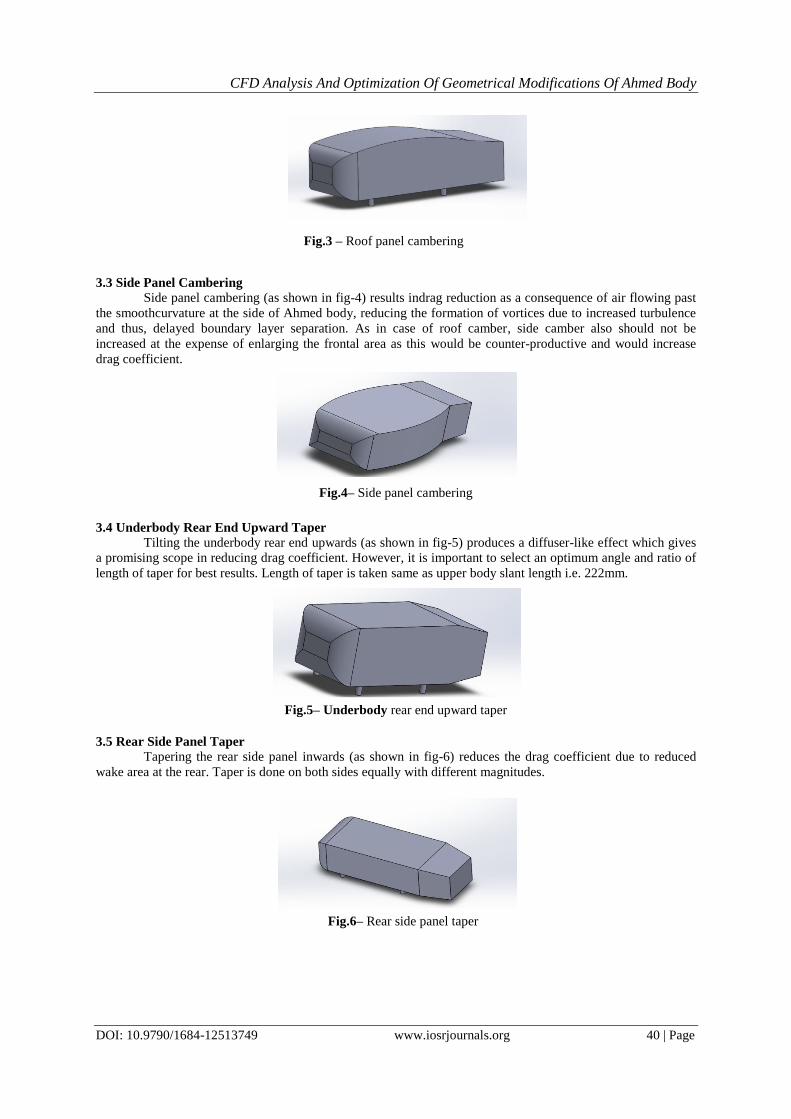
3.3 Side Panel Cambering
Side panel cambering (as shown in fig-4) results indrag reduction as a consequence of air flowing past
the smoothcurvature at the side of Ahmed body, reducing the formation of vortices due to increased turbulence
and thus, delayed boundary layer separation. As in case of roof camber, side camber also should not be
increased at the expense of enlarging the frontal area as this would be counter-productive and would increase
drag coefficient.
3.4 Underbody Rear End Upward Taper
Tilting the underbody rear end upwards (as shown in fig-5) produces a diffuser-like effect which gives
a promising scope in reducing drag coefficient. However, it is important to select an optimum angle and ratio of
length of taper for best results. Length of taper is taken same as upper body slant length i.e. 222mm.
3.5 Rear Side Panel Taper
Tapering the rear side panel inwards (as shown in fig-6) reduces the drag coefficient due to reduced
wake area at the rear. Taper is done on both sides equally with different magnitudes.
Fig.3 – Roof panel cambering
Fig.4– Side panel cambering
Fig.5– Underbody rear end upward taper
Fig.6– Rear side panel taper
CFD Analysis And Optimization Of Geometrical Modifications Of Ahmed Body
DOI: 10.9790/1684-12513749 www.iosrjournals.org 41 | Page
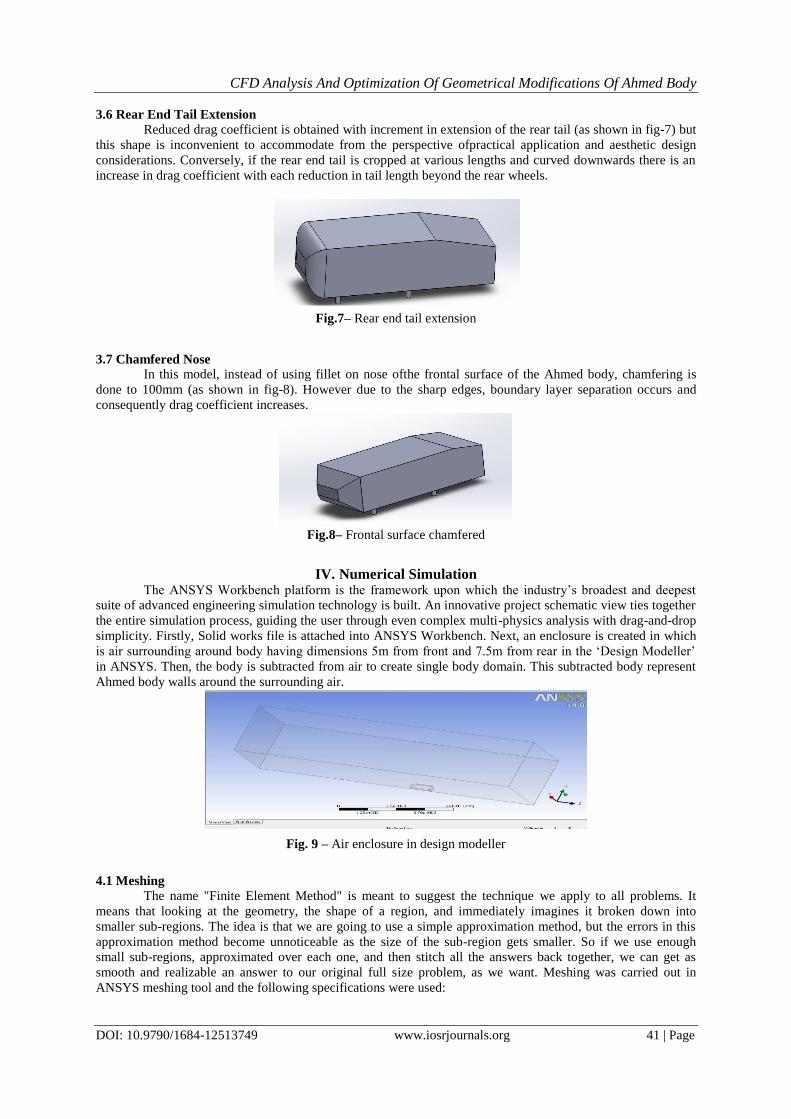
3.6 Rear End Tail Extension
Reduced drag coefficient is obtained with increment in extension of the rear tail (as shown in fig-7) but
this shape is inconvenient to accommodate from the perspective ofpractical application and aesthetic design
considerations. Conversely, if the rear end tail is cropped at various lengths and curved downwards there is an
increase in drag coefficient with each reduction in tail length beyond the rear wheels.
3.7 Chamfered Nose
In this model, instead of using fillet on nose ofthe frontal surface of the Ahmed body, chamfering is
done to 100mm (as shown in fig-8). However due to the sharp edges, boundary layer separation occurs and
consequently drag coefficient increases.
IV. Numerical Simulation The ANSYS Workbench platform is the framework upon which the industry‟s broadest and deepest
suite of advanced engineering simulation technology is built. An innovative project schematic view ties together
the entire simulation process, guiding the user through even complex multi-physics analysis with drag-and-drop
simplicity. Firstly, Solid works file is attached into ANSYS Workbench. Next, an enclosure is created in which
is air surrounding around body having dimensions 5m from front and 7.5m from rear in the „Design Modeller‟
in ANSYS. Then, the body is subtracted from air to create single body domain. This subtracted body represent
Ahmed body walls around the surrounding air.
4.1 Meshing The name "Finite Element Method" is meant to suggest the technique we apply to all problems. It
means that looking at the geometry, the shape of a region, and immediately imagines it broken down into
smaller sub-regions. The idea is that we are going to use a simple approximation method, but the errors in this
approximation method become unnoticeable as the size of the sub-region gets smaller. So if we use enough
small sub-regions, approximated over each one, and then stitch all the answers back together, we can get as
smooth and realizable an answer to our original full size problem, as we want. Meshing was carried out in
ANSYS meshing tool and the following specifications were used:
Fig.7– Rear end tail extension
Fig.8– Frontal surface chamfered
Fig. 9 – Air enclosure in design modeller
CFD Analysis And Optimization Of Geometrical Modifications Of Ahmed Body
DOI: 10.9790/1684-12513749 www.iosrjournals.org 42 | Page
Relevance center: coarse, smoothing: high, Transition: slow, Initisal size seed: Active assembly, Min. size:
1mm, Max. Size: 250mm, Advanced Size functions: Proximity and Curvature.
4.2 Modifications In Meshing
Element size on Ahmed body walls and rollers are still too large but the size of domain air surrounding
is good. So, some modifications on Ahmed body were done for getting better result in our analyses, which are
explained as follows:
Roller Sizing- The size of roller meshing is limited to 2mm.
Face Sizing- The size of faces meshing is limited to 10mm.
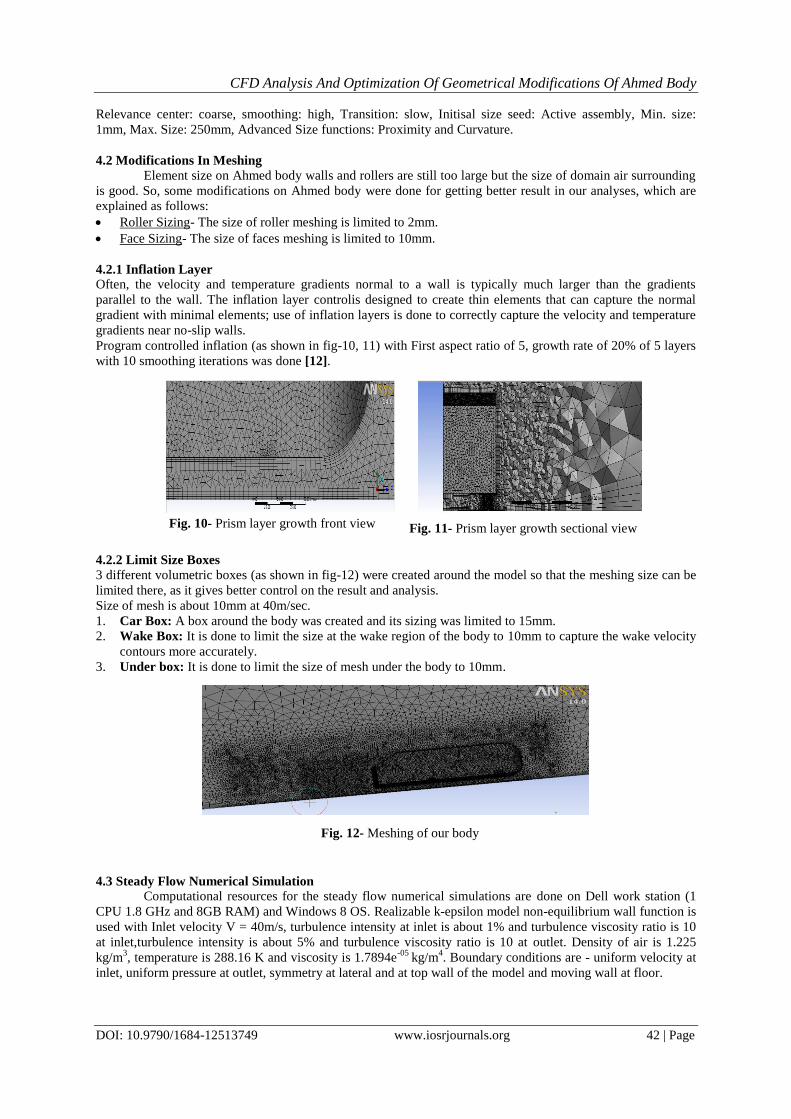
4.2.1 Inflation Layer
Often, the velocity and temperature gradients normal to a wall is typically much larger than the gradients
parallel to the wall. The inflation layer controlis designed to create thin elements that can capture the normal
gradient with minimal elements; use of inflation layers is done to correctly capture the velocity and temperature
gradients near no-slip walls.
Program controlled inflation (as shown in fig-10, 11) with First aspect ratio of 5, growth rate of 20% of 5 layers
with 10 smoothing iterations was done [12].
4.2.2 Limit Size Boxes
3 different volumetric boxes (as shown in fig-12) were created around the model so that the meshing size can be
limited there, as it gives better control on the result and analysis.
Size of mesh is about 10mm at 40m/sec.
1. Car Box: A box around the body was created and its sizing was limited to 15mm.
2. Wake Box: It is done to limit the size at the wake region of the body to 10mm to capture the wake velocity
contours more accurately.
3. Under box: It is done to limit the size of mesh under the body to 10mm.
4.3 Steady Flow Numerical Simulation
Computational resources for the steady flow numerical simulations are done on Dell work station (1
CPU 1.8 GHz and 8GB RAM) and Windows 8 OS. Realizable k-epsilon model non-equilibrium wall function is
used with Inlet velocity V = 40m/s, turbulence intensity at inlet is about 1% and turbulence viscosity ratio is 10
at inlet,turbulence intensity is about 5% and turbulence viscosity ratio is 10 at outlet. Density of air is 1.225
kg/m3, temperature is 288.16 K and viscosity is 1.7894e
-05 kg/m
4. Boundary conditions are - uniform velocity at
inlet, uniform pressure at outlet, symmetry at lateral and at top wall of the model and moving wall at floor.
Fig. 10- Prism layer growth front view
Fig. 12- Meshing of our body
Fig. 11- Prism layer growth sectional view
CFD Analysis And Optimization Of Geometrical Modifications Of Ahmed Body
DOI: 10.9790/1684-12513749 www.iosrjournals.org 43 | Page
Solution method utilizes pressure-velocity coupling scheme as coupled with gradient: least square cell
based method, pressure as standard and with momentum. Turbulence kinetic energy, turbulence dissipation rate
as first order upwind for the initial 100 iterations and correspondingly as second order upwind for the next 500
iterations. Moreover, turbulence viscosity factor is taken as 0.8 for the initial 100 iterations and consequently
taken as 0.95 for the remaining 500 iterations.
Analysis of numerous configurations of multifarious modifications of the benchmark model of Ahmed
body with 10 degree rear slant angle iscarried out on ANSYS Workbench. Roof and Side cambering is done at 5
varied H/L ratioseach, ranging from 0.02 to 1.00 with an increment of 0.02 where H is the height of camber and
L is the lengthsubjected to cambering. Underbody rear end upward taper is implemented at 4 different taper
angles ranging from 5 to 20 degree with an increment of 5 degree. Rear side panel taper is carried out on 3
different lengths of taper of 50, 100 & 150mm. Rear end tail extension are carried out on 3 extensions of
180,360 & 540mm.Chamfered nose is done at 100mm nose length. Therefore, a cumulative total of 22 analyses
have been carried out including that of benchmark model of Ahmed body.
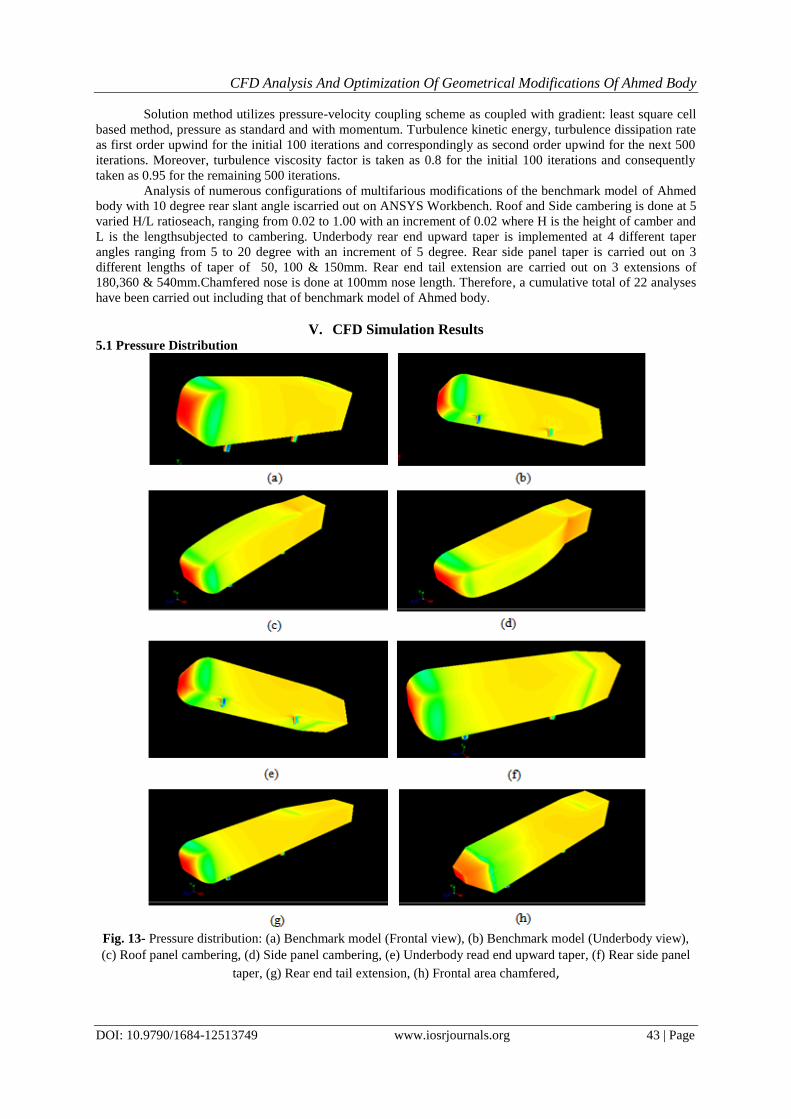
V. CFD Simulation Results 5.1 Pressure Distribution
Fig. 13- Pressure distribution: (a) Benchmark model (Frontal view), (b) Benchmark model (Underbody view),
(c) Roof panel cambering, (d) Side panel cambering, (e) Underbody read end upward taper, (f) Rear side panel
taper, (g) Rear end tail extension, (h) Frontal area chamfered,
CFD Analysis And Optimization Of Geometrical Modifications Of Ahmed Body
DOI: 10.9790/1684-12513749 www.iosrjournals.org 44 | Page
The pressure distribution gives us the pressure of air over the various surfaces on the geometry of the
model. The red, yellow and green areas depict regions of high, medium and low pressure respectively.The air
becomes almost stagnant as it strikes the vehicle which results in air exerting very high pressure on front engine
grill of the vehicle represented by the red area. The airflow then gets divided between the upper and lower
surface of the vehicle. The higher pressure air on front surface accelerates as it travels over the curved nose
surface of Ahmed body, causing the pressure to drop. This lower pressure creates lifts over the roof surface as
the air passes over it. As the air continues to flow and make its way to the rear, a notch is created by the rear
slant owing to flow separation, leaving a vacuum or low pressure space which the air is not able to fill properly.
The resulting lower pressure creates lift which then acts upon the surface of the rear slant.
For the multifarious modifications, the pressure distribution is explained as follows:
• Benchmark model ((Frontal & Underbody view)- As shown in fig-13(a)&(b),the pressure distribution of the
benchmark model features high pressure (red) region on the frontal surface, followed by transition to a
narrow region of low pressure (green) around the edges of the frontal surface which finally merges into
medium pressure (yellow) region which that encompasses the entire surface of the roof, underbody and side
panels.
• Roof panel cambering- As shown in fig-13(c), it is observed that the pressure on roof panel decreases as
compared to that of the benchmark model on the overall surface of camber with the surface turning
comparatively green (from yellow), indicating lower pressure with respect to the benchmark model.
• Side panel cambering- A similar trend is observed with pressure on side panels being lower(even than that
on the roof) on the overall surface of camber than that on theside panels of the benchmark model, as
exhibited in fig-13(d).
• Underbody read end upward taper-The rear end upward taper model has lower pressure on the onsetoftaper
and at the rear end, functioning to reduce the drag at the through pressure recovery, owing to diffuser-like
action as is evident in fig-13(e).
• Rear side panel taper-For the case of rear side panel taper, there is slight decrease in pressure at the onset of
taper of side panelsas is apparent in fig-13(f), and consequently, at the rear end.
• Rear end tail extension-There is no marked change in pressure distribution of rear tail extension model as
shown in fig-13(g), because the modification is in the form of continuation of existing geometry and no
alteration in contour.
• Frontal area chamfered-High pressure acts on the entirety of the nose of the Ahmed body as evident by the
expanse of red color on theentire frontal surface, as exhibited in fig-13(h).
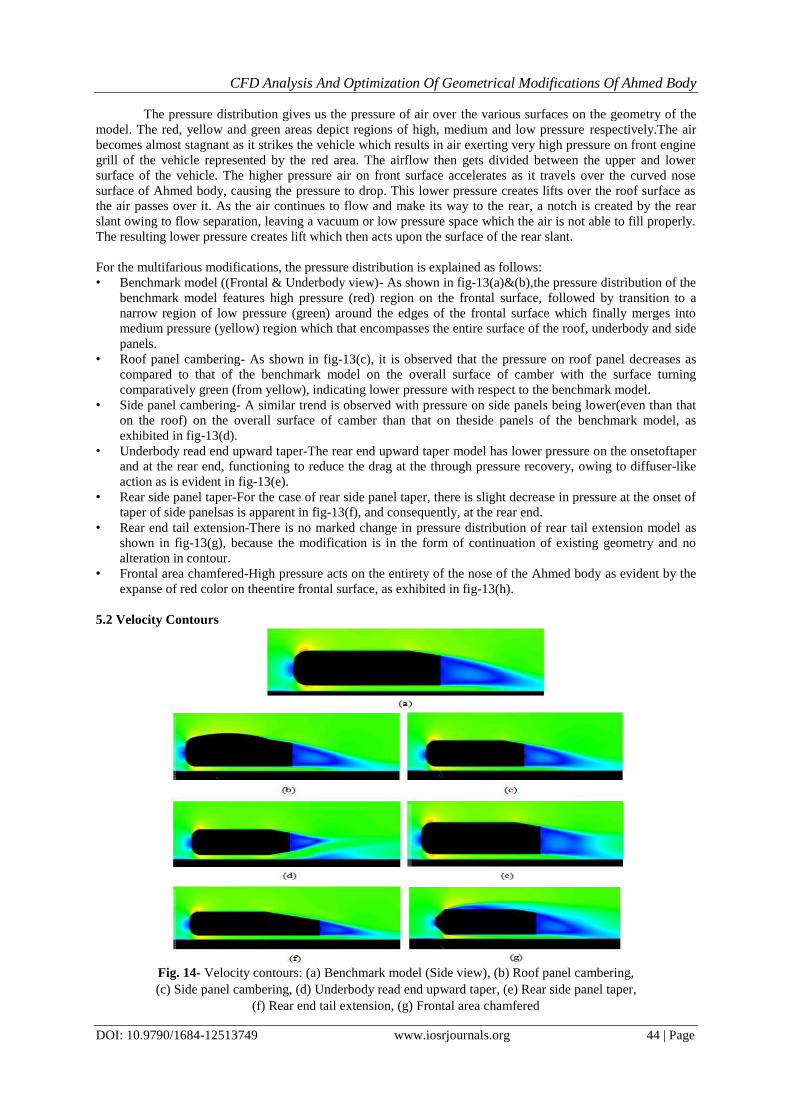
5.2 Velocity Contours
Fig. 14- Velocity contours: (a) Benchmark model (Side view), (b) Roof panel cambering,
(c) Side panel cambering, (d) Underbody read end upward taper, (e) Rear side panel taper,
(f) Rear end tail extension, (g) Frontal area chamfered
CFD Analysis And Optimization Of Geometrical Modifications Of Ahmed Body
DOI: 10.9790/1684-12513749 www.iosrjournals.org 45 | Page
Velocity contours gives us the velocity of air along different geometry sections of the Ahmed body.
The green area corresponds to the velocity 40m/sec, while blue area shows low velocity region and red, yellow
area gives high velocity region. The velocity contours extending behind the body indicate the low velocity wake
region, which causes the form drag. As the wake area is reduced, the drag-causing eddies (vortices), generated
due to the pressure difference between the top and bottom of the Ahmed body at the rear trailing end, come
closer together. This result in less kinetic energy being dissipated due to these smaller eddies and consequently
less compensation power required by the engine to propel the vehicle forward. It additionally results in higher
pressure being applied at the rear surface of the body and consequently less form drag.
For the multifarious modifications, the velocity contours are explained as follows:
• Benchmark model- The benchmark model is characterized by a wide tail of low velocity at the rear originating
from the trailing edge of the slant - wake region, as can be observed in fig-14(a). Also, low velocity air at the
center of the frontal surface, and high velocity of air at the edges of the frontal surface is witnessed in this case.
• Roof panel cambering- In case of roof panel cambering, a lower velocity is exhibited at the onset of camber on
the roofas shown in fig-14(b),and no marked departure in the wake region is observed from that of the
benchmark model.
• Side panel cambering- For the side cambering model, a similar trend is observed in the wake region but with the
difference of lower velocity occurring along the side panels but remaining the same along the roof as in case of
the benchmark model, being evident in fig-14(c).
• Underbody read end upward taper-The rear end upward taper has a comparatively narrow (pointed) wake area at
the rear as a result of comparatively higher velocity on the underbody, owing to the geometrical modification, as
exhibited in fig-14(d).
• Rear side panel taper-For the case of rear side panel taper, there is a similar reduction in wake area but this time
along its width accounting for the wake region ending prematurely along the length than that in case of
benchmark model, ascan be observed in fig-14(e).
• Rear end tail extension-There is a decrease in rear height for the case of rear tail extension due to modification
in the geometry, resulting in decrease of rear wake area as can be seen in fig-14(f).
• Frontal area chamfered- Finally, for the chamfered nose model, low velocity due to boundary layer separation at
the edge of the nose on frontal surface of the Ahmed body, continuing throughout the length on the roof of the
body and also significantly large wake area is evident in fig-14(g).
VI. Results The analyses of the 22 multifarious models carried out yield optimum configurations for each
geometrical modification of the benchmark model – Ahmed body having 10 degree rear slant angle. The values
of the aerodynamic parameters obtained for the benchmark model are- Coefficient of drag (Cd) = 0.238 and the
coefficient of lift (Cl) = 0.0848[2]. For all the configurations for a particular modification (obtained by varying
the associated geometrical parameter),the drag and lift coefficients are plotted and examined to determine the
optimum configuration resulting in least drag and lift coefficients. Furthermore, the underlying root causes are
also analysed, comprehended and listed.
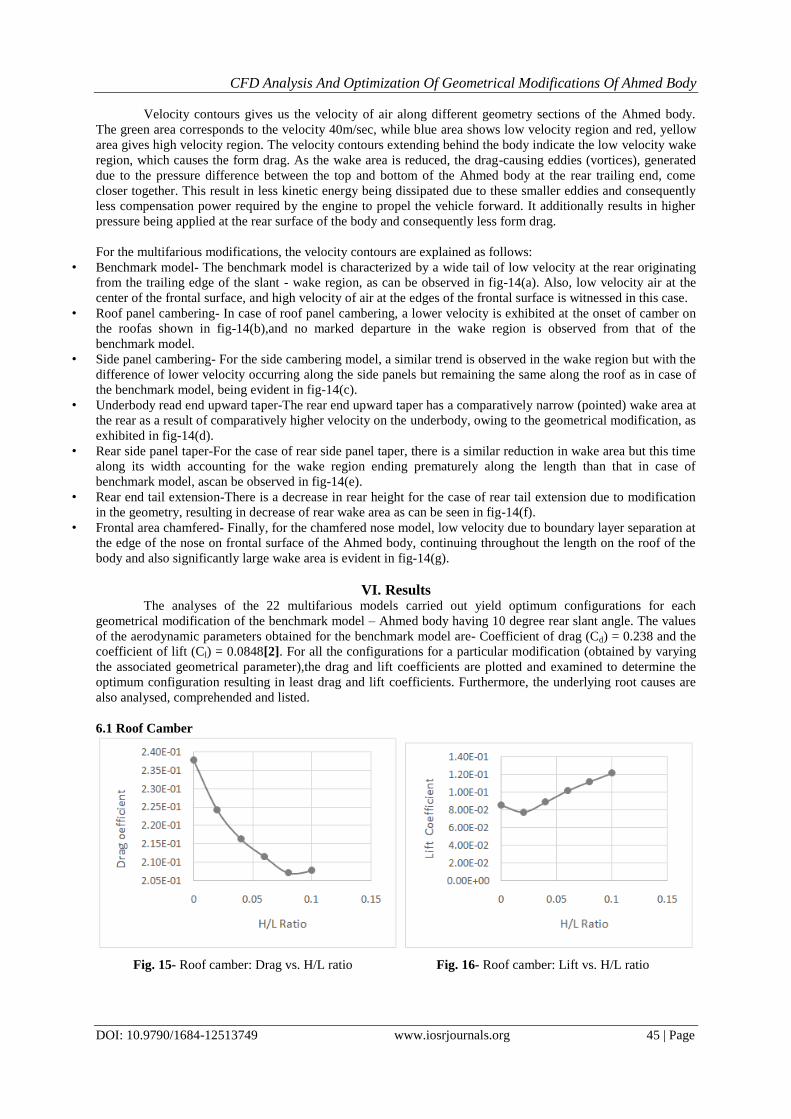
6.1 Roof Camber
Fig. 15- Roof camber: Drag vs. H/L ratio
Fig. 16- Roof camber: Lift vs. H/L ratio
CFD Analysis And Optimization Of Geometrical Modifications Of Ahmed Body
DOI: 10.9790/1684-12513749 www.iosrjournals.org 46 | Page
Roof camber having H/L ratio of 0.08 gives least drag configuration (as shown in fig-15) for this
modification due to delayed boundary layer separation and thereafter, drag starts to increase again. This
increase is due to increase of roof camber at the expense of enlarging the frontal area and this turns out to be
counter-productive.
Roof camber having H/L ratio of 0.02 gives least lift configuration (as shown in fig-16) for this
modification and thereafter, it starts to increase continually due to reduction in pressure over the round
curvature of roof.
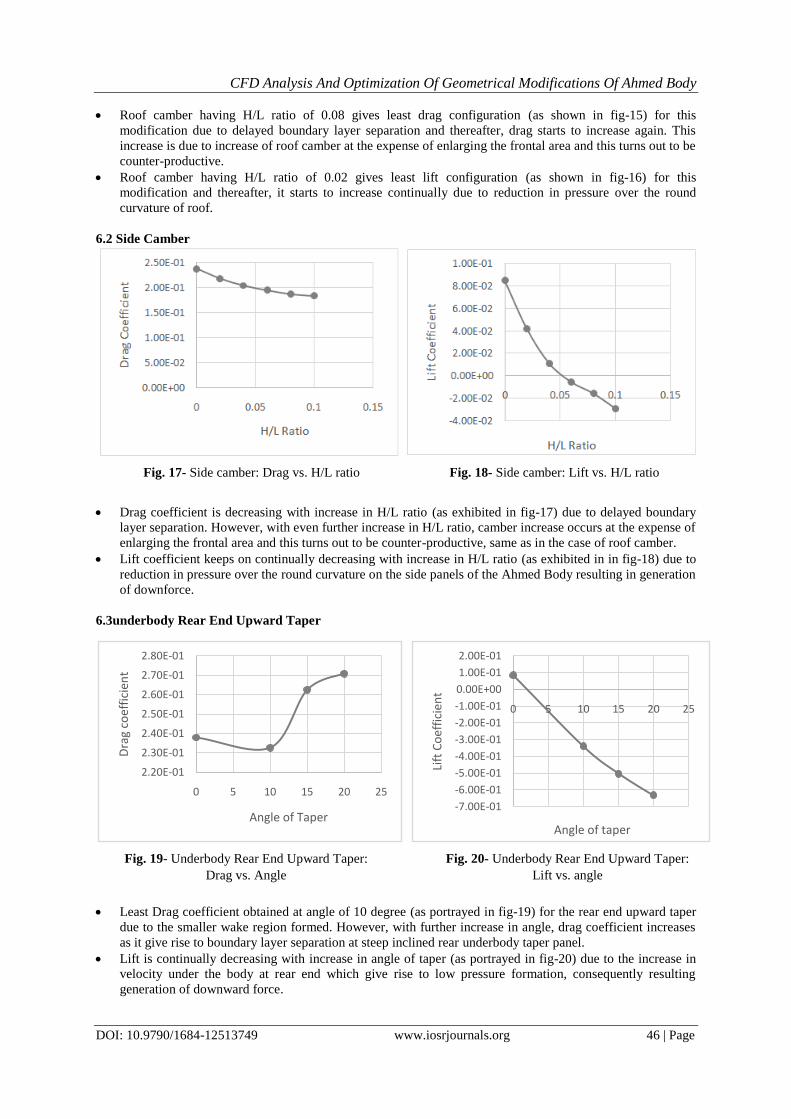
6.2 Side Camber
Drag coefficient is decreasing with increase in H/L ratio (as exhibited in fig-17) due to delayed boundary
layer separation. However, with even further increase in H/L ratio, camber increase occurs at the expense of
enlarging the frontal area and this turns out to be counter-productive, same as in the case of roof camber.
Lift coefficient keeps on continually decreasing with increase in H/L ratio (as exhibited in in fig-18) due to
reduction in pressure over the round curvature on the side panels of the Ahmed Body resulting in generation
of downforce.
6.3underbody Rear End Upward Taper
Least Drag coefficient obtained at angle of 10 degree (as portrayed in fig-19) for the rear end upward taper
due to the smaller wake region formed. However, with further increase in angle, drag coefficient increases
as it give rise to boundary layer separation at steep inclined rear underbody taper panel.
Lift is continually decreasing with increase in angle of taper (as portrayed in fig-20) due to the increase in
velocity under the body at rear end which give rise to low pressure formation, consequently resulting
generation of downward force.
Fig. 17- Side camber: Drag vs. H/L ratio
Fig. 18- Side camber: Lift vs. H/L ratio
2.20E-01
2.30E-01
2.40E-01
2.50E-01
2.60E-01
2.70E-01
2.80E-01
0 5 10 15 20 25
Dra
g co
effi
cien
t
Angle of Taper-7.00E-01
-6.00E-01
-5.00E-01
-4.00E-01
-3.00E-01
-2.00E-01
-1.00E-01
0.00E+00
1.00E-01
2.00E-01
0 5 10 15 20 25
Lift
Co
effi
cien
t
Angle of taper
Fig. 19- Underbody Rear End Upward Taper:
Drag vs. Angle
Fig. 20- Underbody Rear End Upward Taper:
Lift vs. angle
CFD Analysis And Optimization Of Geometrical Modifications Of Ahmed Body
DOI: 10.9790/1684-12513749 www.iosrjournals.org 47 | Page
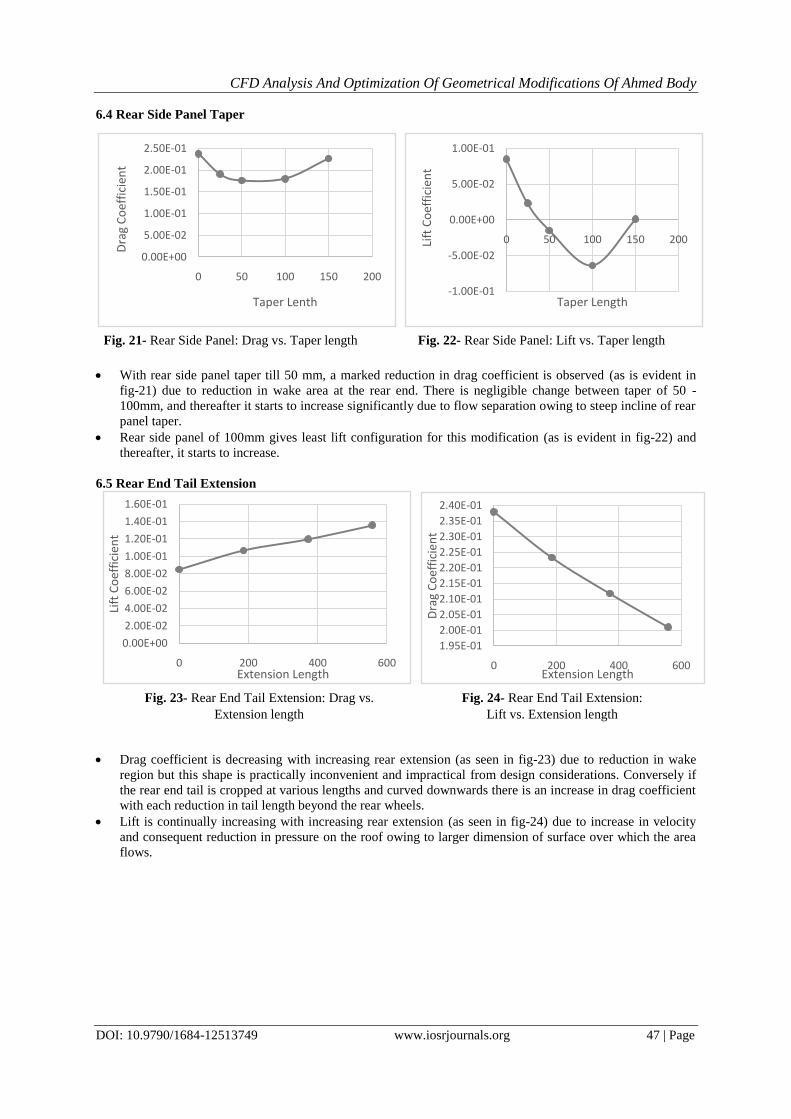
6.4 Rear Side Panel Taper
With rear side panel taper till 50 mm, a marked reduction in drag coefficient is observed (as is evident in
fig-21) due to reduction in wake area at the rear end. There is negligible change between taper of 50 -
100mm, and thereafter it starts to increase significantly due to flow separation owing to steep incline of rear
panel taper.
Rear side panel of 100mm gives least lift configuration for this modification (as is evident in fig-22) and
thereafter, it starts to increase.
6.5 Rear End Tail Extension
Drag coefficient is decreasing with increasing rear extension (as seen in fig-23) due to reduction in wake
region but this shape is practically inconvenient and impractical from design considerations. Conversely if
the rear end tail is cropped at various lengths and curved downwards there is an increase in drag coefficient
with each reduction in tail length beyond the rear wheels.
Lift is continually increasing with increasing rear extension (as seen in fig-24) due to increase in velocity
and consequent reduction in pressure on the roof owing to larger dimension of surface over which the area
flows.
0.00E+00
5.00E-02
1.00E-01
1.50E-01
2.00E-01
2.50E-01
0 50 100 150 200
Dra
g C
oef
fici
ent
Taper Lenth-1.00E-01
-5.00E-02
0.00E+00
5.00E-02
1.00E-01
0 50 100 150 200Lift
Co
effi
cien
t
Taper Length
1.95E-01
2.00E-01
2.05E-01
2.10E-01
2.15E-01
2.20E-01
2.25E-01
2.30E-01
2.35E-01
2.40E-01
0 200 400 600
Dra
g C
oef
fici
ent
Extension Length
0.00E+00
2.00E-02
4.00E-02
6.00E-02
8.00E-02
1.00E-01
1.20E-01
1.40E-01
1.60E-01
0 200 400 600
Lift
Co
effi
cien
t
Extension Length
Fig. 21- Rear Side Panel: Drag vs. Taper length
Fig. 22- Rear Side Panel: Lift vs. Taper length
Fig. 23- Rear End Tail Extension: Drag vs.
Extension length
Fig. 24- Rear End Tail Extension:
Lift vs. Extension length
CFD Analysis And Optimization Of Geometrical Modifications Of Ahmed Body
DOI: 10.9790/1684-12513749 www.iosrjournals.org 48 | Page
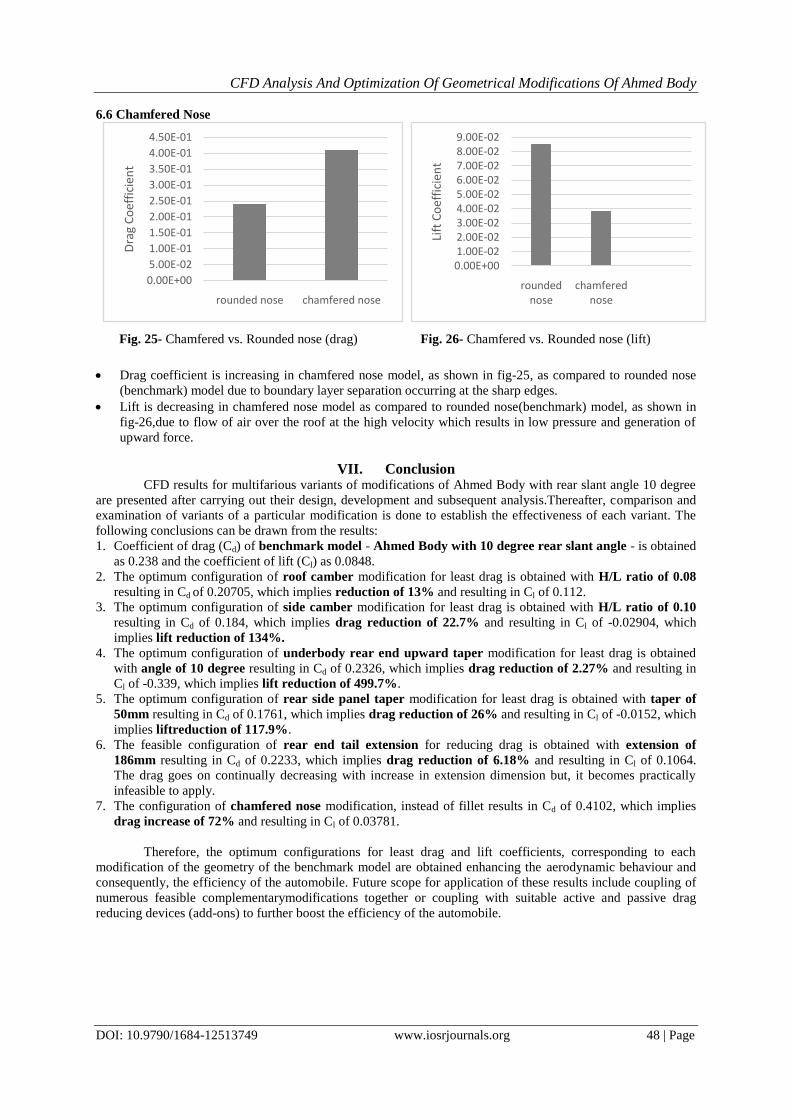
6.6 Chamfered Nose
Drag coefficient is increasing in chamfered nose model, as shown in fig-25, as compared to rounded nose
(benchmark) model due to boundary layer separation occurring at the sharp edges.
Lift is decreasing in chamfered nose model as compared to rounded nose(benchmark) model, as shown in
fig-26,due to flow of air over the roof at the high velocity which results in low pressure and generation of
upward force.
VII. Conclusion CFD results for multifarious variants of modifications of Ahmed Body with rear slant angle 10 degree
are presented after carrying out their design, development and subsequent analysis.Thereafter, comparison and
examination of variants of a particular modification is done to establish the effectiveness of each variant. The
following conclusions can be drawn from the results:
1. Coefficient of drag (Cd) of benchmark model - Ahmed Body with 10 degree rear slant angle - is obtained
as 0.238 and the coefficient of lift (Cl) as 0.0848.
2. The optimum configuration of roof camber modification for least drag is obtained with H/L ratio of 0.08
resulting in Cd of 0.20705, which implies reduction of 13% and resulting in Cl of 0.112.
3. The optimum configuration of side camber modification for least drag is obtained with H/L ratio of 0.10
resulting in Cd of 0.184, which implies drag reduction of 22.7% and resulting in Cl of -0.02904, which
implies lift reduction of 134%.
4. The optimum configuration of underbody rear end upward taper modification for least drag is obtained
with angle of 10 degree resulting in Cd of 0.2326, which implies drag reduction of 2.27% and resulting in
Cl of -0.339, which implies lift reduction of 499.7%.
5. The optimum configuration of rear side panel taper modification for least drag is obtained with taper of
50mm resulting in Cd of 0.1761, which implies drag reduction of 26% and resulting in Cl of -0.0152, which
implies liftreduction of 117.9%.
6. The feasible configuration of rear end tail extension for reducing drag is obtained with extension of
186mm resulting in Cd of 0.2233, which implies drag reduction of 6.18% and resulting in Cl of 0.1064.
The drag goes on continually decreasing with increase in extension dimension but, it becomes practically
infeasible to apply.
7. The configuration of chamfered nose modification, instead of fillet results in Cd of 0.4102, which implies
drag increase of 72% and resulting in Cl of 0.03781.
Therefore, the optimum configurations for least drag and lift coefficients, corresponding to each
modification of the geometry of the benchmark model are obtained enhancing the aerodynamic behaviour and
consequently, the efficiency of the automobile. Future scope for application of these results include coupling of
numerous feasible complementarymodifications together or coupling with suitable active and passive drag
reducing devices (add-ons) to further boost the efficiency of the automobile.
0.00E+00
5.00E-02
1.00E-01
1.50E-01
2.00E-01
2.50E-01
3.00E-01
3.50E-01
4.00E-01
4.50E-01
rounded nose chamfered nose
Dra
g C
oef
fici
ent
0.00E+001.00E-022.00E-023.00E-024.00E-025.00E-026.00E-027.00E-028.00E-029.00E-02
rounded nose
chamfered nose
Lift
Co
effi
cien
t
Fig. 25- Chamfered vs. Rounded nose (drag)
Fig. 26- Chamfered vs. Rounded nose (lift)
CFD Analysis And Optimization Of Geometrical Modifications Of Ahmed Body
DOI: 10.9790/1684-12513749 www.iosrjournals.org 49 | Page
References [1] S. R. Ahmed, G. Ramm, G. Faitin, „Some Salient Features of the Time – Averaged Ground Vehicle Wake‟, (SAE-TP-840300)
Society of Automotive Engineers, Inc., Warrendale, PA, 1984.
[2] Saurabh Banga, Md. Zunaid, Naushad Ahmad Ansari, Sagar Sharma, Rohit Singh Dungriyal, „CFD Simulation of Flow around
External Vehicle: Ahmed Body‟DOI: 10.9790/1684-12438794, IOSR Journal of Mechanical and Civil Engineering (IOSR-JMCE). [3] T. Han, D. C. Hammond, C. J. Sagi, „Optimization of bluff body for minimum Drag in ground proximity‟, AIAA Journal, Vol. 30,
No. 4, pp. 882-889, doi: 10.2514/3.11005, 1992.
[4] G. Pujals, S. Depardon, C. Cossu,„Drag reduction of a 3D bluff body using coherent stream wise streaks‟, Springer, Exp Fluids (2010) 49:1085–1094, DOI 10.1007/s00348-010-0857-5, 2010.
[5] Robert J. Englar, „Advanced Aerodynamic Devices to Improve the Performance, Economics, Handling and Safety of Heavy
Vehicles‟, SAE 2001-01-2072, Georgia Tech Research Institute Aerospace Transportation & Advanced Systems Lab, 2001. [6] Shubham Singh, M. Zunaid, Naushad Ahmad Ansari, Shikha Bahirani, Sumit Dhall, Sandeep Kumar, „Numerical Study of the
Generic Sports Utility Vehicle Design with a Drag Reduction Add-On Device‟, Hindawi Publishing Corporation Journal of
Computational Engineering Article ID 785294, Volume 2014. [7] A. Lamond, J. J. Kennedy, M. T. Stickland, „An investigation into unsteady base bleed for drag reduction in bluff two box SUV‟s‟,
Proceedings of the 4th European Automotive Simulation Conference (EASC‟09), Munich, Germany, 2009.
[8] K. Bahram, S. Zhang, C. Koromilas, „Experimental and computational study of unsteady wake flow behind a bluff body with a drag reduction device‟, SAE2001-01B-207, 2001.
[9] M. H. Coanda, “Propelling device,” French Patent no. 796843, 1936.
[10] E.M. Wahba., H. Al-Marzooqi, M. Shaath, M. Shahin, T. El-Dhmashawy, „Aerodynamic Drag Reduction for Ground Vehicles using Lateral Guide Vanes‟, CFD Letters, vol.4, no.2, pp.68–79, 2012.
[11] T. Gustavsson and T. Melin, „Application of Vortex generators to a blunt body‟, Technical Report KTH, Department of
Aeronautical and Vehicle Engineering, Royal Institute of Technology, Stockholm,Sweden,2006. [12] Marco Lanfrit,„Best practice guidelines for handlingAutomotive External Aerodynamics with FLUENT‟, Version 1.2 (Feb 9th
2005), Fluent Deutschland Gmbh Birkenweg 14a 64295 Darmstadt/Germany.