Embed Size (px)
Citation preview
Portfolio Description
The portfolio is designed for investors
looking for a significant level of
investment income whilst aiming to
maintain the real value of their capital.
The fund primarily invests in collective
investment schemes and provides
exposure to equities, fixed interest
securities, commercial property and
alternative assets such as hedge funds
and structured products.
Asset allocation across these markets
can be flexible but will maintain at least
60% exposure to interest bearing assets
in order for the fund itself to make
interest distributions. There are no
constraints in respect of the fund’s
geographic exposure.
Performance Commentary
The portfolio rose by 1.7% over the month, compared to the 3.0% rise in the
IMA OE Mixed Investment 20-60% Shares sector and the 0.2% rise in 3 month
LIBOR+2%.
UK equity markets rose significantly over the period. Aberforth Smaller
Companies performed particularly well rising 8.1% as the NAV rose and
discount narrowed. The holding was subsequently sold having risen by more
than 50% in under a year.
The 10 year gilt yield was broadly unchanged over the month while credit
spreads narrowed leading to a positive performance from credit markets.
Alliance Trust Monthly Income was the best performing fixed interest holding
rising by 1.9%.
The recently purchased MS Euro Stoxx Dividend Income, which yields 5.5%,
rose 2.0% over the period.
*VT Turcan Connell Income Portfolio Factsheet – July 2013
Fund Overview
Launch date 28-Nov-03
Classification OEIC
Share Class Income units
Min. Lump sum £1,000
Savings scheme Min. £100 per month
(ISA eligible)
Initial charge 0.00%
Management fee 1.00% (capital)
Fund size £16.9m
Price (31 Jul 13) 111.18p
Est. Dividend yield 2.72% (net)
Income frequency January, April, July &
October
Dealing Daily 12 noon
(01343 880344)
Investment Advisor
Turcan Connell Asset Management Limited
Princes Exchange
1 Earl Grey Street
Edinburgh
EH3 9EE
Tel: 0131 228 8111
Authorised Corporate Director
Valu-Trac Investment Management Limited
Temple Chambers
3-7 Temple Avenue
London
EC4Y 0DA
Period to 31 Jul 13 3m 6m 1y 3y 5y
Fund -0.9 1.7 7.6 16.1 34.2
Benchmark 0.6 1.3 2.6 8.6 17.2
Sector 0.4 4.0 11.5 22.5 32.1
12m to Jul-13 Jul-12 Jul-11 Jul-10 Jul-09
Fund 7.6 1.6 6.2 13.0 2.3
Benchmark 2.6 3.0 2.8 2.7 5.0
Sector 11.5 1.7 8.1 12.8 -4.4
Benchmark: LIBOR (3 month + 2%)
Sector: IMA OE Mixed Investment 20-60% Shares
Source: Valu-Trac Administration Services (from March 18th 2013), Capita Financial Group (prior to March 18th 2013)
Past Performance (%) Cumulative Performance
Annual Performance
Turcan Connell Asset Management Limited and Valu-Trac Investment Management Limited are authorised and regulated by the
Financial Conduct Authority. Issued and approved by Turcan Connell Asset Management. *VT relates to Valu-Trac.
Monthly Update - July
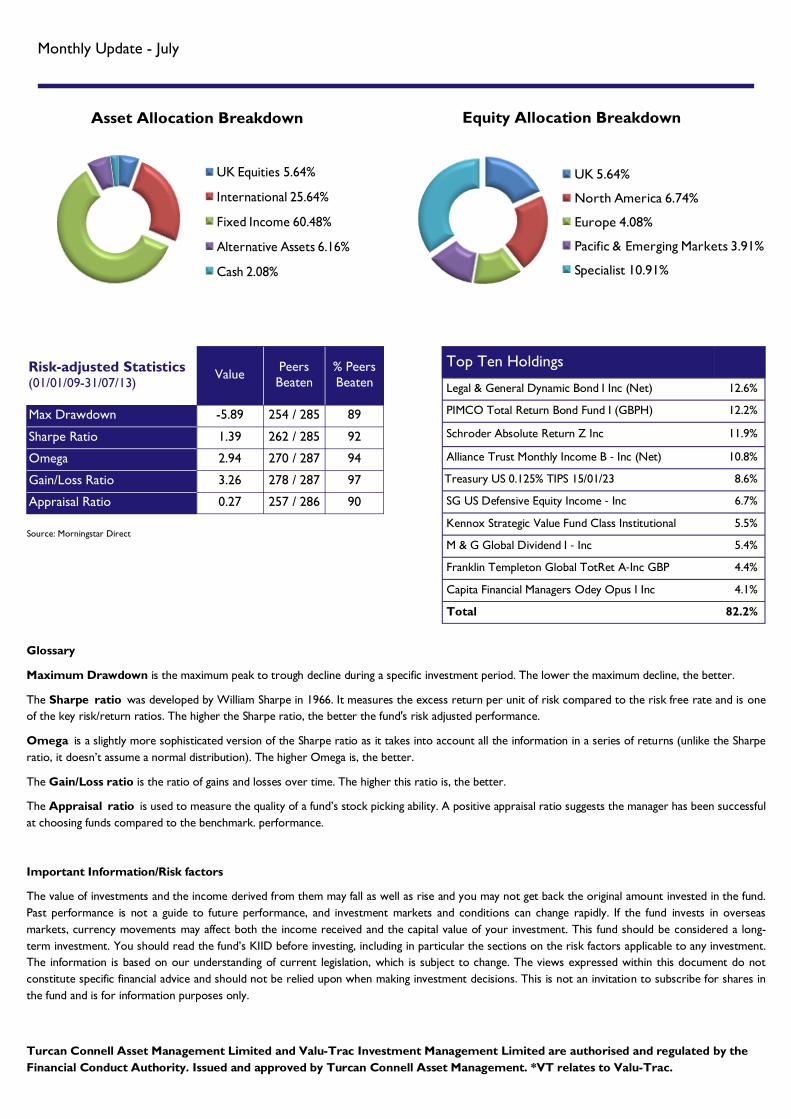
Asset Allocation Breakdown Equity Allocation Breakdown
Top Ten Holdings
Legal & General Dynamic Bond I Inc (Net) 12.6%
PIMCO Total Return Bond Fund I (GBPH) 12.2%
Schroder Absolute Return Z Inc 11.9%
Alliance Trust Monthly Income B ‐ Inc (Net) 10.8%
Treasury US 0.125% TIPS 15/01/23 8.6%
SG US Defensive Equity Income ‐ Inc 6.7%
Kennox Strategic Value Fund Class Institutional 5.5%
M & G Global Dividend I ‐ Inc 5.4%
Franklin Templeton Global TotRet A‐Inc GBP 4.4%
Capita Financial Managers Odey Opus I Inc 4.1%
Total 82.2%
Risk-adjusted Statistics
(01/01/09-31/07/13) Value
Peers
Beaten
% Peers
Beaten
Max Drawdown -5.89 254 / 285 89
Sharpe Ratio 1.39 262 / 285 92
Omega 2.94 270 / 287 94
Gain/Loss Ratio 3.26 278 / 287 97
Appraisal Ratio 0.27 257 / 286 90
Glossary
Maximum Drawdown is the maximum peak to trough decline during a specific investment period. The lower the maximum decline, the better.
The Sharpe ratio was developed by William Sharpe in 1966. It measures the excess return per unit of risk compared to the risk free rate and is one
of the key risk/return ratios. The higher the Sharpe ratio, the better the fund's risk adjusted performance.
Omega is a slightly more sophisticated version of the Sharpe ratio as it takes into account all the information in a series of returns (unlike the Sharpe
ratio, it doesn’t assume a normal distribution). The higher Omega is, the better.
The Gain/Loss ratio is the ratio of gains and losses over time. The higher this ratio is, the better.
The Appraisal ratio is used to measure the quality of a fund’s stock picking ability. A positive appraisal ratio suggests the manager has been successful
at choosing funds compared to the benchmark. performance.
Important Information/Risk factors
The value of investments and the income derived from them may fall as well as rise and you may not get back the original amount invested in the fund.
Past performance is not a guide to future performance, and investment markets and conditions can change rapidly. If the fund invests in overseas
markets, currency movements may affect both the income received and the capital value of your investment. This fund should be considered a long-
term investment. You should read the fund’s KIID before investing, including in particular the sections on the risk factors applicable to any investment.
The information is based on our understanding of current legislation, which is subject to change. The views expressed within this document do not
constitute specific financial advice and should not be relied upon when making investment decisions. This is not an invitation to subscribe for shares in
the fund and is for information purposes only.
UK Equities 5.64%
International 25.64%
Fixed Income 60.48%
Alternative Assets 6.16%
Cash 2.08%
UK 5.64%
North America 6.74%
Europe 4.08%
Pacific & Emerging Markets 3.91%
Specialist 10.91%
Source: Morningstar Direct


![view resource [PDF 1MB]](https://img.pdfslide.us/doc/110x75/586914821a28ab17578be6d6/view-resource-pdf-1mb.jpg)


![Slide Presentation [PDF, 1MB]](https://img.pdfslide.us/doc/110x75/58a2ea4c1a28abd8728c4726/slide-presentation-pdf-1mb.jpg)


![Highland Perthshire [1Mb]](https://img.pdfslide.us/doc/110x75/586ba93e1a28aba47b8c4425/highland-perthshire-1mb.jpg)


![Market Position Statement [1Mb]](https://img.pdfslide.us/doc/110x75/58a2e6f91a28ab4c028b89a4/market-position-statement-1mb.jpg)
![Download file [1mb]](https://img.pdfslide.us/doc/110x75/5875ed8b1a28abe01d8b5089/download-file-1mb.jpg)