Embed Size (px)
Citation preview

CEZ GROUP: THE LEADER IN POWER MARKETS
OF CENTRAL AND SOUTHEASTERN EUROPE
Investment story, December 2015

AGENDA
1
Introduction
Financial performance
Strategic priorities
Backup
Expected development of installed capacity
Electricity market fundamentals
Energy policy developments
Regulation of distribution
Support of renewables
Latest financial results
1
13
20
32
33
35
37
41
45
48

2
KEY MESSAGES
Attractive assets
Low costs conventional generation
is a great advantage in low price
environment
Our electricity generation benefits
from rising price of CO2
Regulation of Czech distribution
supportive
Foreign operations stabilised
Strong financials
Hedging provides cushion to our
margins
Capex declining to maintenance
levels
Free cash flow remains very strong
Low leverage and strong credit
rating
Updated dividend policy with
highest payout within sector
CEZ GROUP IS AN INTERNATIONAL UTILITY
WITH A STRONG POSITION IN CEE
Source: 2014 data, EUR/CZK=27.533
Energy Assets
CEZ Group in the Czech Republic
Installed capacity (MW) 13,470
Electricity generation, gross (TWh) 58.3
Generation market share 68%
Distributed electricity (TWh) 32.7
Distribution market share 57%
Number of employees 20,503
Sales (EUR million) 5,547
CEZ Group in Poland
(100% stake in Skawina, 100% in Elcho)
Installed capacity (MW) 681
Electricity generation, gross (TWh) 2.6
Generation market share 1.8%
Number of employees 396
Sales (EUR million) 156
CEZ Group in Romania
(100% stakes in CEZ Distributie, CEZ Vanzare, Tomis Team,
Ovidiu Development, TMK Hydroenergy Power)
Installed capacity (MW) 622
Electricity generation, gross (TWh) 1.3
Generation market share 2.1%
Distributed electricity (TWh) 6.3
Distribution market share 14%
Number of employees 1,792
Sales (EUR million) 429
CEZ Group in Bulgaria
(67% stake in CEZ Razpredelenie Bulgaria, CEZ Electro
Bulgaria, 100% in TPP Varna, 100% in Free Energy Project
Oreshets )
Installed capacity (MW) 1,265
Electricity generation, gross (TWh) 0.9
Generation market share 2.3%
Distributed electricity (TWh) 9.1
Distribution market share 29%
Number of employees 3,530
Sales (EUR million) 882
CEZ Group in Turkey
(50% stake in SEDAS through AkCez, 37.36% stake in
Akenerji)
Installed capacity (MW) 1,289
Electricity generation, gross (TWh) 2.7
Generation market share 1.1%
Distributed electricity (TWh) 8.0
Distribution market share 3%
3

CEZ IS A STRONG AND VERTICALLY INTEGRATED
PLAYER IN THE CZECH ELECTRICITY MARKET
Source: CEZ, ERU, MPO, companies´ data;
data for 2014 (distribution data for 2013)
CEZ fully owns the
largest Czech
mining company
(SD) covering 71%
of CEZ’ s lignite
needs
Remaining 3 coal
mining companies
are privately owned
The Czech
transmission grid is
owned and
operated by CEPS,
100% owned by
the Czech state
Lignite mining Generation Transmission Distribution Supply
CEZ
Others
5 out of 8
distribution
regions
61% of customers
57%
21.6 million tons
2014
43%
16.6 million tons
68%
58.3TWh
32%
27.9 TWh
100%
64.3 TWh 63%
36 TWh 39% of customers
Other competitors –
individual IPPs Other competitors –
E.ON, RWE/EnBW
4
37%
21 TWh
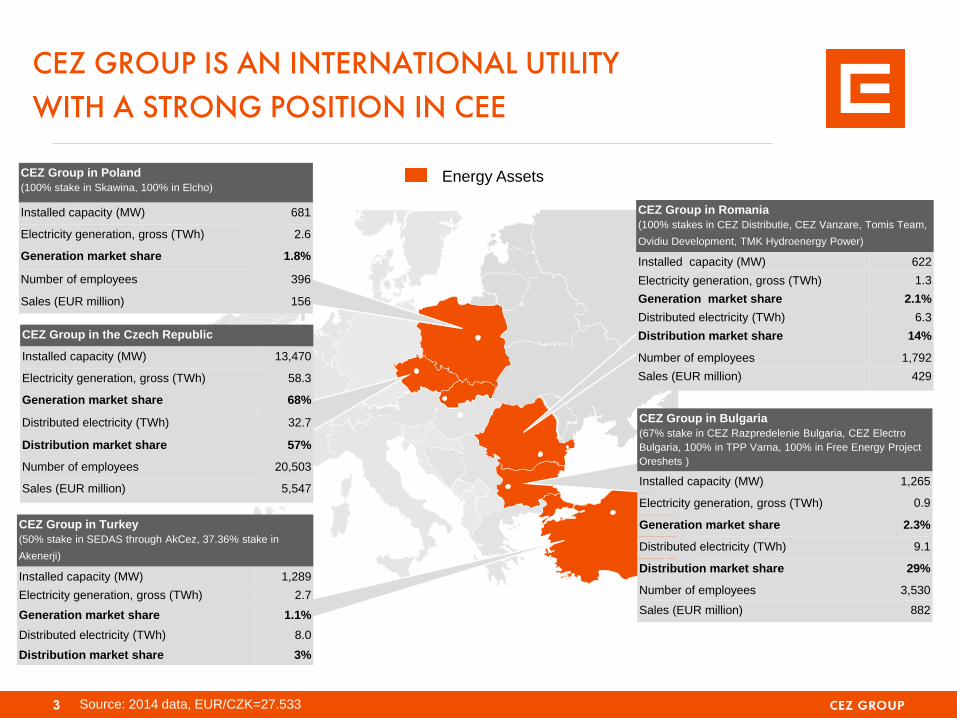
CEZ GROUP RANKS AMONG THE TOP 10 LARGEST
UTILITY COMPANIES IN EUROPE
Source: Bloomberg, Annual reports, companies´ websites and presentations
Top 10 European power utilities
Number of customers in 2014, in millions
PGE 10
Enel 1
EdF 2
Iberdrola 3
E.ON 4
RWE 5
Engie 6
CEZ Group 8
EnBW 9
EdP 7
61.0
38.5
32.6
23.4
23.2
21.6
5.2
5.2
11.0
7.3
5
Top 10 European power utilities
Market capitalization in EUR bn, as of November 18, 2015
10
1
2
3
4
5
6
8
9
7
41.5
40.4
38.3
28.2
18.2
12.5
11.9
9.3
7.0
6.5
EdF
Iberdrola
Engie
E.ON
Enel
CEZ Group
Fortum
EdP
PGE
RWE

6
CEZ GROUP OPERATES LOW COST GENERATION
FLEET, …
Installed capacity and generation (2014)
CEZ has a long-term competitive
advantage of low and relatively stable
generation costs
2,729 4.1
4,290 30.3
5,356
22.6
2,817
5.9 845
0.2
Installedcapacity
Generation,gross
Hydro and
renewables
Lignite /
Brown coal
Nuclear
16,038 MW 63.1 TWh
Share on
generation
48%
6%
36%
Black coal
9% Coal power plants are using mostly
lignite from CEZ’s own mine
(71% of lignite needs sourced internally,
remaining volume through long-term
supply contracts)
Nuclear plants have very low
operational costs
CCGT

,… WHICH IS A GREAT ADVANTAGE IN THE
CURRENT LOW PRICE ENVIRONMENT
7
25
30
35
40
45
50
55
60
65
Price of electricity (year-ahead baseload, €/MWh)
Czech Republic Germany
Drivers of electricity price
Decline of hard coal prices by 40% due to shale gas discoveries in the US and declining Chinese imports
Decline in carbon prices by 70% until 2013, recovery by 100% afterwards thanks to approval of market stability reserve
Growing capacity of subsidized renewables at the time of stagnating/declining electricity demand
23
13
6
-8 Nuclear** Lignite ** Hard Coal CCGT
Clean spreads by technology at current forward electicity price* (€/MWh)
** Nuclear fuel costs and CZK50/MWh payment for fuel storage, cash cost of extracting own lignite are taken into consideration
* 2015 production of CEZ hedged 11 €/MWh above
current forwards

28
30
32
34
36
THE ELECTRICITY PRICES HAVE DECLINED BY MORE
THAN 5 EUR/MWH OVER THE LAST YEAR
Electricity
November
2014
Gas price
decline (from
24,2 to 17,8
EUR/MWh)
Electricity
November
2015
Electricity price change decomposition Cal16 (9/2014 – 9/2015)
EEX, EUR/MWh
CO2 price
growth
(from 7,3
EUR/t to 8,7
EUR/t)
34.5 -5.3
+1.3
29.3
Coal price
decline
(from 73 to
46 USD/t)
Other,
market
expectation
+1.5 -1.4
Continuing
oversupply on
global coal
markets (China
slowdown)
8
Stronger
USD (more
expensive
coal
imports)
-1.3

18.8
16.4
13.5
10.9
8.2
5.6
3.0
0.4
2013 2014 2015 2016 2017 2018 2019 2020
heat production
electricity production
CEZ GROUP CONTINUES TO RECEIVE PART
OF EMISSION ALLOWANCES FOR FREE
CEZ Group can get up to 70.2 million emission allowances for electricity production in the Czech
Republic in 2013–2019* in exchange for investments reducing greenhouse gas emissions.
EC Commission has proposed that free allocation of up to 40% of emission allowances will continue
post 2020.
9
68%** 66% 55% 44% 33% 23% 12% 2%
Expected allocation of allowances for CEZ Group in the Czech Republic (millions)
Allocation
as a % of emissions
of 2014
* The volume of allocated allowances decreases over years to zero allocation in 2020, ** % of 2013 emissions

10
CEZ GROUP’S CO2 INTENSITY IS BELOW INTENSITY
OF A EUROPEAN PRICE SETTING PLANT
Carbon intensity of selected European utilities
(2014, t/MWh)
0.0
0.2
0.4
0.6
0.8
1.0
1.2
1.4
High Medium Low
Increase in CO2 price has a positive impact on CEZ
profitability
Marginal European
price setting plants
have an emission
factor of 0.8 t/MWh

11
PERFORMANCE OF FOREIGN ASSETS HAS
STABILISED
Romania
In September 2015 temporary
accreditation of green certificates
approved for wind parks, tradability of
the second certificate remains
postponed until 2018-2020
Bulgaria
Varna power plant is shut down since
January 2015 and thus losses were
eliminated
Poland
Turbines at Skawina were modernized
Albania
Settlement agreement reached in 2014,
out of €100m compensation already
€36.75m received
0.0
1.0
2.0
3.0
4.0
5.0
6.0
7.0
8.0
9.0
2011 2012 2013 2014
EBITDA of foreign operations (CZK bn)
Losses in
Albania

CZECH DISTRIBUTION: PROPOSED PARAMETERS
OF NEW REGULATORY PERIOD ARE ENCOURAGING
12
Key parameters for the regulatory period starting in 2016 are agreed, tariff decision
expected at the end of November:
Regulation supports investments in anticipation of the growth in decentralized
generation => regulator is proposing increase of WACC, requires CAPEX at least
amounting to depreciation
Regulation motivates distributors to improve efficiency => allowed costs will be
reset to reflect level of costs in 2012-2013, costs will be indexed to inflation minus
1.01% of efficiency factor
Czech distribution 2014 2015 2016-2018
RAB (CZK m) 82,503 85,476
EBITDA (CZK m) 15,819 ~ stable
EBITDA as % of total 22% ~ stable
WACC
(nominal, pre-tax) 5.554% 6.146% 7.951%

AGENDA
13
Introduction
Financial performance
Strategic priorities
Backup
Expected development of installed capacity
Electricity market fundamentals
Energy policy developments
Regulation of distribution
Support of renewables
Latest financial results
1
13
20
32
33
35
37
41
45
48
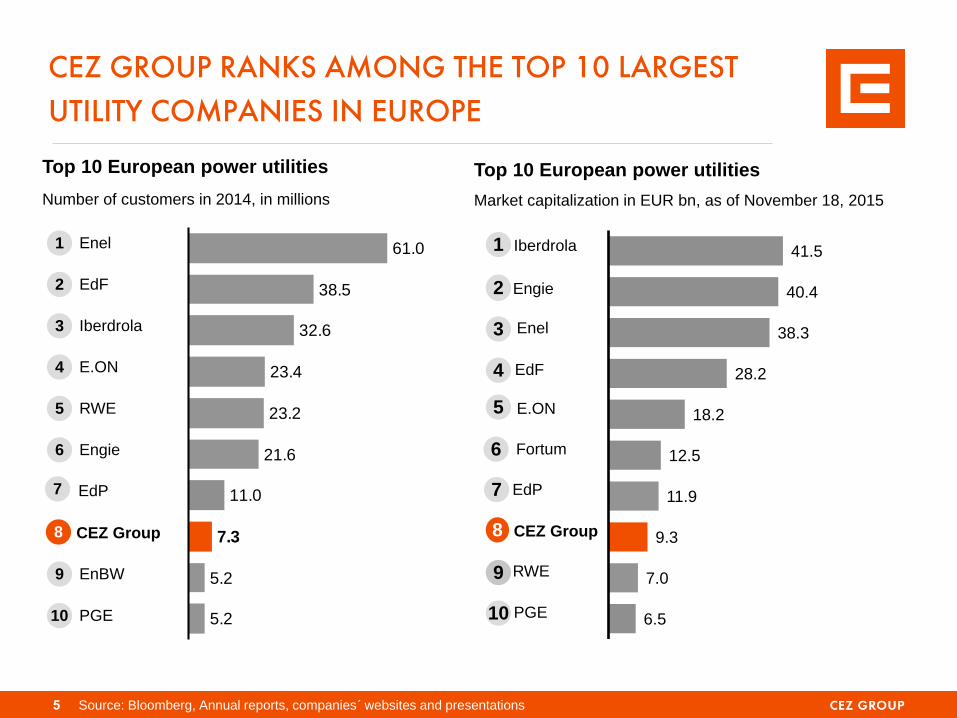
LARGE PART OF PRODUTION FOR THE NEXT 3 YEARS
IS ALREADY HEDGED AT ATTRACTIVE PRICE LEVELS
Share of hedged production of ČEZ* power plants as of Oct 31, 2015 (100% corresponds to 56–58 TWh)
Hedged volume as of Jul 31, 2015
Hedged volume from Jul 31, 2015 to Oct 31, 2015
Transaction currency hedging
Natural currency hedging—debts in EUR, capital
and other expenditure and costs in EUR
Source: ČEZ ČEZ*—ČEZ, a. s. including Energotrans and spun-off coal-fired power plants in Počerady and Dětmarovice 14
Hedged price (EUR/MWh, BL
equivalent)
35.0 33.0 34.5 39.5 41.0 36.5 40.5 40.0
0%
25%
50%
75%
100%
2015 2016 2017 2018 2019 2020 2021 2022
26%
56%
9% 11%
1% 1%
85% 86%

68.0 64.0
0
20
40
60
80
100
2015 E (Aug 11) 2015 E
WE EXPECT ANNUAL 2015 EBITDA OF CZK 64BN,
ADJUSTED NET INCOME AT THE LEVEL OF CZK 27BN
27.0 27.0
0
10
20
30
40
2015 E (Aug 11) 2015 E
EBITDA
ADJUSTED NET
INCOME
CZK bn
Selected negative effects not anticipated in
Aug 11 Guidance:
Unplanned outages at Dukovany NPP
(2.8 TWh) relating to comprehensive inspection
of welds
Extended planned outages and unplanned
outages at Temelín NPP (0.9 TWh)
Postponed completion of upgrades to coal-fired
plants in the Czech Rep. and operation of
existing coal-fired plants
Selected positive effects not anticipated in
Aug 11 Guidance:
Extraordinary income from the refund of a
portion of gift tax on emission allowances for
2011 and 2012 (income not included in
EBITDA)
Higher cuts in fixed operating costs
Adjusted net income = Net income adjusted for extraordinary effects that are generally unrelated to ordinary financial performance in a given year
CZK bn
15
-6%

0.0
0.5
1.0
1.5
2.0
2.5
0.0
10.0
20.0
30.0
40.0
50.0
60.0
70.0
2006
2007
2008
2009
2010
2011
2012
2013
2014
2015F
2016F
2017F
2018F
2019F
EXTENSIVE CAPEX PROGRAM IS ALMOST COMPLETED
2014 capex breakdown:
CZK 20.1 bn Generation
CZK 9.5 bn Distribution
CZK 2.5 bn Mining
CZK 2.4 bn Others
CAPEX development
Other (including consolidation adjustments)
Distribution and sales – domestic
Generation and trading
Distribution and sales – foreign
Mining
CAPEX breakdown:
Note: Exchange rate CZK/EUR = 27.725
CZK bn EUR bn
16

10
-12
12 9 11
32 36
22
-20
-10
0
10
20
30
40
Free Cash Flow* (CZK bn)
FREE CASH FLOW GENERATION REMAINS VERY
STRONG
17
* Operating cash flow minus investments into fixed assets
We anticipate continued
pressure on margins in
our generation business
given the current forward
prices of electricity
The extensive
investments into
upgrades of our lignite
plans are being finalized
this year and thus
CAPEX will drop to
maintenance levels from
2016

OUR CURRENT LEVERAGE IS LOW COMPARED TO
INDUSTRY STANDARDS
Medium-term target
leverage remains intact:
Net debt/EBITDA ratio
at 2.0-2.5x
Our leverage target is
consistent with current
credit rating
A- from S&P
A3 from Moody’s
Net economic debt/ EBITDA*
Multiples, 2014
5.2
5.0
4.6
4.2
4.0
3.9
3.7
2.9
2.7
2.5
2.3
0.3
EDP
Verbund
EDF
RWE
EON
Iberdrola
EnBW
Engie
Enel
CEZ
Fortum
PGENet financialdebt/EBITDA
Net economicdebt**/ EBITDA
2.0
Average 3.4x
*EBITDA as reported by companies, ** Net economic debt= net financial debt + nuclear provisions + provisions for employee pensions + reclamation
provision
18

8 9 15
20
40 50 53 50
45 40 40 40
49%
40% 41% 43%
50%
56% 55% 57% 59%
54%
61%
73%
0%
10%
20%
30%
40%
50%
60%
70%
80%
2003 2004 2005 2006 2007 2008 2009 2010 2011 2012 2013 2014
Dividend per share (CZK) Payout ratio
DIVIDEND POLICY IS TO DISTRIBUTE 60 – 80 % OF
ADJUSTED NET INCOME
19
Payout ratio (%)
AGM on June 12,
2015 approved
management
proposal of CZK
40 per share
dividend from
2014 profits
Dividend payment
started on August
3, 2015

AGENDA
20
Introduction
Financial performance
Strategic priorities
Backup
Expected development of installed capacity
Electricity market fundamentals
Energy policy developments
Regulation of distribution
Support of renewables
Latest financial results
1
13
20
32
33
35
37
41
45
48

CEZ GROUP’S STRATEGY IS BUILT ON THREE PILLARS
21
We want to operate power
assets as efficiently as
possible from the point of
view of both shareholders
and customers
We want to pro-actively
react now to the future
design of power sector with
a large proportion of
decentralized and zero-
emission production and
diminishing differences
between producers and
consumers
Be among the best in the
operation conventional
electricity generation
and proactively respond to the
challenges of the 21st century
We want to offer our
customers partnership,
expertise, tools, and
financing to meet their
energy needs - our
customers are much more
active in the control of their
electricity and gas
consumption and use in
general as well as in their
own production
We want to complement this
with additional products that
have synergy with
electricity and gas sales
Offer customers a wide
range of products and
services addressing their
energy needs
We want to maintain our
position among the top 10
energy companies in Europe
take advantage of major
synergies in the operation of
our assets and when offering
new products and servicing
customers
We focus our attention on
regions and countries that
are close to both CEZ and the
Czech Republic in terms of
energy markets, economy,
politics and culture; however,
undisputed profitability
remains the key indicator
Strengthen and consolidate
our position in Central Europe I II III
Vision: deliver innovative solutions to energy needs and contribute to a better quality of life.
Mission: guarantee safe, reliable and positive energy to our clients and the society as a whole.

Focus on operational efficiency
as a prerequisite for further
existence in both conventional and
new energy
Ensure long-term operation of
the Dukovany Power Plant
Complete the renovation of
brown coal-fired power plants and
phase out older condensing
units
Develop new unit projects at
Temelín and Dukovany
Continually improve distribution
grid efficiency to allow a real
decrease in distribution tariffs as
well as ensure stable cash flows
Be among the best
in the operation of
conventional power facilities
and proactively respond to the
challenges of the 21st century Achieve the top level
in el. and gas sales and in
customer care
Develop additional products
and make use of synergies with
energy commodities
Launch new business models—
from equipment deliveries to
electricity generation and supply
at the customer’s point of
consumption
Invest in opportunities and
technologies at an early stage to
allow ČEZ to establish promising
positions in future energetics
Prepare distribution grids for
operation under the conditions of
increasingly decentralized
generation
Offer customers
a wide range of products
and services addressing their
energy needs
Strive to acquire
assets/companies in countries
with stable national regulatory
environments that are close to
ČEZ and the Czech Rep. both:
- RESs
- Distribution companies
- Sales companies supplying
energy and related products to
end customers
- Developing new products and
services that are auspicious
from the point of view of future
energetics
- Conventional energy
Reduce risk profile—optimize
capital and ownership structure,
including divestment of selected
assets
Strengthen
and consolidate
our position in
Central Europe
I II III
SPECIFIC STEPS TO IMPLEMENT THE STRATEGY HAVE
BEEN DEFINED
22 RESs—Renewable Energy Sources
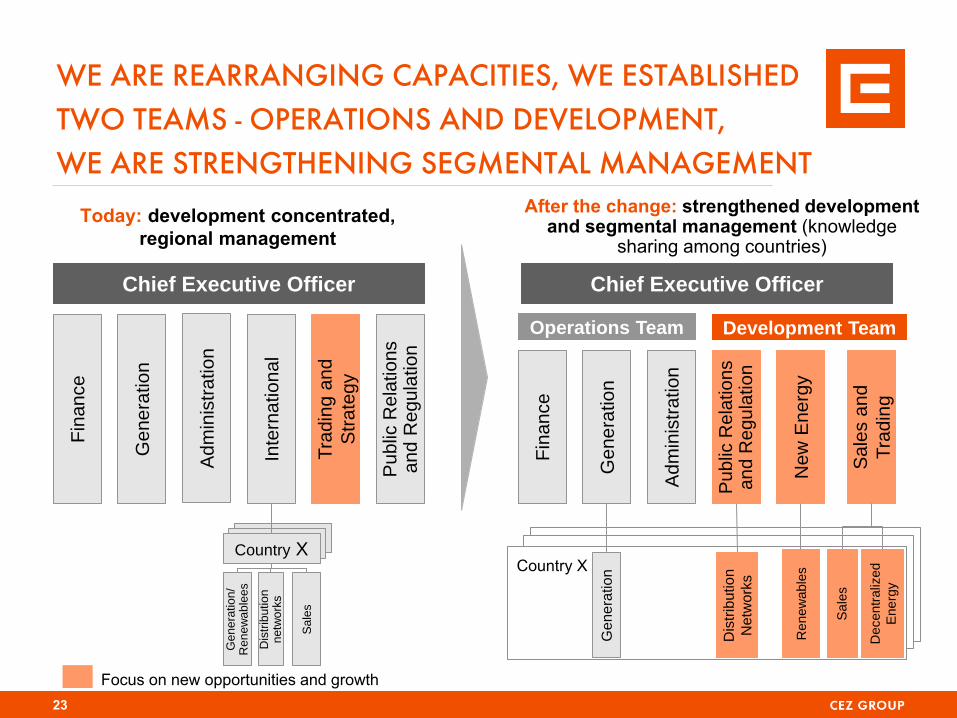
Today: development concentrated,
regional management
23
WE ARE REARRANGING CAPACITIES, WE ESTABLISHED
TWO TEAMS - OPERATIONS AND DEVELOPMENT,
WE ARE STRENGTHENING SEGMENTAL MANAGEMENT
Chief Executive Officer Chief Executive Officer
Fin
ance
Genera
tion
Adm
inis
tration
Inte
rna
tion
al
Tra
din
g a
nd
Str
ate
gy
Public
Rela
tions
and R
egula
tion
Fin
ance
Genera
tion
Adm
inis
tration
Public
Rela
tio
ns
an
d R
egu
lation
New
Energ
y
Sale
s a
nd
Tra
din
g
Operations Team Development Team
After the change: strengthened development and segmental management (knowledge
sharing among countries)
Focus on new opportunities and growth
Ge
nera
tion/
Renew
able
es
Dis
trib
ution
netw
ork
s
Sale
s
Country X
Genera
tio
n
Dis
trib
utio
n
Netw
ork
s
Re
new
able
s
De
centr
aliz
ed
En
erg
y
Country X
Sa
les

DESPITE LOWER VOLUMES FROM NUCLEAR POWER
PLANTS IN 2015 CEZ EXPECTS TO INCREASE OUTPUT
IN THE FOLLOWING YEARS
Dukovany
Unplanned outages relating to comprehensive inspection of welds (-2.8 TWh), which involve mostly
taking new X-ray images of weld joints.
We have applied for license extension of Unit 1 at Dukovany, which completes project of extending
the plant operation beyond its original design lifetime of 30 years.
During 2005-2012 capacity increased by 240 MW to 2,000 MW
Temelin
Extended outages (-0.9 TWh), repair of the steam generator of Unit 2
During 2008-2013 capacity increased by 160 MW to 2,160 MW
24
27.2 28.0 28.3 30.2 30.7 30.3 27.0
32.3
2009 2010 2011 2012 2013 2014 2015F 2016F
Nuclear Generation volumes (TWh)
+19%
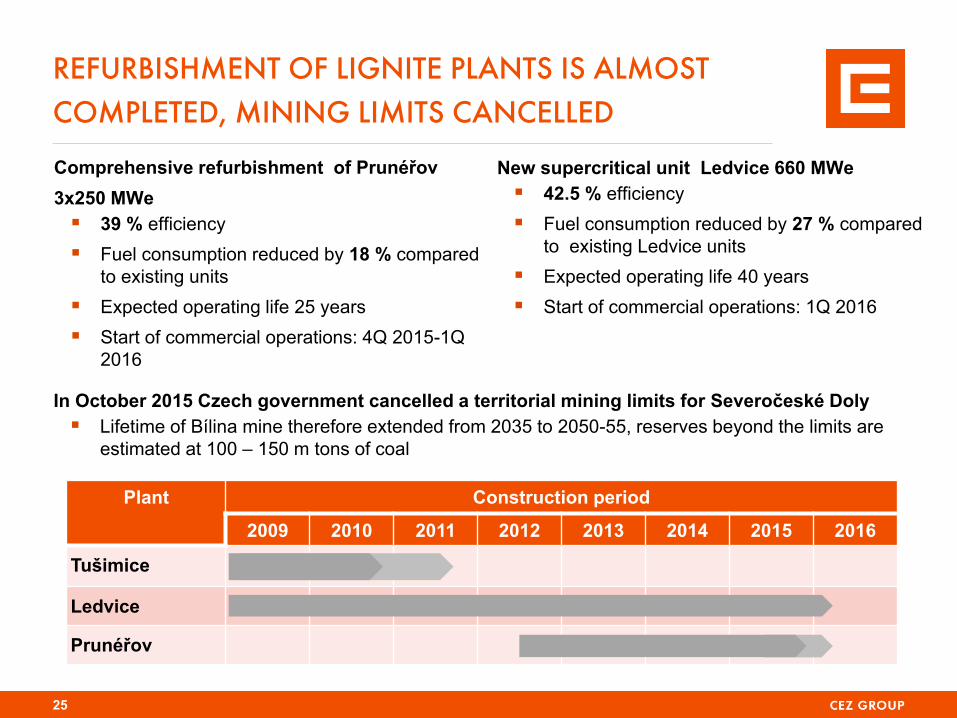
REFURBISHMENT OF LIGNITE PLANTS IS ALMOST
COMPLETED, MINING LIMITS CANCELLED
25
Comprehensive refurbishment of Prunéřov
3x250 MWe
39 % efficiency
Fuel consumption reduced by 18 % compared
to existing units
Expected operating life 25 years
Start of commercial operations: 4Q 2015-1Q
2016
Plant Construction period
2009 2010 2011 2012 2013 2014 2015 2016
Tušimice
Ledvice
Prunéřov
New supercritical unit Ledvice 660 MWe
42.5 % efficiency
Fuel consumption reduced by 27 % compared
to existing Ledvice units
Expected operating life 40 years
Start of commercial operations: 1Q 2016
In October 2015 Czech government cancelled a territorial mining limits for Severočeské Doly
Lifetime of Bílina mine therefore extended from 2035 to 2050-55, reserves beyond the limits are
estimated at 100 – 150 m tons of coal

+4.9
+1.5
Fixed operatingcosts reduction
Gross marginimprovement
WE FULFILLED OUR COST-CUTTING AMBITION
FOR 2015
Impact of proactive measures on 2015 EBITDA
(CZK bn)
Measures in 2015
CZK +6.4 bn
By active measures across the whole CEZ Group we managed to contribute to improvement of
EBITDA of 2015 by CZK 6.4 bn compared to the original business plan.
2015 budget envisages a reduction in fixed costs by CZK 4.9 billion and increase in margin on
new opportunities and optimization by CZK 1.5 billion compared to the last year's plan.
CEZ Corporate headquarters made a commitment to reduce fixed costs by 24 % in 2015 with
comparison to the last year‘s plan.
All cost-cutting measures respect the condition of compliance with all safety, legal, and
regulatory requirements
26

27
ČEZ ESCO estabilished in November 2014
ČEZ ESCO is undertaking all activities relating to deliveries of
energy commodities, distributed energy technology, energy
savings, and services for large and medium-sized customers
During 2015 it took over shares in ČEZ Energo, ČEZ
Energetické služby and EVČ.
Successful steps
It is a leader in small cogeneration, during 2015 it commisioned further 15 MW of capacity
on top of 53 MW operated in 2014
We are undertaking 4 large projects of energy construction (consumption optimization,
quality of electricity supply and public lighting)
Through acquisition of 75% stake in EVČ we gained significant market share in
construction in the field of energy and heat management and special energy-saving
projects.
In October 2105 we started to offer turn-key installation of solar panels on customers’
rooftops
ČEZ ESCO – ENERGY SOLUTIONS FOR CORPORATE
CUSTOMERS AND MUNICIPALITIES

-5,694
-2,529
7-9/ 2014 7-9/ 2015
Electricity—Reduction of Connection
Points in the Residential Segment
(Comparison of Quarterly Changes)
WE MAINTAIN YEAR-ON-YEAR GROWTH IN GAS
CUSTOMERS AND REDUCE MOTIVATION TO LEAVE FOR
ELECTRICITY CUSTOMERS
28
Gas—Growth of Connection Points in
the Residential Segment
(Comparison of Quarterly Changes) ČEZ Prodej remains the largest
alternative gas supplier in the Czech
Rep. in terms of connection points and
successfully continues to grow.
At the end of September, ČEZ Prodej
delivered gas to more than 378,000
customers.
Since the beginning of the year, we have
managed to cut the number of leaving
customers by almost two-thirds year-on-
year.
The main reason for decreasing
motivation to switch to a competitor is
our offer of high-quality products and
services.
7,568 7,217
7-9/ 2014 7-9/ 2015

29
WE ARE DEVELOPING 258 MW OF WIND FARM PROJECTS IN POLAND
In Poland, a new renewables act was passed
with effect from Jan 1, 2016, introducing a
new support mechanism, an auction system,
and defining qualification requirements.
Two of the most advanced projects of the
developer Ecowind Construction S.A. (35 MW
Krasin project and the 20 MW Suwałki I
project) received EIA permits. EIA decision of
Biskupiec st I (53 MW) was appealed.
Remaining projects (150 MW) are expected
to receive EIA permits in 2016.
We anticipate taking active part already in
Round 1 of a wind farm support auction,
which is expected in Q2 2016.
On Apr 15, 2015 CEZ Group acquired an
additional 25% stake in Ecowind Construction
S.A. in line with the original contract,
becoming its 100% owner.
projects developed by Ecowind

CEZ EXPRESSED INTEREST IN VATTENFALL’S
GERMAN ASSETS
On Oct 13, 2015 CEZ sent a Statement of
Interest to acquire Vattenfall’s German lignite
and hydro activities.
Currently qualification process is ongoing,
Vattenfall aims to finalize the sale in H1 2016
Offered assets represent an interesting
opportunity to expand business of ČEZ with a
number of synergies.
CEZ is ready to be a reliable partner for the
region with extensive know-how in operation of
conventional power plants and of lignite mines.
Assets for sale:
lignite plants with capacity of 8 GW with
related lignite mines
Hydro plants (primarily pump-storage) with
installed capacity of 3 GW
30
Lignite Hydro
Czech
Republic
Germany
Lippendorf
Jänschwalde
Schw.Pumpe
Boxberg

In November, CEZ Group has acquired a minority stake in Sunfire
Sunfire’s flagship product is globally unique reversible fuel cell technology, which is able to convert a fuel
(such as natural gas) into electricity and heat as well as electricity back into hydrogen and other gases
(Power-to-Gas) or synthetic fuels (Power-to-Liquids). This technology represents a major step toward
greater energy self-supply and improved efficiency in the utilization of energy sources.
On July 21, CEZ Group bought into the German company Sonnenbatterie GmbH, the world leader in
the production of battery energy storage systems
The investment had the form of an increase in the company’s registered capital. CEZ Group
acquired a minority stake together with the right to participate in its strategic decision-making.
The company develops, manufactures, and sells smart battery systems for storing energy
from solar panels and other renewable energy sources for households and commercial
customers and their solutions can cut a household’s annual expenditure on electricity supply
by up to 80%.
The company is the world leader operating in seven countries, including the U.S. Up to now,
it has already sold about 8,000 smart energy storage systems.
The investments were made through INVEN CAPITAL, which is a brand used by CEZ Group for
investments in the field of innovative energy solutions. Its objective is to invest in companies focusing on new
decentralized energy and renewables with the potential for quick growth both in the Czech Rep. and abroad.
Its ambition is to acquire 15 to 20 up-and-coming companies worth up to CZK 5bn in total within five years.
31
CEZ INVESTS IN INNOVATIVE ENERGY COMPANIES

AGENDA
32
Introduction
Financial performance
Strategic priorities
Backup
Expected development of installed capacity
Electricity market fundamentals
Energy policy developments
Regulation of distribution
Support of renewables
Latest financial results
1
13
20
32
33
35
37
41
45
48

2.0 2.1 2.1 2.1 2.1
3.9 4.3 4.3 4.3 4.3
5.9 4.6 3.6 2.7 2.0
0.8 2.2 2.2
2.2
2.9 2.8 2.9
1.6 1.6
0.1 1.2 1.3
1.3 1.3
0.4 0.7
1.3
1.3 1.3
CAPEX PROGRAM LED TO A REDUCTION OF THE AVERAGE CO2
EMISSION FACTOR, CARBON INTENSITY WILL FURTHER DECRASE
THANKS TO CLOSURES OF LIGNITE AND COAL POWER PLANTS
33
* includes equity consolidated companies (Akenerji)
0.63 0.49 Emission intensity
(t CO2/MWh supplied)
Expected installed capacity (GW)
(proportionate*)
2014 2015
16.5 17.7
Hydro
Nuclear
Gas
Renewables
Lignite
New/upgraded lignite
Black coal
2020
14.8
39.3 33.7 Total CO2 emissions
(m t CO2) 29.0
0.44
2025
27.8
0.42
15.5
2010
15.2
28.1
0.50

0
10
20
30
40
Ma
y-1
1
Au
g-1
1
No
v-1
1
Fe
b-1
2
Ma
y-1
2
Au
g-1
2
No
v-1
2
Fe
b-1
3
Ma
y-1
3
Au
g-1
3
No
v-1
3
Fe
b-1
4
Ma
y-1
4
Au
g-1
4
No
v-1
4
Fe
b-1
5
Ma
y-1
5
Au
g-1
5
No
v-1
5
Average import
price
0
40
80
120
160
Ma
y-1
1
Au
g-1
1
No
v-1
1
Fe
b-1
2
Ma
y-1
2
Au
g-1
2
No
v-1
2
Fe
b-1
3
Ma
y-1
3
Au
g-1
3
No
v-1
3
Fe
b-1
4
Ma
y-1
4
Au
g-1
4
No
v-1
4
Fe
b-1
5
Ma
y-1
5
Au
g-1
5
No
v-1
5
0
4
8
12
16
20
Ma
y-1
1
Au
g-1
1
No
v-1
1
Fe
b-1
2
Ma
y-1
2
Au
g-1
2
No
v-1
2
Fe
b-1
3
Ma
y-1
3
Au
g-1
3
No
v-1
3
Fe
b-1
4
Ma
y-1
4
Au
g-1
4
No
v-1
4
Fe
b-1
5
Ma
y-1
5
Au
g-1
5
No
v-1
5
34
HISTORICAL DEVELOPMENT OF PRICES OF INPUT
COMMODITIES
Oil Brent (USD/bl)
CO2 allowances (EUR/t) Coal (t)
Gas (EUR/MWh, in Germany)
NCG (spot)
Note: next month deliveries, spot, CO2 – Mid Dec delivery
EUR
USD
0
30
60
90
120
150
Ma
y-1
1
Au
g-1
1
No
v-1
1
Fe
b-1
2
Ma
y-1
2
Au
g-1
2
No
v-1
2
Fe
b-1
3
Ma
y-1
3
Au
g-1
3
No
v-1
3
Fe
b-1
4
Ma
y-1
4
Au
g-1
4
No
v-1
4
Fe
b-1
5
Ma
y-1
5
Au
g-1
5
No
v-1
5
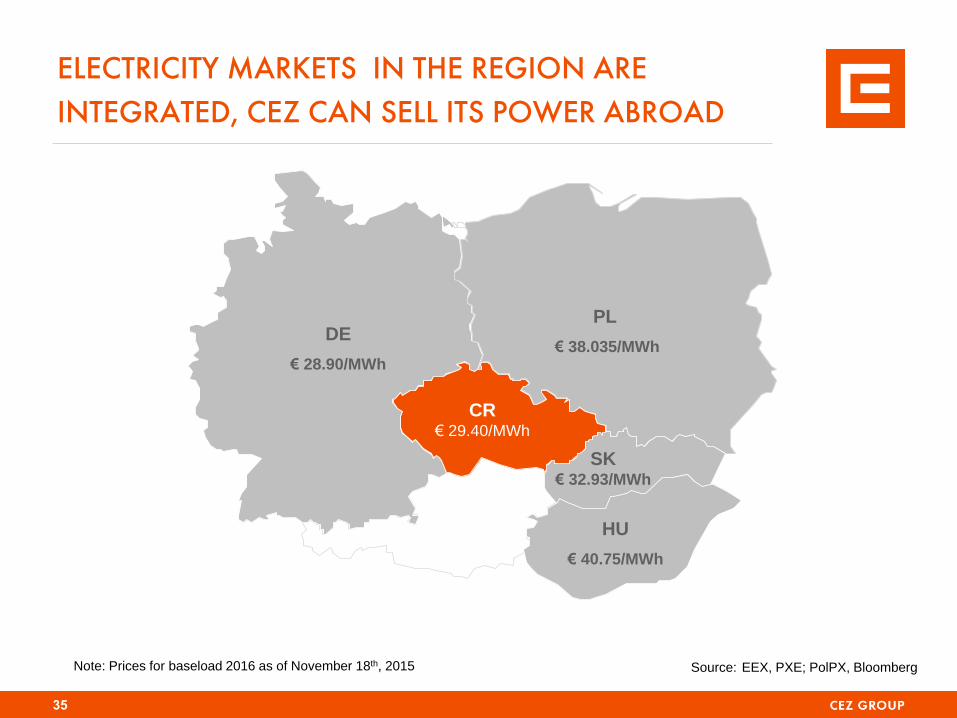
ELECTRICITY MARKETS IN THE REGION ARE
INTEGRATED, CEZ CAN SELL ITS POWER ABROAD
Source: EEX, PXE; PolPX, Bloomberg
DE
€ 28.90/MWh
CR € 29.40/MWh
SK € 32.93/MWh
HU
€ 40.75/MWh
PL
€ 38.035/MWh
Note: Prices for baseload 2016 as of November 18th, 2015
35

TEMPERATURE ADJUSTED ELECTRICITY DEMAND GREW
BY 2.1% IN THE CZECH REPUBLIC IN Q1 - Q3 2015
36 Source: CEZ, ERU
Monthly development in Czech electricity
(y-oy change, temperature & calendar adjusted)*
In Q1 – Q3 2015 temperature & calendar adjusted electricity consumption increased by 2.0% y-o-y in the Czech
Republic*
Czech unadjusted consumption in Q1 – Q3 2015 grew by 2.6%, of which:
+2.9% large industrial companies
+3.4 % households
+1.6% small businesses
60.5
57.1
59.3 58.6 58.8 58.7
57.2
50
52
54
56
58
60
62
2008 2009 2010 2011 2012 2013 2014
Electricity demand in the Czech Republic (TWh)
-4%
-2%
0%
2%
4%
6%
* Adjusted as per ČEZ Distribuce, a. s. model
2012:-0.7% 2013:-0.2% 2014: 1.3%

CZECH GOVERNMENT APPROVED ENERGY POLICY AND
NUCLEAR ACTION PLAN
Goals of State Energy Policy
Preservation of the existing full independence in heat and electricity supply but without any major exports of
generated energy
Achieving diversification through the development of nuclear energy, need for new nuclear units now
anticipated only in 2035 (2025 previously)
In October 2015 MIT cancelled a territorial mining limits for Severočeské Doly: lifetime of Bílina mine therefore
extended from 2035 to 2050-55, reserves beyond the limits are estimated at 100 – 150 m tons of coal
The National Action Plan for Nuclear Energy
Creation of a special company (SPV) that will acquire all relevant assets for the construction of nuclear units at
both existing sites
Initiation of preparations for EPC contractor selection in accordance with the selected business model
Negotiations with the European Commission on the contractor selection method, method of financing and
ensuring economic return
Continued preparation of the 2-unit project variants at both Temelín and Dukovany sites with anticipated
construction of 1 unit and possible expansion to 2 units at either location. The number of units and the order of the
sites is to be decided on later.
Re-evaluating, at the latest before the building permit is issued, whether there is still a need for the construction of a
new nuclear facility and whether or not the market situation has stabilized to allow commercial construction, i.e. with
no need for government guarantees
37 MIT—Ministry of Industry and Trade of the Czech Republic; SG—Smart Grids
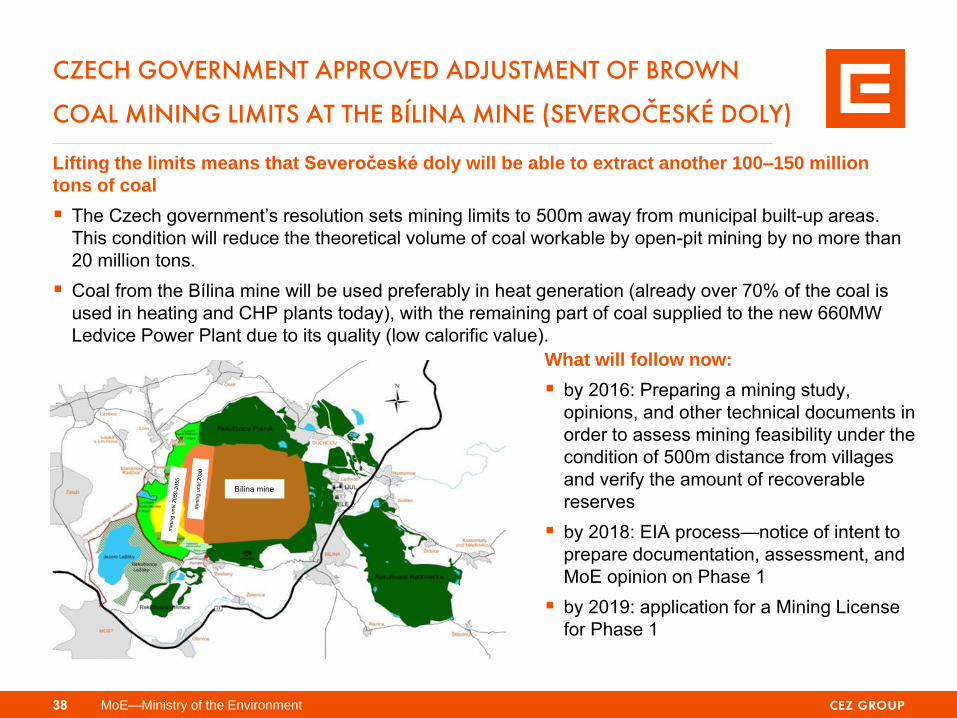
Lifting the limits means that Severočeské doly will be able to extract another 100–150 million
tons of coal
The Czech government’s resolution sets mining limits to 500m away from municipal built-up areas.
This condition will reduce the theoretical volume of coal workable by open-pit mining by no more than
20 million tons.
Coal from the Bílina mine will be used preferably in heat generation (already over 70% of the coal is
used in heating and CHP plants today), with the remaining part of coal supplied to the new 660MW
Ledvice Power Plant due to its quality (low calorific value).
38
CZECH GOVERNMENT APPROVED ADJUSTMENT OF BROWN
COAL MINING LIMITS AT THE BÍLINA MINE (SEVEROČESKÉ DOLY)
What will follow now:
by 2016: Preparing a mining study,
opinions, and other technical documents in
order to assess mining feasibility under the
condition of 500m distance from villages
and verify the amount of recoverable
reserves
by 2018: EIA process—notice of intent to
prepare documentation, assessment, and
MoE opinion on Phase 1
by 2019: application for a Mining License
for Phase 1
MoE—Ministry of the Environment
Bílina mine

EUROPEAN UNION IS PROGRESSING WITH REFORM
OF ITS EMISSION TRADING SCHEME
Market Stability Reserve is close to approval
Basic parameters were agreed by “Trialogue” in May 2015, European Parliament approved the reserve in July
2015, European Council is expected to vote on it in September
MSR will be launched on January 1, 2019
900 million backloaded emission allowances will be transferred directly to the reserve
Unutilized emission allowances for new sources (approx. 500–700 million EUA*) will be transferred directly to the
reserve
In the context of solidarity among member states, the mechanism for transferring allowances to the reserve will
be adjusted to provide more proceeds from auctions to states with GDP per capita under 60% of the EU average
Up to 50 million allowances will be set aside and transferred into the fund for the support and promotion of
industrial innovation
In July 2015 European Commission presented draft of EU ETS directive
Annual reduction factor for the amount of emission allowances issued increased from 1.7% to 2.2%
Allocation period will last 10 years, with all emission allowances having unlimited validity
Broader range of tools for power sector and industry modernization in less developed countries (derogation,
modernization fund, innovation fund)
Czech republic is eligible for derogation, it can allocate up to 40% of allowances to electricity producers for free
Principal negotiations on details of the EU ETS directive are expected to take place in 2016.
MSR = Market stability reserve * based on estimation of prices and volumes by selected analysts 39

EUROPE’S ENERGY MARKET WAS ALSO GREATLY
AFFECTED BY TWO MAJOR EVENTS IN GERMANY
40
CO2 EMISSION REDUCTION—“DECARBONIZATION”
Germany decided to take a total of 2.7 GW of older lignite-fired power plants out of standard operation
and put them in the strategic reserve by 2020 at the latest to meet their CO2 emission reduction
obligations.
This made the price of electricity with delivery in 2019 and later grow by approx. 1 EUR/MWh
Operators (such as RWE or Vattenfall) are less uncertain about the future of individual coal-fired
plants, which helps them to make faster decisions on strategic investments or divestments
WHITE PAPER ON THE ENERGY MARKET—“Ein Strommarkt für die Energiewende”
A strategic document defining rules for the energy market published by the Federal Ministry for
Economic Affairs and Energy
Rejects the capacity market and declares the intent to introduce a capacity reserve system
The capacity reserve of generation facilities will serve for exceptional situations when
market supply (incl. available foreign deliveries) cannot meet demand. However, the
system will not artificially influence wholesale market prices (market price level will not be a
criterion for the exceptional situations).
The capacity reserve will include 2.7 GW of lignite-fired capacity and other generating
facilities with a total capacity of approx. 1.3 GW (probably mostly gas-fired facilities)
It increases pricing freedom in the wholesale market; i.e., it allows asking for a price above the
level of variable generation costs (“mark-up”) in justified cases

OVERVIEW OF REGULATION OF DISTRIBUTION
NETWORKS
Czech
Republic Bulgaria Romania
2015 RAB (local currency) 85,467 m 499 m 2,409 m
2015 RAB (€ m) 3,084
254.5
537
2015 WACC pre-tax 6.146%
(nominal)
7%
(nominal)
7.7%
(real)
Regulatory period 2010-2015 2013-2015 2014-2018
CZK/EUR = 27.725, BGN/EUR = 1.96, RON/EUR = 4.48
41
Regulatory
period
Unbundling &
Liberalization
4th regulatory period will start from January 1, 2016, 3 years period (2016 – 2018)
The main principles are very similar to the rules of the third regulatory period with the exception of
WACC. Main impacts: - lowering allowed costs;
- pressure on quality and security of electricity distribution;
- increased motivation to renew and develop the networks.
Since January 1, 2006 all customers can choose their electricity supplier,
market is 100% liberalized
There is no regulation of end-user prices of electricity
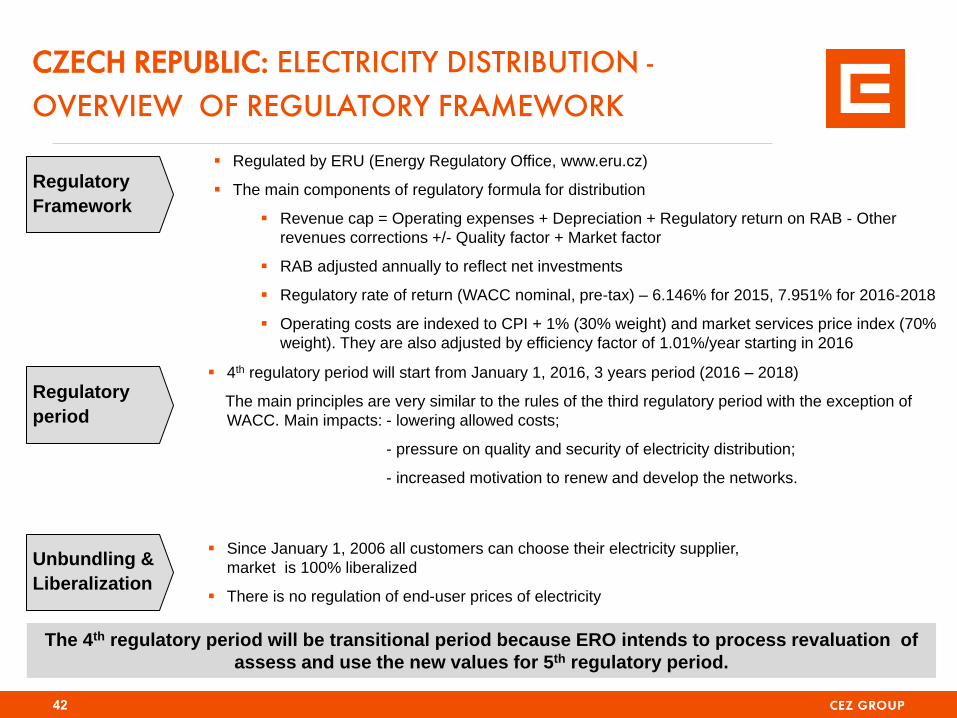
CZECH REPUBLIC: ELECTRICITY DISTRIBUTION -
OVERVIEW OF REGULATORY FRAMEWORK
42
Regulatory
Framework
Regulated by ERU (Energy Regulatory Office, www.eru.cz)
The main components of regulatory formula for distribution
Revenue cap = Operating expenses + Depreciation + Regulatory return on RAB - Other
revenues corrections +/- Quality factor + Market factor
RAB adjusted annually to reflect net investments
Regulatory rate of return (WACC nominal, pre-tax) – 6.146% for 2015, 7.951% for 2016-2018
Operating costs are indexed to CPI + 1% (30% weight) and market services price index (70%
weight). They are also adjusted by efficiency factor of 1.01%/year starting in 2016
The 4th regulatory period will be transitional period because ERO intends to process revaluation of
assess and use the new values for 5th regulatory period.
Regulatory
periods
Unbundling &
Liberalization
3rd regulatory period July 1, 2013 – June 30, 2015
4th regulatory period July 1, 2015- June 30, 2018
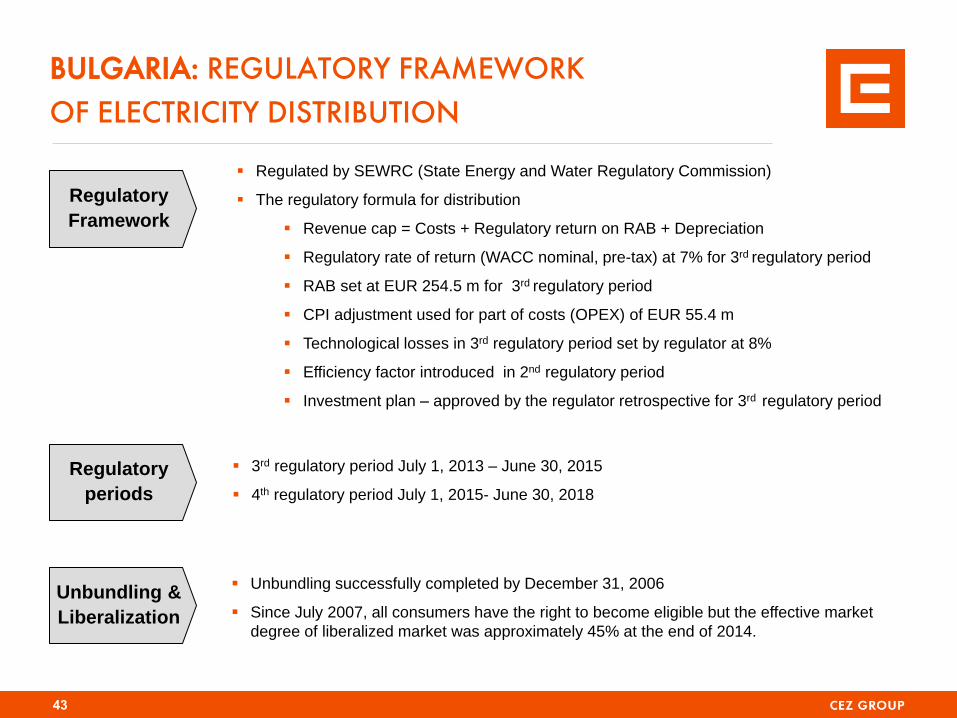
Unbundling successfully completed by December 31, 2006
Since July 2007, all consumers have the right to become eligible but the effective market
degree of liberalized market was approximately 45% at the end of 2014.
Regulatory
Framework
Regulated by SEWRC (State Energy and Water Regulatory Commission)
The regulatory formula for distribution
Revenue cap = Costs + Regulatory return on RAB + Depreciation
Regulatory rate of return (WACC nominal, pre-tax) at 7% for 3rd regulatory period
RAB set at EUR 254.5 m for 3rd regulatory period
CPI adjustment used for part of costs (OPEX) of EUR 55.4 m
Technological losses in 3rd regulatory period set by regulator at 8%
Efficiency factor introduced in 2nd regulatory period
Investment plan – approved by the regulator retrospective for 3rd regulatory period
BULGARIA: REGULATORY FRAMEWORK
OF ELECTRICITY DISTRIBUTION
43

Regulatory
periods
Regulatory
Framework
3rd regulatory period Jan 1, 2014 – Dec 31, 2018
Regulated by ANRE (Autoritatea Nationala de Reglementare in domeniul Energiei)
Price cap (tariff basket) methodology
Revenue = Controllable OPEX + non-controllable OPEX + Depreciation + Purchase of losses + Regulatory return on RAB
+ Working capital - Revenues from reactive energy - 50% gross profit from other activities
Efficiency factor of 1.5% applied only to controllable OPEX
Losses ( technical + commercial ) reduction program agreed with ANRE on voltage levels
S (minimum quality) from 2014 in formula, but applicable starting with 2015. Penalty/premium - maxim annual +/- 4%
from annual revenues
Possibility for annual corrections
Investment plan – approved by ANRE before regulatory period starts
Regulatory return (WACC pre-tax real terms) equals to 7.7% in 2015, it can be revised by ANRE during regulatory period
Working capital is equal to regulated remuneration of 1/12 from total OPEX
Distribution tariff growth capped in real terms at 10% yearly on voltage levels in the third regulatory period
ROMANIA: REGULATORY FRAMEWORK
OF ELECTRICITY DISTRIBUTION
Complete removal of regulated prices for industrial consumers by end 2013 and for residential consumers by 2017
Starting January 2014, non-residential customers that benefit of Universal Service (US) are priced with 100% CPC
tariff (free market component, endorsed by ANRE). The non-residential customers supplied on LRS regime are priced
with CPC tariff +x%, depending on voltage level.
Starting July 2013, the final price for the captive householders is formed of regulated tariff and a competitive market
component (CPC). The percentage of regulated tariff decreases , and the CPC tariff percentage increases according
to the Market Opening Calendar
Liberalization
44

CZECH REPUBLIC: RENEWABLES SUPPORT
45
Operators of renewable energy sources can
choose from 2 options of support:
Feed-in tariffs (electricity purchased by
distributor)
Green bonuses (electricity sold on the
market, bonuses paid by distributor, level of
green bonuses is derived from feed-in
tariffs)
Solar plants commissioned in 2014 or later do not
receive support
Feed-in tariffs are set by a regulator to ensure
15-year payback period. During operation of a
power plant they are increased each year by PPI
index or by 2% at minimum and 4% at
maximum.
Support is provided for 20 years to solar, wind,
pure biomass and biogas plants and for 30 years
to hydro.
Solar plants put into operations in 2010 with
capacity over 30kWp are obliged to pay 10% tax
of revenues.
150 193 218 219 263 270 278
40
464
1,959 1,971 2,086 2,132 2,067
0
500
1000
1500
2000
2500
2008 2009 2010 2011 2012 2013 2014
Wind
Solar
Installed capacity of wind and solar power plants in the Czech Republic
(MWe)
2015 feed-in - tariffs Plants
commissioned in
2010
Plants
commissioned
in 2014
Solar <5 kW 482 111*
5 kW< Solar <30 kW 482 90*
Solar >30 kW 478 0
Small hydro 93-118 91-117
Pure biomass burning 53-166 48-121
Source: Energy regulatory office (www.eru.cz), CZK/EUR=27.533
* For plants commissioned in 2013, no subsidies for solar commissioned in 2014

POLAND: NEW ACT ON RENEWABLE ENERGY
SOURCES
46
A new Renewable Energy Act changes the support for renewable energy sources as of Jan 1, 2016.
The support will be guaranteed for 15 years from the start of generation, but not longer than to the end of 2035
(foreseen end of the support scheme).
System of certificates of origin continues for existing installations (delivering power to the grid by December 2015) and
they can choose whether to switch to auction-based system which will be the standard support instrument for most
new investments.
Micro-installations up to 10kW will benefit from feed-in tariffs: PLN 0.75/kWh (0.173 EUR/kWh) for plants up to 3 kW,
while plants between 3-10 kW will receive up to PLN 0.7/kWh (0.169 EUR/kWh), depending on the renewable
technology. FIT are capped to the first 800 MW of installed capacity: 300MW and 500 MW respectively.
Auction-based system will apply to installations over 10 kW of installed capacity. The state will guarantee support to a
given value and volume (published each year by the Council of Ministers) of electricity within the limit of 15 years, the
lowest offered price will win.
The first auction will open no later than Mar 31, 2016 and, pursuant to the new law, will be done separately for projects
above or below 1 MW in size, and for existing and new installations – these will have to be commissioned within 48
months after the auction (24 months for solar, 72 months for wind).
Not meeting the delivery targets will be subject to a penalty.

ROMANIA: RENEWABLES SUPPORT
47
20
25
30
35
40
45
50
55
60
Source: OPCOM
Green certificates market clearing price (EUR/certificate)
Two green certificates (GC) obtained by the producer for each MWh supplied from wind to the network until 2017,
one GC from 2018 onwards, duration of support – 15 years. In July 2013 Romanian government has approved an
emergency decree which defers trading of second green certificate for wind farm producers until 1 Jan 2018.
Legally set up price for green certificate is 27 to 55 EUR in 2008 – 2025
New Law 134/2012 on renewables stipulates that existing producers over 125 MW receive GC according to
normal supporting scheme for 2 years, with the obligation to individually notify to Brussels for state aid support
within following 3 months after accreditation.
Fantanele Vest (263 MW) stopped receiving GCs in November 2013 and Cogealac (253MW) since October
2014 due to delays in EC notification. The awarding of GCs was resumed in September 2015.

Q1 – Q3 2015 FINANCIAL RESULTS HIGHLIGHTS
* Net income - adjusted = Net income adjusted for extraordinary effects that are generally unrelated to ordinary financial performance
in a given year (such as fixed asset impairments and goodwill write-offs or profit/loss from sale of assets or subsidiaries).
** As at the last date of the period
Due to precise mathematical rounding, the sum of partial values listed can sometimes differ from the total value. 48
(CZK bn) Q1 - Q3 2014 Q1 - Q3 2015 Change %
Revenues 147.0 150.6 +3.6 +2%
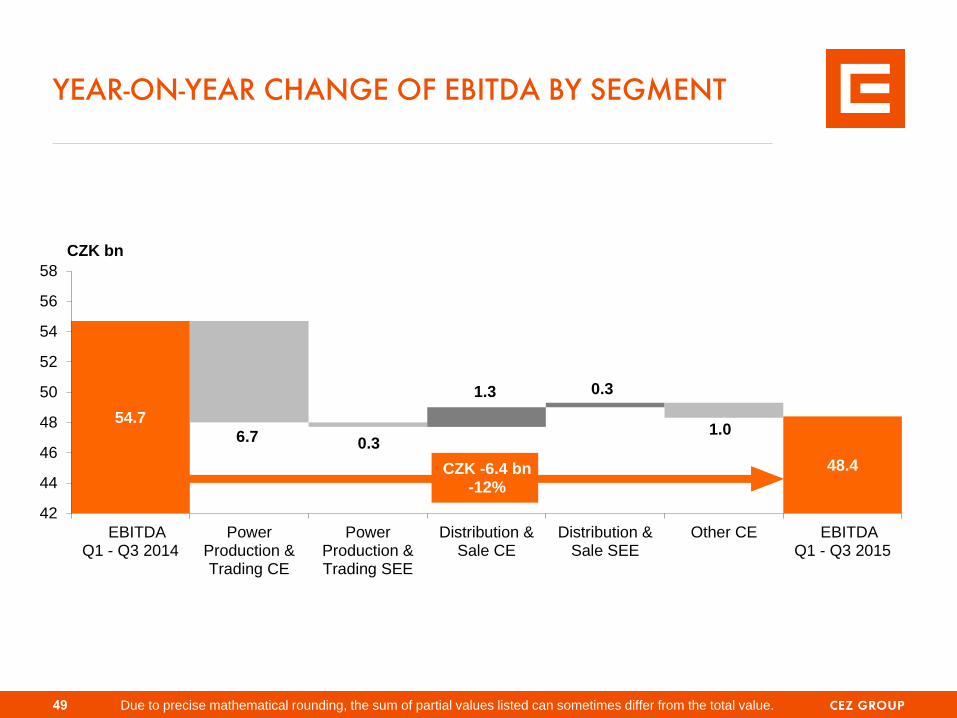
EBITDA 54.7 48.4 -6.4 -12%
EBIT 28.8 24.6 -4.2 -15%
Net income 19.6 16.6 -3.0 -15%
Net income - adjusted * 24.2 18.6 -5.6 -23%
Operating CF 59.1 49.8 -9.3 -16%
CAPEX 21.7 20.2 -1.5 -7%
Net debt ** 155.2 140.3 -14.9 -10%
Q1 - Q3 2014 Q1 - Q3 2015 Change %
Installed capacity ** GW 15.2 15.9 +0.7 +5%
Generation of electricity TWh 46.0 45.6 -0.3 -1%
Electricity distribution to end customers TWh 35.2 36.1 +0.9 +3%
Electricity sales to end customers TWh 25.7 28.0 +2.3 +9%
Sales of natural gas to end customers TWh 3.6 4.6 +1.0 +29%
Sales of heat 000´TJ 13.8 14.8 +1.0 +8%
Number of employees ** 000´s 26.2 25.7 -0.5 -2%
54.7
48.0
47.7 47.7
49.0
48.3 48.4
6.7 0.3
1.3 0.3
1.0
42
44
46
48
50
52
54
56
58
EBITDAQ1 - Q3 2014
PowerProduction &Trading CE
PowerProduction &Trading SEE
Distribution &Sale CE
Distribution &Sale SEE
Other CE EBITDAQ1 - Q3 2015
CZK -6.4 bn -12%
CZK bn
YEAR-ON-YEAR CHANGE OF EBITDA BY SEGMENT
Due to precise mathematical rounding, the sum of partial values listed can sometimes differ from the total value. 49

OTHER INCOME (EXPENSES)
Depreciation, Amortization, and Impairments* (CZK +2.2bn)
Lower additions to fixed asset impairments (CZK +2.9bn)
Increase in depreciation and amortization at ČEZ, a. s. (CZK -0.9bn)
Financial and Other Income/Expenses (CZK +0.7bn)
Positive effect of revaluation of financial derivatives partially eliminated by effect of foreign exchange gain and losses (CZK +0.7bn)
Positive effect of decreased volume of debt on interest expenses (CZK +0.5bn)
Cost of buyback of issued bonds in 2014 (CZK +0.5bn)
Appreciation of funds deposited in restricted accounts and in short-term securities (CZK +0.5bn)
Negative effect of changes in the USD/TRY exchange rate on the financial results of companies in Turkey (CZK -1.4bn)
Net Income Adjustment
Q1 – Q3 2014 net income adjusted for the negative effect of fixed asset impairments (CZK +4.7bn) and other effects** (CZK -0.1bn)
Q1 – Q3 2015 net income adjusted for the negative effect of fixed asset impairments (CZK +2.0bn)
* Including goodwill write-offs, profit/loss on sales of fixed assets and write-off of abandoned investments ** Effect of extraordinary sales of assets 50
(CZK bn) Q1 - Q3 2014 Q1 - Q3 2015 Change %
EBITDA 54.7 48.4 -6.4 -12%
Depreciation, amortization and impairments* -25.9 -23.8 +2.2 +8%
Financial and other income (expenses) -4.4 -3.7 +0.7 +16%
Interest income (expenses) -2.3 -1.9 +0.3 +15%
Interest on nuclear and other provisions -1.4 -1.3 +0.1 +8%
Income (expenses) from investments 0.2 -0.9 -1.1 -
Other income (expenses) -1.0 0.3 +1.3 -
Income taxes -4.8 -4.3 +0.5 +11%
Net income 19.6 16.6 -3.0 -15%
Net income - adjusted 24.2 18.6 -5.6 -23%

2015 GENERATION VOLUMES AFFECTED BY
SHUTDOWNS IN NUCLEAR PLANTS
Due to precise mathematical rounding, the sum of partial values can sometimes differ from the total value.
IN THE CZECH REPUBLIC ABROAD
51
31.2 28.8 30.1
4.4 3.8 4.0
30.7 30.3 27.0
0.4 0.2 0.4
0.0
10.0
20.0
30.0
40.0
50.0
60.0
70.0
80.0
2013 2014 2015E
Natural gas
Nuclear
Hydro & renewables
Coal
66.7 63.1 61.5
+5% -8%
-1%
-5%
-3%
-11%
TWh
Nuclear Power Plants (-11%)
− Unplanned outages of Dukovany NPP
− Extended planned outages and unplanned outages of Temelín NPP
Coal-Fired Power Plants (+7%)
+ Pilot operation of Ledvice 4 Power Plant (new facility)
+ Comprehensive renovation of units at Prunéřov 2 Power Plant
− Transfer of the last unit of Ledvice 2 Power Plant into reserve
Renewables (+4%)
+ Average climatic conditions expected, as opposed to 2014 The 2015 generation prediction is facing the risk of delayed completion of renovation and
construction of coal-fire plants and the risk of extended outages of Dukovany NPP units.
Romania (+5%)
+ Higher wind farm production in connection with worse-than-average
weather conditions in 2014
– Production at Reṣița hydro plants decreased primarily due to a dry
summer
Poland (+11%)
+ Higher amount of coal burned at both power plants plus improved
efficiency at the Skawina Power Plant due to turbine upgrade in
2015
undrawncommitted
drawnuncommitted
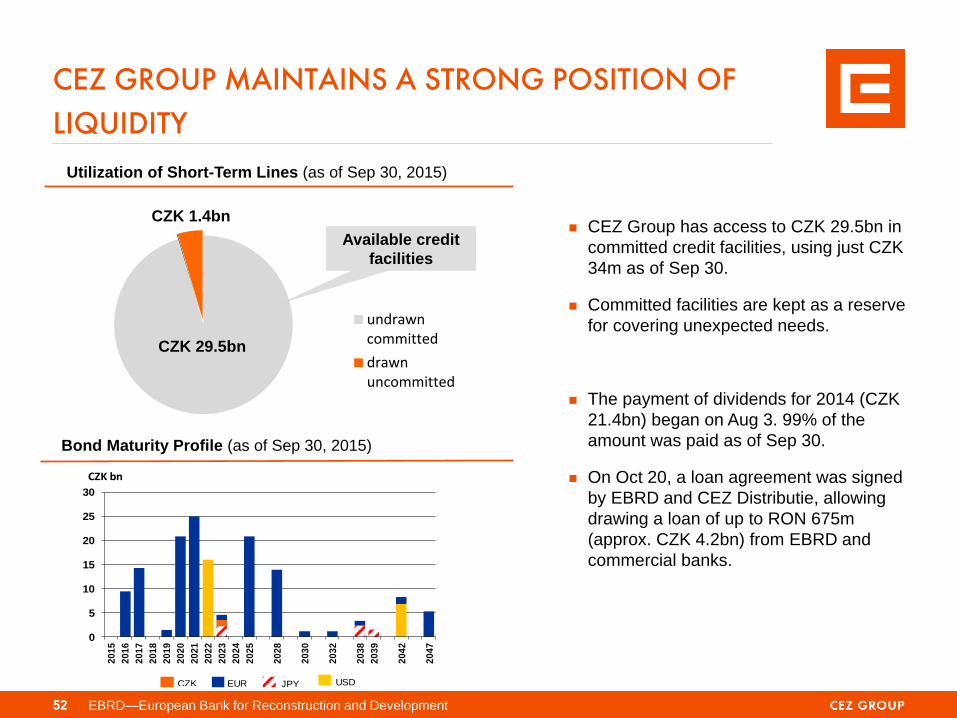
CEZ GROUP MAINTAINS A STRONG POSITION OF
LIQUIDITY
Utilization of Short-Term Lines (as of Sep 30, 2015)
Available credit
facilities
CZK 29.5bn
CZK 1.4bn CEZ Group has access to CZK 29.5bn in
committed credit facilities, using just CZK
34m as of Sep 30.
Committed facilities are kept as a reserve
for covering unexpected needs.
The payment of dividends for 2014 (CZK
21.4bn) began on Aug 3. 99% of the
amount was paid as of Sep 30.
On Oct 20, a loan agreement was signed
by EBRD and CEZ Distributie, allowing
drawing a loan of up to RON 675m
(approx. CZK 4.2bn) from EBRD and
commercial banks.
0
5
10
15
20
25
30
20
15
20
16
20
17
20
18
20
19
20
20
20
21
20
22
20
23
20
24
20
25
20
28
20
30
20
32
20
38
20
39
20
42
20
47
EURCZK JPY USD
CZK bn
Bond Maturity Profile (as of Sep 30, 2015)
EBRD—European Bank for Reconstruction and Development 52

SEGMENTAL CONTRIBUTIONS TO EBITDA IN 2014
53
39.5 0.6
19.3 3.9
4.2
5.0
72.5
0.0
10.0
20.0
30.0
40.0
50.0
60.0
70.0
80.0
PowerProduction and
Trading CE
PowerProduction andTrading SEE
Distributionand Sale CE
Distributionand Sale SEE
Mining CE Other* Group EBITDA
*including eliminations
CZK bn
54% 27% 5% 6% 7% 1% % of total 100%

CEZ GROUP IS ONE OF THE MOST PROFITABLE
EUROPEAN UTILITIES
EBITDA* margin, 2014
Percent
Source: company data, * EBITDA as reported by companies
39.4
36.1
28.5
23.7
23.2
23.0
22.4
20.7
16.2
14.7
14.4
10.3
7.5
Fortum
CEZ Group
Verbund
EDF
Iberdrola
PGE
EDP
Enel
Engie
RWE
Endesa
EnBW
EON
54

CZK bn 2009 2010 2011 2012 2013 2014
Revenues 196.4 198.8 209.8 215.1 217.0 200.7
Sales of electricity 173.5 175.3 181.8 186.8 189.4 173.8
Heat sales and other revenues 22.9 23.6 28.0 28.3 27.6 26.8
Operating Expenses 105.3 110.0 122.4 129.3 135.0 128.2
Purchased power and related services 48.2 54.4 65.9 71.7 79.0 76.0
Fuel 15.8 16.9 17.1 15.8 13.8 12.7
Salaries and wages 18.1 18.7 18.1 18.7 18.7 18.9
Other 23.3 20.0 21.3 23.1 23.5 20.6
EBITDA 91.0 88.8 87.4 85.8 82.0 72.5EBITDA margin 46% 45% 42% 40% 38% 36%
Depreciation, amortization, impairments 26.2 26.9 26.2 28.9 36.4 35.7
EBIT 64.9 62.0 61.3 57.1 45.7 36.9EBIT margin 33% 31% 29% 27% 21% 18%
Net Income 51.9 46.9 40.8 40.2 35.2 22.4
Net income margin 26% 24% 19% 19% 16% 11%
CZK bn 2009 2010 2011 2012 2013 2014
Non current assets 415.0 448.3 467.3 494.9 485.9 497.5
Current assets 115.3 96.1 131.0 141.2 154.5 130.4
- out of that cash and cash equivalents 26.7 22.2 22.1 18.0 25.0 20.1
Total Assets 530.3 544.4 598.3 636.1 640.4 627.9
Shareholders equity (excl. minority. int.) 200.4 221.4 226.8 250.2 258.1 361.3
Return on equity 28% 22% 18% 17% 14% 7%
Interest bearing debt 173.1 158.5 182.0 192.9 199.0 184.1
Other liabilities 156.8 164.4 189.4 192.9 183.3 82.4
Total liabilities 530.3 544.4 598.3 636.1 640.4 627.9
SELECTED HISTORICAL FINANCIALS OF CEZ GROUP
CZK
55
Balance sheet
Profit and loss

EUR m 2009 2010 2011 2012 2013 2014
Revenues 7,082 7,172 7,566 7,758 7,826 7,237
Sales of electricity 6,258 6,322 6,557 6,737 6,830 6,269
Heat sales and other revenues 824 850 1,009 1,021 997 968
Operating Expenses 3,800 3,969 4,415 4,663 4,869 4,623
Purchased power and related services 1,737 1,960 2,376 2,585 2,850 2,741
Fuel 570 611 618 571 498 458
Salaries and wages 653 675 653 675 674 680
Other 839 723 768 832 846 744
EBITDA 3,282 3,203 3,151 3,095 2,957 2,615EBITDA margin 46% 45% 42% 40% 38% 36%
Depreciaiton 944 971 947 1,042 1,312 1,289
EBIT 2,342 2,235 2,209 2,059 1,648 1,333EBIT margin 33% 31% 29% 27% 21% 18%
Net Income 1,870 1,693 1,470 1,448 1,270 809
Net income margin 26% 24% 19% 19% 16% 11%
EUR m 2009 2010 2011 2012 2013 2014
Non current assets 14,967 16,169 16,855 17,850 17,527 17,945
Current assets 4,159 3,466 4,725 5,092 5,571 4,702
- out of that cash and cash equivalents 964 799 796 648 902 725
Total Assets 19,126 19,635 21,580 22,942 23,098 22,646
Shareholders equity (excl. minority. int.) 7,227 7,987 8,181 9,026 9,308 13,032
Return on equity 28% 22% 18% 17% 14% 7%
Interest bearing debt 6,243 5,717 6,565 6,959 7,178 6,641
Other liabilities 5,656 5,931 6,833 6,957 6,611 2,973
Total liabilities 19,126 19,635 21,580 22,942 23,098 22,646
Profit and loss
Exchange rate used:
27.725 CZK/EUR
Balance sheet
SELECTED HISTORICAL FINANCIALS OF CEZ GROUP
EUR
56

CEZ, a. s.
Duhova 2/1444
14 053 Praha 4
Czech Republic
www.cez.cz
Tereza Goeblova
Investor Relations Analyst
Phone:+420 211 042 391
Fax: +420 211 042 003
email: [email protected]
Barbara Seidlova
Head of Investor Relations
Phone:+420 211 042 529
Fax: +420 211 042 003
email: [email protected]
57
INVESTOR RELATIONS CONTACTS
Radka Novakova
Shares and dividends administration
Phone:+420 211 042 541
Fax: +420 211 042 040
email: [email protected]
Jan Hajek
Fixed Income
Phone:+420 211 042 687
Fax: +420 211 042 040
email: [email protected]