Embed Size (px)
Citation preview
CESSA WP 2018-02
New Evidence of Market Competition in the Japanese Tire
Industry using Market Share Analysis
Craig R. Parsons, Yokohama National University
Xuan Dong Nguyen, Vietnam National University
Xavier de Vanssay, York University
December 2018
Center for Economic and Social Studies in Asia (CESSA) Working Paper
Downloadable from:
http://www.econ.ynu.ac.jp/cessa/publication/workingpaper.html
Center for Economic and Social Studies in Asia, Department of Economics
Yokohama National University
1
New Evidence of Market Competition in the Japanese Tire Industry using Market Share Analysis
CRAIG PARSONS1,
XUAN DONG NGUYEN,
and
XAVIER DE VANSSAY
Keywords: collusion, Japan, market power, market share, panel unit root, tire
Abstract:
We present a simple, yet powerful, battery of univariate and panel unit-root tests on market shares to draw some inferences regarding the level of rivalry within an industry. As an application, we employ them on the Japanese tire industry over a 40-year period. We find that rivalry seems to be present among the smaller firms, while at the same time, the dominant firm seems unperturbed by the competition. We compare these conclusions with a previous study of the industry (Nguyen et al. 2015).
Word Count: 7469
1 Parsons: Yokohama National University (Japan) email: [email protected]; Nguyen Xuan Dong: Vietnam National University, [email protected]; de Vanssay: York University (Canada), email: [email protected]. This paper was written while de Vanssay was a guest of Yokohama National University as a Visiting Scholar.
2
1. Introduction
While the US tire industry has been the subject of economic analysis (see, for example, Klepper and Simons 2000), little analysis has been done on the Japanese tire market. An exception is Nguyen, de Vanssay, and Parsons (2015), (hereafter: NDP). This is somewhat surprising given the very high level of firm concentration and small amount of imports of tires in Japan. Studying the level of competition and rivalry in the Japanese tire industry is even more relevant given that in the recent past that industry has been the subject of multiple inquests from the Japan Fair Trade Commission (JFTC). (See NDP, p. 6-7.) In this paper, we make use of recent time series econometric methods to test whether this highly concentrated and relatively isolated market exhibits cartel-like tendencies. Specifically, we make use of unit root and panel unit tests of market shares of the tire firms over time to detect whether they may be, implicitly or explicitly, colluding. The use of unit-root testing for market shares is not new. Gallet and List (2001) studied market shares data for the US cigarette industry over the 1934-1994 period. They employed univariate unit-root testing on (the log of) individual firms’ relative market shares. They found that market shares in the industry followed a random walk. They conclude that ‘…rivalry in the cigarette industry has remained strong.’ (p. 473) and that ‘the ability of the industry to sustain cooperation over the long term is limited.’ (p. 477). Sephton (2008) employs the same data but uses industry panel unit-root tests. He finds that ‘Competition in the U.S. cigarette market may not have been strong given that some firms appear to have enjoyed a steady relative share of the market.’ (p. 421). Despite the relative ease of the method and the abundance of potentially collusive markets around the world, these methods have, thus far, been seldom used. Giannetti (2015) uses panel data unit root tests to assess market instability for the Italian retail banking industry. Her dataset is comprised of 143 banks, over 103 Italian provinces from 1994 to 2006. She finds that ‘the Italian banking industry has experienced movements towards higher levels of competition.’ (p. 553).
As such, this is the first paper that uses unit-root testing to detect the level of rivalry and competitive behavior in any Japanese industry. We have chosen the Japanese tire industry, an industry which has been in the crosshairs of the JFTC for a long time.
We develop a model of conditional convergence along the lines of Carlino and Mills (1993, 1996) who studied convergence of per capita incomes across US states. We then model the stochastic process as a possible AR(1). The firm-specific AR(1) methodology seems well justified as it can encompass a random shock (productivity, costs, etc.…). It also allows for a possibly long (infinite) memory with slowly decaying ‘after shocks’ depending on the value of ϕi.
3
At the theoretical level, we examine and discuss the three possible cases: ϕi = 0 (conditional convergence, stationary), ϕi = 1 (unit-root random walk), and the intermediate case: 0 < ϕi < 1 (conditional convergence, with a stationary, long memory, and ‘slow decaying’ stochastic process.) Our empirical approach is thus informed by our theoretical model. Empirically, we employ both univariate and panel unit-root tests for reasons explained below.
The rest of this paper is organized as follows. Section 2 gives a brief history and characteristics of the Japanese automobile tire industry. Section 3 discusses the modeling leading to the use of unit-root testing on market shares. Section 4 describes the firm-level data and analyzes the estimation results. Finally, Section 5 concludes.
2. The Japanese tire industry
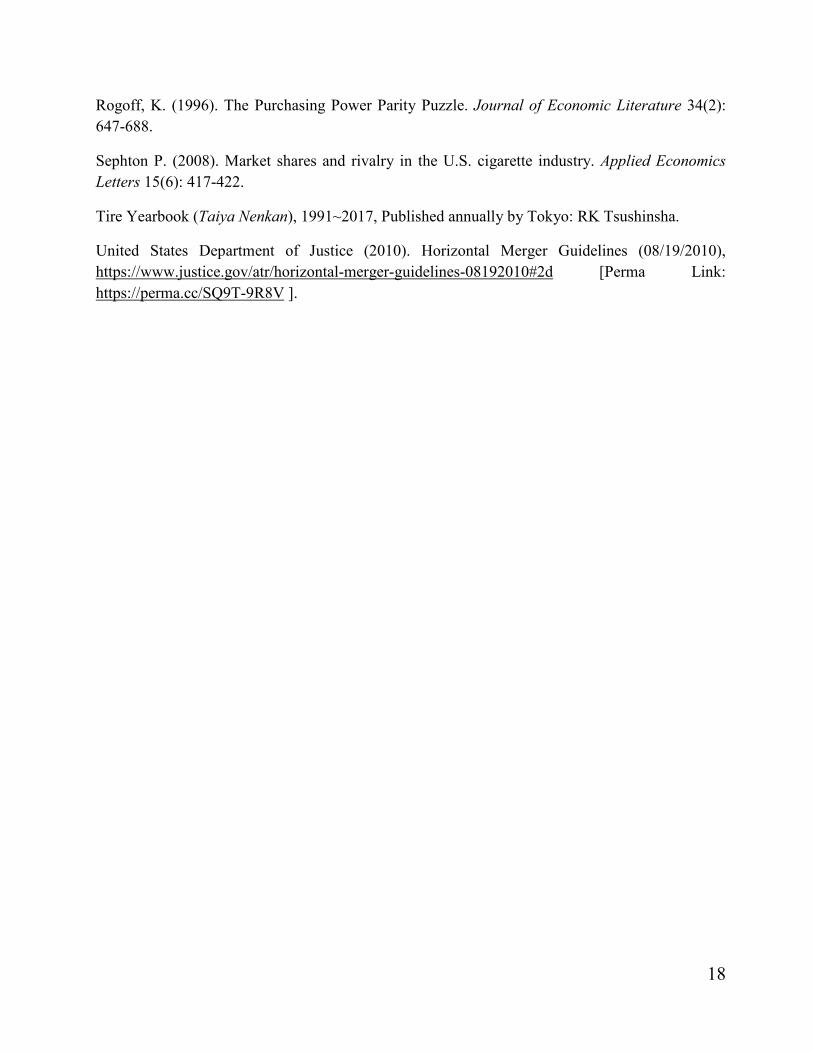
A Japanese subsidiary of the British company Dunlop Rubber was the first company to produce automobile tires in Japan in 1913. It was then acquired by Sumitomo in 1963. The production volume of the Japanese automobile tire industry increased steadily until 2008 thanks to a huge domestic market demand and active exports and has grown as the automobile industry has grown. The production scale declined sharply in 2009 due to the global economic crisis and recovered slightly in 2011. Thereafter, the production network of the tire industry expanded globally, and the scale of production in Japan has exhibited a gradually decreasing trend.2 As shown in Figure 1, the production volume of tires in Japan reached 1.08 million tons of rubber in 1996, about twice the 1976 volume. Thereafter, it increased steadily at an annual rate of 2 percent to reach 1.34 million tons of rubber in 2008. The tire production in 2016 was 1.02 million tons of rubber, accounting for more than 80 percent of the domestic rubber production.
(Refer to Figure 1 at the end of the paper)
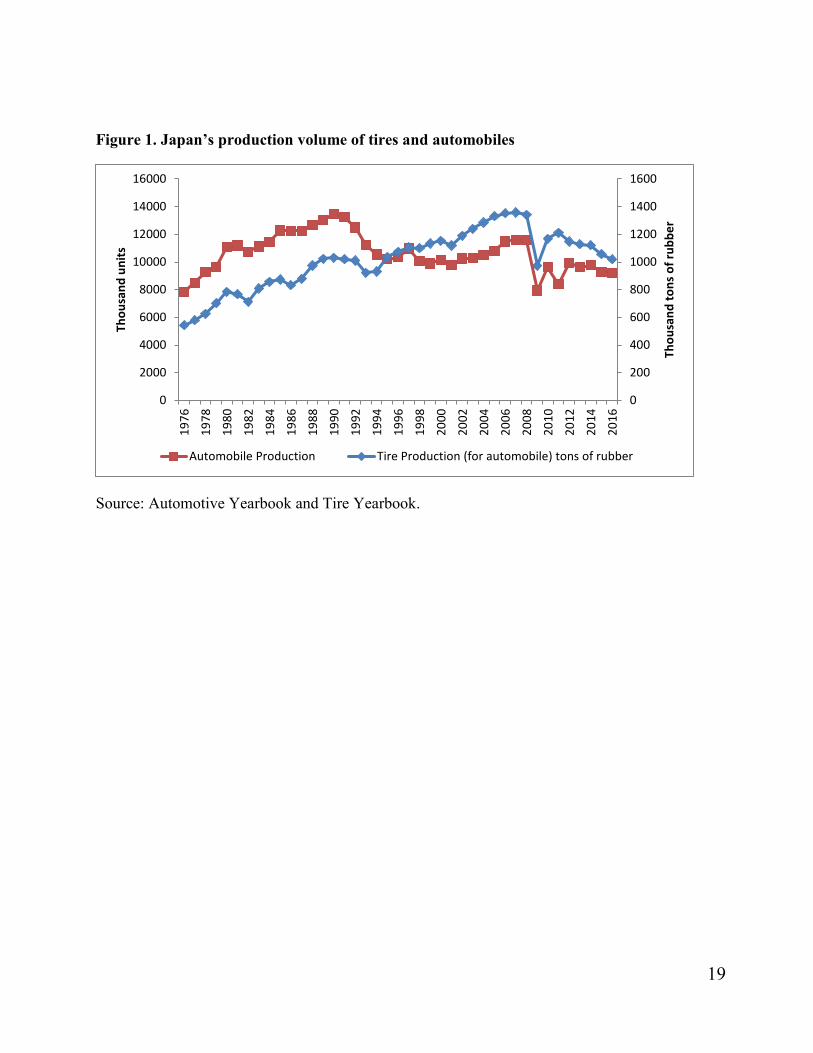
The Japanese-made tires are consumed domestically via the original equipment and replacement channels as well as internationally via the export channel. Figure 2 shows how the Japanese-made tires are distributed from tire makers to consumers. There are two ways in which tires are distributed: direct and indirect sales. The direct sales refer to the channel under which distributors sell tires directly to some large users, such as transport, bus, taxi companies, and governmental and municipal users. Indirect sales are those under which tire dealers supply tires to end users. There are about 100 distributors and 120,000 tire dealers on the replacement channel. As seen from Figure 2, the replacement channel has particularly wide-ranging distributors.
(Refer to Figure 2 at the end of the paper)
2 For more details about the Japanese automobile tire industry, visit the homepage of the Japan Automobile Tire Manufacturers Association (JATMA) at http://www.jatma.or.jp/media/pdf/tire_industry_2017.pdf.
4
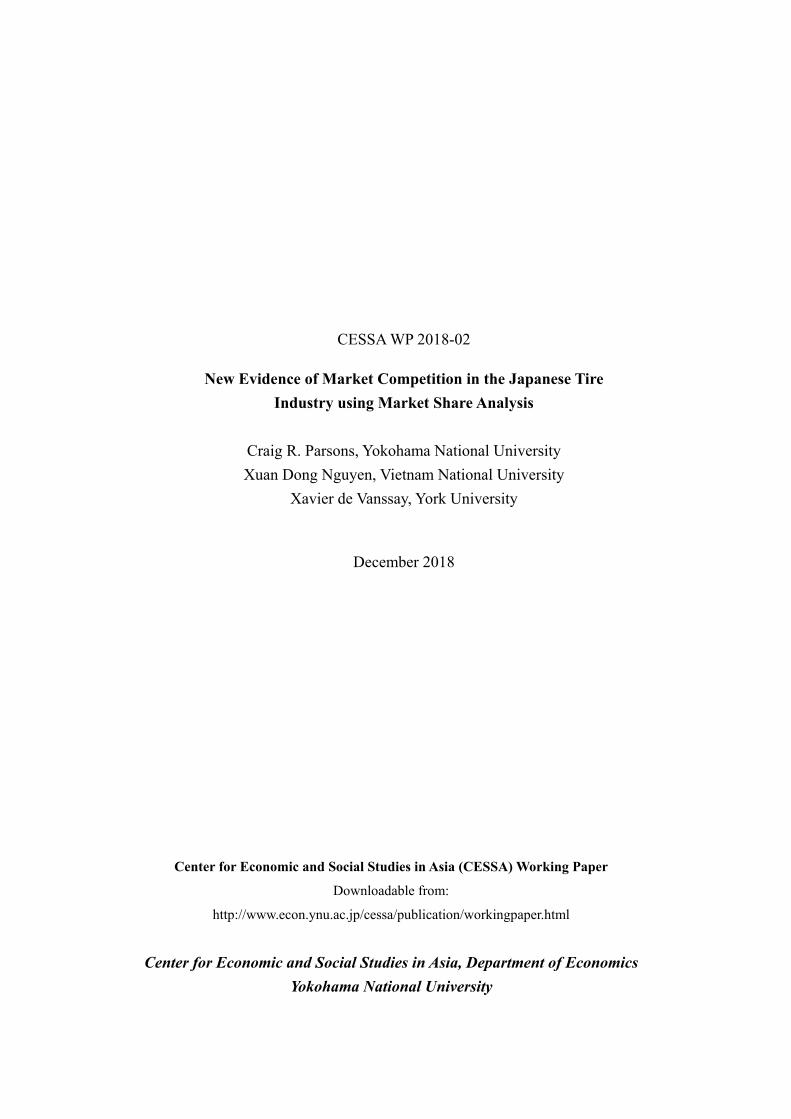
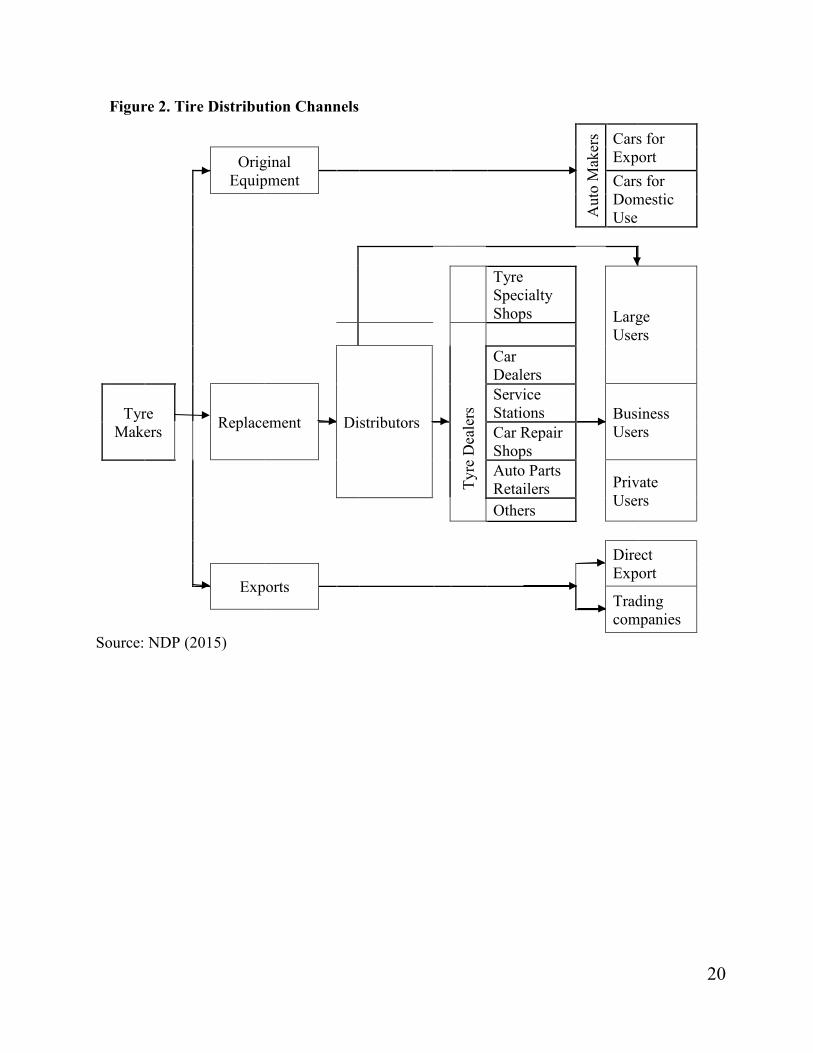
For the last forty years, the (domestic) Japanese tire production has been dominated by Bridgestone.3 Yokohama and Sumitomo have, at different times, occupied either the second or third places. The Toyo Tire & Rubber Company has consistently occupied the fourth place. Two minor players followed this quartet. The Ohtsu Tire & Rubber Co., Ltd was in fifth place until it merged with Sumitomo in 2003, making Sumitomo the second largest tire maker in the industry. Finally, in sixth place, Michelin Okamoto Tire (a joint-venture) exited the production market in 2010. This apparent market share stability can be seen graphically in Figure 3.
As discussed in NDP (2015), Bridgestone, Yokohama, Sumitomo, Yokohama, Toyo and their sales agencies developed a collusive, bid-rigging scheme (‘dangou’) in which all present and future Defense contracts would be shared out over time. Consequently, in fiscal year 2003, most orders for tires by the Defense Agency went to Bridgestone, Yokohama, Sumitomo, and Toyo under the collusive bid-rigging scheme. In March 2004, Goodyear cancelled the sales of a contract for tires to the Defense Agency. Yokohama Tire Tokyo Sales Company knew of this termination of the contract between Goodyear Wingfoot and thus held a meeting with the other companies in May 2004 to determine how to go about redistributing their portions of the contract abandoned by Goodyear. This cancellation by Goodyear promptly spurred the Japan Fair Trade Commission (JFTC) to initiate an investigation into this case in June 2004. The results of an investigation carried by the JFTC uncovered the fact that the largest four firms had, indeed, colluded to determine the contract price, as prospective contractors in the bid for procurement of automobile tires by the Japanese Defense Agency. Yokohama and Bridgestone were also ordered to pay surcharges commensurate with the violation period.
(Refer to Figure 3 at the end of the paper)
3. Modeling unit root and hysteresis testing on market shares
3.1 Unit roots
Time series data often exhibit serial correlation. That is to say, the present value of the data is often dependent on values preceding it. Series in which ‘…the future is like the past’ are called ‘stationary’ or I(0).4 Series that are not stationary (non-stationary or I(1)) are usually characterized by persistent long run movements, or ‘trends’, or instead may be unstable over time or have breaks. If a particular series has a unit root, then the series has a non-normal distribution. In this case, standard Least Squares regression analysis will lead to incorrect t-statistics.
As such, a larger body of the time series and unit root literature is concerned with first determining whether or not the series or series to be examined contains a unit root. If not, then standard least
3 Together with the U.S. tire maker Goodyear and French tire maker Michelin, Bridgestone has ranked among the top three makers in the world. As argued in Guelle (2002), the Japanese tire makers have established strong business bases in Asia, while foreign makers did not. 4 Stock and Watson (2015, p. 569).

5
squares can be used to investigate possible correlation between two or more variables. If one or more of the series do contain a unit root, however, then other methods (typically cointegration à la Johansen (1995), or in the case of mixed (i.e. two or more series contain both `stationary` (I(0) and ‘non-stationary’ I(1)) series, Autoregressive Distributed Lag ARDL) models are employed (e.g. Pesaran, Shin and Smith, 2001).
However, rather than just a pretesting tool for time series data, economics has had more direct applications of unit root tests. For example, in testing whether Purchasing Power Parity (PPP) holds in the real world, international economists often conduct unit root tests on real exchange rates. If the real exchange series is found to be non-stationary (random walk), this suggests that prices across countries do not move together, thus rejecting the PPP hypothesis (see Rogoff 1996). In finance, determining whether stock returns are non-stationary (random walk) may tell us whether we can `beat` the market and whether or not markets are efficient (see Lo and MacKinlay 2002).
Along these lines, this paper follows a small, but growing body of literature in which we use unit root tests to assess whether there may be collusion among a small, concentrated set of firms in a single industry. The basic idea is that if a firm’s market shares tend to revert to some historical norm and are ‘stationary’, this may be evidence of cartel-like collusion.
As mentioned earlier, one of the earliest papers was Gallet and List (2001) who used unit root tests to investigate possible collusion in the US cigarette industry.
This paper follows this literature. In Gallet and List (2001), unit root tests were conducted for each firm separately. While in some cases this may be reasonable, in most cases, conducting panel unit tests makes more sense. The reasons are two-fold. First, it is well-known that unit root tests suffer from low power, particularly in small samples (Maddala and Kim 1999). As such, conducting panel unit root tests (which were only just being developed at the time of the Gallet and List paper) greatly enlarges the sample and consequentially the power of the test (Pesaran 2015, chapter 31). This means that panel unit root tests have a greater probability to reject a false null hypothesis. In other words, panel unit root tests have a lower probability of Type II errors.
The second reason is that for firms in the same industry, errors terms (or ‘innovations’) are most definitely related, especially for an industry with a small number of firms in a single country. As such, certain panel unit methods allow for ‘cross correlation’ to be incorporated.
3.2 Hysteresis
The basic intuition of this model is to consider the possible existence of hysteresis in (relative) market shares’ evolution. We define hysteresis as the existence of some permanent effects of a temporary shock (see Göcke 2002 for a detailed discussion). These shocks can be positive or negative. They can include cost reductions (increases), labor productivity changes, new marketing strategy, etc. If we identify the presence of hysteresis for market shares, we can infer that efforts by individual firms to innovate, produce at lower costs, and generally be more competitive than its rivals, are
6
rewarded by an increase in (relative) market shares (domestic production). We can thus describe the industry as being competitive within Japan. This may be the case even in the presence of a low number of firms and/or an elevated HHI (e.g. above 0.25). We envision that each firm likely has its own firm-specific mean (market share) and that there is no single, common mean for all firms. That is to say, while the market shares may be stable over time, we do not assume the market shares will be symmetric across firms. There are many reasons why this may be the case. Early entrant or incumbent effects could be one reason, historical supplier relationships between tire producers and (Japanese) car makers may be another, possible geographic-based consumption patterns (Bridgestone and Yokohama have their headquarters in Tokyo, while Sumitomo and Toyo are based in western Japan, Osaka and Kobe, respectively) and so on. If there is instead no hysteresis, then one can infer that there is no lasting effect of the temporary shock; we return to the (firm-specific) mean. Production market shares do not persistently depend on a firm’s effort. Under certain assumptions, this implies that the level of competition is weak. To put it differently, in the absence of hysteresis, it is ‘as if’ (relative) production decisions were coordinated and no firm could durably deviate from that order/rank despite its individual circumstances or efforts.
As an approximation and common practice in economics, hysteresis, which is a non-stationary process, is modeled by a unit-root.5 In the section below, we show that because we allow for dynamic conditional convergence, our model guides us to test for the possibility of an intercept and a time-trend.
3.3 A simple model for unit roots in (relative) market shares
To implement the model, we consider the variable for market share, MKSit. To be precise, for reasons that will be come clear later in the text, we shall consider two measures. First, we look at the log of the production market share for each firm. Then, second, we study the log of the relative production market share (that is: the log of market share for firm i during year t, divided by the average market share for all nt firms during that year t) for firm i during period t. ( 𝑤𝑤ℎ𝑒𝑒𝑒𝑒𝑒𝑒 4 ≤ 𝑛𝑛𝑡𝑡 ≤6 )
We assume that there could be a time-invariant equilibrium “idiosyncratic” production market share, that each firm i is moving toward over time∶ 𝑀𝑀𝑀𝑀𝑀𝑀𝑖𝑖𝑒𝑒. Within the industry, each firm can have a different market share. Based on 40-plus years of history in the industry, we assume little or no free entry for the Japanese tire industry.
5 This is only an approximation. For instance, see Göcke, p. 180-182 for a further distinction between ‘unit root hysteresis’ and ‘genuine hysteresis’.
7
MKSit = 𝑀𝑀𝑀𝑀𝑀𝑀𝑖𝑖𝑒𝑒 + 𝜇𝜇𝑖𝑖𝑡𝑡 (1) where 𝑀𝑀𝑀𝑀𝑀𝑀𝑖𝑖𝑒𝑒 is a time-invariant equilibrium, idiosyncratic, market share for firm i, and where 𝜇𝜇𝑖𝑖𝑡𝑡 is the deviation from that equilibrium at period t for firm i.
At period t, 𝜇𝜇𝑖𝑖𝑡𝑡 is modeled as a linear function of a deterministic “time trend” variable (Tt) and a stochastic process (Zit).
𝜇𝜇𝑖𝑖𝑡𝑡 = 𝑣𝑣𝑖𝑖0 + 𝛼𝛼1𝑖𝑖𝑇𝑇𝑡𝑡 + 𝑍𝑍𝑖𝑖𝑡𝑡 (2)
This is a form of conditional convergence for (relative) production market shares.6 Indeed, if firm i’s market share is initially above its compensating differential — meaning that we have initially MKSit > 𝑀𝑀𝑀𝑀𝑀𝑀𝑖𝑖𝑒𝑒 — so that 𝜇𝜇𝑖𝑖𝑡𝑡 , the current deviation from equilibrium, is positive.
Eq. (2) describes the corresponding adjustment process.
When 𝜇𝜇𝑖𝑖𝑡𝑡 is positive, then the initial deviation from equilibrium, 𝑣𝑣𝑖𝑖0, is also positive. To ensure conditional convergence, when 𝑣𝑣𝑖𝑖0 is positive, then we must have 𝛼𝛼1𝑖𝑖 < 0.
So, in Eq. (2), 𝛼𝛼1𝑖𝑖 is the (deterministic) rate of convergence for firm i. It is negative when a firm’s market share is above its equilibrium level and is positive when a firm’s market share is below its equilibrium level.
Substituting (2) in (1): MKSit = 𝛼𝛼0𝑖𝑖 + 𝛼𝛼1𝑖𝑖𝑇𝑇𝑡𝑡 + 𝑍𝑍𝑖𝑖𝑡𝑡 (3) where 𝛼𝛼0𝑖𝑖 = 𝑀𝑀𝑀𝑀𝑀𝑀𝑖𝑖𝑒𝑒 + 𝑣𝑣𝑖𝑖0.
We then turn our attention to the stochastic process 𝑍𝑍𝑖𝑖𝑡𝑡. For simplicity, we model Zit as an AR(1): (1- ϕiL)Zit = εit (4)
with 0 ≤ ϕi ≤ 1, where L is the lag operator, and where εit ~ WN(0, σ2)
So, combining Eq. (3) and Eq. (4),
MKSit = 𝛼𝛼0𝑖𝑖 + 𝛼𝛼1𝑖𝑖Tt + ϕiZit-1 + εit (5)
From Eq. (3), MKSit - 𝛼𝛼0𝑖𝑖 - 𝛼𝛼1𝑖𝑖Tt = Zit (6)
So, changing the ‘time counter subscript’ in Eq. 6,
MKSit-1 - 𝛼𝛼0𝑖𝑖- 𝛼𝛼1𝑖𝑖Tt-1 = Zit-1 (7)
From Eq. (5) and Eq. (7):
MKSit = 𝛼𝛼0𝑖𝑖 + 𝛼𝛼1𝑖𝑖Tt + ϕi [MKSit-1 - 𝛼𝛼0𝑖𝑖 - 𝛼𝛼1𝑖𝑖Tt-1] + εit (8)
6 Though the notation differs somewhat, these equations (1) and (2) follow Gallet and List (2001, p. 474-5) and Carlino and Mills (1996, p. 600) very closely.
8
Re-arranging Eq. (8) and using the lag-operator (L): MKSit = (1 - ϕi)𝛼𝛼0𝑖𝑖 + 𝛼𝛼1𝑖𝑖(1 - ϕi L)Tt + ϕi MKSit-1 + εit (9)
Eq. (9) is the central equation of the model. It deserves some comments. First, we observe what happens when we take the limits for ϕi, from Eq. (9), Case a) first, limit to 0:
lim𝜙𝜙𝑖𝑖→0
𝑀𝑀𝑀𝑀𝑀𝑀𝑖𝑖𝑡𝑡 = 𝛼𝛼0𝑖𝑖 + 𝛼𝛼1𝑖𝑖𝑇𝑇𝑡𝑡 + 𝜀𝜀𝑖𝑖𝑡𝑡 (9a)
In this case, Eq. (9a), there is no unit-root, and thus no hysteresis. There is deterministic conditional convergence to the time-invariant equilibrium idiosyncratic market shares. It follows logically that this return to conditional convergence signals an absence of serious rivalry within the industry. Low levels of rivalry or competition generally coincide with less movement in market shares (see Bikker and van Leuvensteijn 2008). Moreover, in explicit cartels, firms often set certain agreed-upon market shares, often based on historical or otherwise entrenched market shares. Such was the case in the JFTC action against certain tire products in 2004 (see section 2 of this paper and in NDP 2015).7
Case b) second, limit to 1: lim𝜙𝜙𝑖𝑖→1
𝑀𝑀𝑀𝑀𝑀𝑀𝑖𝑖𝑡𝑡 = 𝛼𝛼1𝑖𝑖+ MKSit-1 + εit (9b)
With Eq. (9b), we observe that if ϕi →1 (unit root), then indeed Eq. (9) becomes a random walk with a firm-specific drift 𝛼𝛼1𝑖𝑖 . There is hysteresis: the industry exhibits competitive behavior, as it rewards a firm’s production efforts and rivalry in general. We do not have conditional deterministic convergence, nor do we have stochastic convergence. In other words, the process is not stationary.
Case c) finally, when 0 < ϕi < 1. This is the intermediate case.
The stochastic process is stationary, and we have a combination of deterministic and stochastic convergence. That process is actually quite sophisticated and means that, following a firm-specific random shock (for example a lowering of the average cost), a firm’s (relative) production market share will come back slowly over time to its time-invariant equilibrium differential. The difference, with the situation where ϕi = 0, is that, here, this random shock will have long lasting (but decreasing over time, ‘slow-decaying’) effects.
Second, we revisit Eq. (9) as:
7 In the case of the bid-rigging scheme in 2004 in tires sold to the Japanese Defense Agency, agreed-upon market shares were very precise. E.g. Bridgestone was to get 35.55% of the market.
9
MKSit = 𝛽𝛽0𝑖𝑖+ 𝛽𝛽1𝑖𝑖Tt + ϕi MKSit-1 + εit (10)
where 𝛽𝛽0𝑖𝑖 = (1 - ϕi)𝛼𝛼0𝑖𝑖 and 𝛽𝛽1𝑖𝑖 = 𝛼𝛼1𝑖𝑖(1 - ϕi L)
Subtracting MKSit-1 on both sides produces the basic Dickey - Fuller (1979) equation:
ΔMKSit = 𝛽𝛽0𝑖𝑖+ 𝛽𝛽1𝑖𝑖Tt + (ϕi -1)MKSit-1 + εit (11)
Finally, with (ϕi -1) = ρi
ΔMKSit = 𝛽𝛽0𝑖𝑖+ 𝛽𝛽1𝑖𝑖Tt + ρiMKSit-1 + εit (12)
We can estimate Eq. (12), using OLS and test if ρi = 0 or not. If ρi = 0, we conclude that the time-series, for firm i, has a unit-root.
Derived from Eq. (9), Eq. (12) guides our empirical strategy. Specifically, as we run the various unit-root tests, first firm-specific, then as panel unit-roots, we allow for an intercept (𝛽𝛽0) and a time-trend (Tt). Naturally, one can extend Eq. (12) by adding the (multiple) lagged values of the dependent variable as regressors on the right-hand side, to obtain the Augmented Dickey-Fuller (ADF) equation. 8
4. Application
4.1. The data:
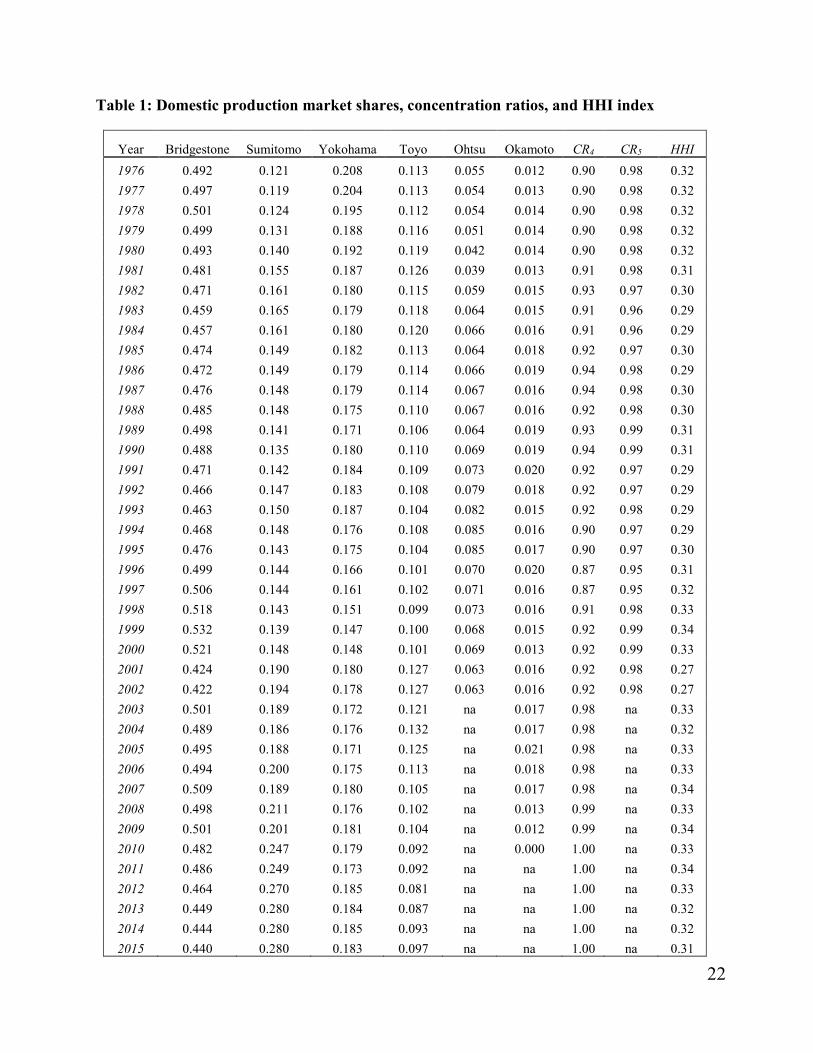
In this section, we present and discuss the statistical properties of our data set. We have also included the concentration ratios, CR4 and CR5, and the Herfindahl-Hirschman Index (HHI).
(Refer to Table 1 at the end of the paper)
A note about the firms. The sum of all market shares must add to 1. However, like Giannetti (2015), we consider only the (six, then five, then four) main players. They cover between 95% and 100% of the market over 40 years.
Based on the evolution of these market shares (see Figure 3 in Section 2 above, and descriptive statistics in Table 2 below), we conclude there is a stability (persistence) of these dominant players. This means that the Japanese tire industry is not a free entry market. Thus, we do not expect that all market shares will go down over time. In addition, the Japanese tire market is de facto closed to foreign competitors (except perhaps for very specialised, high-performance tires).
8 The critical values differ, of course, from those of standard OLS because the ADF statistic does not have a normal distribution.
10
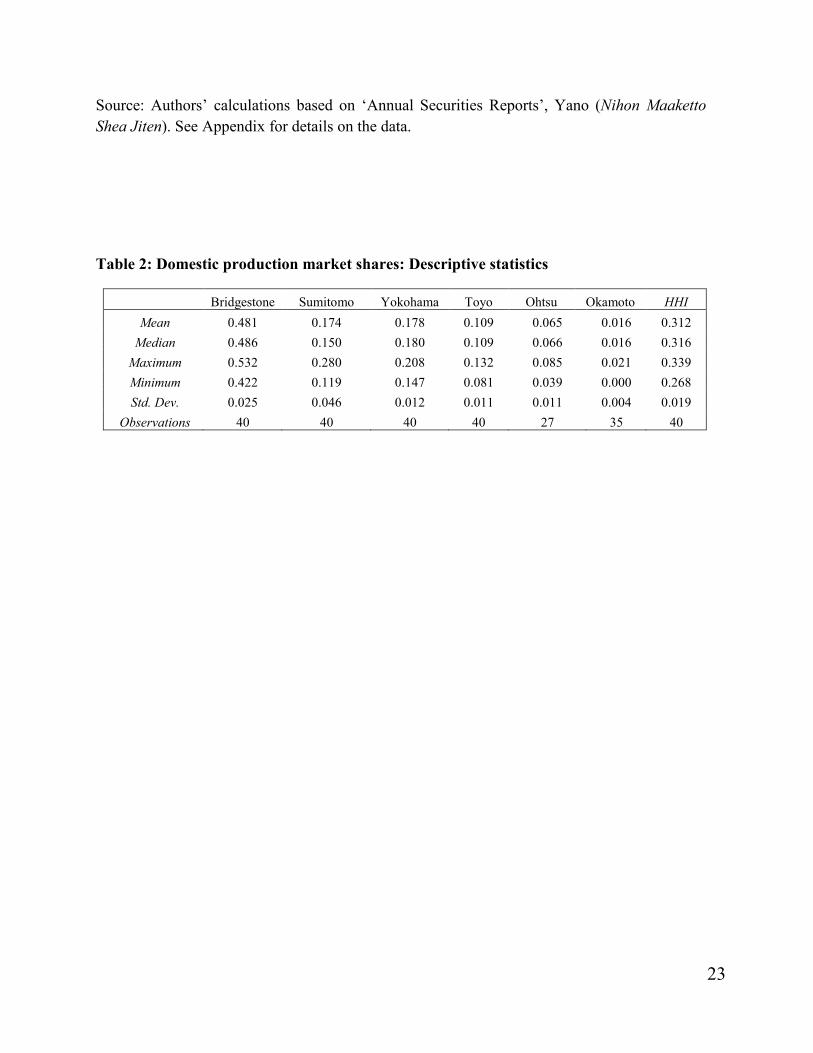
We present the mean, maximum, minimum, and standard deviation values in Table 2.
(See Table 2 at the end of the paper)
We observe the dominant role played by Bridgestone which, in certain years, has had a production market share above 50%. However, from a statistical point of view, Sumitomo is more intriguing. It has, by far, the largest standard deviation (.046) of the group. This explains, in part, why it has also the largest range (between minimum and maximum values): 16.1 % over the 1976-2015 period.
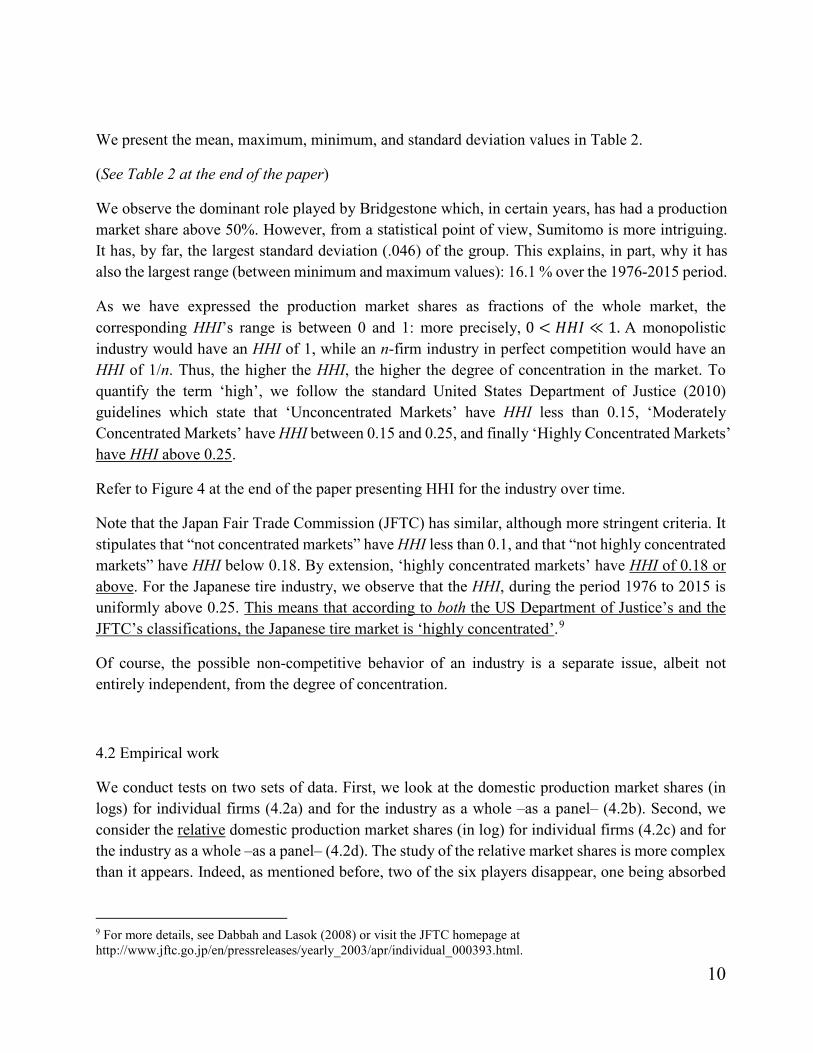
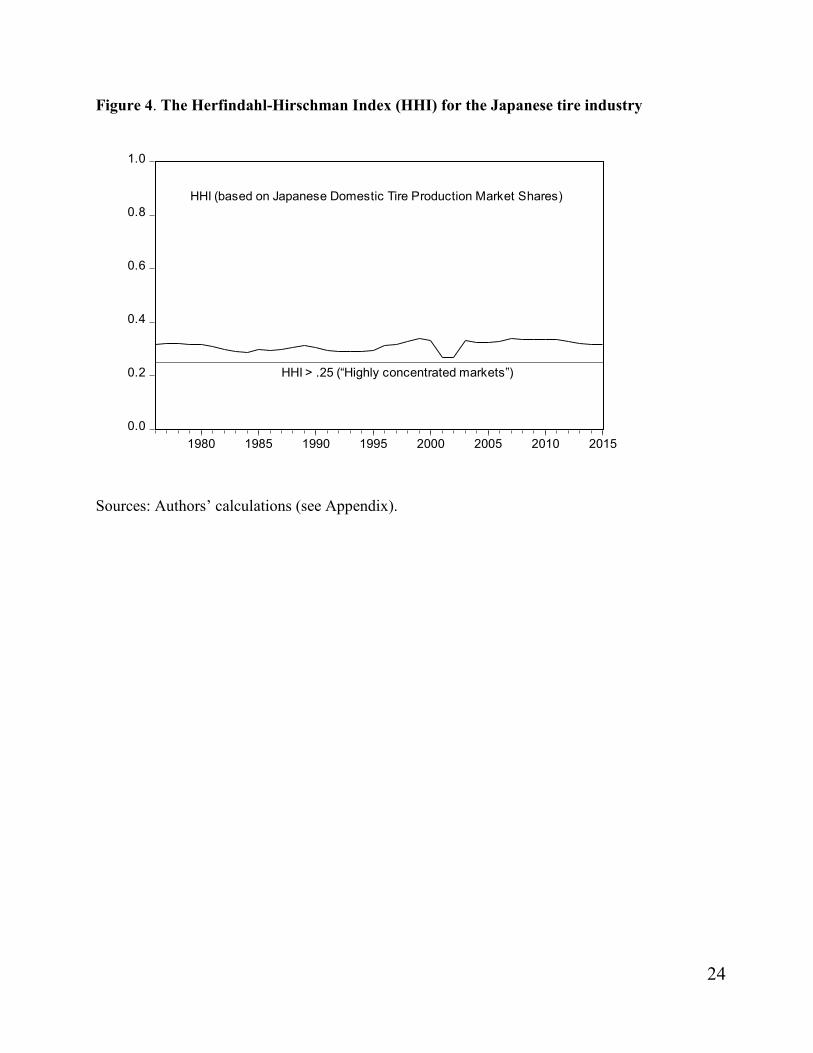
As we have expressed the production market shares as fractions of the whole market, the corresponding HHI’s range is between 0 and 1: more precisely, 0 < 𝐻𝐻𝐻𝐻𝐻𝐻 ≪ 1. A monopolistic industry would have an HHI of 1, while an n-firm industry in perfect competition would have an HHI of 1/n. Thus, the higher the HHI, the higher the degree of concentration in the market. To quantify the term ‘high’, we follow the standard United States Department of Justice (2010) guidelines which state that ‘Unconcentrated Markets’ have HHI less than 0.15, ‘Moderately Concentrated Markets’ have HHI between 0.15 and 0.25, and finally ‘Highly Concentrated Markets’ have HHI above 0.25.
Refer to Figure 4 at the end of the paper presenting HHI for the industry over time.
Note that the Japan Fair Trade Commission (JFTC) has similar, although more stringent criteria. It stipulates that “not concentrated markets” have HHI less than 0.1, and that “not highly concentrated markets” have HHI below 0.18. By extension, ‘highly concentrated markets’ have HHI of 0.18 or above. For the Japanese tire industry, we observe that the HHI, during the period 1976 to 2015 is uniformly above 0.25. This means that according to both the US Department of Justice’s and the JFTC’s classifications, the Japanese tire market is ‘highly concentrated’.9
Of course, the possible non-competitive behavior of an industry is a separate issue, albeit not entirely independent, from the degree of concentration.
4.2 Empirical work
We conduct tests on two sets of data. First, we look at the domestic production market shares (in logs) for individual firms (4.2a) and for the industry as a whole –as a panel– (4.2b). Second, we consider the relative domestic production market shares (in log) for individual firms (4.2c) and for the industry as a whole –as a panel– (4.2d). The study of the relative market shares is more complex than it appears. Indeed, as mentioned before, two of the six players disappear, one being absorbed
9 For more details, see Dabbah and Lasok (2008) or visit the JFTC homepage at http://www.jftc.go.jp/en/pressreleases/yearly_2003/apr/individual_000393.html.
11
in 2003 and the other exiting the market in 2010. So, the number of players is not constant over the data sample: it decreases over time.
4.2a Unit-root tests on domestic production market shares (in logs)
We are using annual data from 1976 to up to and including 2015. Indeed, as noted before, the number of competitors in that industry has shrunk over time. Ohtsu was absorbed by Sumitomo in 2003, and Okamoto ceased production in 2010.
TMKSi = Tire Market Share, where i = 1 to 6.
So, we have:
TMKS1 = Bridgestone Market Share = BRMKS
TMKS2 = Sumitomo Market Share = SUMKS
TMKS3 = Yokohama Market Share = YOMKS
TMKS4 = Toyo Market Share = TOMKS
TMKS5 = Ohtsu Market Share = OHMKS
TMKS6 = Okamoto Market Share = OKMKS
The corresponding (natural) logs are labelled as follows;
For Bridgestone: LBRMKS, for Sumitomo: LSUMKS, for Yokohama LYOMKS, for
Toyo: LTOMKS, for Ohtsu: LOHMKS, and for Okamoto: LOKMKS.
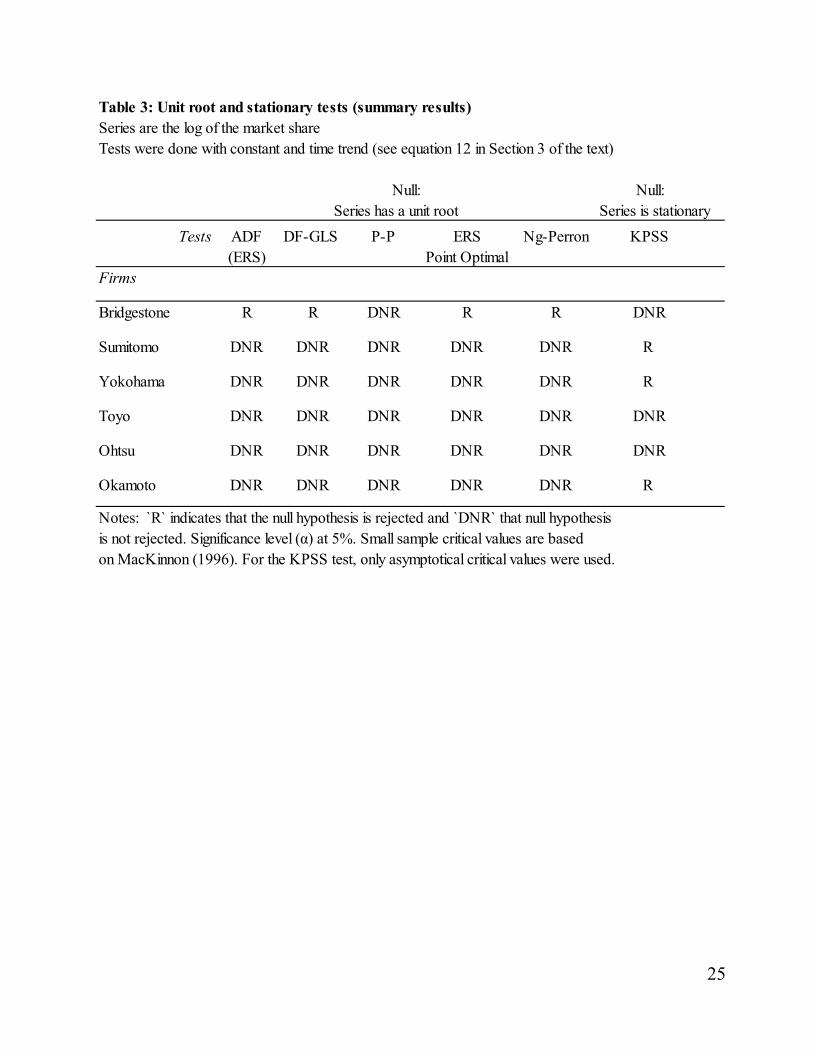
We conduct the Augmented Dickey-Fuller (ADF), GLS transformed Dickey-Fuller (DFGLS), Phillips-Perron (PP), Elliot, Rothenberg and Stock (ERS) Point Optimal, and Ng and Perron (NP) tests. We also conduct the Kwiatkowski, et. al. (KPSS) test whose null is `stationarity` rather than having a unit root.
For the unit root tests, we include a constant and a linear time trend. This is the most plausible representation of our underlying model described in Section 3.
We present, in Table 3, a summary of the results. The detailed test results are available upon request.
(Refer to Table 3 at the end of the paper)
Three main results flow from Table 3. First, four of the five unit-root tests reject the null hypothesis (of a unit root) for the dominant player in the industry (Bridgestone). Second, five out of five unit-
12
root tests do not reject the null hypothesis of a unit root for the smaller firms in the industry. Finally, regarding stationarity, again, there seems to be a difference between the dominant player, for whom the stationarity hypothesis is not rejected, and the (three of the five) other firms, for whom the stationarity hypothesis is rejected.
Based on these unit-root tests on individual firms, we can tentatively -and cautiously- conclude that, for that industry and that dataset, the dominant player (Bridgestone) seems to behave as if it were above -and undisturbed by- the more intense rivalry and competition apparently taking place between the five smaller firms.
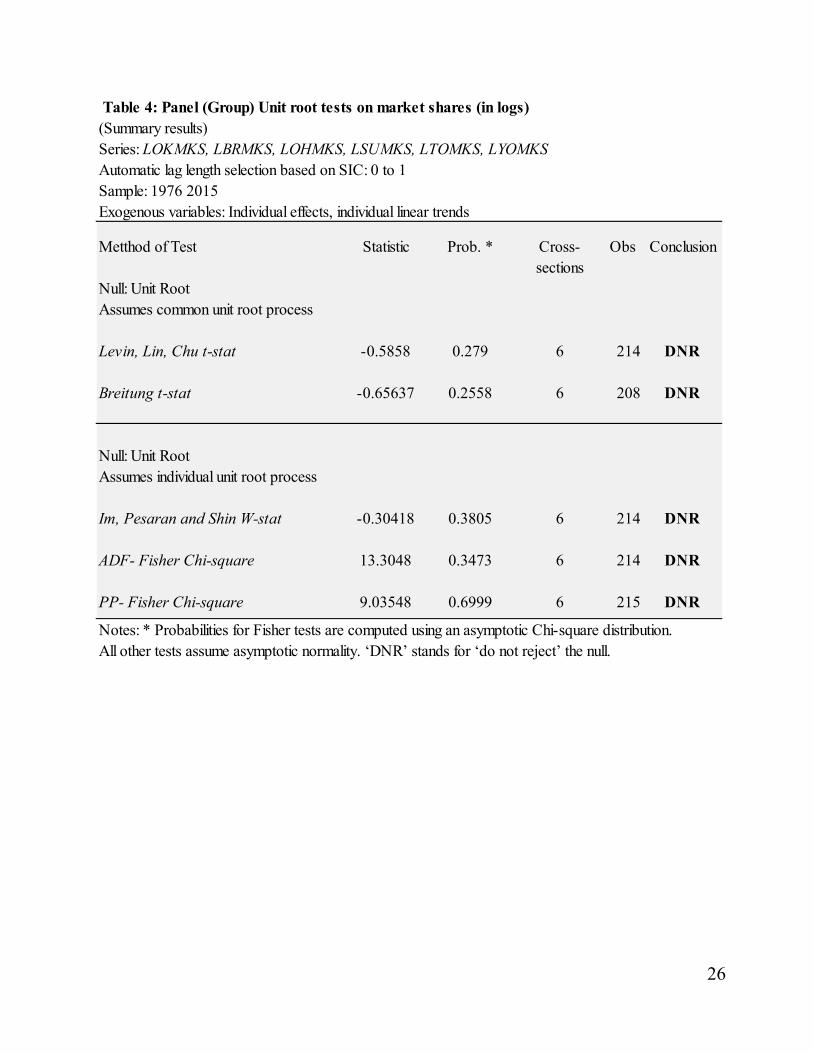
4.2b Panel Unit-root tests on domestic production market shares (in logs)
In Table 4 (see end of paper), we present a summary of the various panel unit-root tests results.
The result, which indicates that we cannot reject the hypothesis of a [common] unit-root process, is rather unsurprising: it was foretold by the tests on individual series (Section 4.2a).
Table 4’s data imply that we do indeed have an overall active rivalry within that industry. However, tests on individual firms have indicated that this rivalry may be more prominent among the smaller firms than the industry leader.
4.2c Unit root tests on the relative domestic production market shares (in logs)
Here, we are asking a more stringent question: is there is natural tendency for relative market shares to conditionally converge? In the absence of conditional convergence, we posit there is a form of hysteresis (as represented by a unit root) and therefore intense levels of competition.
First, we create the series (1976-2015) ATMKS = Average Tire Market Share
ATMKSt = 1𝑛𝑛
∑ 𝑇𝑇𝑀𝑀𝑀𝑀𝑀𝑀𝑖𝑖𝑡𝑡𝑛𝑛𝑖𝑖=1 where n = 6 from 1976 to 2002, n = 5 from 2003 to 2009, and n = 4 from
2010 to 2015.
We then create the ‘log of relative market shares’ series (1976-2015):
LRMKSit = log(TMKSit/ATMKSt).
These are the six time-series we consider in our unit-root tests.
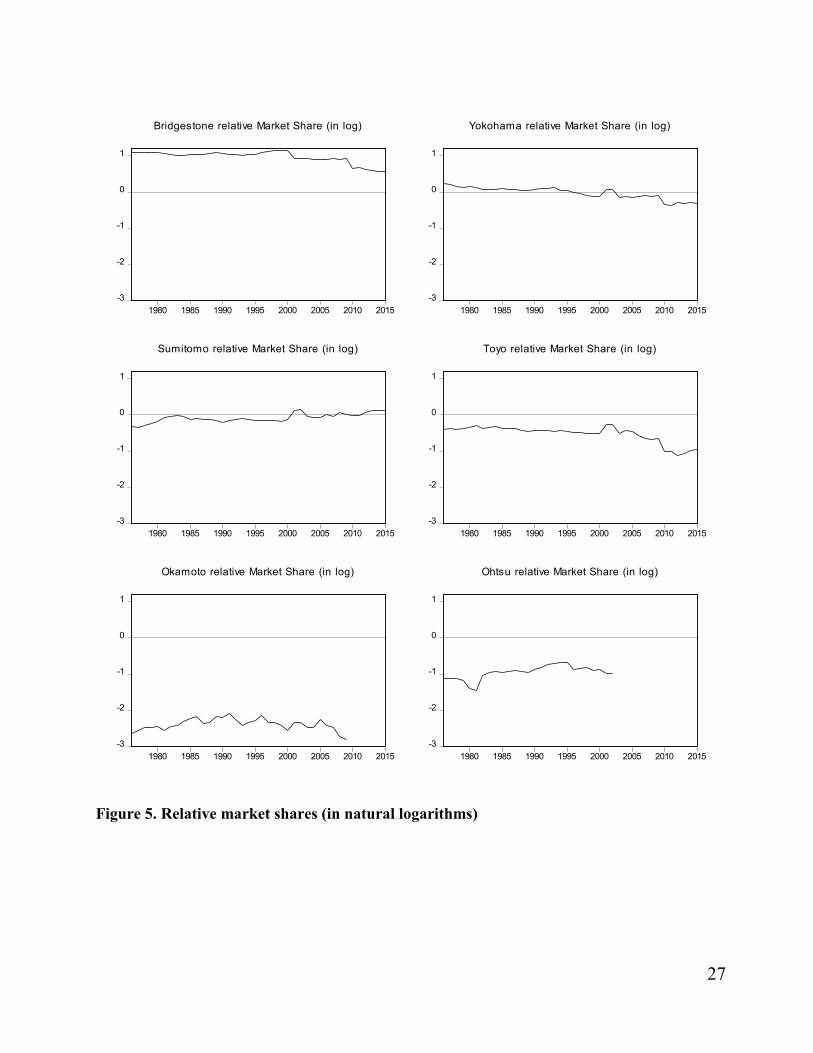
Comments on Figure 5 (see graph at end of the paper): we observe a clear dichotomy in the relative market shares. Only Bridgestone has log relative market share values close to 1.16 and declining to around 0.57. This means that the Bridgestone’s market share has oscillated between 3.19 and 1.86 times the average market share in the industry for that year. Bridgestone has been clearly the
13
dominant company. Inversely, Sumitomo, Yokohama, Toyo, and Okamoto (until 2009), and Ohtsu (up to 2002) have had relative market share values mostly below zero. This means that their relative market shares (in log) have been mostly below the average market share in the industry.
The second comment relates to the shape of the graphs. While it appears that the dominant player (Bridgestone) becomes slightly less dominant after 2000 (and until 2015), that result must be qualified by the fact that the number of competitors has gone down during that period (from six to four). This has raised the average market share (and, thus, our denominator in our ‘relative market share’ formula) from around 0.167 to 0.2 in 2003, and to 0.25 in 2010. The point is equally valid for the firms Sumitomo, Yokohama, and Toyo, and to a lesser extent for Okamoto.
This distinction is due to the fact that we are facing a declining number of firms in that industry. This drives the ‘average market share’ upwards. The ‘average market share’ is on the denominator of the ‘relative market share.’ So, as the denominator goes up, the ‘relative market share’ goes down (ceteris paribus).
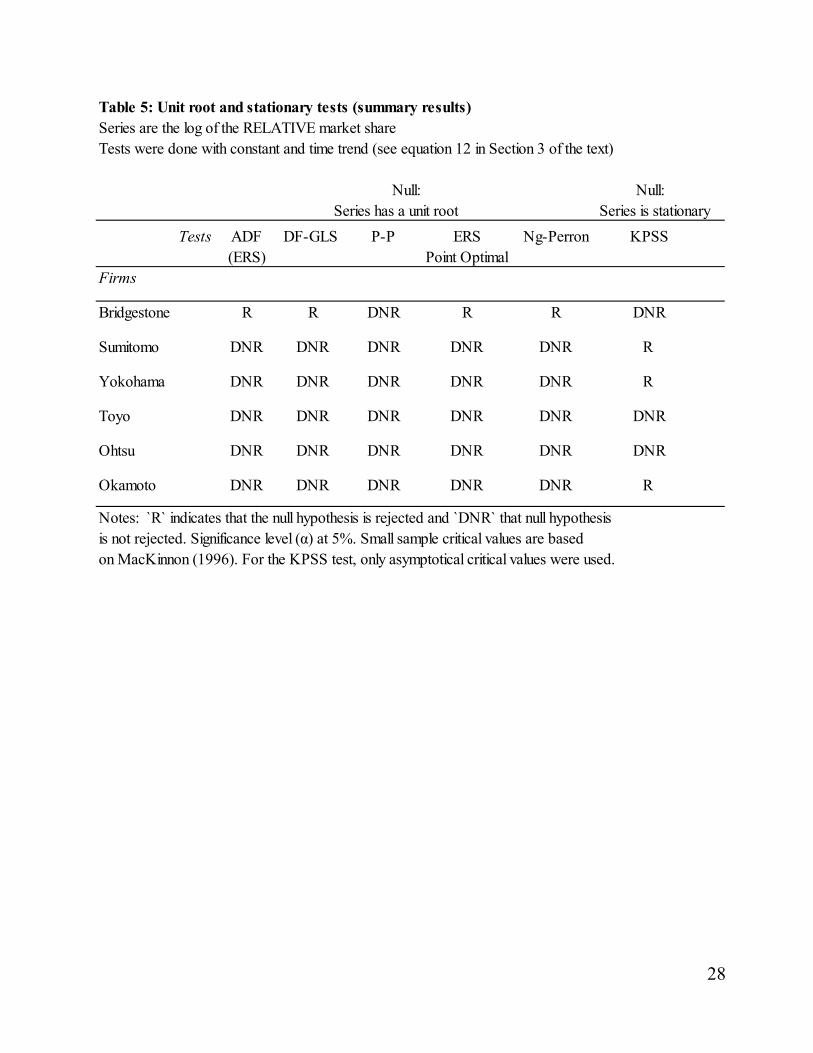
In Table 5, (see end of paper) we present a summary of the various unit root tests done on the (log of the) relative market shares of individual firms. The detailed test results are available upon request.
The message from Table 5 (see end of paper) is more complicated to interpret. Indeed, there is no rejection of the unit-root hypothesis in 25 of the 30 possible cases (five 5 tests on six firms). As for the stationarity KPSS test, the null hypothesis is rejected in four (4) of the six (6) cases.
As mentioned above, the sharp decrease in the number of firms (from six to four) over the period concerned explains a large part of this instability in the relative market shares.
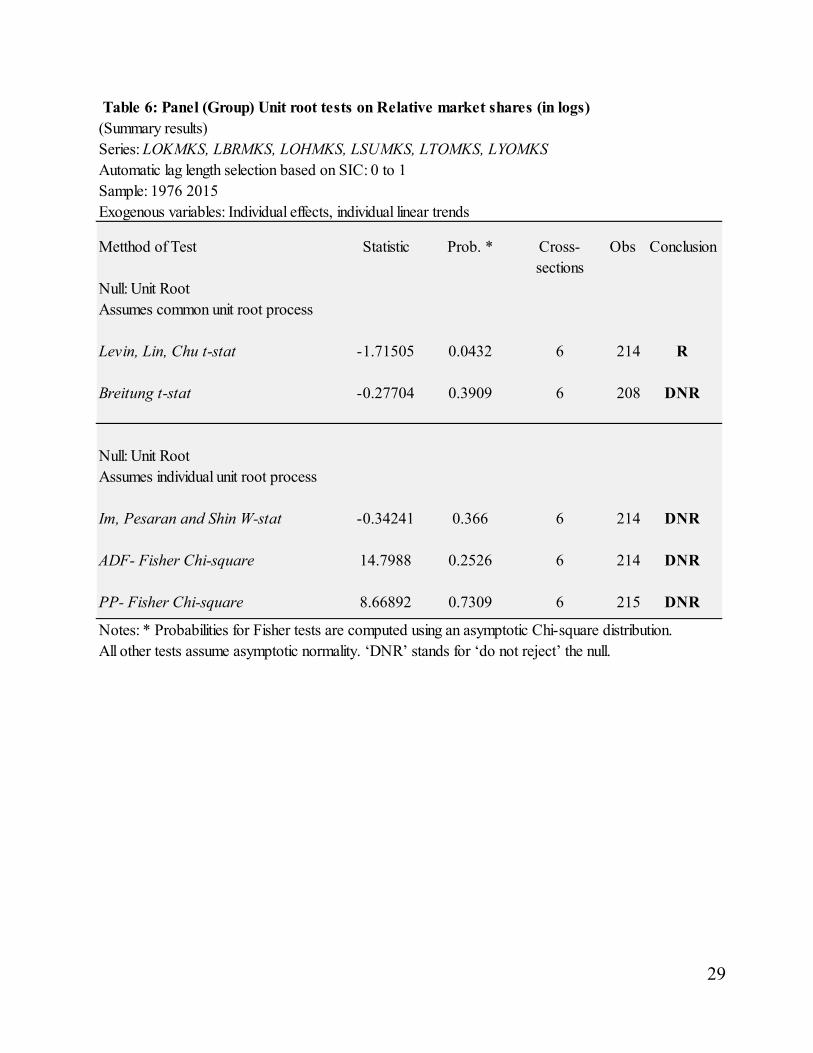
Viewed for the industry as whole, the analysis is confirmed. The relative market shares in the tire industry have exhibited instability. Consider Table 6 (at end of paper), which summarizes various panel unit-root tests for the relative market shares. We see that in four of the five tests, we do not reject the hypothesis of a unit-root.
Conclusions and Implications
The Japanese tire market has had a small number of players over a long period of time with virtually no new entrants. The market is also characterized by a high HHI (though the high HHI is mostly driven by Bridgestone’s roughly 50% market share). So, it is clear that the market is highly concentrated. What is not clear is whether there is a high or low degree of competition among the handful of firms. Indeed. It is well-known from theory that even with a small number of firms, intense competition is possible. As such, we need empirical tools to help assess the degree of competition.
14
We have presented a relatively simple, yet powerful, way to look at competitive behavior and rivalry within an industry (or market segment) by testing for the presence of unit-roots (for single series and in a panel) in market shares. We have applied this approach to the Japanese tire industry. However, our method can easily be applied to other industries (or market segments) and, as such, should be useful for academics, portfolio managers and regulators.
We also test for unit roots of the relative market shares. The declining number of competitors over time makes the use of relative market shares complicated, but not un-rewarding. Results obtained here may be relevant when comparing with other related industries and future work.
The main finding is the dichotomy between the behaviors of the leading/dominant firm (Bridgestone) and that of the other, much smaller, tire firms.
Based on these unit-root tests on individual firms, it appears that the dominant player (Bridgestone) seems to behave differently than the five smaller firms. In particular, its market share does not have a unit root which suggests convergence to a historical mean. The other firms all do, however, appear to have a unit root, which may indicate more competition and rivalry amongst the smaller competitors.
While empirical work (in English) on the Japanese tire market is scarce, at least one previous work (NDP 2015) finds a reasonable degree of competition as compared to other industries. Using a very different methodology here, we again find that the firms appear to be acting competitively. However, as mentioned above, when we break out the individual behaviors of the firms (something that cannot be done with the method used in NDP), we reveal a more subtle picture of the market. It appears that the market behemoth, Bridgestone, may be quite stable and may behave as a market-leader, while the other smaller firms fight for market share. While we cannot be certain of this, it does suggest further avenues for research in this industry.
Appendix: Data
Constructing consistent market shares
Constructing a consistent series of market shares for the six major firms over 40 years presented certain obstacles. Japan has two books produced annually which report market-shares by firms for hundreds and even thousands of industries, including tires for automobiles. Those two books are Yano’s Japan Market Share Dictionary (Nihon Maaketto Shea Jiten) and the Nikkei Market Share Investigation (Nikkei Shea Chousa). The Nikkei book only began being published a few years ago, so could not be used.
While the Yano books go back to 1980 and even a little further, there is one critical flaw. Up until and including 1997, Yano reports market shares based on quantity (tons of rubber). However, from
15
1998 and onwards, Yano reports market shares in yen (i.e. value) and calls it ‘value of production’ (‘sei-san daka’). (In the data up until 1997 it is not made clear whether this is ‘produced’ or ‘sold’.)
As such, we were forced to construct our own shares for the early years. One promising alternative was to use the Tire Yearbooks (‘Taiya Nenkan’), published annually by JATMA (Japan Automobile Tire Manufacturing Association). This, however, presented numerous challenges as well. While those yearbooks do provide firm-level data for production, such as ‘capacity’ and sales, it is not consistent across years, nor across firms. For just one of many examples, in more recent years, Yokohama production data is reported in ‘number of tires’, but for the other firms it is reported in ‘tons of rubber’. As such, the Yearbook data was unusable.
Our final market shares series is based in part of the Annual Securities Reports (yuuka-shouken houkokusho) of Japanese firms’ data obtained by the ‘Eol’ online database. This reports total sales (uri-age daka) in yen, but also reports of sales of just the ‘tires and tubes’ segment of these rubber products firms. It was this data that was used to construct the early market shares data.
There was a last hurdle, however. Since the 2000s Japan firms began switching to submitting annual reports on a consolidated basis, in which all sales of tires of the firm worldwide, including foreign subsidiaries, are reported jointly. As such, we cannot determine the market shares based on Japan tires made in Japan from the new, consolidated annual reports.
Fortunately, Yano’s Market shares have always also pertained only to sales of tires produced in Japan. Thus, we did the following. For data up to and including 1997, our market shares are based on the annual reports’ sales data. From 1998 and onwards, we used the data from Yano, which also reports sales in yen. There was naturally a concern in splicing data from two different sources. However, our concerns were allayed when we confirmed that the 1998 market shares which we constructed from the annual reports were exactly the same to a decimal point as the Yano data. That is to say, the market shares for all six of the firms were: 15.1% (Yokohama), 9.9% (Toyo), 7.3% (Ohtsu), 1.6% (Okamoto), 51.8% (Bridgestone) and 14.3% (Sumitomo) from both our calculations from the annual reports and the market share figures reported in the Yano dictionary for 1998.
A last comment is in order with respect to the global nature of these firms and this market. A relatively small quantity of tires is imported into Japan (about 10%, of the Japanese market, based on Japan Customs data and total market sales data from Yano.) The largest share of imports is from China followed by others such as Thailand, Indonesia, etc. Many of these imports are from subsidiaries abroad (e.g. Bridgestone has six plants in China and four in Thailand). On the other hand, Japanese tires produced in Japan are exported in large amounts. Bridgestone exports a lot more tires abroad than it sells at home (quantity-based data in 2016, from the Tire Yearbook) share. Note that its domestic sales in Japan are still massive and dominant. Sumitomo exports a bit more abroad than it sells at home. Yokohama sells about the same home and abroad. Toyo sells more of its Japan-made tires in Japan than are exported abroad.
16
In this paper, as in the market shares presented in Yano (and Nikkei), we are looking at shares of tires made in Japan, not only sold in Japan. While precise, consistent market share data on tires sold in Japan only is not available in any of the above sources, we feel comfortable using this broader definition of market share. If there is any collusion, explicit or implicit, it must certainly be, first and foremost, among the Japanese firms based in Japan. If the Japanese tire industry is behaving like a cartel, it seems natural that they would be seeking to stabilizes sales, production, and indeed, employment, based on total production by its factories in Japan, if possible, rather than ignoring the export sales, which are sizeable.
References
Bikker, J.A. and van Leuvensteijn, M. (2008). Competition and efficiency in the Dutch life insurance industry, Applied Economics 40(16): 2063-2084.
Breitung, J. and Meyer, W. (1994). Testing for unit roots in panel data: are wages on different bargaining levels cointegrated? Applied Economics 26(4): 353-361.
Carlino, G. A. and Mills, L. O. (1996). Testing neoclassical convergence in regional incomes and earnings. Regional Science and Urban Economics26(6): 565–590.
Carrion-I-Silvestre, J. L., Sanso-I-Rossello, A. and Ortuno, M. A. (2001). Unit root and stationarity tests’ wedding. Economics Letters 70(1): 1-8.
Dabbah, M.M., and Lasok, P. (2008). Merger Control Worldwide: Second Supplement to the First Edition. Cambridge University Press.
Dickey, D. A. and Fuller, W. A. (1979). Distribution of the Estimators for Autoregressive Time Series with a Unit Root. Journal of the American Statistical Association 74(366): 427–431.
Elliot, G., T.J. Rothenberg, and J.H. Stock (1996). Efficient Tests for an Autoregressive Unit Root. Econometrica 64(4): 813-836. Gallet, C. A. and List, J. A. (2001). Market share instability: an application of unit root tests to the cigarette industry. Journal of Economics and Business 53(5): 473-480.
Guelle, F. (2002) The Tire Industry: A Comparative Study About the Strategy of Internationalization of French and Japanese Multinationals. In: Horaguchi H. and Shimokawa K. (eds.) Japanese Foreign Direct Investment and the East Asian Industrial System. Tokyo: Springer.
Giannetti, C. (2015). Unit roots and the dynamics of market shares: an analysis using an Italian banking micro-panel. Empirical Economics 48(2): 537–555.
17
Göcke, M. (2002). Various Concepts of Hysteresis Applied in Economics. Journal of Economic Surveys 16(2): 167-188.
Granger, C. W. J. and Swanson, N. R. (1997). An introduction to stochastic unit-root processes. Journal of Econometrics 80(1): 35-62.
Im, K.S., Pesaran, M.H. and Shin, Y. (2003). Testing for Unit Roots in Heterogeneous Panels. Journal of Economics 115(1): 53-74.
Klepper, S. and Simons, K. L. (2000). The Making of an Oligopoly: Firm Survival and Technological Change in the Evolution of the U.S. Tire Industry. Journal of Political Economy 108 (4): 728-60.
Kwiatowski, D. P.C.B. Phillips, P. Schmidt and Y. Shin (1992). Testing the null hypothesis of stationarity against the alternative of a unit root. Journal of Econometrics 54(1-3): 159-178.
Levin, A., C. F. Lin, and Chu, C. (2002). Unit Root Tests in Panel Data: Asymptotic and Finite-Sample Properties. Journal of Econometrics 108(1): 1-24.
Lo, A.W. MacKinlay, A. C. (2002). A Non-Random Walk Down Wall Street. Princeton: Princeton University Press.
MacKinnon, J. G. (1996). Numerical Distribution Functions for Unit Root and Cointegration Tests. Journal of Applied Econometrics 11(6): 601-618.
Maddala, G.S. and Kim, I-M (1999). Unit Roots, Cointegration and Structural Change. Cambridge, UK: Cambridge University Press.
Ng, S., and P. Perron (2001). Lag Length Selection and the Construction of Unit Root Tests with Good Size and Power. Econometrica 69 (6): 1519-1554. Nguyen, X. D., de Vanssay, X., and Parsons C. R. (2015). The Japanese Automobile Tire Industry under Scrutiny. International Journal of the Economics of Business 22(1): 141-162.
Parsons, C. R., Nguyen, X. D. and X. de Vanssay (2018). New Evidence of Market Competition in the Japanese Tire Industry using Market Share Analysis. CESSA Working Paper 2018-02.
Perron, P. (1989). The great crash, the oil price shock, and the unit root hypothesis. Econometrica 57(6): 1361-1401.
Pesaran, M. H. (2015). Time Series and Panel Data Econometrics. Oxford University Press.
Phillips, P. C. B. and Perron, P. (1988). Testing for a Unit Root in Time Series Regression. Biometrika 75(2): 335–346.
18
Rogoff, K. (1996). The Purchasing Power Parity Puzzle. Journal of Economic Literature 34(2): 647-688.
Sephton P. (2008). Market shares and rivalry in the U.S. cigarette industry. Applied Economics Letters 15(6): 417-422.
Tire Yearbook (Taiya Nenkan), 1991~2017, Published annually by Tokyo: RK Tsushinsha.
United States Department of Justice (2010). Horizontal Merger Guidelines (08/19/2010), https://www.justice.gov/atr/horizontal-merger-guidelines-08192010#2d [Perma Link: https://perma.cc/SQ9T-9R8V ].
19
Figure 1. Japan’s production volume of tires and automobiles
Source: Automotive Yearbook and Tire Yearbook.
0
200
400
600
800
1000
1200
1400
1600
0
2000
4000
6000
8000
10000
12000
14000
1600019
76
1978
1980
1982
1984
1986
1988
1990
1992
1994
1996
1998
2000
2002
2004
2006
2008
2010
2012
2014
2016
Thou
sand
tons
of r
ubbe
r
Thou
sand
uni
ts
Automobile Production Tire Production (for automobile) tons of rubber
20
Figure 2. Tire Distribution Channels
Aut
o M
aker
s Cars for Export Original
Equipment
Cars for Domestic Use
Tyre Specialty Shops
Large Users
Distributors
Tyre
Dea
lers
Car Dealers
Tyre Makers
Replacement
Service Stations Business
Users Car Repair Shops
Auto Parts Retailers
Private Users Others
Direct
Export
Exports
Trading
companies
Source: NDP (2015)
21
Figure 3. Japanese Tire Manufacturers’ Domestic Production: Market Shares
0
0.1
0.2
0.3
0.4
0.5
0.6
0.7
0.8
0.9
1
19761978198019821984198619881990199219941996199820002002200420062008201020122014
Bridgestone Sumitomo Yokohama Toyo Okamoto Ohtsu
22
Table 1: Domestic production market shares, concentration ratios, and HHI index
Year Bridgestone Sumitomo Yokohama Toyo Ohtsu Okamoto CR4 CR5 HHI 1976 0.492 0.121 0.208 0.113 0.055 0.012 0.90 0.98 0.32 1977 0.497 0.119 0.204 0.113 0.054 0.013 0.90 0.98 0.32 1978 0.501 0.124 0.195 0.112 0.054 0.014 0.90 0.98 0.32 1979 0.499 0.131 0.188 0.116 0.051 0.014 0.90 0.98 0.32 1980 0.493 0.140 0.192 0.119 0.042 0.014 0.90 0.98 0.32 1981 0.481 0.155 0.187 0.126 0.039 0.013 0.91 0.98 0.31 1982 0.471 0.161 0.180 0.115 0.059 0.015 0.93 0.97 0.30 1983 0.459 0.165 0.179 0.118 0.064 0.015 0.91 0.96 0.29 1984 0.457 0.161 0.180 0.120 0.066 0.016 0.91 0.96 0.29 1985 0.474 0.149 0.182 0.113 0.064 0.018 0.92 0.97 0.30 1986 0.472 0.149 0.179 0.114 0.066 0.019 0.94 0.98 0.29 1987 0.476 0.148 0.179 0.114 0.067 0.016 0.94 0.98 0.30 1988 0.485 0.148 0.175 0.110 0.067 0.016 0.92 0.98 0.30 1989 0.498 0.141 0.171 0.106 0.064 0.019 0.93 0.99 0.31 1990 0.488 0.135 0.180 0.110 0.069 0.019 0.94 0.99 0.31 1991 0.471 0.142 0.184 0.109 0.073 0.020 0.92 0.97 0.29 1992 0.466 0.147 0.183 0.108 0.079 0.018 0.92 0.97 0.29 1993 0.463 0.150 0.187 0.104 0.082 0.015 0.92 0.98 0.29 1994 0.468 0.148 0.176 0.108 0.085 0.016 0.90 0.97 0.29 1995 0.476 0.143 0.175 0.104 0.085 0.017 0.90 0.97 0.30 1996 0.499 0.144 0.166 0.101 0.070 0.020 0.87 0.95 0.31 1997 0.506 0.144 0.161 0.102 0.071 0.016 0.87 0.95 0.32 1998 0.518 0.143 0.151 0.099 0.073 0.016 0.91 0.98 0.33 1999 0.532 0.139 0.147 0.100 0.068 0.015 0.92 0.99 0.34 2000 0.521 0.148 0.148 0.101 0.069 0.013 0.92 0.99 0.33 2001 0.424 0.190 0.180 0.127 0.063 0.016 0.92 0.98 0.27 2002 0.422 0.194 0.178 0.127 0.063 0.016 0.92 0.98 0.27 2003 0.501 0.189 0.172 0.121 na 0.017 0.98 na 0.33 2004 0.489 0.186 0.176 0.132 na 0.017 0.98 na 0.32 2005 0.495 0.188 0.171 0.125 na 0.021 0.98 na 0.33 2006 0.494 0.200 0.175 0.113 na 0.018 0.98 na 0.33 2007 0.509 0.189 0.180 0.105 na 0.017 0.98 na 0.34 2008 0.498 0.211 0.176 0.102 na 0.013 0.99 na 0.33 2009 0.501 0.201 0.181 0.104 na 0.012 0.99 na 0.34 2010 0.482 0.247 0.179 0.092 na 0.000 1.00 na 0.33 2011 0.486 0.249 0.173 0.092 na na 1.00 na 0.34 2012 0.464 0.270 0.185 0.081 na na 1.00 na 0.33 2013 0.449 0.280 0.184 0.087 na na 1.00 na 0.32 2014 0.444 0.280 0.185 0.093 na na 1.00 na 0.32 2015 0.440 0.280 0.183 0.097 na na 1.00 na 0.31
23
Source: Authors’ calculations based on ‘Annual Securities Reports’, Yano (Nihon Maaketto Shea Jiten). See Appendix for details on the data.
Table 2: Domestic production market shares: Descriptive statistics
Bridgestone Sumitomo Yokohama Toyo Ohtsu Okamoto HHI Mean 0.481 0.174 0.178 0.109 0.065 0.016 0.312
Median 0.486 0.150 0.180 0.109 0.066 0.016 0.316 Maximum 0.532 0.280 0.208 0.132 0.085 0.021 0.339 Minimum 0.422 0.119 0.147 0.081 0.039 0.000 0.268 Std. Dev. 0.025 0.046 0.012 0.011 0.011 0.004 0.019
Observations 40 40 40 40 27 35 40
24
Figure 4. The Herfindahl-Hirschman Index (HHI) for the Japanese tire industry
0.0
0.2
0.4
0.6
0.8
1.0
1980 1985 1990 1995 2000 2005 2010 2015
HHI > .25 (“Highly concentrated markets”)
HHI (based on Japanese Domestic Tire Production Market Shares)
Sources: Authors’ calculations (see Appendix).
25
Table 3: Unit root and stationary tests (summary results)Series are the log of the market shareTests were done with constant and time trend (see equation 12 in Section 3 of the text)
Null: Series is stationary
Tests ADF DF-GLS P-P ERS Ng-Perron KPSS(ERS) Point Optimal
Firms
Bridgestone R R DNR R R DNR
Sumitomo DNR DNR DNR DNR DNR R
Yokohama DNR DNR DNR DNR DNR R
Toyo DNR DNR DNR DNR DNR DNR
Ohtsu DNR DNR DNR DNR DNR DNR
Okamoto DNR DNR DNR DNR DNR R
Notes: `R` indicates that the null hypothesis is rejected and `DNR` that null hypothesis is not rejected. Significance level (α) at 5%. Small sample critical values are basedon MacKinnon (1996). For the KPSS test, only asymptotical critical values were used.
Null:Series has a unit root
26
Table 4: Panel (Group) Unit root tests on market shares (in logs)(Summary results)Series: LOKMKS, LBRMKS, LOHMKS, LSUMKS, LTOMKS, LYOMKSAutomatic lag length selection based on SIC: 0 to 1
Metthod of Test Statistic Prob. * Cross- Obs Conclusionsections
Null: Unit RootAssumes common unit root process
Levin, Lin, Chu t-stat -0.5858 0.279 6 214 DNR
Breitung t-stat -0.65637 0.2558 6 208 DNR
Null: Unit RootAssumes individual unit root process
Im, Pesaran and Shin W-stat -0.30418 0.3805 6 214 DNR
ADF- Fisher Chi-square 13.3048 0.3473 6 214 DNR
PP- Fisher Chi-square 9.03548 0.6999 6 215 DNR
Notes: * Probabilities for Fisher tests are computed using an asymptotic Chi-square distribution. All other tests assume asymptotic normality. ‘DNR’ stands for ‘do not reject’ the null.
Sample: 1976 2015Exogenous variables: Individual effects, individual linear trends
27
-3
-2
-1
0
1
1980 1985 1990 1995 2000 2005 2010 2015
Bridgestone relative Market Share (in log)
-3
-2
-1
0
1
1980 1985 1990 1995 2000 2005 2010 2015
Yokohama relative Market Share (in log)
-3
-2
-1
0
1
1980 1985 1990 1995 2000 2005 2010 2015
Sumitomo relative Market Share (in log)
-3
-2
-1
0
1
1980 1985 1990 1995 2000 2005 2010 2015
Toyo relative Market Share (in log)
-3
-2
-1
0
1
1980 1985 1990 1995 2000 2005 2010 2015
Okamoto relative Market Share (in log)
-3
-2
-1
0
1
1980 1985 1990 1995 2000 2005 2010 2015
Ohtsu relative Market Share (in log)
Figure 5. Relative market shares (in natural logarithms)
28
Table 5: Unit root and stationary tests (summary results)Series are the log of the RELATIVE market shareTests were done with constant and time trend (see equation 12 in Section 3 of the text)
Null: Series is stationary
Tests ADF DF-GLS P-P ERS Ng-Perron KPSS(ERS) Point Optimal
Firms
Bridgestone R R DNR R R DNR
Sumitomo DNR DNR DNR DNR DNR R
Yokohama DNR DNR DNR DNR DNR R
Toyo DNR DNR DNR DNR DNR DNR
Ohtsu DNR DNR DNR DNR DNR DNR
Okamoto DNR DNR DNR DNR DNR R
Notes: `R` indicates that the null hypothesis is rejected and `DNR` that null hypothesis is not rejected. Significance level (α) at 5%. Small sample critical values are basedon MacKinnon (1996). For the KPSS test, only asymptotical critical values were used.
Null:Series has a unit root
29
Table 6: Panel (Group) Unit root tests on Relative market shares (in logs)(Summary results)Series: LOKMKS, LBRMKS, LOHMKS, LSUMKS, LTOMKS, LYOMKSAutomatic lag length selection based on SIC: 0 to 1
Metthod of Test Statistic Prob. * Cross- Obs Conclusionsections
Null: Unit RootAssumes common unit root process
Levin, Lin, Chu t-stat -1.71505 0.0432 6 214 R
Breitung t-stat -0.27704 0.3909 6 208 DNR
Null: Unit RootAssumes individual unit root process
Im, Pesaran and Shin W-stat -0.34241 0.366 6 214 DNR
ADF- Fisher Chi-square 14.7988 0.2526 6 214 DNR
PP- Fisher Chi-square 8.66892 0.7309 6 215 DNR
Notes: * Probabilities for Fisher tests are computed using an asymptotic Chi-square distribution. All other tests assume asymptotic normality. ‘DNR’ stands for ‘do not reject’ the null.
Sample: 1976 2015Exogenous variables: Individual effects, individual linear trends