Embed Size (px)
Citation preview
1
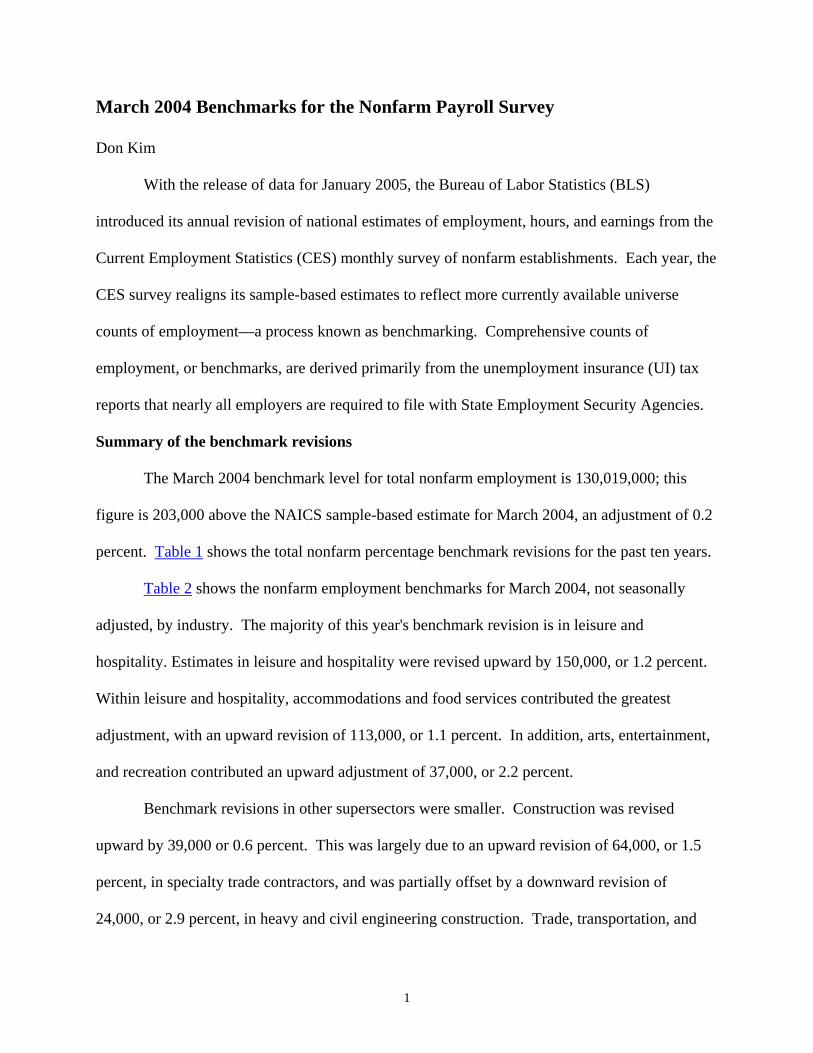
March 2004 Benchmarks for the Nonfarm Payroll Survey
Don Kim
With the release of data for January 2005, the Bureau of Labor Statistics (BLS)
introduced its annual revision of national estimates of employment, hours, and earnings from the
Current Employment Statistics (CES) monthly survey of nonfarm establishments. Each year, the
CES survey realigns its sample-based estimates to reflect more currently available universe
counts of employment—a process known as benchmarking. Comprehensive counts of
employment, or benchmarks, are derived primarily from the unemployment insurance (UI) tax
reports that nearly all employers are required to file with State Employment Security Agencies.
Summary of the benchmark revisions
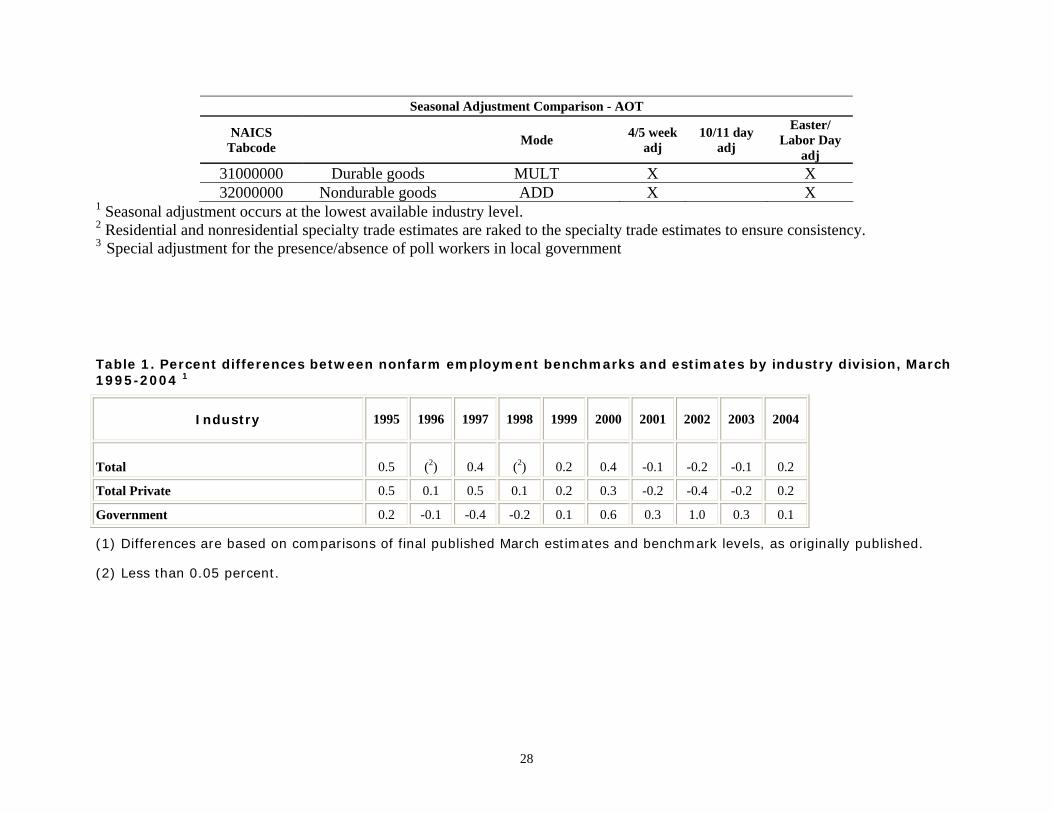
The March 2004 benchmark level for total nonfarm employment is 130,019,000; this
figure is 203,000 above the NAICS sample-based estimate for March 2004, an adjustment of 0.2
percent. Table 1 shows the total nonfarm percentage benchmark revisions for the past ten years.
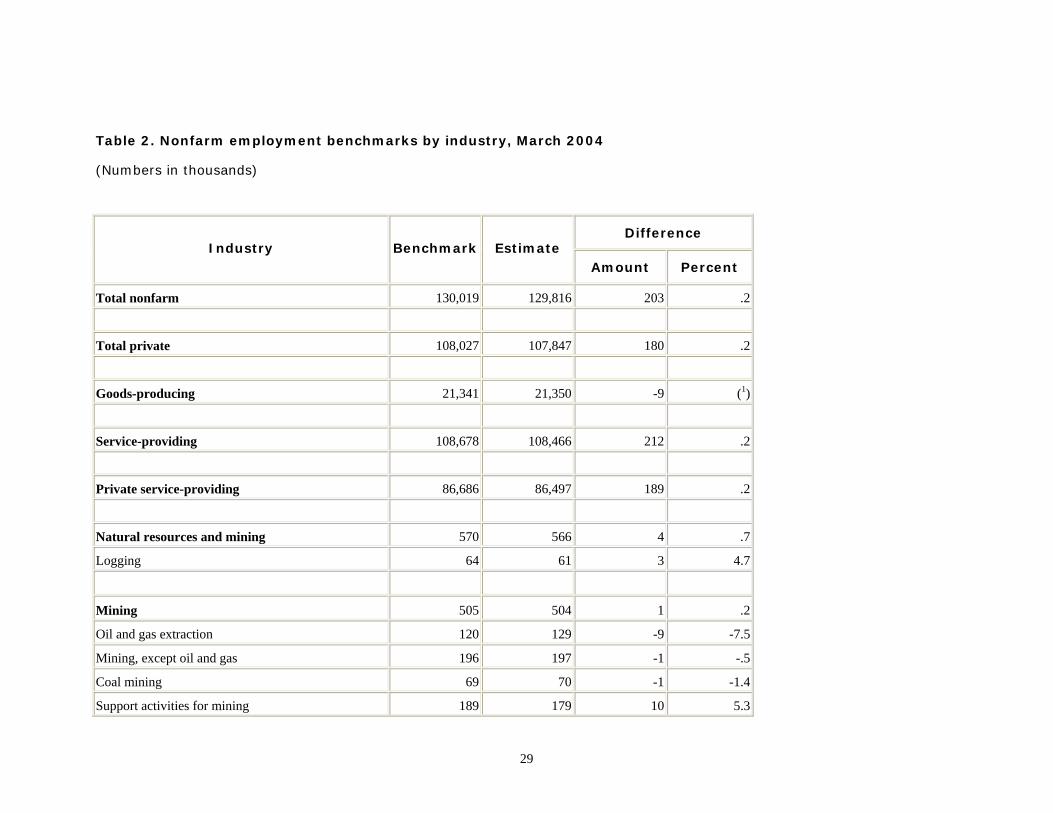
Table 2 shows the nonfarm employment benchmarks for March 2004, not seasonally
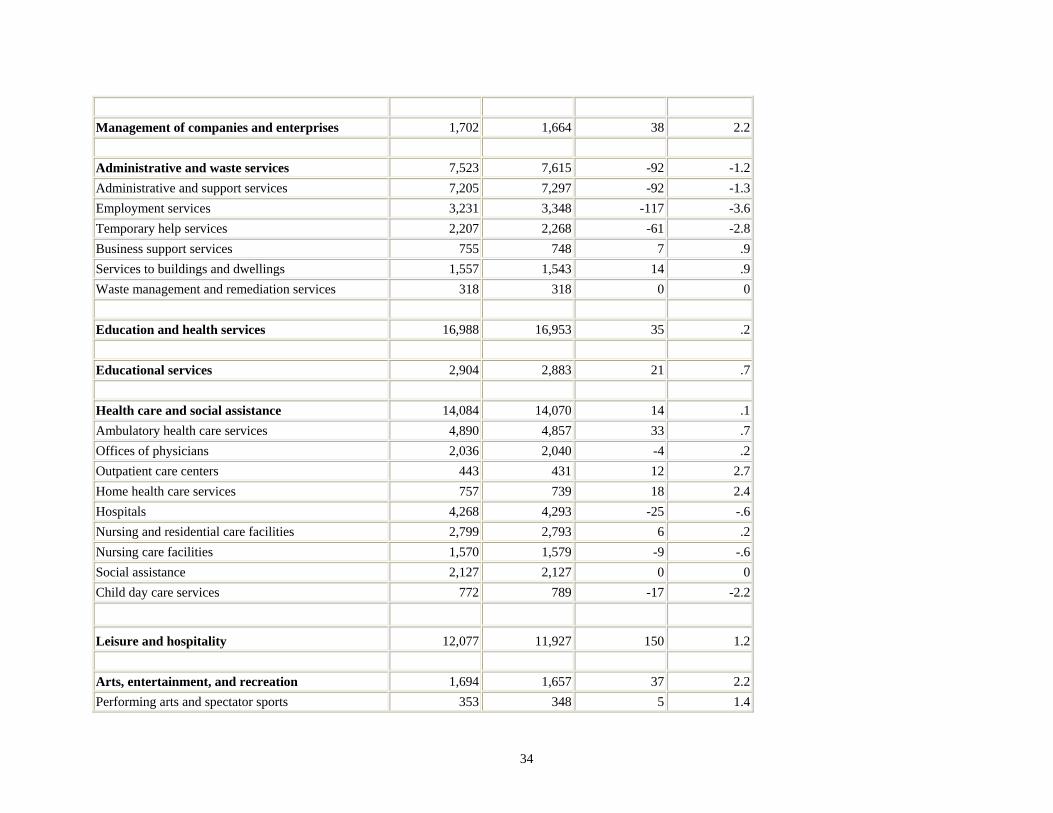
adjusted, by industry. The majority of this year's benchmark revision is in leisure and
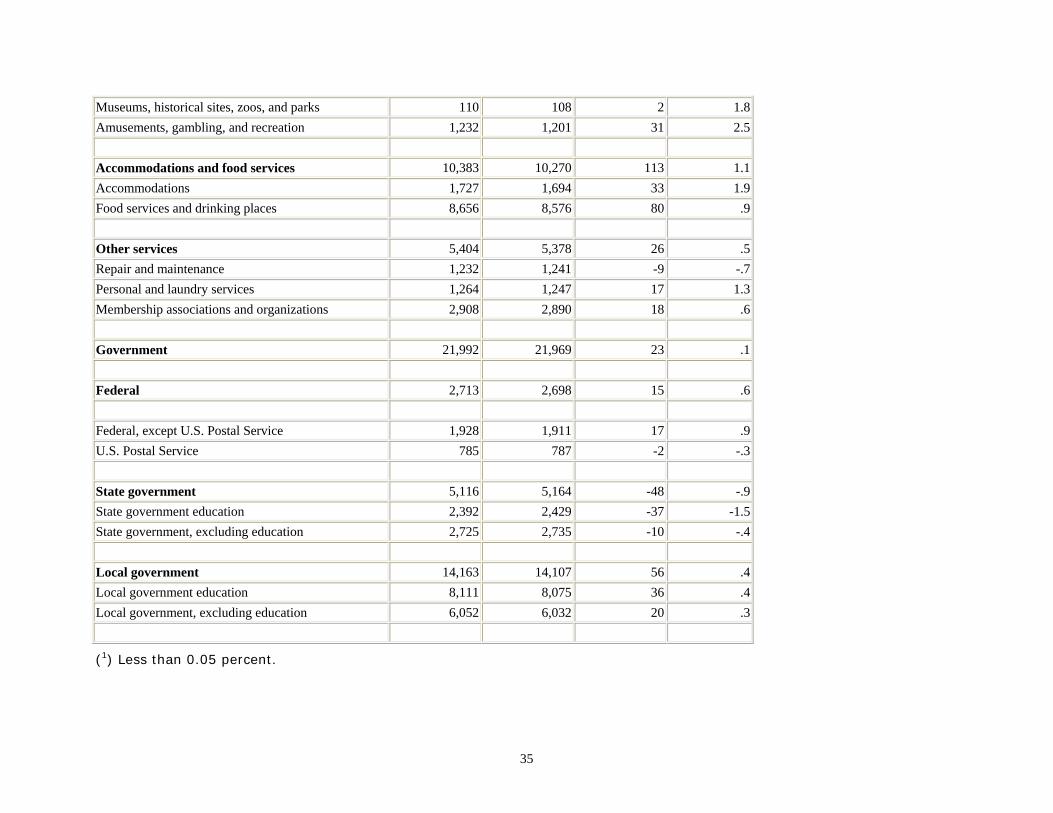
hospitality. Estimates in leisure and hospitality were revised upward by 150,000, or 1.2 percent.
Within leisure and hospitality, accommodations and food services contributed the greatest
adjustment, with an upward revision of 113,000, or 1.1 percent. In addition, arts, entertainment,
and recreation contributed an upward adjustment of 37,000, or 2.2 percent.
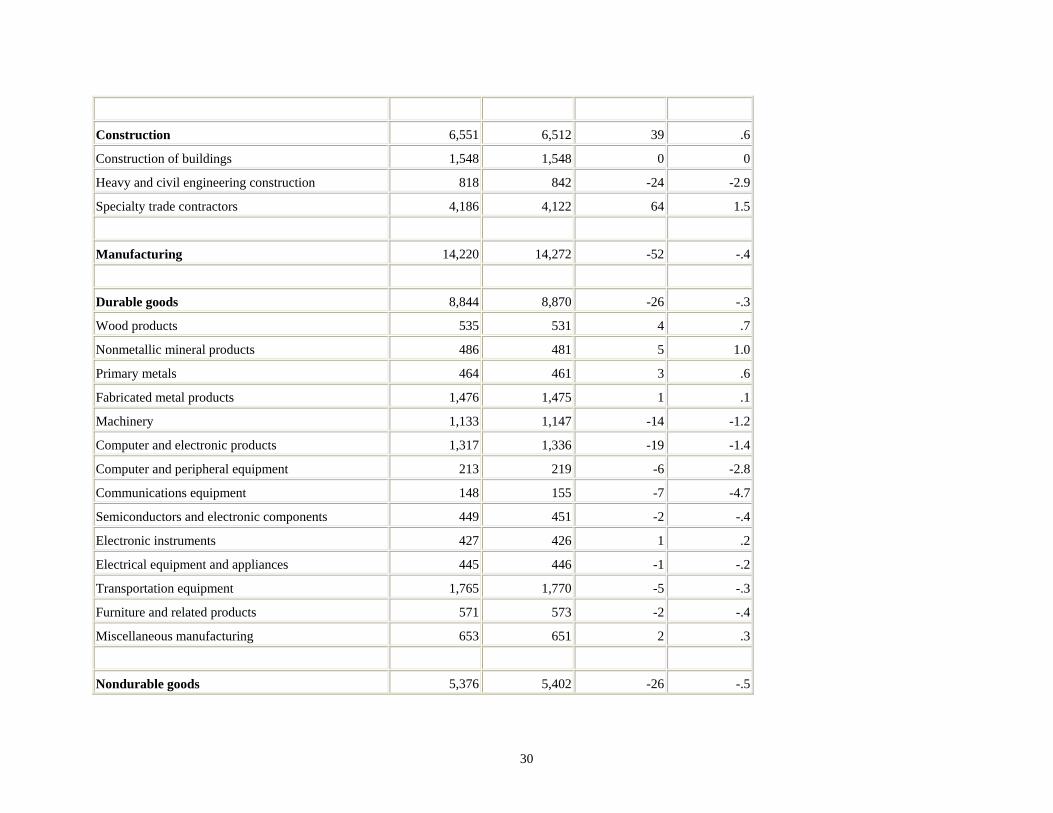
Benchmark revisions in other supersectors were smaller. Construction was revised
upward by 39,000 or 0.6 percent. This was largely due to an upward revision of 64,000, or 1.5
percent, in specialty trade contractors, and was partially offset by a downward revision of
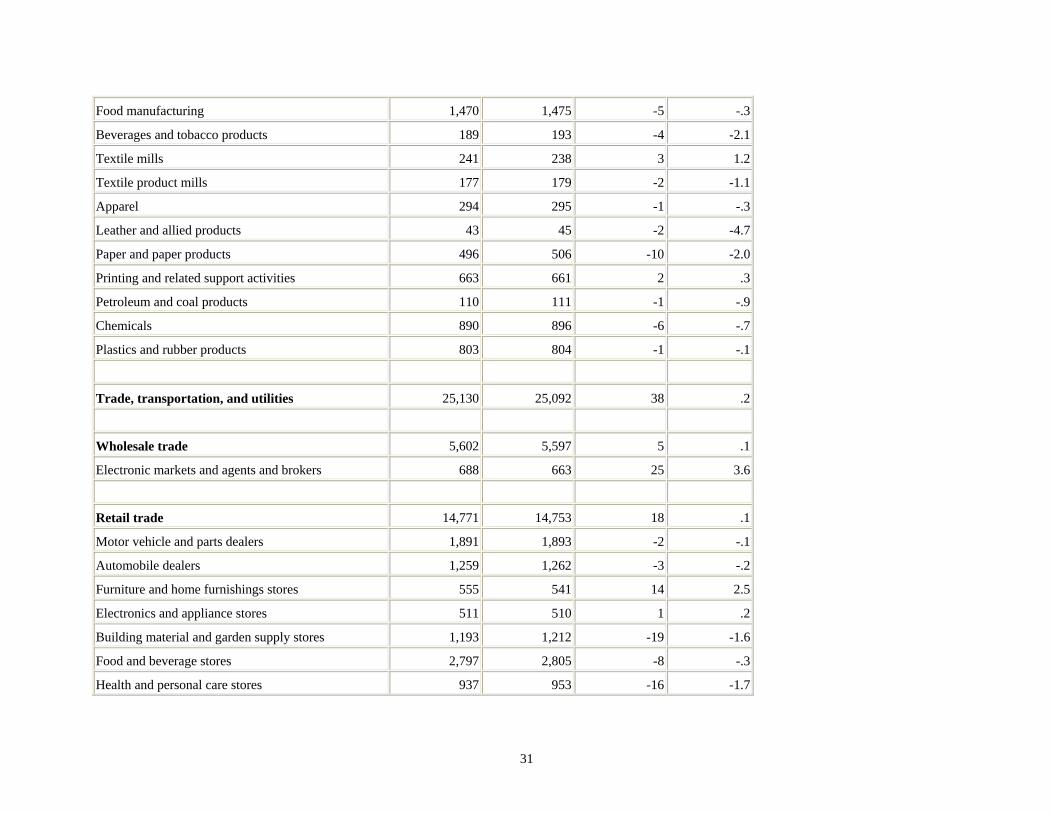
24,000, or 2.9 percent, in heavy and civil engineering construction. Trade, transportation, and
2
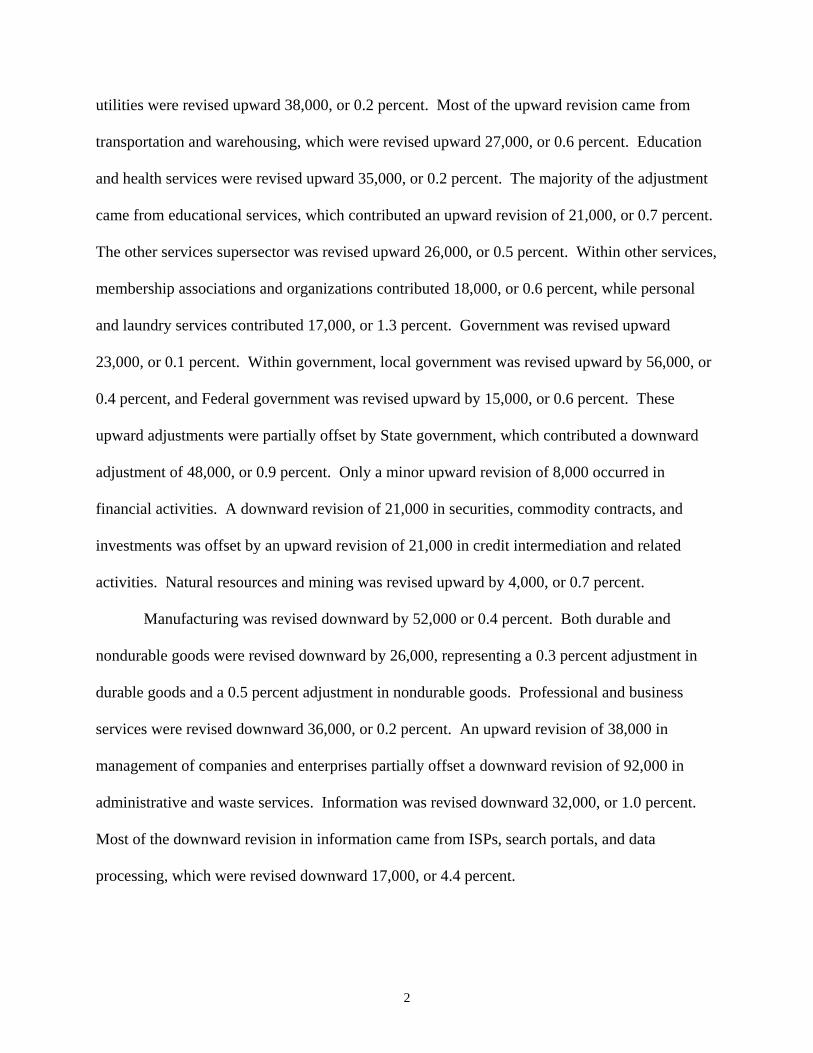
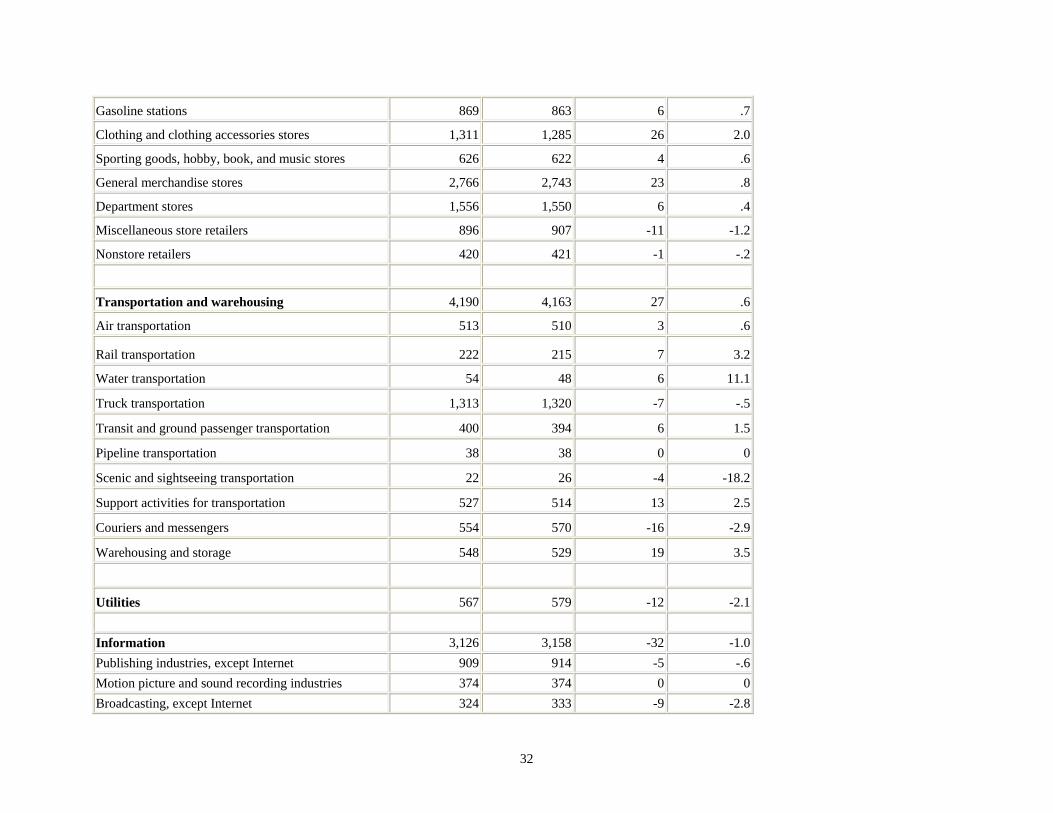
utilities were revised upward 38,000, or 0.2 percent. Most of the upward revision came from
transportation and warehousing, which were revised upward 27,000, or 0.6 percent. Education
and health services were revised upward 35,000, or 0.2 percent. The majority of the adjustment
came from educational services, which contributed an upward revision of 21,000, or 0.7 percent.
The other services supersector was revised upward 26,000, or 0.5 percent. Within other services,
membership associations and organizations contributed 18,000, or 0.6 percent, while personal
and laundry services contributed 17,000, or 1.3 percent. Government was revised upward
23,000, or 0.1 percent. Within government, local government was revised upward by 56,000, or
0.4 percent, and Federal government was revised upward by 15,000, or 0.6 percent. These
upward adjustments were partially offset by State government, which contributed a downward
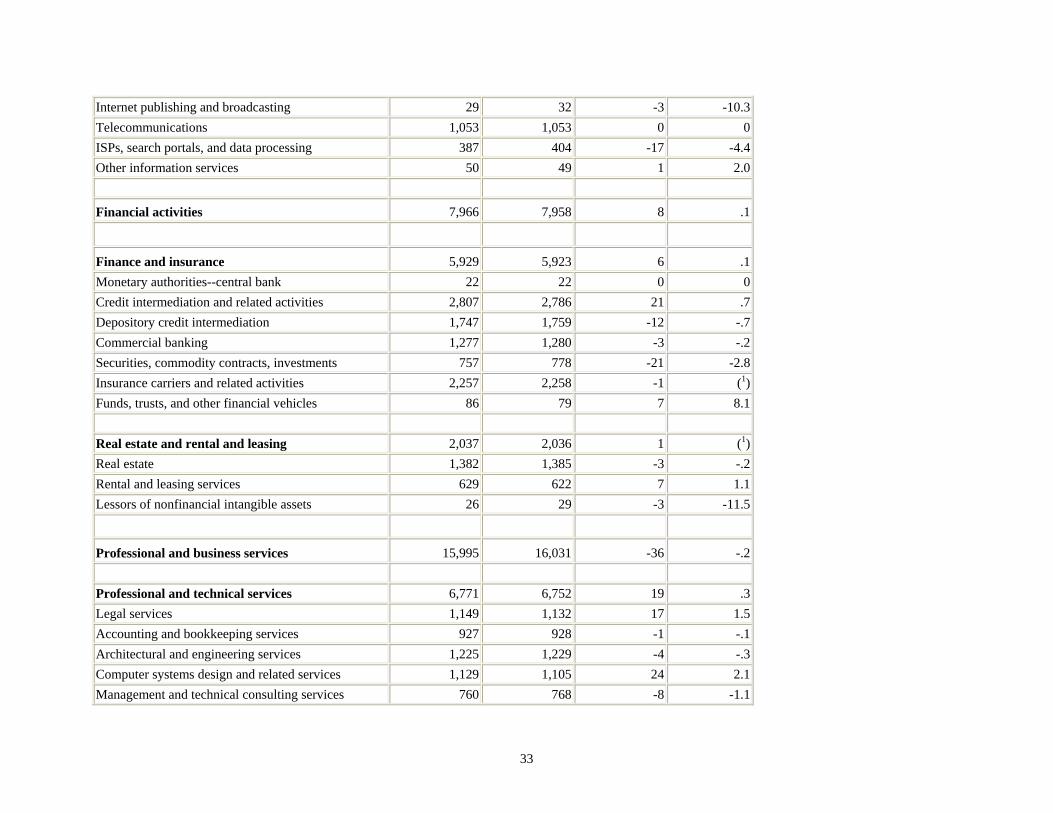
adjustment of 48,000, or 0.9 percent. Only a minor upward revision of 8,000 occurred in
financial activities. A downward revision of 21,000 in securities, commodity contracts, and
investments was offset by an upward revision of 21,000 in credit intermediation and related
activities. Natural resources and mining was revised upward by 4,000, or 0.7 percent.
Manufacturing was revised downward by 52,000 or 0.4 percent. Both durable and
nondurable goods were revised downward by 26,000, representing a 0.3 percent adjustment in
durable goods and a 0.5 percent adjustment in nondurable goods. Professional and business
services were revised downward 36,000, or 0.2 percent. An upward revision of 38,000 in
management of companies and enterprises partially offset a downward revision of 92,000 in
administrative and waste services. Information was revised downward 32,000, or 1.0 percent.
Most of the downward revision in information came from ISPs, search portals, and data
processing, which were revised downward 17,000, or 4.4 percent.

3
Addition of residential and nonresidential specialty trade contractors
Concurrent with the release of the 2004 benchmark, the CES Program also began
producing and publishing employment series for residential specialty trade contractors and
nonresidential specialty trade contractors (see Exhibit 1 for publication detail). The two new
employment series can be found in tables B-3 (employment, seasonally adjusted) and B-12
(employment, not seasonally adjusted) in the Employment and Earnings publication.
Exhibit 1. Component series to be published as of the 2004 benchmark release
New component industries Aggregate industry
Industry title CES industry
code Industry title NAICS
code CES industry code Residential specialty trade contractors 20-238001 Nonresidential specialty trade contractors 20-238002
Specialty trade contractors 238 20-238000
Examination of the history available for the new series illustrates the differing trends
between the residential and nonresidential specialty trade contractors industry (NAICS 238)
series and indicates the analytical value associated with these new industries.
As a whole, specialty trade contractors shows a slight decrease in employment (-2.9%)
from March 2001 to March 2003, mirroring a general decline in employment in the Construction
sector (-3.1%) during that time period. However, focusing on a decrease in employment at the 3-
digit NAICS level masks a small increase in employment in the residential sector of specialty
trade contractors. This growth in employment in the residential sector was overshadowed by a
decrease in employment in the nonresidential sector of specialty trade contractors, leading to an

4
overall decline in employment at the 3-digit NAICS level during this time period. Without the
new breakout, these trends would not be observable.
Estimates are made at the four-digit NAICS, regional, residential and nonresidential
levels. As the residential series are subsets of previously published series, the estimates are
made independently and raked, or controlled, to the traditional NAICS structure to ensure
consistency between the series. Research indicated that the amount of raking needed to achieve
this consistency was minimal. There are no estimates of hours and earnings for the new
residential and nonresidential specialty trade contractor series.
To complement the two new construction industry employment series, the CES program
has begun including employment estimates for residential building (NAICS 2361) and
nonresidential building (NAICS 2362) in the Employment and Earnings tables. Traditionally,
not seasonally adjusted employment estimates for these industries were published with a 1-
month lag, and seasonally adjusted estimates were not available at all.
Other changes to the CES published series list
The 2004 benchmark brings a number of changes to the list of CES published series.
There are two new aggregate series that will be published beginning with the 2004 benchmark
release: motor vehicles and parts, and health care. Publishing the new series will facilitate the
analysis of labor-market trends in these important industry groups.
Exhibit 2. Aggregate series to be published as of the 2004 benchmark release
New industry Component industries Industry title CES industry
code Industry title NAICS
code CES industry
code Motor vehicles 3361 31-336100 Motor vehicles and
parts 31-336001
Motor vehicle bodies and trailers 3362 31-336200
5
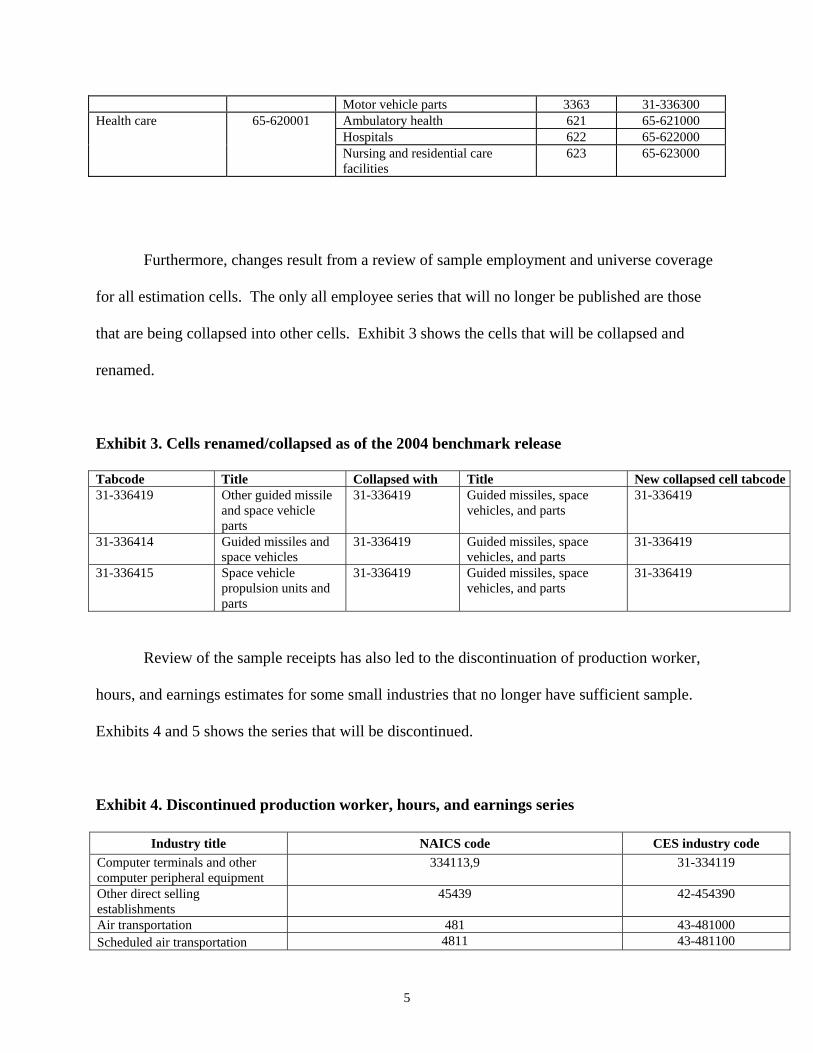
Motor vehicle parts 3363 31-336300 Ambulatory health 621 65-621000 Hospitals 622 65-622000
Health care 65-620001
Nursing and residential care facilities
623 65-623000
Furthermore, changes result from a review of sample employment and universe coverage
for all estimation cells. The only all employee series that will no longer be published are those
that are being collapsed into other cells. Exhibit 3 shows the cells that will be collapsed and
renamed.
Exhibit 3. Cells renamed/collapsed as of the 2004 benchmark release
Tabcode Title Collapsed with Title New collapsed cell tabcode31-336419 Other guided missile
and space vehicle parts
31-336419 Guided missiles, space vehicles, and parts
31-336419
31-336414 Guided missiles and space vehicles
31-336419 Guided missiles, space vehicles, and parts
31-336419
31-336415 Space vehicle propulsion units and parts
31-336419 Guided missiles, space vehicles, and parts
31-336419
Review of the sample receipts has also led to the discontinuation of production worker,
hours, and earnings estimates for some small industries that no longer have sufficient sample.
Exhibits 4 and 5 shows the series that will be discontinued.
Exhibit 4. Discontinued production worker, hours, and earnings series
Industry title NAICS code CES industry code Computer terminals and other computer peripheral equipment
334113,9 31-334119
Other direct selling establishments
45439 42-454390
Air transportation 481 43-481000 Scheduled air transportation 4811 43-481100
6
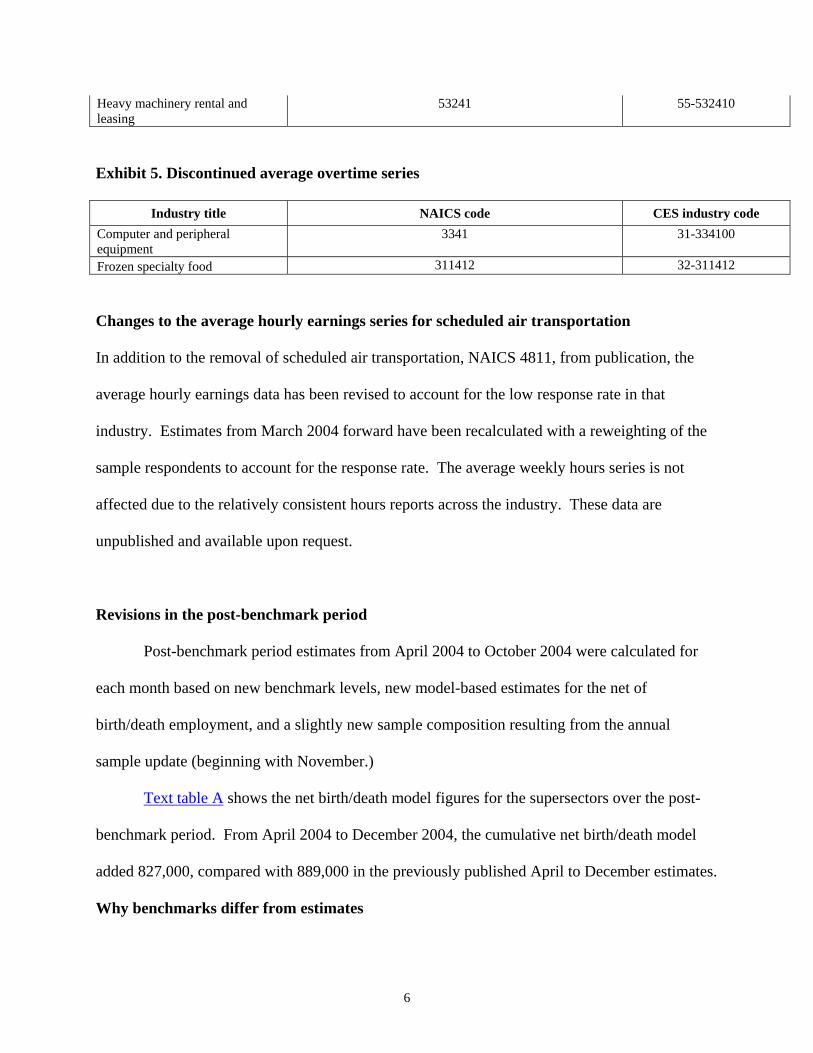
Heavy machinery rental and leasing
53241 55-532410
Exhibit 5. Discontinued average overtime series
Industry title NAICS code CES industry code Computer and peripheral equipment
3341 31-334100
Frozen specialty food 311412 32-311412 Changes to the average hourly earnings series for scheduled air transportation In addition to the removal of scheduled air transportation, NAICS 4811, from publication, the
average hourly earnings data has been revised to account for the low response rate in that
industry. Estimates from March 2004 forward have been recalculated with a reweighting of the
sample respondents to account for the response rate. The average weekly hours series is not
affected due to the relatively consistent hours reports across the industry. These data are
unpublished and available upon request.
Revisions in the post-benchmark period
Post-benchmark period estimates from April 2004 to October 2004 were calculated for
each month based on new benchmark levels, new model-based estimates for the net of
birth/death employment, and a slightly new sample composition resulting from the annual
sample update (beginning with November.)
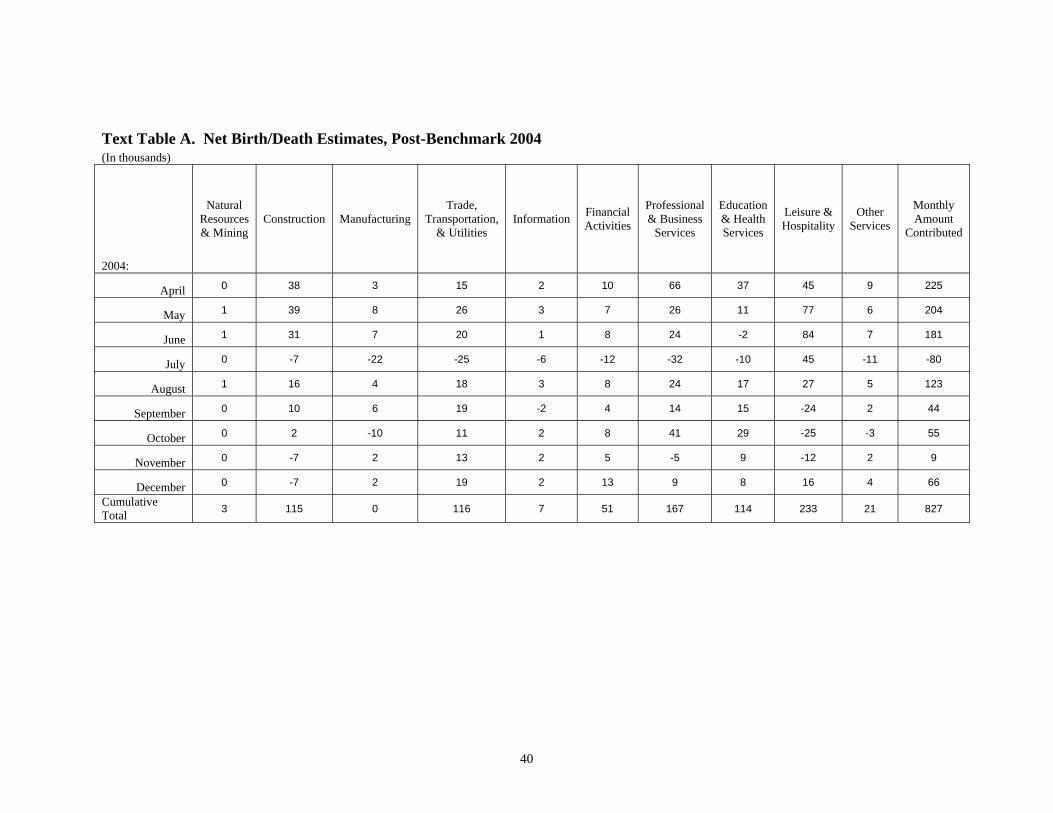
Text table A shows the net birth/death model figures for the supersectors over the post-
benchmark period. From April 2004 to December 2004, the cumulative net birth/death model
added 827,000, compared with 889,000 in the previously published April to December estimates.
Why benchmarks differ from estimates
7
A benchmark revision is the difference between the benchmark employment level for a given
March and its corresponding sample-based estimate. The overall accuracy of the establishment
survey is usually gauged by the size of this difference. The benchmark revision often is regarded
as a proxy for total survey error, but this does not take into account error in the universe data.
The employment counts obtained from quarterly unemployment insurance tax forms are
administrative data that reflect employer record-keeping practices and differing State laws and
procedures. The benchmark revision can be more precisely interpreted as the difference between
two independently derived employment counts, each subject to its own error sources.
Like all sample surveys, the establishment survey is susceptible to two sources of error:
sampling error and nonsampling error. Sampling error is present any time a sample is used to
make inferences about a population. The magnitude of the sampling error, or variance, relates
directly to sample size and the percentage of the universe covered by that sample. The CES
monthly survey captures slightly under one-third of the universe, exceptionally high by usual
sampling standards. This coverage insures a small sampling error at the total nonfarm
employment level.
Both the universe counts and the establishment survey estimates are subject to
nonsampling errors common to all surveys—coverage, response, and processing errors. The
error structures for both the CES monthly survey and the UI universe are complex. Still, the two
programs generally produce consistent total employment figures, each validating the other. Over
the last decade, annual benchmark revisions at the total nonfarm level have averaged 0.2 percent,
with an absolute range from less than 0.05 percent to 0.5 percent.
Benchmark revisions effects for other datatypes

8
The routine benchmarking process results in revisions to the series for production and
nonsupervisory workers. There are no benchmark employment levels for these series; they are
revised by preserving ratios of employment for the particular data type to all employees
employment prior to benchmarking, and then applying these ratios to the revised all-employee
figures. These figures are calculated at the basic cell level and then aggregated to produce the
summary estimates.
Average weekly hours and average hourly earnings are not benchmarked; they are
estimated solely from reports supplied by survey respondents at the basic estimating cell level.
The aggregate industry levels of the hours and earnings series are derived as a weighted
average. The production or nonsupervisory worker employment estimates for the basic cells are
used as weights for the hours and earnings estimates for broader industry groupings.
Adjustments of the all-employee estimates to new benchmarks may alter the weights, which, in
turn, may change the estimates for hours and earnings of production or nonsupervisory workers
at higher levels of aggregation.
Generally, new employment benchmarks have little effect on hours and earnings
estimates for major groupings. To influence the hours and earnings estimates of a broader group,
employment revisions have to be relatively large and must affect industries that have hours or
earnings averages that are substantially different from those of other industries in their group.
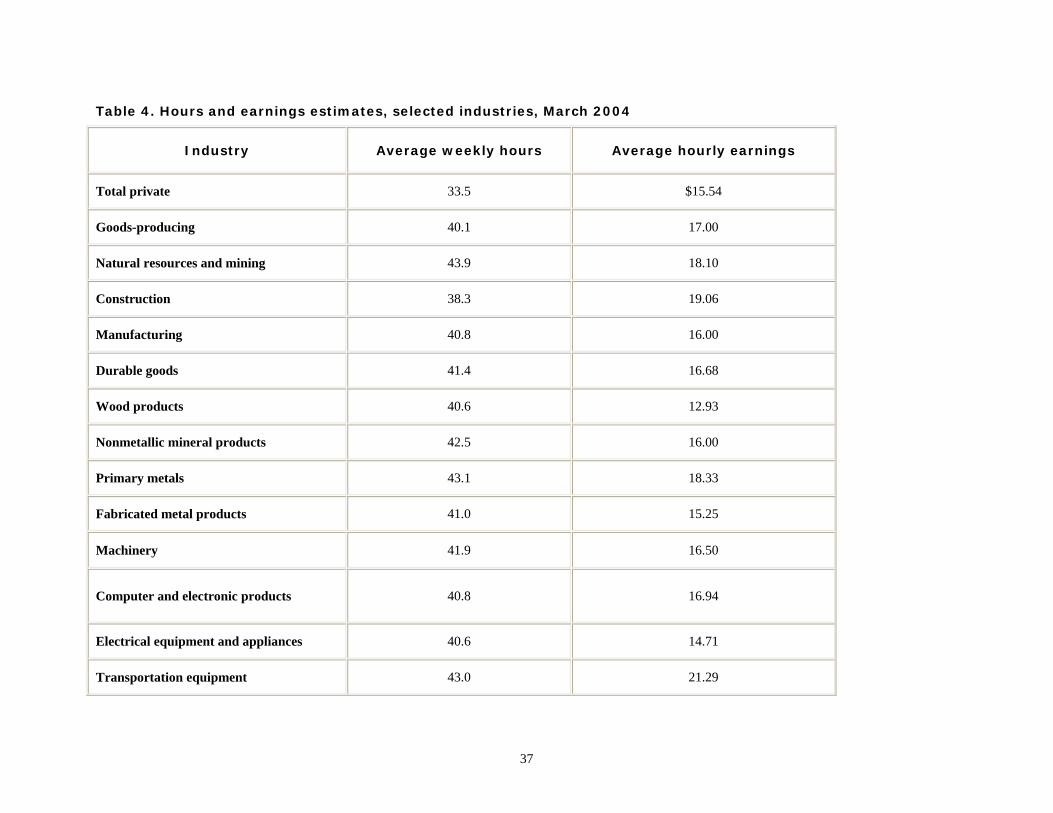
Table 4 gives information on the levels of specific hours and earnings series resulting from the
March 2004 benchmark. At the total private level, there was no change in average weekly hours
from the previously published level, while average hourly earnings decreased by 1 cent from the
previously published level.
9
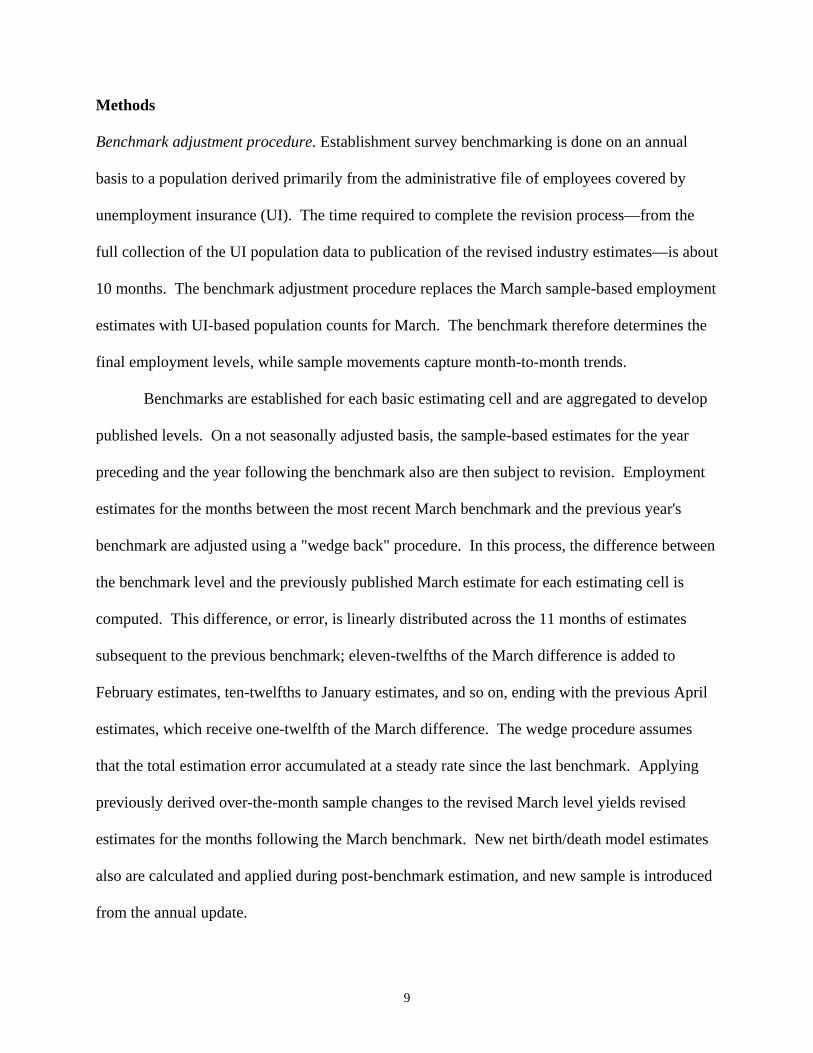
Methods
Benchmark adjustment procedure. Establishment survey benchmarking is done on an annual
basis to a population derived primarily from the administrative file of employees covered by
unemployment insurance (UI). The time required to complete the revision process—from the
full collection of the UI population data to publication of the revised industry estimates—is about
10 months. The benchmark adjustment procedure replaces the March sample-based employment
estimates with UI-based population counts for March. The benchmark therefore determines the
final employment levels, while sample movements capture month-to-month trends.
Benchmarks are established for each basic estimating cell and are aggregated to develop
published levels. On a not seasonally adjusted basis, the sample-based estimates for the year
preceding and the year following the benchmark also are then subject to revision. Employment
estimates for the months between the most recent March benchmark and the previous year's
benchmark are adjusted using a "wedge back" procedure. In this process, the difference between
the benchmark level and the previously published March estimate for each estimating cell is
computed. This difference, or error, is linearly distributed across the 11 months of estimates
subsequent to the previous benchmark; eleven-twelfths of the March difference is added to
February estimates, ten-twelfths to January estimates, and so on, ending with the previous April
estimates, which receive one-twelfth of the March difference. The wedge procedure assumes
that the total estimation error accumulated at a steady rate since the last benchmark. Applying
previously derived over-the-month sample changes to the revised March level yields revised
estimates for the months following the March benchmark. New net birth/death model estimates
also are calculated and applied during post-benchmark estimation, and new sample is introduced
from the annual update.

10
Benchmark source material. The principal source of benchmark data for private industries is the
Quarterly Census of Employment and Wages (QCEW). These employment data are provided to
State Employment Security Agencies by employers covered by State UI laws. BLS uses several
other sources to establish benchmarks for the remaining industries partially covered or exempt
from mandatory UI coverage, accounting for nearly 3 percent of the nonfarm employment total.
Data on employees covered under Social Security laws, published by the U.S. Census
Bureau in County Business Patterns, are used to augment UI data for non-office insurance sales
workers, child daycare workers, religious organizations, and private schools and hospitals.
Benchmarks for State and local government hospitals and educational institutions are based on
the Annual Census of Governments conducted by the Census Bureau. Benchmark data from
these sources are available only on a lagged basis. Extrapolation to a current level is
accomplished by assuming and applying the employment trends from the UI-covered part of the
population in these industries to the non-covered part. Universe data for interstate railroads are
obtained from the Railroad Retirement Board.
Business birth and death estimation. Regular updating of the CES sample frame with
information from the UI universe files helps to keep the CES survey current with respect to
employment from business births and business deaths. The timeliest UI universe files available,
however, always will be a minimum of 9 months out of date. The CES survey thus can not rely
on regular frame maintenance alone to provide estimates for business birth and death
employment contributions. BLS has researched both sample-based and model-based approaches
to measuring birth units that have not yet appeared on the UI universe frame. Since the research
11
demonstrated that sampling for births was not feasible in the very short CES production
timeframes, the Bureau is utilizing a model-based approach for this component.
Earlier research indicated that while both the business birth and death portions of total
employment are generally significant, the net contribution is relatively small and stable. To
account for this net birth/death portion of total employment, BLS is utilizing an estimation
procedure with two components. The first component uses business deaths to impute
employment for business births. This is incorporated into the sample-based link relative estimate
procedure by simply not reflecting sample units going out of business, but imputing to them the
same trend as the other firms in the sample. The second component is an ARIMA time series
model designed to estimate the residual net birth/death employment not accounted for by the
imputation. The historical time series used to create and test the ARIMA model was derived
from the UI universe micro level database, and reflects the actual residual net of births and
deaths over the past five years. The ARIMA model component is reviewed on a quarterly basis.
The net birth/death model component figures are unique to each month and include negative
adjustments in some months. Furthermore, these figures may exhibit a seasonal pattern observed
in the historical UI universe data series.
The most significant potential drawback to this or any model-based approach is that time
series modeling assumes a predictable continuation of historical patterns and relationships and
therefore is likely to have some difficulty producing reliable estimates at economic turning
points, or during periods when there are sudden changes in trend. BLS will continue researching
alternative model-based techniques for the net birth/death component; it is likely to remain the
most problematic part of the estimation process.
Availability of revised data
12
LABSTAT, the BLS public database on the Internet, contains all historical employment, hours,
and earnings data revised as a result of this benchmark, including both unadjusted and seasonally
adjusted data. The data can be accessed at https://www.bls.gov/ces/, the Current Employment
Statistics homepage. Employment, hours, and earnings estimates are also published monthly in
Employment and Earnings.
Seasonal adjustment procedure
BLS uses X-12 ARIMA software developed by the U.S. Census Bureau to seasonally adjust
national employment, hours, and earnings series derived from the CES program. Individual
series are seasonally adjusted using either a multiplicative or an additive model. For
employment, seasonal adjustment factors are directly applied to the component levels.
Individual 3-digit NAICS levels are seasonally adjusted, and higher level aggregates are formed
by summing these components. Seasonally adjusted totals for hours and earnings are obtained
by taking weighted averages of the seasonally adjusted data for the component series.
Special model adjustments
Variable survey intervals. Beginning with the release of the 1995 benchmark, BLS refined the
seasonal adjustment procedures to control for survey interval variations, sometimes referred to as
the 4- versus 5- week effect. Although the CES survey is referenced to a consistent concept –
the pay period including the 12th of each month – inconsistencies arise because there are
sometimes 4 and sometimes 5 weeks between the week including the 12th in a given pair of
months. In highly seasonal industries, these variations can be an important determinant of the
magnitude of seasonal hires or layoffs that have occurred at the time the survey is taken, thereby
complicating seasonal adjustment.

13
Standard seasonal adjustment methodology relies heavily on the experience of the most
recent 3 years to determine the expected seasonal change in employment for each month of the
current year. Prior to the implementation of the adjustment, the procedure did not distinguish
between 4- and 5-week survey intervals, and the accuracy of the seasonal expectation depended
in large measure on how well the current year’s survey interval corresponded with those of the
previous 3 years. All else the same, the greatest potential for distortion occurred when the
current month being estimated had a 5-week interval but the 3 years preceding it were all 4-week
intervals, or conversely when the current month had a 4-week interval but the 3 years preceding
it were all 5-week intervals.
BLS adopted REGARIMA (regression with auto-correlated errors) modeling to identify
the estimated size and significance of the calendar effect for each published series. REGARIMA
combines standard regression analysis, which measures correlation among two or more
variables, with ARIMA modeling, which describes and predicts the behavior of data series based
on its own past history. For many economic time series, including nonfarm payroll employment,
observations are auto-correlated over time; that is, each month’s value is significantly dependent
on the observations that precede it. These series, therefore, usually can be successfully fit using
ARIMA models. If auto-correlated time series are modeled through regression analysis alone,
the measured relationships among other variables of interest may be distorted due to the
influence of the auto-correlation. Thus, the REGARIMA technique is appropriate for measuring
relationships among variables of interest in series that exhibit autocorrelation, such as nonfarm
payroll employment.
In this application, the correlations of interest are those between employment levels in
individual calendar months and the lengths of the survey intervals for those months. The
14
REGARIMA models evaluate the variation in employment levels attributable to 11 separate
survey interval variables, one specified for each month, except March. March is excluded
because there are almost always 4 weeks between the February and March surveys. Models for
individual basic series are fit with the most recent 10 years of data available, the standard time
span used for CES seasonal adjustment.
The REGARIMA procedure yields regression coefficients for each of the 11 months
specified in the model. These coefficients provide estimates of the strength of the relationship
between employment levels and the number of weeks between surveys for the 11 modeled
months. The X-12 ARIMA software also produces diagnostic statistics that permit the
assessment of the statistical significance of the regression coefficients, and all series are
reviewed for model adequacy.
Because the 11 coefficients derived from the REGARIMA models provide an estimate of
the magnitude of variation in employment levels associated with the length of the survey
interval, these coefficients are used to adjust the CES data to remove the calendar effect. These
“filtered” series then are seasonally adjusted using the standard X-12 ARIMA software
previously used.
For a few series, REGARIMA models do not fit well; these series are seasonally adjusted
with X-12 software but without the interval effect adjustment. There are several additional
special effects modeled through the REGARIMA process; they are described below.
Construction series. Beginning with the 1996 benchmark revision, BLS utilized special
treatment to adjust construction industry series. In the application of the interval effect modeling
process to the construction series, there initially was difficulty in accurately identifying and

15
measuring the effect because of the strong influence of variable weather patterns on employment
movements in the industry. Further research allowed BLS to incorporate interval effect
modeling for the construction industry by disaggregating the construction series into its finer
industry and geographic estimating cells and tightening outlier designation parameters. This
allowed a more precise identification of weather-related outliers that had masked the interval
effect and clouded the seasonal adjustment patterns in general. With these outliers removed,
interval effect modeling became feasible. The result is a seasonally adjusted series for
construction that is improved because it is controlled for two potential distortions: unusual
weather events and the 4- versus 5-week effect.
Floating holidays. BLS is continuing the practice of making special adjustments for average
weekly hours and average weekly overtime series to account for the presence or absence of
religious holidays in the April survey reference period and the occurrence of Labor Day in the
September reference period, back to the start date of each series.
Local government series. A special adjustment also is made in November each year to account
for variations in employment due to the presence or absence of poll workers in the local
government, excluding educational services series.
Refinements in hours and earnings seasonal adjustment. With the release of the 1997
benchmark, BLS implemented refinements to the seasonal adjustment process for the hours and
earnings series to correct for distortions related to the method of accounting for the varying
length of payroll periods across months. There is a significant correlation between over-the-
month changes in both the average weekly hour (AWH) and the average hourly earnings (AHE)
series and the number of weekdays in a month, resulting in non-economic fluctuations in these
two series. Both AWH and AHE show more growth in "short" months (20 or 21 weekdays) than

16
in "long" months (22 or 23 weekdays). The effect is stronger for the AWH than for the AHE
series.
The calendar effect is traceable to response and processing errors associated with
converting payroll and hours information from sample respondents with semi-monthly or
monthly pay periods to a weekly equivalent. The response error comes from sample respondents
reporting a fixed number of total hours for workers regardless of the length of the reference
month, while the CES conversion process assumes that the hours reporting will be variable. A
constant level of hours reporting most likely occurs when employees are salaried rather than paid
by the hour, as employers are less likely to keep actual detailed hours records for such
employees. This causes artificial peaks in the AWH series in shorter months that are reversed in
longer months.
The processing error occurs when respondents with salaried workers report hours
correctly (vary them according to the length of the month), which dictates that different
conversion factors be applied to payroll and hours. The CES processing system uses the hours
conversion factor for both fields, resulting in peaks in the AHE series in short months and
reversals in long months.
REGARIMA modeling is used to identify, measure, and remove the length-of-pay-period
effect for seasonally adjusted average weekly hours and average hourly earnings series. The
length-of-pay-period variable proves significant for explaining AWH movements in all the
service-providing industries except retail trade. For AHE, the length-of-pay-period variable is
significant for wholesale trade, financial activities, professional and business services, and other
services. All AWH series in the service-providing industries except retail trade have been
adjusted from January 1990 forward. The AHE series for wholesale trade, financial activities,
17
professional and business services, and other services have been adjusted from January 1990
forward as well. For this reason, calculations of over-the-year change in the establishment hours
and earnings series should use seasonally adjusted data.
The series to which the length-of-pay-period adjustment is applied are not subject to the
4- versus 5-week adjustment, as the modeling cannot support the number of variables that would
be required in the regression equation to make both adjustments.
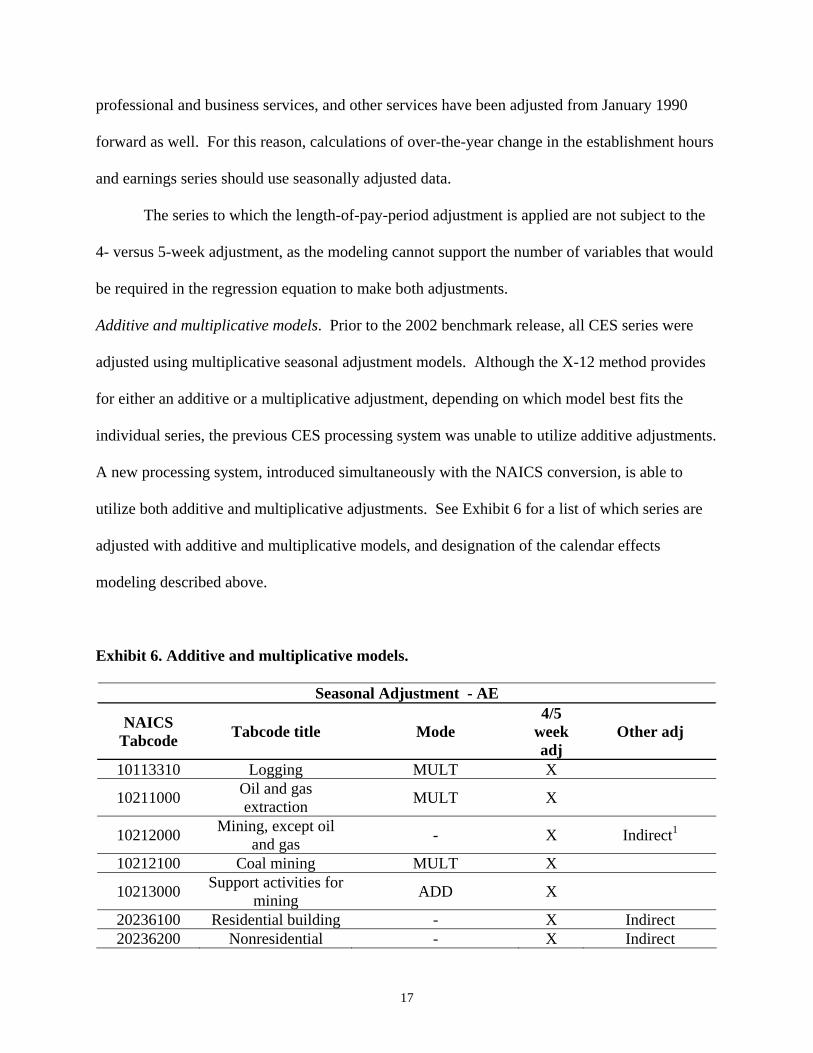
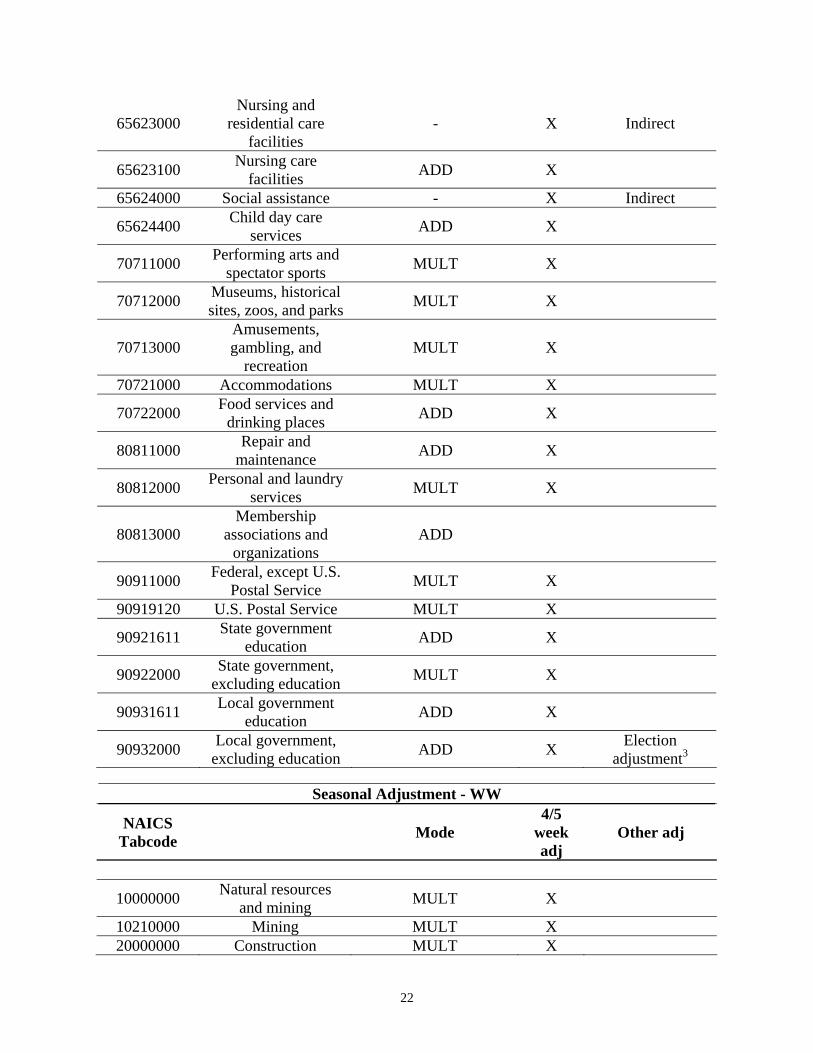
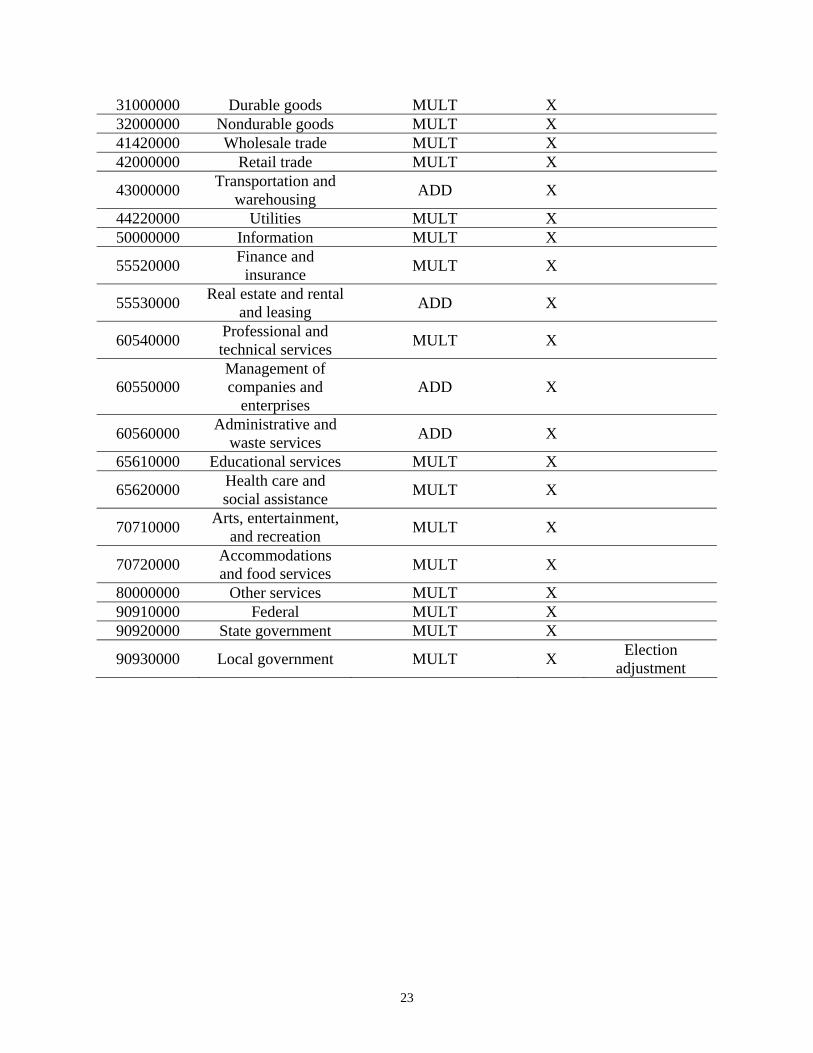
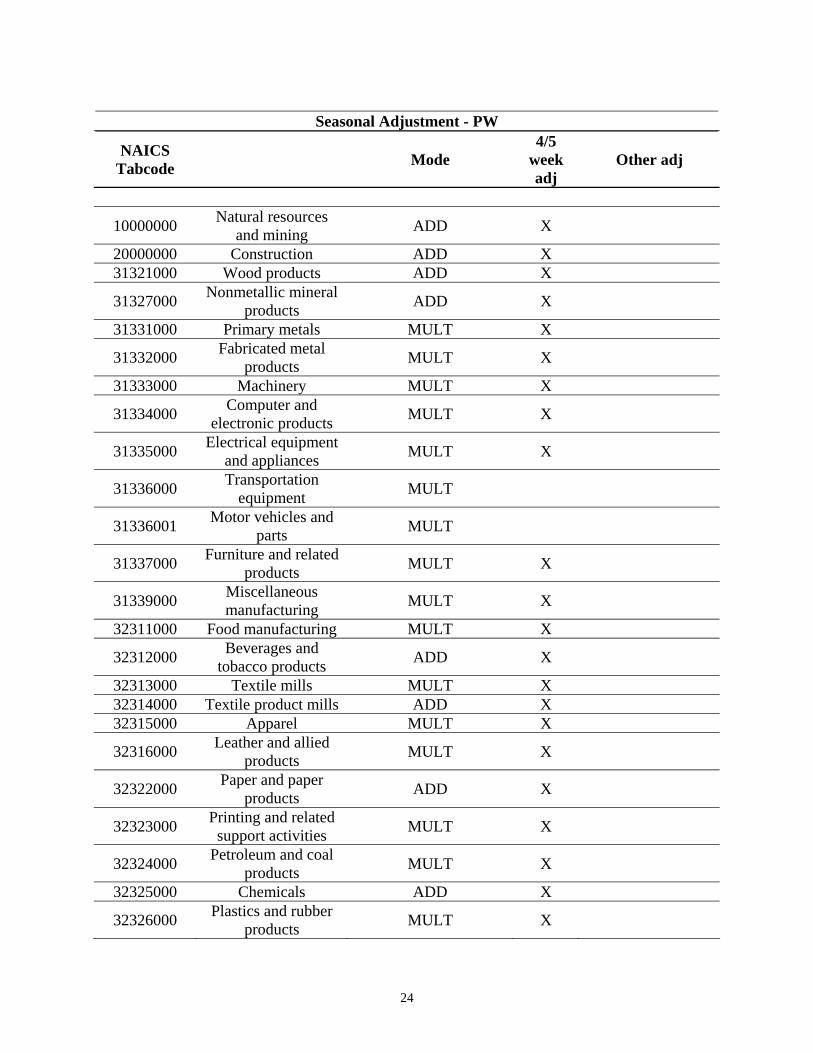
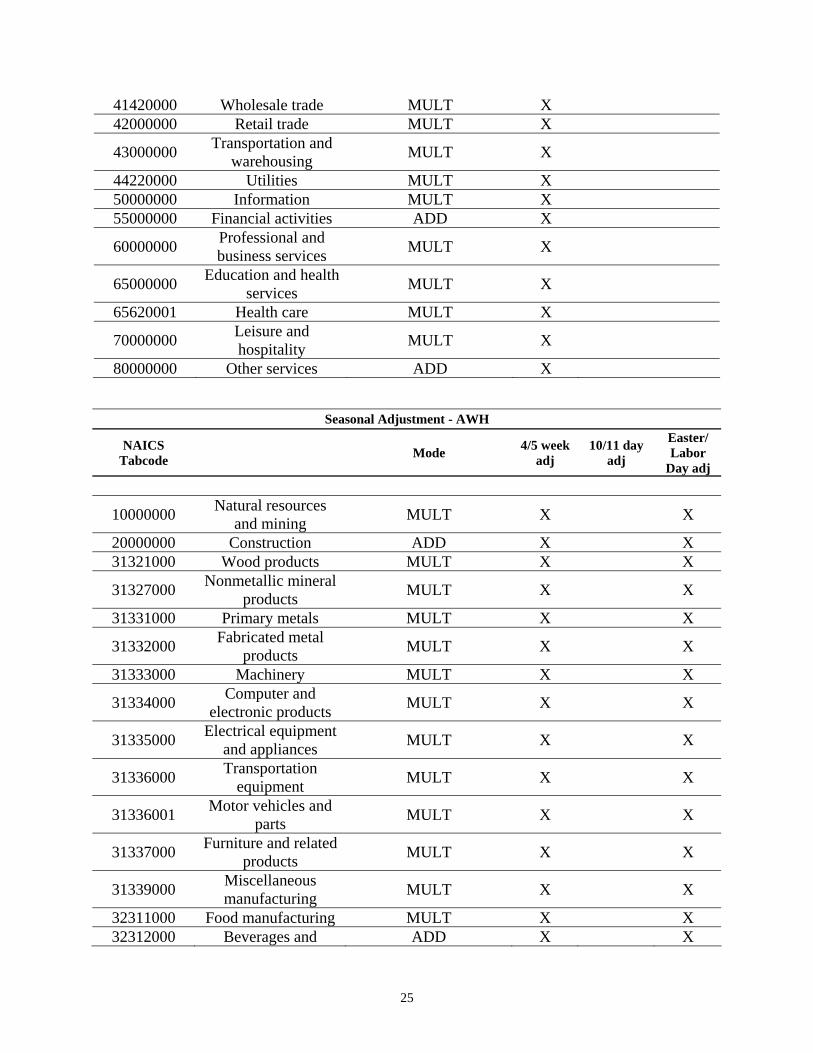
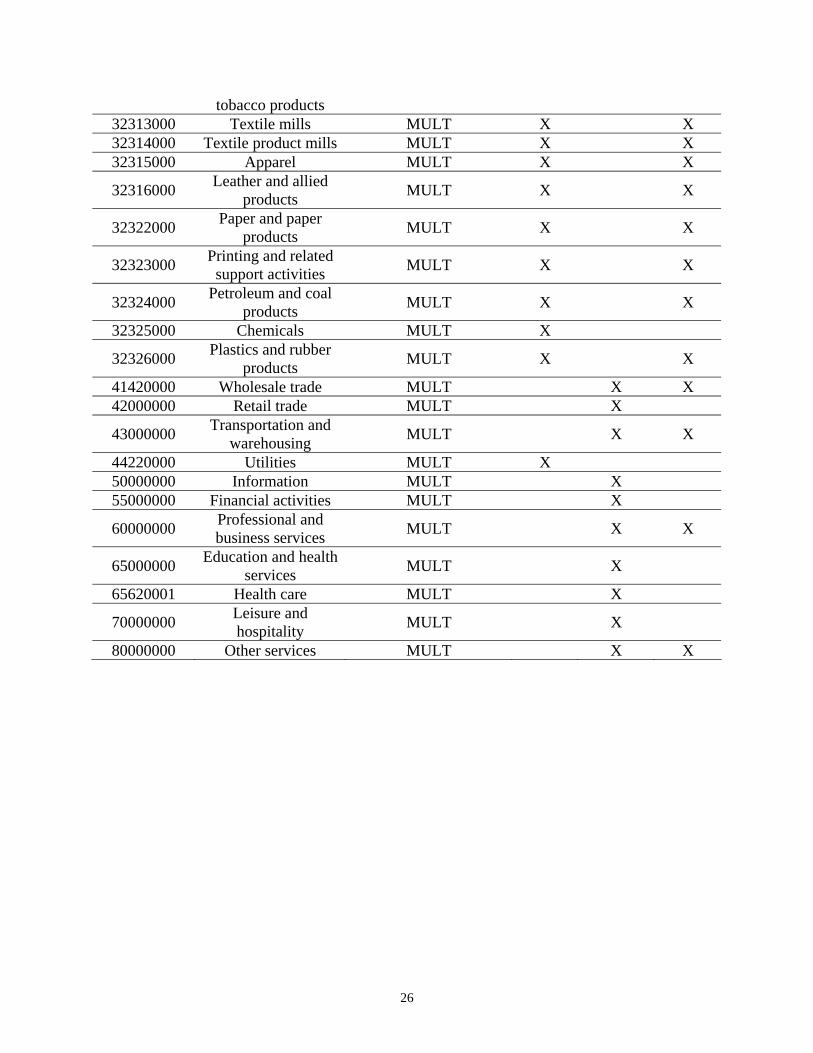
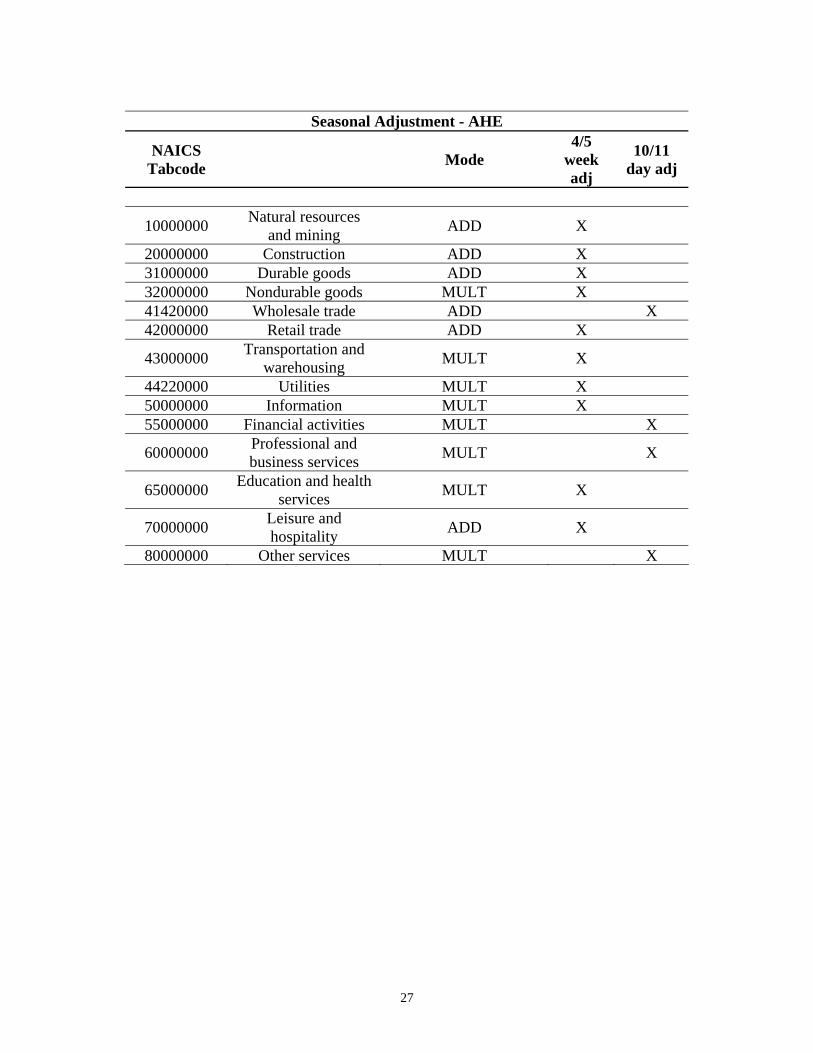
Additive and multiplicative models. Prior to the 2002 benchmark release, all CES series were
adjusted using multiplicative seasonal adjustment models. Although the X-12 method provides
for either an additive or a multiplicative adjustment, depending on which model best fits the
individual series, the previous CES processing system was unable to utilize additive adjustments.
A new processing system, introduced simultaneously with the NAICS conversion, is able to
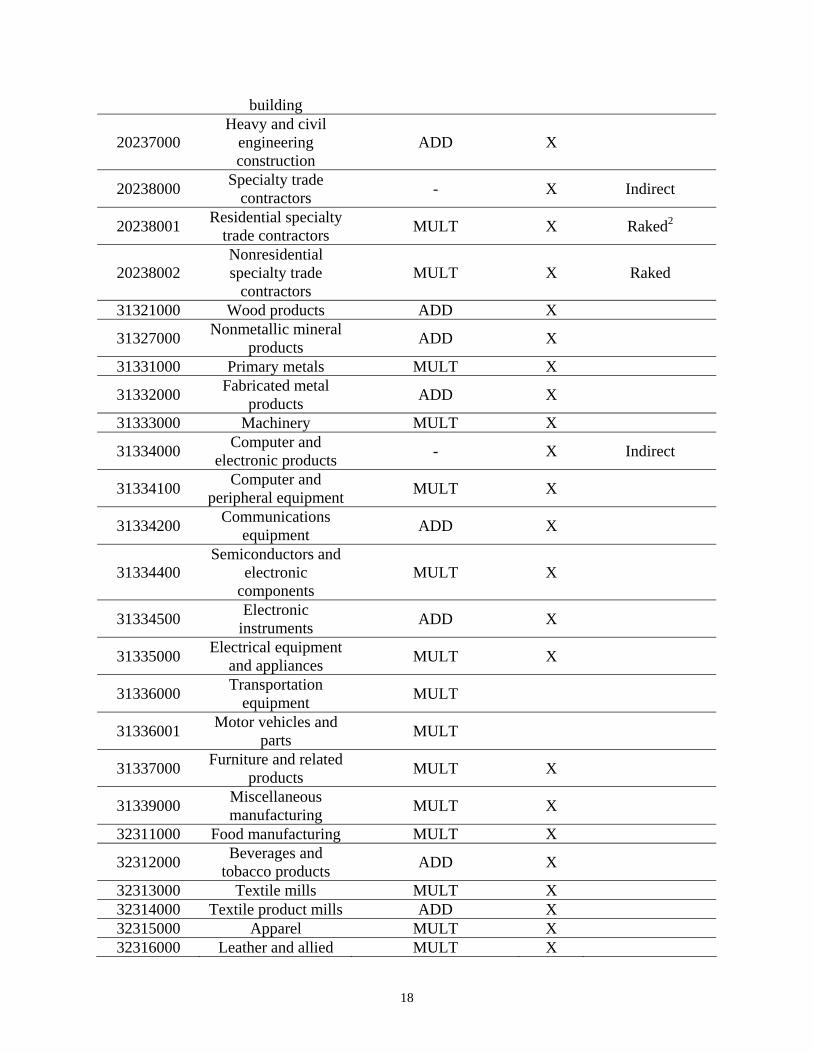
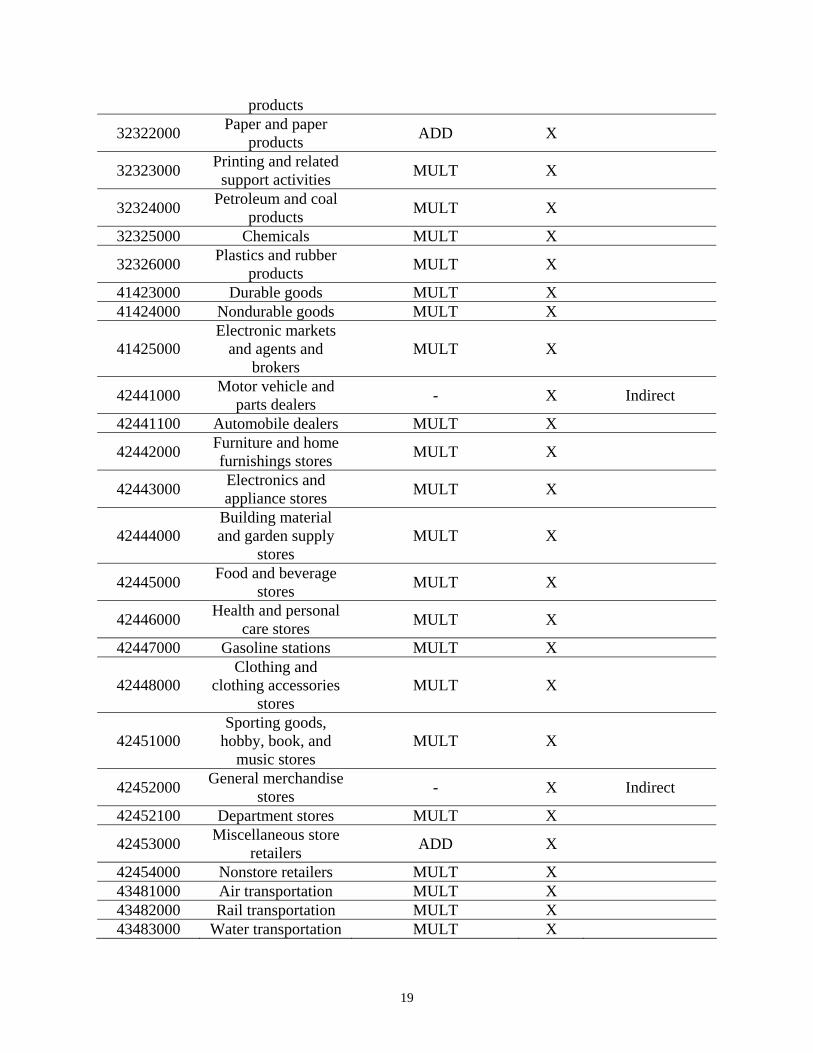
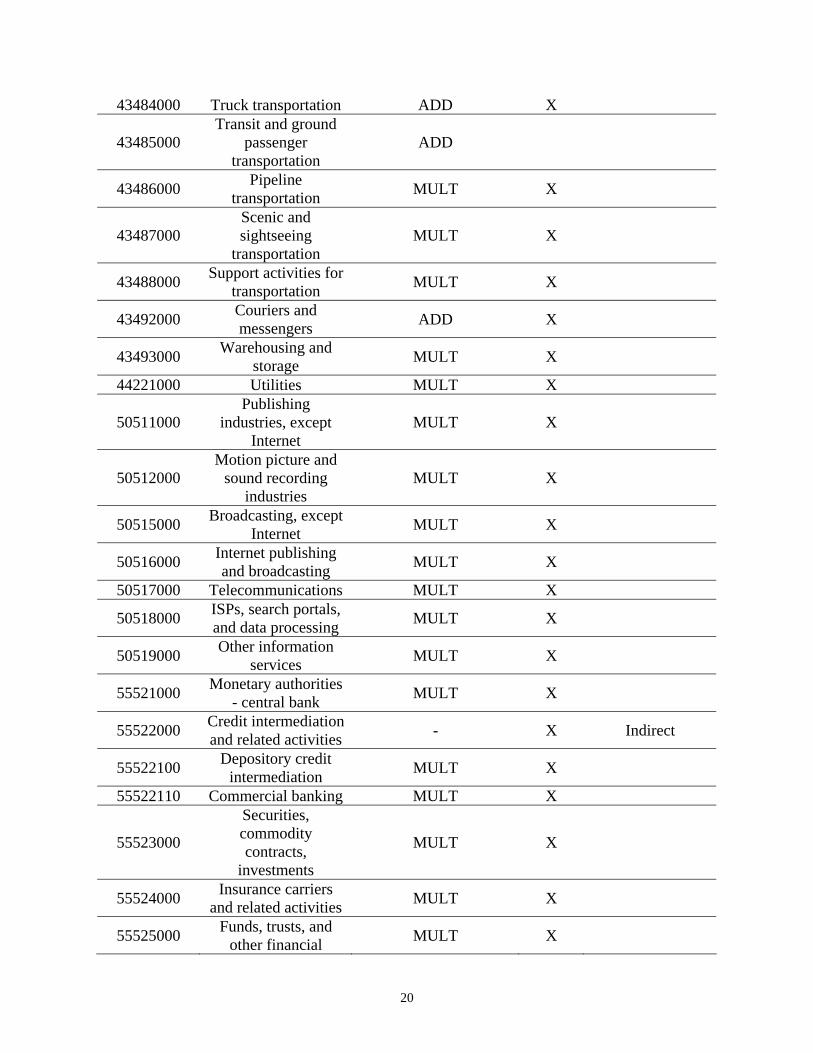
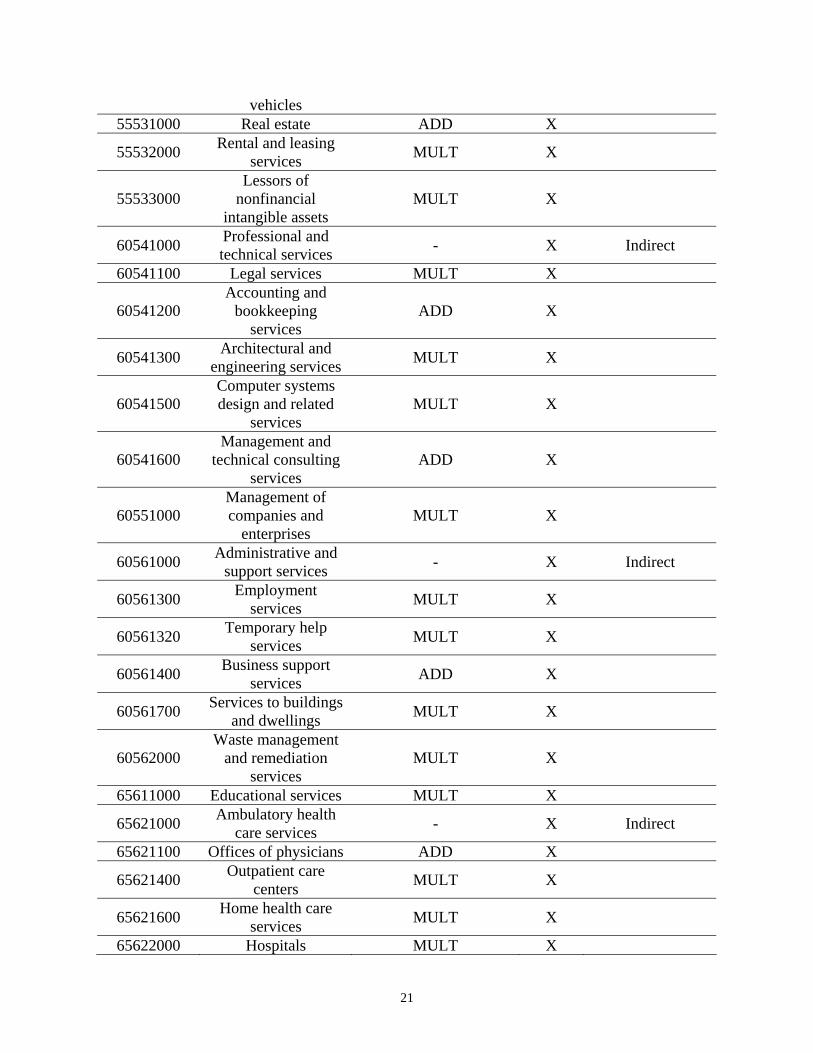
utilize both additive and multiplicative adjustments. See Exhibit 6 for a list of which series are
adjusted with additive and multiplicative models, and designation of the calendar effects
modeling described above.
Exhibit 6. Additive and multiplicative models.
Seasonal Adjustment - AE
NAICS Tabcode
Tabcode title Mode
4/5 week adj
Other adj
10113310 Logging MULT X
10211000 Oil and gas extraction MULT X
10212000 Mining, except oil and gas - X Indirect1
10212100 Coal mining MULT X
10213000 Support activities for mining ADD X
20236100 Residential building - X Indirect 20236200 Nonresidential - X Indirect
18
building
20237000 Heavy and civil
engineering construction
ADD X
20238000 Specialty trade contractors - X Indirect
20238001 Residential specialty trade contractors MULT X Raked2
20238002 Nonresidential specialty trade
contractors MULT X Raked
31321000 Wood products ADD X
31327000 Nonmetallic mineral products ADD X
31331000 Primary metals MULT X
31332000 Fabricated metal products ADD X
31333000 Machinery MULT X
31334000 Computer and electronic products - X Indirect
31334100 Computer and peripheral equipment MULT X
31334200 Communications equipment ADD X
31334400 Semiconductors and
electronic components
MULT X
31334500 Electronic instruments ADD X
31335000 Electrical equipment and appliances MULT X
31336000 Transportation equipment MULT
31336001 Motor vehicles and parts MULT
31337000 Furniture and related products MULT X
31339000 Miscellaneous manufacturing MULT X
32311000 Food manufacturing MULT X
32312000 Beverages and tobacco products ADD X
32313000 Textile mills MULT X 32314000 Textile product mills ADD X 32315000 Apparel MULT X 32316000 Leather and allied MULT X
19
products
32322000 Paper and paper products ADD X
32323000 Printing and related support activities MULT X
32324000 Petroleum and coal products MULT X
32325000 Chemicals MULT X
32326000 Plastics and rubber products MULT X
41423000 Durable goods MULT X 41424000 Nondurable goods MULT X
41425000 Electronic markets
and agents and brokers
MULT X
42441000 Motor vehicle and parts dealers - X Indirect
42441100 Automobile dealers MULT X
42442000 Furniture and home furnishings stores MULT X
42443000 Electronics and appliance stores MULT X
42444000 Building material and garden supply
stores MULT X
42445000 Food and beverage stores MULT X
42446000 Health and personal care stores MULT X
42447000 Gasoline stations MULT X
42448000 Clothing and
clothing accessories stores
MULT X
42451000 Sporting goods,
hobby, book, and music stores
MULT X
42452000 General merchandise stores - X Indirect
42452100 Department stores MULT X
42453000 Miscellaneous store retailers ADD X
42454000 Nonstore retailers MULT X 43481000 Air transportation MULT X 43482000 Rail transportation MULT X 43483000 Water transportation MULT X
20
43484000 Truck transportation ADD X
43485000 Transit and ground
passenger transportation
ADD
43486000 Pipeline transportation MULT X
43487000 Scenic and sightseeing
transportation MULT X
43488000 Support activities for transportation MULT X
43492000 Couriers and messengers ADD X
43493000 Warehousing and storage MULT X
44221000 Utilities MULT X
50511000 Publishing
industries, except Internet
MULT X
50512000 Motion picture and
sound recording industries
MULT X
50515000 Broadcasting, except Internet MULT X
50516000 Internet publishing and broadcasting MULT X
50517000 Telecommunications MULT X
50518000 ISPs, search portals, and data processing MULT X
50519000 Other information services MULT X
55521000 Monetary authorities - central bank MULT X
55522000 Credit intermediation and related activities - X Indirect
55522100 Depository credit intermediation MULT X
55522110 Commercial banking MULT X
55523000
Securities, commodity contracts,
investments
MULT X
55524000 Insurance carriers and related activities MULT X
55525000 Funds, trusts, and other financial MULT X
21
vehicles 55531000 Real estate ADD X
55532000 Rental and leasing services MULT X
55533000 Lessors of
nonfinancial intangible assets
MULT X
60541000 Professional and technical services - X Indirect
60541100 Legal services MULT X
60541200 Accounting and
bookkeeping services
ADD X
60541300 Architectural and engineering services MULT X
60541500 Computer systems design and related
services MULT X
60541600 Management and
technical consulting services
ADD X
60551000 Management of companies and
enterprises MULT X
60561000 Administrative and support services - X Indirect
60561300 Employment services MULT X
60561320 Temporary help services MULT X
60561400 Business support services ADD X
60561700 Services to buildings and dwellings MULT X
60562000 Waste management
and remediation services
MULT X
65611000 Educational services MULT X
65621000 Ambulatory health care services - X Indirect
65621100 Offices of physicians ADD X
65621400 Outpatient care centers MULT X
65621600 Home health care services MULT X
65622000 Hospitals MULT X
22
65623000 Nursing and
residential care facilities
- X Indirect
65623100 Nursing care facilities ADD X
65624000 Social assistance - X Indirect
65624400 Child day care services ADD X
70711000 Performing arts and spectator sports MULT X
70712000 Museums, historical sites, zoos, and parks MULT X
70713000 Amusements, gambling, and
recreation MULT X
70721000 Accommodations MULT X
70722000 Food services and drinking places ADD X
80811000 Repair and maintenance ADD X
80812000 Personal and laundry services MULT X
80813000 Membership
associations and organizations
ADD
90911000 Federal, except U.S. Postal Service MULT X
90919120 U.S. Postal Service MULT X
90921611 State government education ADD X
90922000 State government, excluding education MULT X
90931611 Local government education ADD X
90932000 Local government, excluding education ADD X Election
adjustment3
Seasonal Adjustment - WW
NAICS Tabcode
Mode
4/5 week adj
Other adj
10000000 Natural resources and mining MULT X
10210000 Mining MULT X 20000000 Construction MULT X
23
31000000 Durable goods MULT X 32000000 Nondurable goods MULT X 41420000 Wholesale trade MULT X 42000000 Retail trade MULT X
43000000 Transportation and warehousing ADD X
44220000 Utilities MULT X 50000000 Information MULT X
55520000 Finance and insurance MULT X
55530000 Real estate and rental and leasing ADD X
60540000 Professional and technical services MULT X
60550000 Management of companies and
enterprises ADD X
60560000 Administrative and waste services ADD X
65610000 Educational services MULT X
65620000 Health care and social assistance MULT X
70710000 Arts, entertainment, and recreation MULT X
70720000 Accommodations and food services MULT X
80000000 Other services MULT X 90910000 Federal MULT X 90920000 State government MULT X
90930000 Local government MULT X Election adjustment
24
Seasonal Adjustment - PW
NAICS Tabcode
Mode
4/5 week adj
Other adj
10000000 Natural resources and mining ADD X
20000000 Construction ADD X 31321000 Wood products ADD X
31327000 Nonmetallic mineral products ADD X
31331000 Primary metals MULT X
31332000 Fabricated metal products MULT X
31333000 Machinery MULT X
31334000 Computer and electronic products MULT X
31335000 Electrical equipment and appliances MULT X
31336000 Transportation equipment MULT
31336001 Motor vehicles and parts MULT
31337000 Furniture and related products MULT X
31339000 Miscellaneous manufacturing MULT X
32311000 Food manufacturing MULT X
32312000 Beverages and tobacco products ADD X
32313000 Textile mills MULT X 32314000 Textile product mills ADD X 32315000 Apparel MULT X
32316000 Leather and allied products MULT X
32322000 Paper and paper products ADD X
32323000 Printing and related support activities MULT X
32324000 Petroleum and coal products MULT X
32325000 Chemicals ADD X
32326000 Plastics and rubber products MULT X
25
41420000 Wholesale trade MULT X 42000000 Retail trade MULT X
43000000 Transportation and warehousing MULT X
44220000 Utilities MULT X 50000000 Information MULT X 55000000 Financial activities ADD X
60000000 Professional and business services MULT X
65000000 Education and health services MULT X
65620001 Health care MULT X
70000000 Leisure and hospitality MULT X
80000000 Other services ADD X
Seasonal Adjustment - AWH
NAICS Tabcode
Mode 4/5 week
adj 10/11 day
adj
Easter/ Labor
Day adj
10000000 Natural resources and mining MULT X X
20000000 Construction ADD X X 31321000 Wood products MULT X X
31327000 Nonmetallic mineral products MULT X X
31331000 Primary metals MULT X X
31332000 Fabricated metal products MULT X X
31333000 Machinery MULT X X
31334000 Computer and electronic products MULT X X
31335000 Electrical equipment and appliances MULT X X
31336000 Transportation equipment MULT X X
31336001 Motor vehicles and parts MULT X X
31337000 Furniture and related products MULT X X
31339000 Miscellaneous manufacturing MULT X X
32311000 Food manufacturing MULT X X 32312000 Beverages and ADD X X
26
tobacco products 32313000 Textile mills MULT X X 32314000 Textile product mills MULT X X 32315000 Apparel MULT X X
32316000 Leather and allied products MULT X X
32322000 Paper and paper products MULT X X
32323000 Printing and related support activities MULT X X
32324000 Petroleum and coal products MULT X X
32325000 Chemicals MULT X
32326000 Plastics and rubber products MULT X X
41420000 Wholesale trade MULT X X 42000000 Retail trade MULT X
43000000 Transportation and warehousing MULT X X
44220000 Utilities MULT X 50000000 Information MULT X 55000000 Financial activities MULT X
60000000 Professional and business services MULT X X
65000000 Education and health services MULT X
65620001 Health care MULT X
70000000 Leisure and hospitality MULT X
80000000 Other services MULT X X
27
Seasonal Adjustment - AHE
NAICS Tabcode
Mode
4/5 week adj
10/11 day adj
10000000 Natural resources and mining ADD X
20000000 Construction ADD X 31000000 Durable goods ADD X 32000000 Nondurable goods MULT X 41420000 Wholesale trade ADD X 42000000 Retail trade ADD X
43000000 Transportation and warehousing MULT X
44220000 Utilities MULT X 50000000 Information MULT X 55000000 Financial activities MULT X
60000000 Professional and business services MULT X
65000000 Education and health services MULT X
70000000 Leisure and hospitality ADD X
80000000 Other services MULT X
28
Seasonal Adjustment Comparison - AOT
NAICS Tabcode
Mode 4/5 week
adj 10/11 day
adj
Easter/ Labor Day
adj 31000000 Durable goods MULT X X 32000000 Nondurable goods ADD X X
1 Seasonal adjustment occurs at the lowest available industry level. 2 Residential and nonresidential specialty trade estimates are raked to the specialty trade estimates to ensure consistency. 3 Special adjustment for the presence/absence of poll workers in local government
Table 1. Percent differences between nonfarm employment benchmarks and estimates by industry division, March 1995-2004 1
Industry 1995 1996 1997 1998 1999 2000 2001 2002 2003 2004
Total 0.5 (2) 0.4 (2) 0.2 0.4 -0.1 -0.2 -0.1 0.2 Total Private 0.5 0.1 0.5 0.1 0.2 0.3 -0.2 -0.4 -0.2 0.2 Government 0.2 -0.1 -0.4 -0.2 0.1 0.6 0.3 1.0 0.3 0.1
(1) Differences are based on comparisons of final published March estimates and benchmark levels, as originally published.
(2) Less than 0.05 percent.
29
Table 2. Nonfarm employment benchmarks by industry, March 2004
(Numbers in thousands)
Difference Industry Benchmark Estimate
Amount Percent
Total nonfarm 130,019 129,816 203 .2
Total private 108,027 107,847 180 .2
Goods-producing 21,341 21,350 -9 (1)
Service-providing 108,678 108,466 212 .2
Private service-providing 86,686 86,497 189 .2
Natural resources and mining 570 566 4 .7
Logging 64 61 3 4.7
Mining 505 504 1 .2
Oil and gas extraction 120 129 -9 -7.5
Mining, except oil and gas 196 197 -1 -.5
Coal mining 69 70 -1 -1.4
Support activities for mining 189 179 10 5.3
30
Construction 6,551 6,512 39 .6
Construction of buildings 1,548 1,548 0 0
Heavy and civil engineering construction 818 842 -24 -2.9
Specialty trade contractors 4,186 4,122 64 1.5
Manufacturing 14,220 14,272 -52 -.4
Durable goods 8,844 8,870 -26 -.3
Wood products 535 531 4 .7
Nonmetallic mineral products 486 481 5 1.0
Primary metals 464 461 3 .6
Fabricated metal products 1,476 1,475 1 .1
Machinery 1,133 1,147 -14 -1.2
Computer and electronic products 1,317 1,336 -19 -1.4
Computer and peripheral equipment 213 219 -6 -2.8
Communications equipment 148 155 -7 -4.7
Semiconductors and electronic components 449 451 -2 -.4
Electronic instruments 427 426 1 .2
Electrical equipment and appliances 445 446 -1 -.2
Transportation equipment 1,765 1,770 -5 -.3
Furniture and related products 571 573 -2 -.4
Miscellaneous manufacturing 653 651 2 .3
Nondurable goods 5,376 5,402 -26 -.5
31
Food manufacturing 1,470 1,475 -5 -.3
Beverages and tobacco products 189 193 -4 -2.1
Textile mills 241 238 3 1.2
Textile product mills 177 179 -2 -1.1
Apparel 294 295 -1 -.3
Leather and allied products 43 45 -2 -4.7
Paper and paper products 496 506 -10 -2.0
Printing and related support activities 663 661 2 .3
Petroleum and coal products 110 111 -1 -.9
Chemicals 890 896 -6 -.7
Plastics and rubber products 803 804 -1 -.1
Trade, transportation, and utilities 25,130 25,092 38 .2
Wholesale trade 5,602 5,597 5 .1
Electronic markets and agents and brokers 688 663 25 3.6
Retail trade 14,771 14,753 18 .1
Motor vehicle and parts dealers 1,891 1,893 -2 -.1
Automobile dealers 1,259 1,262 -3 -.2
Furniture and home furnishings stores 555 541 14 2.5
Electronics and appliance stores 511 510 1 .2
Building material and garden supply stores 1,193 1,212 -19 -1.6
Food and beverage stores 2,797 2,805 -8 -.3
Health and personal care stores 937 953 -16 -1.7
32
Gasoline stations 869 863 6 .7
Clothing and clothing accessories stores 1,311 1,285 26 2.0
Sporting goods, hobby, book, and music stores 626 622 4 .6
General merchandise stores 2,766 2,743 23 .8
Department stores 1,556 1,550 6 .4
Miscellaneous store retailers 896 907 -11 -1.2
Nonstore retailers 420 421 -1 -.2
Transportation and warehousing 4,190 4,163 27 .6
Air transportation 513 510 3 .6
Rail transportation 222 215 7 3.2
Water transportation 54 48 6 11.1
Truck transportation 1,313 1,320 -7 -.5
Transit and ground passenger transportation 400 394 6 1.5
Pipeline transportation 38 38 0 0
Scenic and sightseeing transportation 22 26 -4 -18.2
Support activities for transportation 527 514 13 2.5
Couriers and messengers 554 570 -16 -2.9
Warehousing and storage 548 529 19 3.5
Utilities 567 579 -12 -2.1 Information 3,126 3,158 -32 -1.0 Publishing industries, except Internet 909 914 -5 -.6 Motion picture and sound recording industries 374 374 0 0 Broadcasting, except Internet 324 333 -9 -2.8
33
Internet publishing and broadcasting 29 32 -3 -10.3 Telecommunications 1,053 1,053 0 0 ISPs, search portals, and data processing 387 404 -17 -4.4 Other information services 50 49 1 2.0
Financial activities 7,966 7,958 8 .1
Finance and insurance 5,929 5,923 6 .1 Monetary authorities--central bank 22 22 0 0 Credit intermediation and related activities 2,807 2,786 21 .7 Depository credit intermediation 1,747 1,759 -12 -.7 Commercial banking 1,277 1,280 -3 -.2 Securities, commodity contracts, investments 757 778 -21 -2.8 Insurance carriers and related activities 2,257 2,258 -1 (1) Funds, trusts, and other financial vehicles 86 79 7 8.1 Real estate and rental and leasing 2,037 2,036 1 (1) Real estate 1,382 1,385 -3 -.2 Rental and leasing services 629 622 7 1.1 Lessors of nonfinancial intangible assets 26 29 -3 -11.5
Professional and business services 15,995 16,031 -36 -.2 Professional and technical services 6,771 6,752 19 .3 Legal services 1,149 1,132 17 1.5 Accounting and bookkeeping services 927 928 -1 -.1 Architectural and engineering services 1,225 1,229 -4 -.3 Computer systems design and related services 1,129 1,105 24 2.1 Management and technical consulting services 760 768 -8 -1.1
34
Management of companies and enterprises 1,702 1,664 38 2.2 Administrative and waste services 7,523 7,615 -92 -1.2 Administrative and support services 7,205 7,297 -92 -1.3 Employment services 3,231 3,348 -117 -3.6 Temporary help services 2,207 2,268 -61 -2.8 Business support services 755 748 7 .9 Services to buildings and dwellings 1,557 1,543 14 .9 Waste management and remediation services 318 318 0 0 Education and health services 16,988 16,953 35 .2 Educational services 2,904 2,883 21 .7 Health care and social assistance 14,084 14,070 14 .1 Ambulatory health care services 4,890 4,857 33 .7 Offices of physicians 2,036 2,040 -4 .2 Outpatient care centers 443 431 12 2.7 Home health care services 757 739 18 2.4 Hospitals 4,268 4,293 -25 -.6 Nursing and residential care facilities 2,799 2,793 6 .2 Nursing care facilities 1,570 1,579 -9 -.6 Social assistance 2,127 2,127 0 0 Child day care services 772 789 -17 -2.2
Leisure and hospitality 12,077 11,927 150 1.2 Arts, entertainment, and recreation 1,694 1,657 37 2.2 Performing arts and spectator sports 353 348 5 1.4
35
Museums, historical sites, zoos, and parks 110 108 2 1.8 Amusements, gambling, and recreation 1,232 1,201 31 2.5 Accommodations and food services 10,383 10,270 113 1.1 Accommodations 1,727 1,694 33 1.9 Food services and drinking places 8,656 8,576 80 .9 Other services 5,404 5,378 26 .5 Repair and maintenance 1,232 1,241 -9 -.7 Personal and laundry services 1,264 1,247 17 1.3 Membership associations and organizations 2,908 2,890 18 .6 Government 21,992 21,969 23 .1 Federal 2,713 2,698 15 .6 Federal, except U.S. Postal Service 1,928 1,911 17 .9 U.S. Postal Service 785 787 -2 -.3 State government 5,116 5,164 -48 -.9 State government education 2,392 2,429 -37 -1.5 State government, excluding education 2,725 2,735 -10 -.4 Local government 14,163 14,107 56 .4 Local government education 8,111 8,075 36 .4 Local government, excluding education 6,052 6,032 20 .3
(1) Less than 0.05 percent.
36
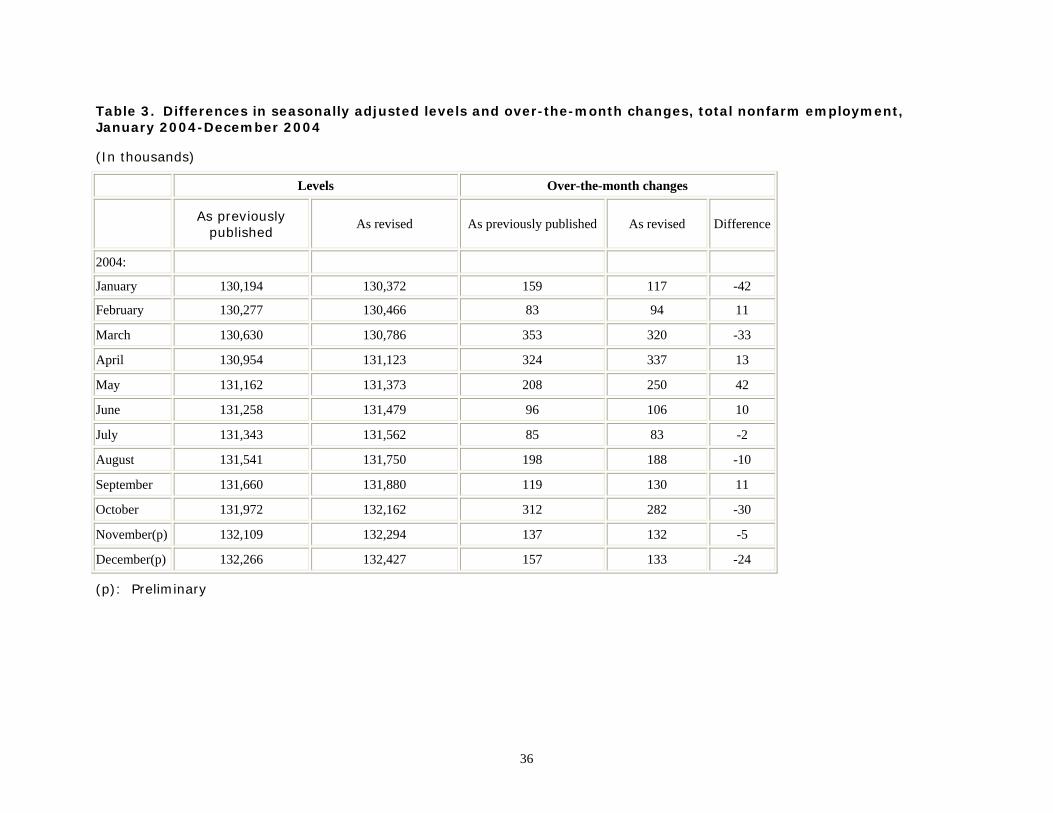
Table 3. Differences in seasonally adjusted levels and over-the-month changes, total nonfarm employment, January 2004-December 2004
(In thousands)
Levels Over-the-month changes
As previously published
As revised As previously published As revised Difference
2004: January 130,194 130,372 159 117 -42 February 130,277 130,466 83 94 11 March 130,630 130,786 353 320 -33 April 130,954 131,123 324 337 13 May 131,162 131,373 208 250 42 June 131,258 131,479 96 106 10 July 131,343 131,562 85 83 -2 August 131,541 131,750 198 188 -10 September 131,660 131,880 119 130 11 October 131,972 132,162 312 282 -30 November(p) 132,109 132,294 137 132 -5 December(p) 132,266 132,427 157 133 -24
(p): Preliminary
37
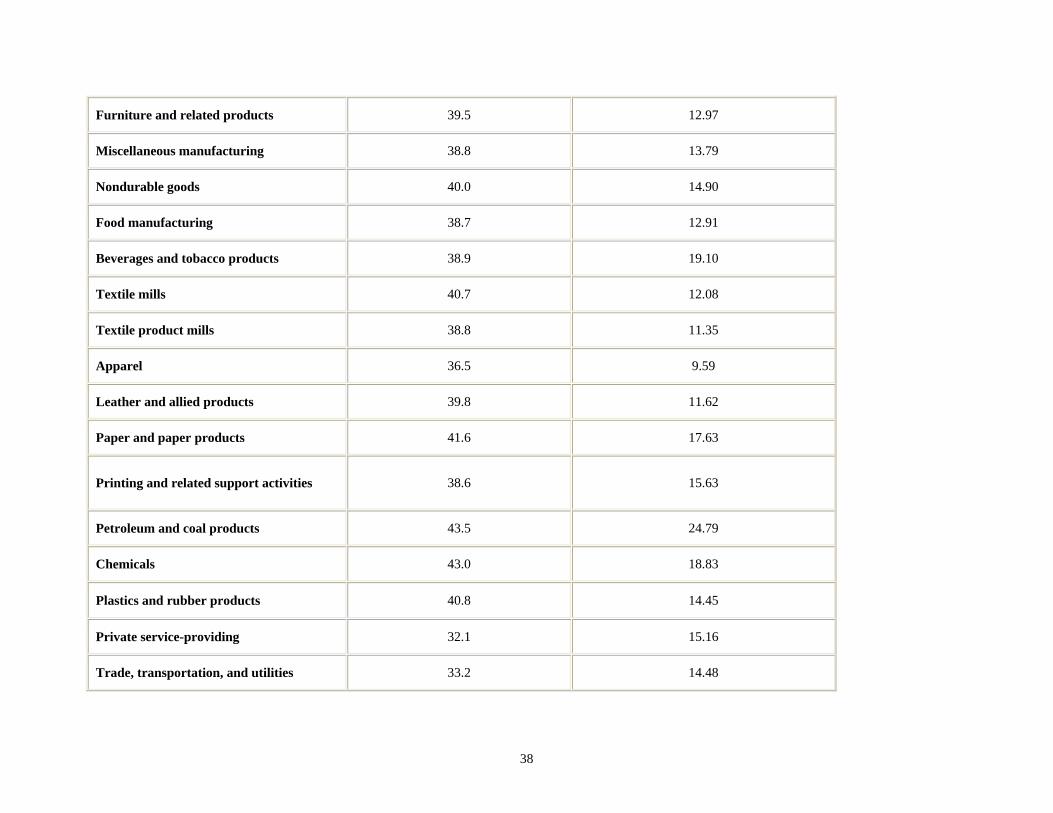
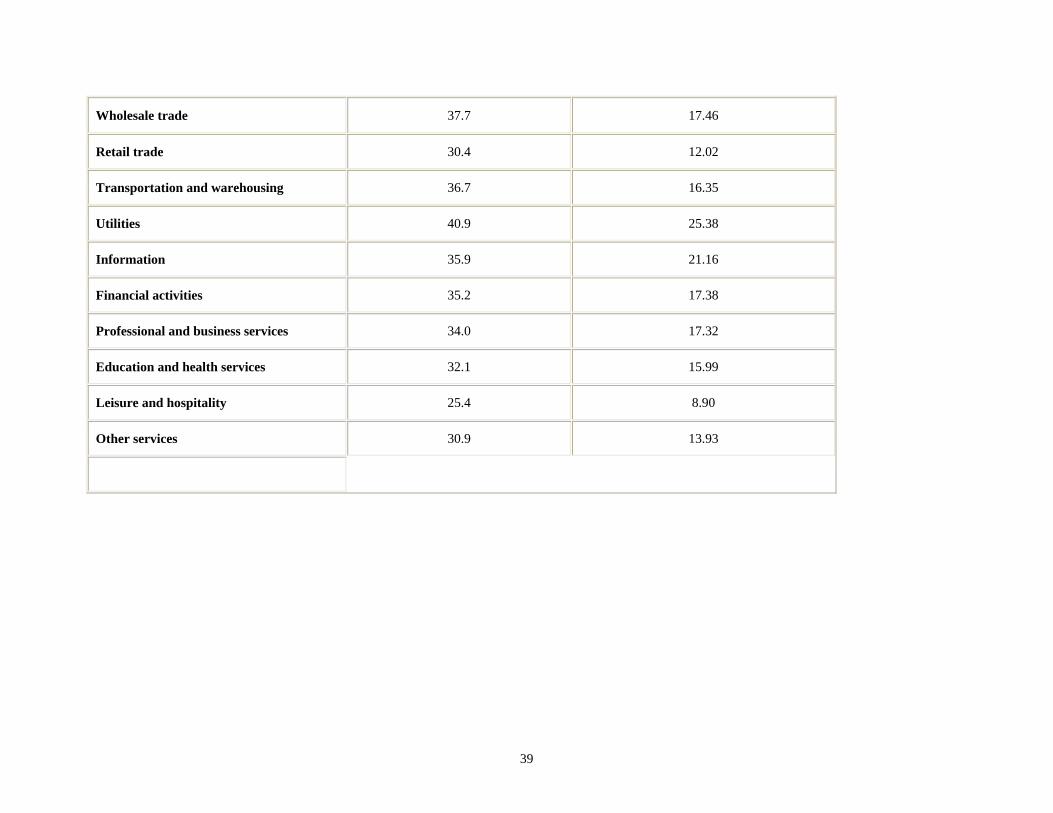
Table 4. Hours and earnings estimates, selected industries, March 2004
Industry Average weekly hours Average hourly earnings
Total private 33.5 $15.54
Goods-producing 40.1 17.00
Natural resources and mining 43.9 18.10
Construction 38.3 19.06
Manufacturing 40.8 16.00
Durable goods 41.4 16.68
Wood products 40.6 12.93
Nonmetallic mineral products 42.5 16.00
Primary metals 43.1 18.33
Fabricated metal products 41.0 15.25
Machinery 41.9 16.50
Computer and electronic products 40.8 16.94
Electrical equipment and appliances 40.6 14.71
Transportation equipment 43.0 21.29
38
Furniture and related products 39.5 12.97
Miscellaneous manufacturing 38.8 13.79
Nondurable goods 40.0 14.90
Food manufacturing 38.7 12.91
Beverages and tobacco products 38.9 19.10
Textile mills 40.7 12.08
Textile product mills 38.8 11.35
Apparel 36.5 9.59
Leather and allied products 39.8 11.62
Paper and paper products 41.6 17.63
Printing and related support activities 38.6 15.63
Petroleum and coal products 43.5 24.79
Chemicals 43.0 18.83
Plastics and rubber products 40.8 14.45
Private service-providing 32.1 15.16
Trade, transportation, and utilities 33.2 14.48
39
Wholesale trade 37.7 17.46
Retail trade 30.4 12.02
Transportation and warehousing 36.7 16.35
Utilities 40.9 25.38
Information 35.9 21.16
Financial activities 35.2 17.38
Professional and business services 34.0 17.32
Education and health services 32.1 15.99
Leisure and hospitality 25.4 8.90
Other services 30.9 13.93
40
Text Table A. Net Birth/Death Estimates, Post-Benchmark 2004 (In thousands)
2004:
Natural Resources & Mining
Construction Manufacturing Trade,
Transportation, & Utilities
Information Financial Activities
Professional & Business
Services
Education & Health Services
Leisure & Hospitality
Other Services
Monthly Amount
Contributed
April 0 38 3 15 2 10 66 37 45 9 225
May 1 39 8 26 3 7 26 11 77 6 204
June 1 31 7 20 1 8 24 -2 84 7 181
July 0 -7 -22 -25 -6 -12 -32 -10 45 -11 -80
August 1 16 4 18 3 8 24 17 27 5 123
September 0 10 6 19 -2 4 14 15 -24 2 44
October 0 2 -10 11 2 8 41 29 -25 -3 55
November 0 -7 2 13 2 5 -5 9 -12 2 9
December 0 -7 2 19 2 13 9 8 16 4 66
Cumulative Total 3 115 0 116 7 51 167 114 233 21 827