Embed Size (px)
Citation preview
CERTIFICATION REPORT
Certification of the Mass Concentrations of Arsenic, Cadmium, Iron, Lead, Manganese, Mercury and Nickel in
Groundwater
Certified Reference Material ERM®-CA615
EU
R 2
4508 E
N –
2010
The mission of the JRC-IRMM is to promote a common and reliable European measurement system in support of EU policies. European Commission Joint Research Centre Institute for Reference Materials and Measurements Contact information Reference materials sales Retieseweg 111 B-2440 Geel, Belgium E-mail: [email protected] Tel.: +32 (0)14 571 705 Fax: +32 (0)14 590 406 http://irmm.jrc.ec.europa.eu/ http://www.jrc.ec.europa.eu/ Legal Notice Neither the European Commission nor any person acting on behalf of the Commission is responsible for the use which might be made of this publication.
Europe Direct is a service to help you find answers to your questions about the European Union
Freephone number (*):
00 800 6 7 8 9 10 11
(*) Certain mobile telephone operators do not allow access to 00 800 numbers or these calls may be billed.
A great deal of additional information on the European Union is available on the Internet. It can be accessed through the Europa server http://europa.eu/ JRC 60103 EUR 24508 EN ISBN 978-92-79-16557-3 ISSN 1018-5593 doi:10.2787/30333 Luxembourg: Publications Office of the European Union © European Union, 2010 Reproduction is authorised provided the source is acknowledged Printed in Belgium
CERTIFICATION REPORT
Certification of the Mass Concentrations of Arsenic, Cadmium, Iron, Lead, Manganese, Mercury and Nickel in
Groundwater
Certified Reference Material ERM®-CA615
M. Ricci, E. de Vos, J. Charoud-Got, H. Emteborg, A. Held
European Commission, Joint Research Centre Institute for Reference Materials and Measurements (IRMM), Geel (BE)

Disclaimer
Certain commercial equipment, instruments, and materials are identified in
this report to specify adequately the experimental procedure. In no case does such identification
imply recommendation or endorsement by the European Commission, nor does it imply that the
material or equipment is necessarily the best available for the purpose.
1
Summary
This report presents the preparation and certification of groundwater reference material
ERM-CA615. All steps required for the production of this water-matrix reference material are
described in detail, from the sampling of natural groundwater to the characterisation exercise
that lead to the final assignment of the certified values, following ISO Guide 34:2009 [1] and
ISO Guide 35:2006 [2].
Homogeneity and stability of the water material were investigated with dedicated studies and
the certification campaign for the material characterisation was based on an inter-comparison
involving several experienced laboratories.
IRMM organised and coordinated all phases of this project and carried out the evaluation of
data.
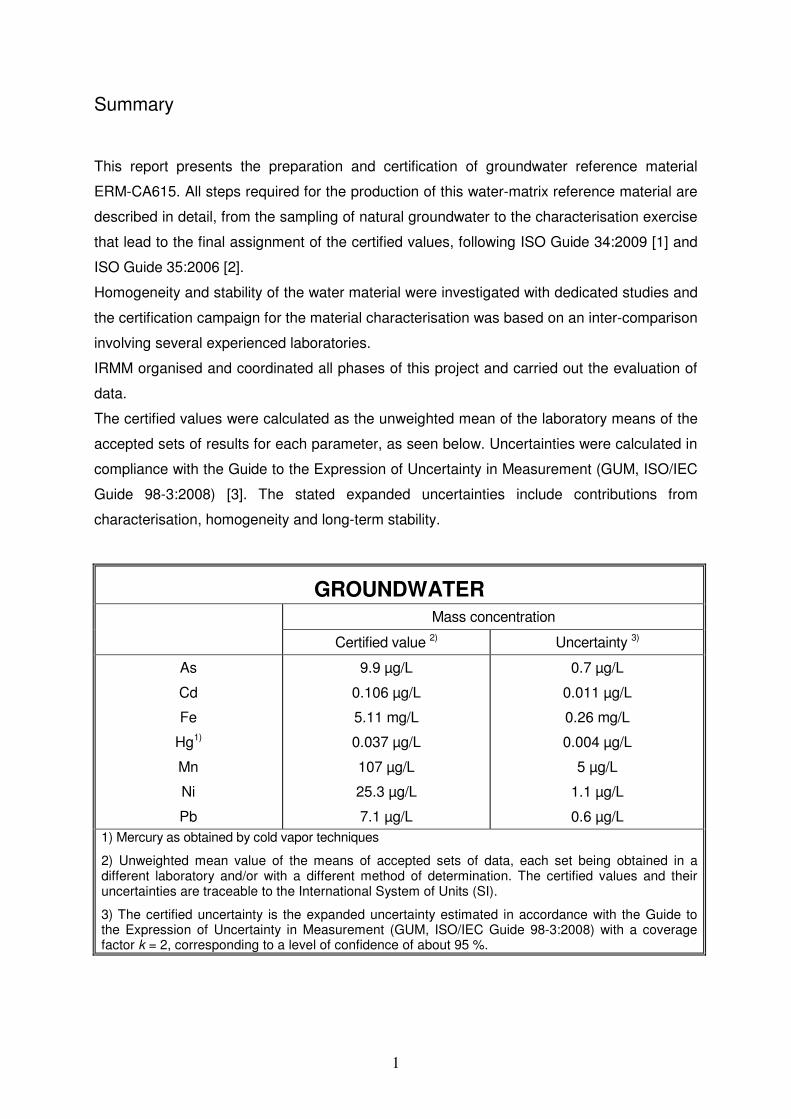
The certified values were calculated as the unweighted mean of the laboratory means of the
accepted sets of results for each parameter, as seen below. Uncertainties were calculated in
compliance with the Guide to the Expression of Uncertainty in Measurement (GUM, ISO/IEC
Guide 98-3:2008) [3]. The stated expanded uncertainties include contributions from
characterisation, homogeneity and long-term stability.
GROUNDWATER Mass concentration
Certified value 2)
Uncertainty 3)
As
Cd
Fe
Hg1)
Mn
Ni
Pb
9.9 µg/L
0.106 µg/L
5.11 mg/L
0.037 µg/L
107 µg/L
25.3 µg/L
7.1 µg/L
0.7 µg/L
0.011 µg/L
0.26 mg/L
0.004 µg/L
5 µg/L
1.1 µg/L
0.6 µg/L
1) Mercury as obtained by cold vapor techniques
2) Unweighted mean value of the means of accepted sets of data, each set being obtained in a different laboratory and/or with a different method of determination. The certified values and their uncertainties are traceable to the International System of Units (SI).
3) The certified uncertainty is the expanded uncertainty estimated in accordance with the Guide to the Expression of Uncertainty in Measurement (GUM, ISO/IEC Guide 98-3:2008) with a coverage factor k = 2, corresponding to a level of confidence of about 95 %.
2
Table of Contents
1. Introduction ..................................................................................................................................................... 4
2. Participants ..................................................................................................................................................... 5
3. Time schedule ................................................................................................................................................ 6
4. Sampling of the material .............................................................................................................................. 7
5. Processing of the material .......................................................................................................................... 7
5.1 Preparation steps ...................................................................................................................................... 7
5.2 Spiking, homogenisation and ampouling............................................................................................... 8
5.3 Sterilisation................................................................................................................................................. 9
6. Homogeneity ................................................................................................................................................... 9
7. Minimum sample intake ............................................................................................................................. 13
8. Stability studies............................................................................................................................................ 13
8.1 Set-up of stability studies ....................................................................................................................... 13
8.2 Results of stability studies ..................................................................................................................... 14
9. Characterisation........................................................................................................................................... 16
9.1 Study design ............................................................................................................................................ 16
9.2 Data evaluation and results ................................................................................................................... 17
10 Certified values and uncertainties ......................................................................................................... 20
11 Additional material information .............................................................................................................. 21
12 Metrological traceability ........................................................................................................................... 22
13 Commutability ............................................................................................................................................. 22
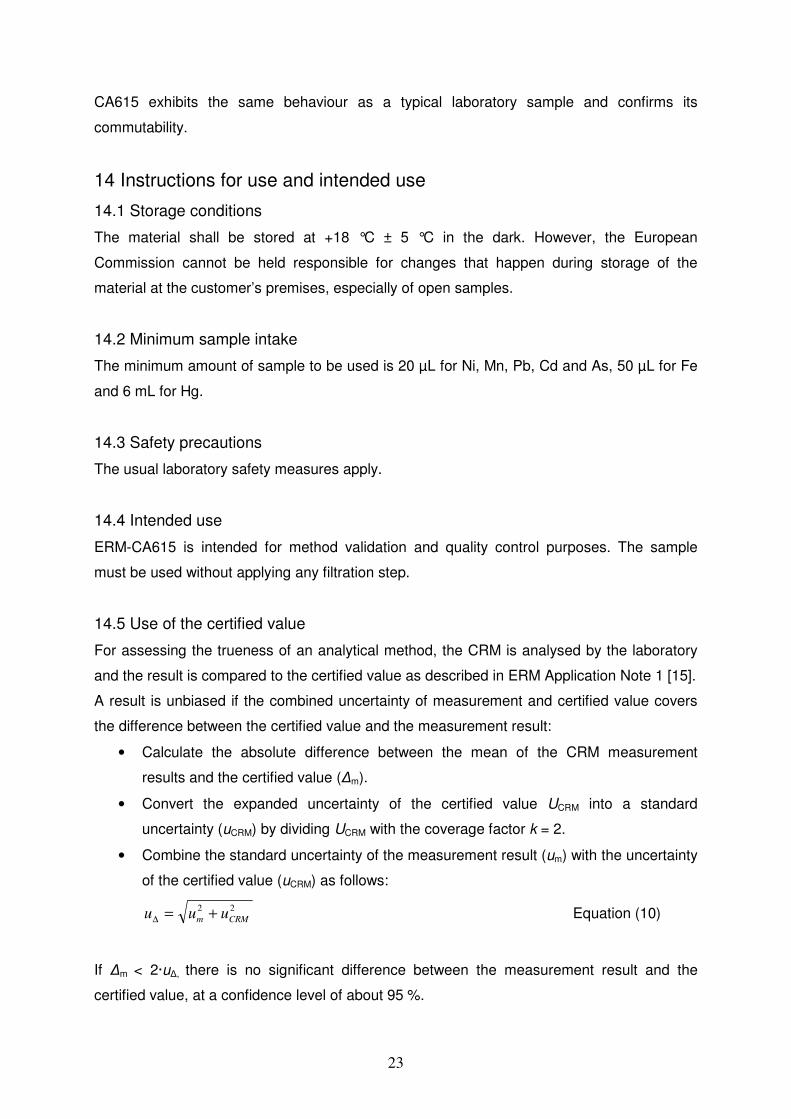
14 Instructions for use and intended use .................................................................................................. 23
14.1 Storage conditions ................................................................................................................................ 23
14.2 Minimum sample intake ....................................................................................................................... 23
14.3 Safety precautions ................................................................................................................................ 23
14.4 Intended use .......................................................................................................................................... 23
14.5 Use of the certified value ..................................................................................................................... 23
References ......................................................................................................................................................... 24
Acknowledgments ........................................................................................................................................... 25
Annex 1 ............................................................................................................................................................... 26
Annex 2 ............................................................................................................................................................... 29
Annex 3 ............................................................................................................................................................... 30
Annex 4 ............................................................................................................................................................... 37
3
Glossary ANOVA analysis of variance ASV anodic stripping voltammetry
α significance level BCR Community Bureau of Reference CRM certified reference material CV-AFS cold vapour atomic fluorescence spectrometry ∆m absolute difference between mean measured value and certified value DT double Grubbs test EDX energy dispersive X-ray spectrometry ET-AAS electrothermal atomic absorption spectrometry EQS environmental quality standard F-AAS flame atomic absorption spectrometry HG-AFS hydride generation atomic fluorescence spectrometry HG-ET-AAS hydride generation electrothermal atomic absorption spectrometry ICP-OES inductively coupled plasma optical emission spectrometry ICP-QMS inductively coupled plasma quadrupole mass spectrometry ICP-SFMS inductively coupled plasma sector field mass spectrometry IRMM Institute for Reference Materials and Measurements i.s. internal standard ISO International Organization for Standardization k coverage factor MSbetween mean square between-bottle from ANOVA MSwithin mean square within-bottle from ANOVA n number of replicates per bottle p number of accepted datasets in the characterisation study PTFE polytetrafluoroethylene QC quality control RSD relative standard deviation
RSE relative standard error (=RSD/√n) s standard deviation sbb between-bottle standard deviation SI International System of Units ST single Grubbs test swb within-bottle standard deviation
tα,df critical t-value for a t-test, with a level of confidence equal to 1-α and df degrees of freedom ubb standard uncertainty related to possible between-bottle heterogeneity ubb* standard uncertainty of heterogeneity that can be hidden by method repeatability u∆ combined standard uncertainty of measurement result and certified value uchar standard uncertainty related to characterisation 7uCRM combined standard uncertainty of a certified value UCRM expanded uncertainty of a certified value ults standard uncertainty related to long-term stability um standard uncertainty of a measurement result urect standard uncertainty related to possible between-bottle heterogeneity modelled as rectangular distribution xi time point of a stability study
x average of all time points of a stability study
y average of all results of the homogeneity study
The subscript "rel" is added when a variable is expressed in relative terms (e.g. as percent).
4
1. Introduction
Groundwater is one of the most important natural resources. It is a crucial source of drinking
water, supplying the water systems for about two-thirds of European Union citizens: its safety
is therefore vital.
The legislative framework for its effective protection is established by the Water Framework
Directive (WFD, 2000/60/EC) [4] which addresses inland surface waters, transitional waters,
coastal waters and groundwater. The WFD consists of several steps of implementation, one
of them being the mandatory monitoring of 33 Priority Substances since 2007 [5].
Recently, the priority substances were regulated to respect environmental quality standards
(EQSs), threshold concentrations that should not be exceeded in order to protect human
health and environment [6]. Among the 33 Priority Substances there are also four metals:
nickel, lead, cadmium and mercury.
A Groundwater Daughter Directive (2006/118/EC) [7] was adopted (12th December 2006) by
the European Parliament and Council which establishes specific measures as provided for in
Article 17(1) and (2) of the WFD in order to prevent and control groundwater pollution; it will
operate alongside the existing Groundwater Directive (80/68/EEC) [8] until its repeal in
December 2013. This Directive sets for the first time groundwater quality standards (to be
monitor and assess by the Member States) and introduces measures to prevent or limit
inputs of pollutants into groundwater, including common criteria for the identification and
reversal of significant and sustained upward trends in pollutant concentrations.
The compliance of the groundwater with good chemical status criteria is based on threshold
values required to be decided by Member States for, among others, arsenic, cadmium, lead,
mercury [7].
The WFD requires the establishment of monitoring programmes covering groundwater
quantitative status, chemical status and the assessment of significant, long-term pollutant
trends resulting from human activity. The confidence in any assessment of groundwater will
depend on the quality in the context of measurement data. A continuous quality assurance
system should be developed and implemented for each monitoring institution to ensure that
the reported results meet assured target levels of precision and bias [9].
The availability of appropriate certified reference materials will therefore be an asset in the
validation of analytical methods, ensuring accuracy and traceability of the measurement
results [10].
ERM- CA615, the production of which was carried out by IRMM and described in this report,
is intended to be used as a quality assurance and quality control tool especially by the
laboratories involved in the mandatory monitoring prescribed under the WFD.
5
The parameters certified in ERM-CA615 are the following: arsenic, cadmium, iron, lead,
manganese, mercury and nickel. The values are stated as mass concentrations, micrograms
or milligrams per liter (µg/L or mg/L), because this is the most common way used by the
"water analysis" community to express concentration of a parameter in water.
The target levels for nickel, lead, cadmium and mercury in the material were designed to
reflect the recently enforced EQSs [6].
2. Participants
• Sampling and processing
European Commission, Joint Research Centre, Institute for Reference Materials and Measurements (IRMM), Geel, BE (accredited to ISO Guide 34, Belac No 268-TEST)
• Homogeneity study
ALS Scandinavia AB, Luleå, SE (accredited to ISO/IEC 17025 for measurements of metals in freshwater, SWEDAC No 07-213-51.1056)
• Stability studies
DVGW-Technologiezentrum Wasser, Karlsruhe, DE (accredited to ISO/IEC 17025 for measurements of metals in groundwater, DACH DAC-PL-0142 -01-10)
• Characterisation analyses (in alphabetical order)
Bayer Antwerpen NV, Centraal Laboratorium, Antwerpen, BE (accredited to ISO/IEC 17025 for measurements of metals in groundwater, Belac No 264-TEST)
Cemagref, Laboratoire d'analyses physico-chimiques des milieux aquatiques, UR Milieux Aquatiques, Ecologie et Pollutions, Lyon Cedex 09, FR (accredited to ISO/IEC 17025 for physico-chemical analysis of water, Cofrac No 1-1238)
Consiglio Nazionale delle Ricerche, Istituto di Ricerca Sulle Acque, UOS Brugherio, IT
DVGW-Technologiezentrum Wasser, Karlsruhe, DE (accredited to ISO/IEC 17025 for measurements of metals in groundwater, DACH DAC-PL-0142 -01-10)
EPAL- Empresa Portuguesa das Águas Livres, S.A – Laboratório central, Lisboa, PT (accredited to ISO/IEC 17025 for measurements of metals in drinking water, IPAC No L0242)
IWW Rheinisch-Westfälisches Institut für Wasser, Mülheim an der Ruhr, DE (accredited to ISO/IEC 17025 for measurements of metals in groundwater, DGA DAC-PL-0170-02-01)
6
Laboratoire National de métrologie et d'essais (LNE), Paris, FR (accredited to ISO/IEC 17025 for measurement of metals in surface and groundwaters, Cofrac, No 2-54)
Rijkwaterstaat, Ministerie van Verkeer and Waterstaat, Waterdienst, Lelystad, NL (accredited to ISO/IEC 17025 for measurements of metals in surface and wastewater, RvA, No L194)
VA SYD, Malmö, SE (accredited to ISO/IEC 17025 for chemical analysis of freshwater, SWEDAC No 07-213-51.1056)
Vlaamse Instelling voor Technologisch Onderzoek (VITO), Mol, BE (accredited to ISO/IEC 17025 for measurements of metals in groundwater, Belac No 045-TEST)
Vlaamse Milieumaatschappij (VMM), Afdeling Rapportering Water, Dienst Laboratorium, Gent, BE (accredited to ISO/IEC 17025 for measurements of metals in groundwater, Belac No 163-TEST)
Universidade de Santiago de Compostela, Departamento de Quimica Analitica, Nutricion y Bromatologia, Santiago de Compostela, ES
Universität Heidelberg, Institut für Umwelt-Geochemie Anorganische Ultraspurenanalytik, Heidelberg, DE
University of Liverpool, Department of Earth and Ocean Sciences, Liverpool, UK
UT2A (Ultra Trace Analyses Aquitane), Pau Cedex 9, FR
• Project management and data evaluation
European Commission, Joint Research Centre, Institute for Reference Materials and Measurements (IRMM), Geel, BE (accredited to ISO Guide 34, Belac No 268-TEST)
3. Time schedule
Sampling April 2007
Processing October 2007
Homogeneity June 2008
Short-term stability September 2008
Long-term stability March 2010
Characterisation August 2009
7
4. Sampling of the material
The site chosen for the sampling was a locked well located in Bree, North-East Limburg,
Belgium. The place was carefully selected (with respect to water composition and discharge)
through the Databank Ondergrond Vlaanderen, a database containing information on all
wells belonging to the Flemish groundwater monitoring network, under the responsibility of
the water division of Vlaamse Milieumaatschappij (VMM, Flemish Environment Agency).
The sampling was carried out by an IRMM team with the logistical support and under the
supervision of representatives of the water division of VMM. The protocol of good water
sampling as laid down by the Openbare Vlaamse Afvalstoffenmaatschappij (OVAM, Public
Waste Agency of Flanders) was followed.
One pre-cleaned polyethylene drum of 200 L was filled with the aid of a frequency-regulated
pump. The PTFE tubes and the in-line filter (VersaflowTM Capsule containing a 0.45 µm
Versapor® Membrane with pre-filter 8 µm PN 12131, Pall Corp, Port Washington, NY, US)
were extensively flushed to avoid external contamination before starting with the water
collection into the drum. The sampling depth was about 27 meters and the water was
collected with a speed of about 5 L/min. The water bulk was acidified immediately upon
collection with 200 mL concentrated HNO3 (Suprapur, Merck, Darmstadt, DE) to pH ~2. The
drum was then stored at +4 ºC in the dark at IRMM premises until further processing took
place.
5. Processing of the material
5.1 Preparation steps
From the first container, the bulk water was pumped via an in-line filter (AcroPackTM 1000,
Supor® Membrane 0.8/0.2 µm PN 12992, Pall Corp, Port Washington, NY, US, offering also
bacterial retention) to another pre-cleaned drum. The drum, the PTFE tubes and PTFE-
paddle used for homogenisation were all previously washed with an in-house prepared
solution ~2 % (volume fraction) of concentrated HNO3 (Suprapur, Merck, Darmstadt, DE) and
subsequently extensively rinsed with de-ionised water (18.2 µS/cm). For cleaning of the
drum, a Turbula mixer (Turbula T-200, W.A.B, Basel, CH) was employed. The tubes and
filter were also "conditioned" with the groundwater for few minutes, before starting the
collection into the second drum intended to be used for spiking and homogenisation of the
bulk water.
The hand-made borosilicate ampoules of 100 mL were checked for blank levels regarding
the seven trace elements to be certified. The ampoules were left in contact with an in-house
prepared solution ~2 % (volume fraction) of concentrated HNO3 (Suprapur, Merck,
Darmstadt, DE) for different periods of time (1, 7 and 25 days). The leaching solutions were
8
measured in-house by ICP-QMS (Agilent 7500ce, Agilent Technologies, Santa Clara, USA)
and showed a small contribution of lead (about 0.2 µg/L). The measurements of the acid
solutions used for a simple rinsing of the ampoules (without any leach period) showed also
comparable concentrations, leading to the conclusion that a simple short rinse would be
sufficient to keep the possible contamination down to acceptable levels. To confirm this
conclusion, ampoules were filled with an in-house prepared solution ~2 % (volume fraction)
of concentrated HNO3 (Suprapur, Merck, Darmstadt, DE), emptied after approximately 1
minute and left to dry overnight in a drying cabinet. The next day the ampoules were rinsed
once again with freshly prepared solution ~2 % (volume fraction) of concentrated HNO3
(Suprapur, Merck, Darmstadt, DE) and this rinse solution was analysed. The measured level
of lead was about 0.08 µg/L, which was considered to be a negligible contribution to the
envisaged target lead concentration of about 7 µg/L.
The ampoules to be used for ERM-CA615 were consequently first washed with an in-house
prepared solution ~2 % (volume fraction) of concentrated HNO3 (Suprapur, Merck,
Darmstadt, DE), subsequently rinsed with ultra-pure water (18.2 µS/cm), dried overnight in a
cabinet at 60 ºC (Elbanton, Kerkdriel, NL) and kept in the oven at 30 ºC until the filling with
the groundwater took place.
5.2 Spiking, homogenisation and ampouling
A preliminary characterisation of the water, with regard to the parameters to be certified, was
performed to find out if spiking was necessary to obtain the target levels of the analytes.
Following these preliminary analyses, spiking with the ICP Standards Hg(NO3)2, Cd(NO3)2
and Pb(NO3)2 (Certipur, Merck, Darmstadt, DE, solutions in HNO3) was performed to
increase the concentrations of Hg, Cd and Pb to about 0.04, 0.1 and 7 µg/L, respectively.
These target levels were decided on the basis of the EQSs, which are set to 0.05 µg/L for
Hg, 0.08 µg/L for Cd and 7.2 µg/L for Pb. The spiking was performed after the 0.8/0.2 µm
filtration (see Section 5.1) and was followed by homogenisation with a PTFE-paddle for
about five hours.
Quantities of about 97 mL of water were subsequently filled into 100 mL borosilicate glass
ampoules. The head-space was flushed with argon before flame-sealing of the ampoules,
using an automatic ampouling machine (ROTA R910/PA, Wehr-Baden, DE).
Subsequently, labelling of 1838 units took place.
During labelling, the presence of white flakes was noticed in some of the ampoules. They
showed a maximum size of about 1 mm. The flakes were analysed at IRMM by means of
electron microscopy, i.e. secondary electron imaging (Quanta 200/3D SEM/FIB, FEI
Instruments, Eindhoven, NL) and X-ray Energy-Dispersive Spectrometry (EDX, INCA
9
Energy+ system, Oxford Instruments, Abingdon, UK). Based on the qualitative results
acquired, C and O were the main elements detected in the flakes. The organic origin could
also be deduced from the observed degradation due to the electronic beam. The comparison
of the EDX spectra of a flake positioned on the C-tape substrate and of the substrate only
could give an indication of presence of Cl, Ca, Si and Fe in the flake. None of the target
elements were detected in the flakes, with the exception of Fe (which is anyway present in
the water at the rather high concentration of ~5 mg/L). As additional information, the EDX
detection limits quoted in literature (no validation of these limits was performed for the results
presented here) vary form 0.05 to 0.2 % (mass fraction) for heavy elements, above the levels
of all the target elements except Fe (~5 mg/L) and Mn (~100 µg/L).
It is not inconceivable that dissolved humic acids present in the water could precipitate upon
acidification. The white flakes could therefore be precipitated humic acids. Since humic acids
are known to be naturally occurring ligands for many elements, it could not be excluded that
the flakes could have a negative impact on the homogeneity for some or even all target
elements. Therefore it was decided to investigate the material homogeneity measuring non–
filtered as well as filtered samples (see Section 6). The evaluation of the homogeneity data
showed that the possible presence of flakes in the water did not lead to any undesirable
effect. Nevertheless, it was decided later on to remove all ampoules with visible flakes from
the batch available for distribution.
5.3 Sterilisation
The water in the closed ampoules of candidate certified reference material ERM-CA615 was
sterilised by γ-irradiation with a 60
Co source, minimum dose 25 kGy. The irradiation caused
the expected change in colour of the transparent borosilicate glass to amber. After this step,
the ampoules were stored at 18 ºC in the dark.
6. Homogeneity
With the aim of checking the homogeneity of the material with regard to the parameters to be
certified and because of the presence of flakes in a small fraction of the ampoules of the
batch produced, 20 units (10 of which containing visible particles) were selected, taking care
that the complete batch was covered. The samples were analysed in duplicate, filtered and
unfiltered, for arsenic, cadmium, iron, lead, manganese, mercury and nickel. This was done
to compare the results obtained with and without filtration, to find out any possible significant
difference. The measurements were performed under repeatability conditions, i.e. during one
analytical run and using validated methods and according to a random sequence to permit
distinction between possible trends in the analytical sequence and in the filling order. Quality
10
control (QC) samples and blank samples were analysed within the sequence. All
measurements were performed by ICP-SFMS.
The average of the results after the filtration step and the average of the results without
filtration were compared by mean of a t-test for significant difference, with tα,df being the
critical t-value (two-tailed) for a significance level α = 0.05 (95 % confidence interval). For Fe,
As, Cd, Mn and Pb, the two means were not found to be significantly different and therefore it
was decided to pool all results for the assessment of homogeneity. In the case of Ni and Hg,
however, the two averages were found to be significantly different from each other. For these
two elements, the datasets of unfiltered samples were chosen to be used for the evaluation
of homogeneity because further contributions to the final uncertainty (from long-term stability
and characterisation) will also be estimated on the samples analysed without filtration.
The 80 results of Fe, As, Cd, Mn and Pb and the 40 results of Ni and Hg were evaluated by
one-way analysis of variance (ANOVA). The unimodal distribution of data is an important
prerequisite in order to apply the statistical evaluation ANOVA, therefore the distributions of
sample averages as well as individual results were checked both for normal distribution
employing normal probability plots and for unimodality with histograms. For all analytes, the
individual results and ampoule averages followed an approximately normal and unimodal
distribution, with the exception of the ampoule averages for cadmium and the individual
values for mercury, for which a slightly bimodal distribution could be discerned. This minor
deviation from unimodality was judged not to grossly affect the estimate of the between-units
standard deviation.
Data were also checked for presence of trends and outliers.
For nickel a trend towards lower values was observed in the filling sequence, both at 95 and
99 % confidence level.
One outlying individual result was found for arsenic (Grubbs single test at α = 0.05 and 0.01)
and for iron (Grubbs single test at α = 0.05). Two outlying individual results were found for
manganese (Grubbs double test at α = 0.05).
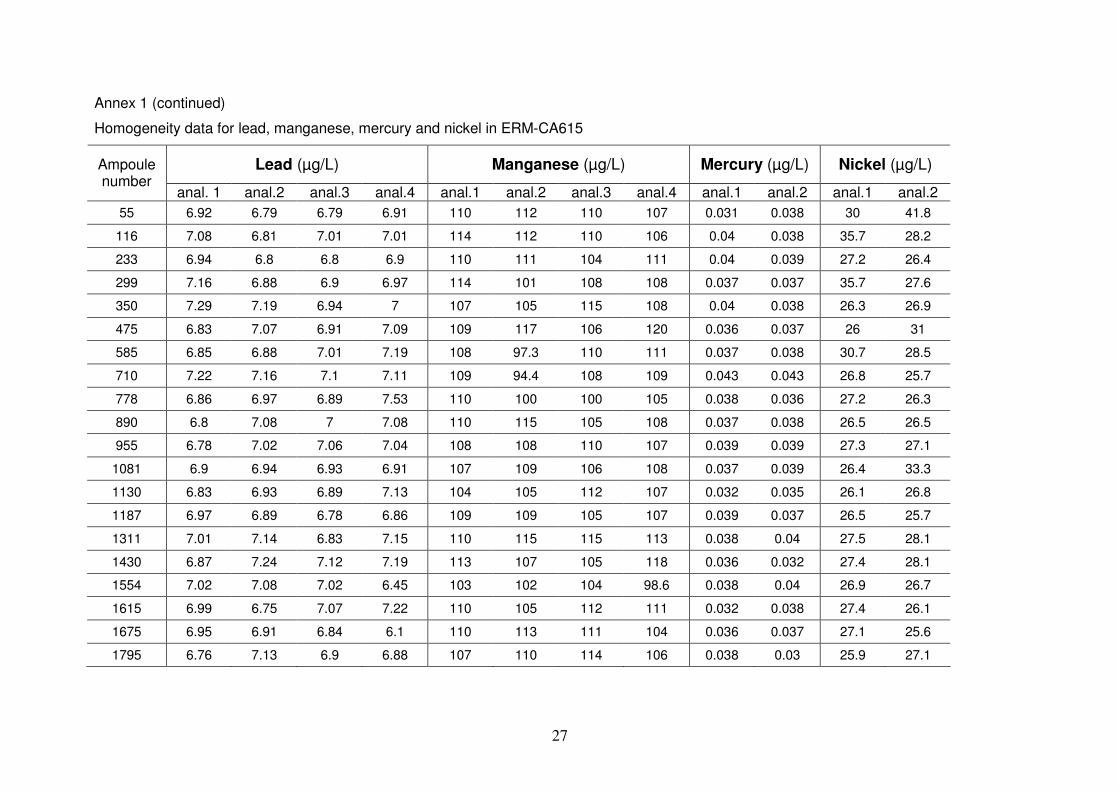
One outlying sample average was found for lead (unit 1675) and one for nickel (unit 55), (for
both Grubbs single test at α = 0.05 and 0.01, see Annex 1) both caused by a single outlying
measurement. This might be equally due to a measurement problem or to a heterogeneity
issue.
Since no technical reasons were identified for the outlying results, all data were retained for
statistical analysis.
In the case of presence of trends and of outlier averages, however, the evaluation by
ANOVA could be not the most appropriate and therefore an alternative approach for the
estimation of the heterogeneity was followed, see Equations (4) and (5) below.
11
The ANOVA allowed the calculation of the within- (swb) and between-unit homogeneity (sbb),
estimated as standard deviations, according to the following equations:
withinMS=wbs Equation (1)
MSwithin = mean squares within-bottle
swb is equivalent to the s of the method, provided that subsamples are representative for the
whole bottle.
n
MSMS withinbetween −=bbs Equation (2)
MSbetween = mean squares between-bottle n = number of replicates per bottle
When MSbetween is smaller than MSwithin, sbb can not be calculated. Instead, u*bb, the
heterogeneity that can be hidden by the method repeatability, is calculated, according to the
following expression [11]:
4* 2
MSwithin
wbbb
n
su
ν= Equation (3)
νMSwithin = degrees of freedom of MSwithin
For lead and nickel, for which an outlying bottle mean was detected (see above), an
alternative estimate of heterogeneity was calculated. Between-bottle heterogeneity was
modelled as rectangular distribution limited by the outlying average. The standard uncertainty
using this outlier (urect) was then estimated as
3
y -outlier largest =rectu Equation (4)
y = average of all results
For nickel, for which a trend in the filling sequence was detected as well, the between-bottle
heterogeneity was modelled using the half-width of a rectangular distribution between the
highest and lowest bottle average:
12
32
resultlowest -result highest
⋅=rectu Equation (5)
The very high ubb estimated for nickel (16.0 % and 16.7 %, with Equations 4 and 5,
respectively) raised concerns about the validity of these results. The presence of very high
values in the data (e.g. measurements of 41.8 and 35.7 µg/L, see Annex 1) was further not
observed either in the stability datasets (both short-term and long-term) or in the
characterisation exercise.
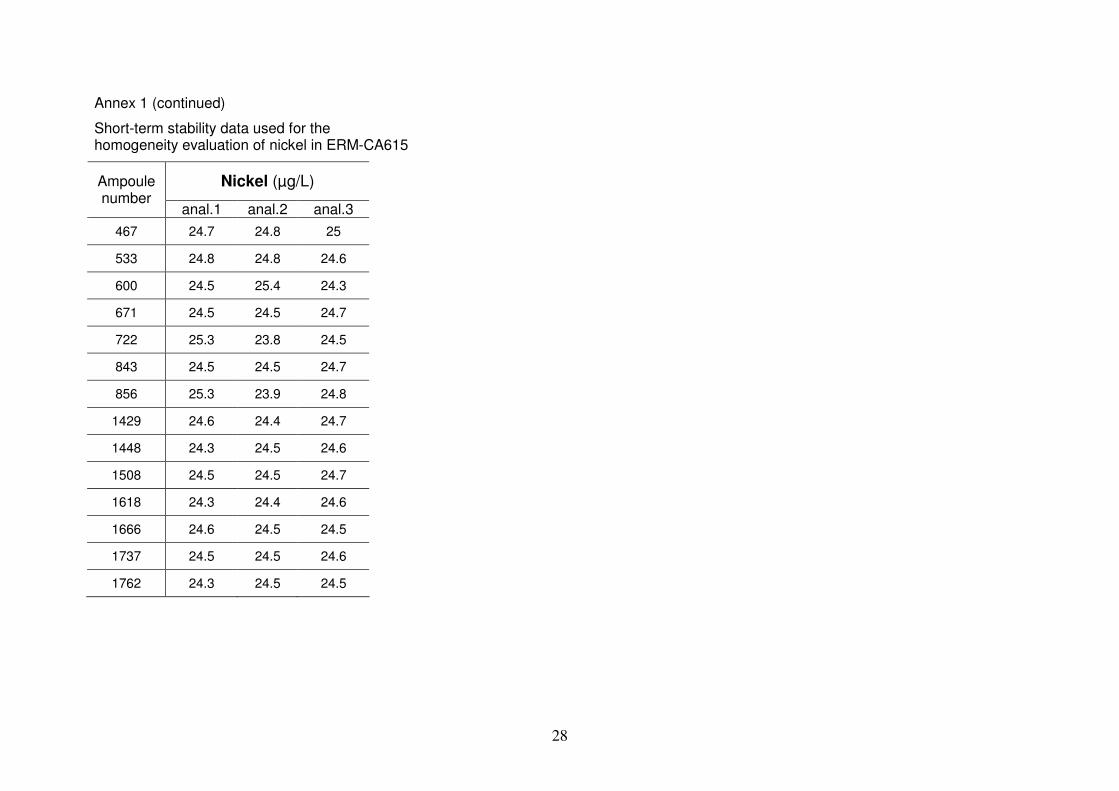
For this reason it was decided to re-evaluate the homogeneity for nickel using the short-term
stability data (a total of 42 results corresponding to 14 samples, analysed in triplicate, see
Section 8.1). These data showed a trend both in the analytical and in the filling sequence
towards lower values. Results were corrected for their trend in the analytical sequence as
shown below:
corrected result = measured result − ( )ib⋅ Equation (6)
b = slope of the linear regression i = position of the result in the analytical sequence
After correction for the trend in the analytical sequence still a trend in the filling sequence
remained, therefore between-bottle heterogeneity was finally estimated using Equation (5)
applied to the short-term stability data.
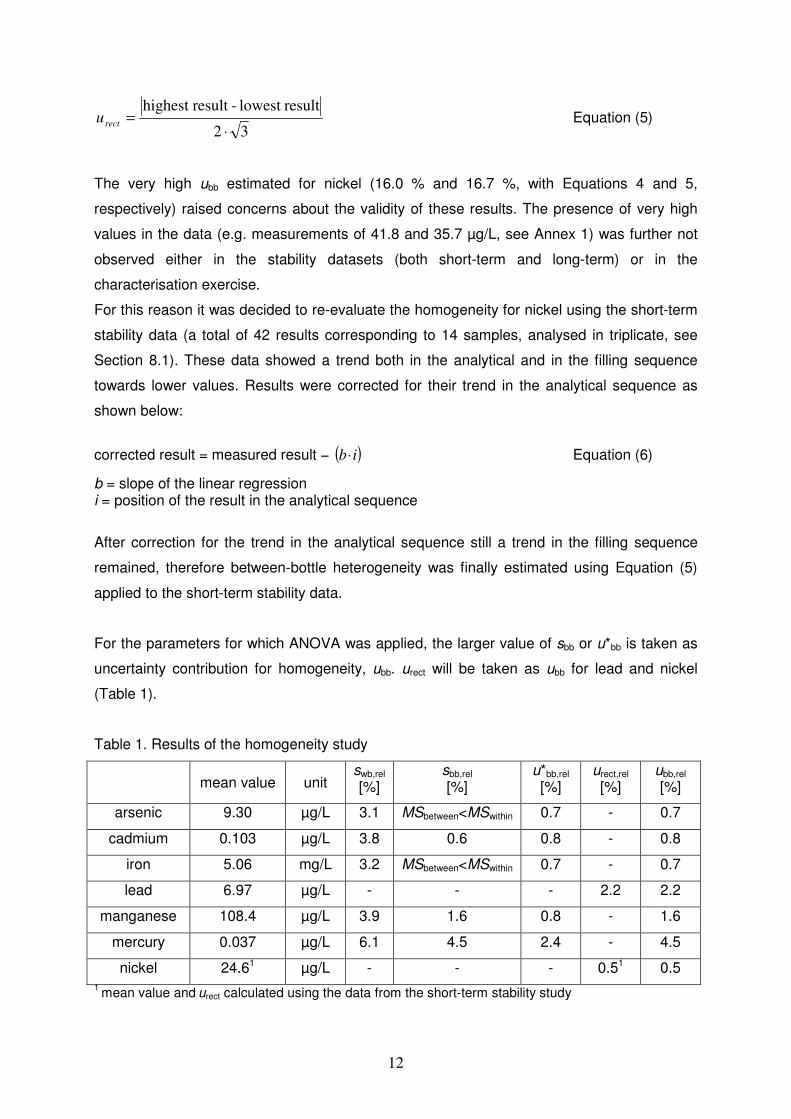
For the parameters for which ANOVA was applied, the larger value of sbb or u*bb is taken as
uncertainty contribution for homogeneity, ubb. urect will be taken as ubb for lead and nickel
(Table 1).
Table 1. Results of the homogeneity study
mean value unit swb,rel
[%] sbb,rel
[%] u*bb,rel
[%] urect,rel [%]
ubb,rel [%]
arsenic 9.30 µg/L 3.1 MSbetween<MSwithin 0.7 - 0.7
cadmium 0.103 µg/L 3.8 0.6 0.8 - 0.8
iron 5.06 mg/L 3.2 MSbetween<MSwithin 0.7 - 0.7
lead 6.97 µg/L - - - 2.2 2.2
manganese 108.4 µg/L 3.9 1.6 0.8 - 1.6
mercury 0.037 µg/L 6.1 4.5 2.4 - 4.5
nickel 24.61 µg/L - - - 0.51 0.5
1 mean value and
urect calculated using the data from the short-term stability study
13
The relatively large spread observed for mercury, giving ubb of 4.5 %, was nevertheless
judged to be an acceptable contribution to the final uncertainty budget of the certified value.
The occurrence of MSbetween< MSwithin (for two analytes) could be an indication that material
heterogeneity is smaller than it can be detected by the analytical methodology used. Even
with retention of outliers, the between-unit variation is generally low (maximum around 2 %),
with the mentioned exception of mercury. All data used for the evaluation of homogeneity
can be found in Annex 1.
7. Minimum sample intake
The establishment of the minimum sample intake, i.e. the minimum subsample
representative of the whole ampoule, was not specifically addressed due to the nature of the
material itself (water). Even the heterogeneity of solutions is known to be very small if not
negligible.
Nevertheless, minimum sample intake is defined as the smallest amount of sample for which
homogeneity has been demonstrated through the obtainment of a technically valid set of
results accepted for the characterisation. These amounts are the following: 20 µL for Ni, Mn,
Pb, Cd and As, 50 µL for Fe and 6 mL for Hg.
8. Stability studies
8.1 Set-up of stability studies
Stability studies are conducted to establish both dispatch conditions (short-term stability) as
well as storage conditions (long-term stability).
The two principal means of stabilisation of the water for long-term perspective were the
creation of an inert atmosphere by flushing argon within the ampoule just before flame
sealing and the sterilisation by exposing the ampoules to an autoclaving process (see
Section 5.3).
For performing the stability studies according to the planned tested temperatures and time
points, 28 ampoules were required for the short-term stability (14 for Hg measurements and
14 for the remaining parameters) and 16 ampoules were required for the long-term stability
schemes, selected by random stratified sampling from the entire batch produced. For the
stability studies, it was decided not to ask for measurements of filtered samples with the
intention to establish certified values valid for the water analysed without any filtration step.
This is also specified in the "Instructions for use and intended use" section of the certificate.
The measurements were performed by ICP-QMS for arsenic, cadmium, lead and nickel, by
ICP-OES for iron and manganese and by CV-AFS for mercury, using standardised and in-
14
house validated methods. The set-up of the studies followed an isochronous scheme [12] as
described below:
- Short-term stability
Two ampoules were kept at +18 °C and +60 °C for 1, 2 and 4 weeks, respectively. After
these time periods, they were put at +4 °C, the temperature at which two "reference"
ampoules were stored. Three analyses per ampoule (non-filtered) were performed under
repeatability conditions i.e., all analyses were included in the same analytical run according
to a prescribed random sequence.
- Long-term stability
Two ampoules were kept at +18 °C for 4, 8, and 12 months, respectively (1st scheme) and for
8, 16 and 24 months, respectively (2nd scheme). The reference temperature was also +4 °C.
Three independent measurements per ampoule (non-filtered) were performed under
repeatability conditions.
8.2 Results of stability studies
The results were first grouped and evaluated for each time point and temperature.
Results were screened for single and double outliers by applying the Grubbs test at
confidence levels of 95 % and 99 %, respectively. Data were plotted against time and the
regression lines were calculated to check for significant trends possibly indicating
degradation of the material. The observed slopes were tested for significance using a t-test,
with tα,df being the critical t-value (two-tailed) for a significance level α = 0.05 (95 %
confidence interval).
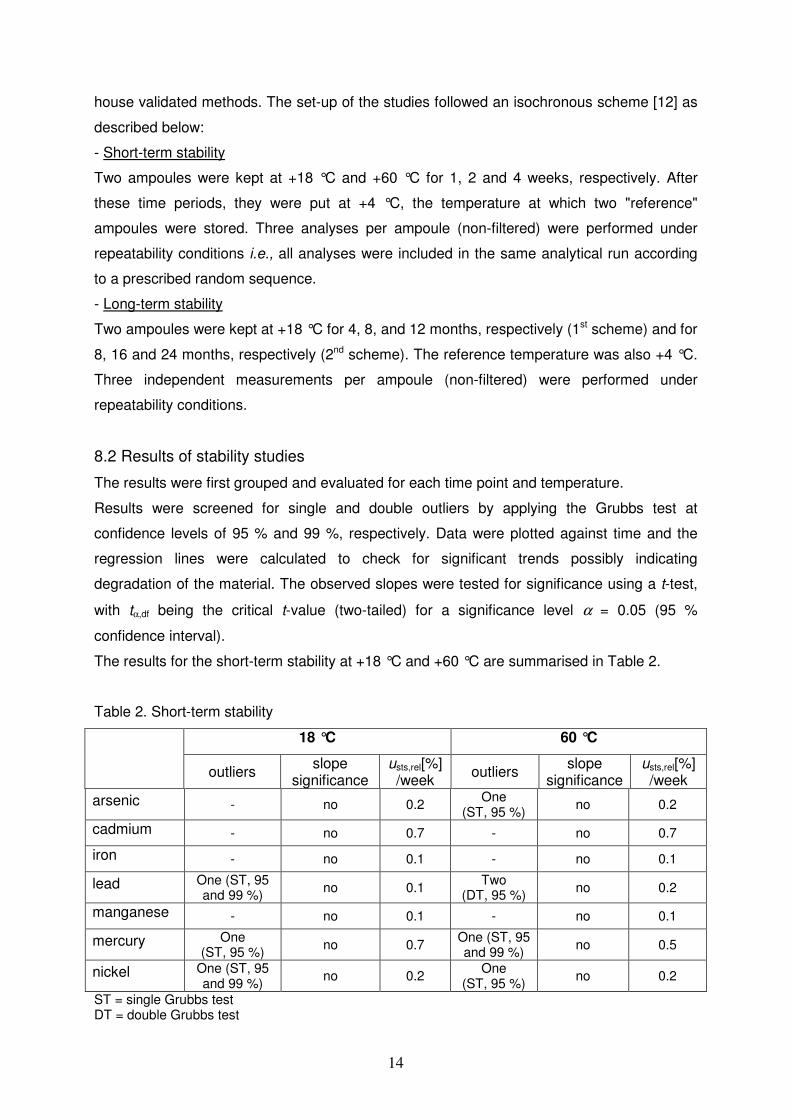
The results for the short-term stability at +18 °C and +60 °C are summarised in Table 2.
Table 2. Short-term stability
18 °C 60 °C
outliers slope
significance usts,rel[%] /week
outliers slope
significance usts,rel[%] /week
arsenic - no 0.2 One
(ST, 95 %) no 0.2
cadmium - no 0.7 - no 0.7
iron - no 0.1 - no 0.1
lead One (ST, 95 and 99 %)
no 0.1 Two
(DT, 95 %) no 0.2
manganese - no 0.1 - no 0.1
mercury One (ST, 95 %)
no 0.7 One (ST, 95 and 99 %)
no 0.5
nickel One (ST, 95 and 99 %)
no 0.2 One
(ST, 95 %) no 0.2
ST = single Grubbs test DT = double Grubbs test
15
Outliers were detected at 18 °C and/or at 60 °C for lead, mercury and nickel while for arsenic
only one outlying value was found at 60 °C. These were all individual results. No technical
reason for exclusion of the outliers could be found, therefore they were retained leading to a
conservative estimate of the short-term stability uncertainty. The resulting uncertainty
contributions for short-term stability were calculated according to Linsinger et al. [13] and
were negligible for all analytes (maximum 0.7 % for one week at 60 °C). Because the
potential degradation during transport can be considered negligible if compared to the
uncertainty of the final certified value, the uncertainty contribution from the short-term stability
will not be considered in the final uncertainty budget.
Since no significant slope was observed for any of the elements in the tested conditions, the
transport of the material will occur under normal conditions.
The results of the two long-term stability studies at +18 °C (1st scheme lasting 12 months and
2nd scheme lasting 24 months) were combined and evaluated together to obtain more
confidence about the assessment of the stability. Since the two datasets (1st scheme and 2nd
scheme) were obtained at different points in time, a correction had to be applied. For all
parameters, the correction factor was between 1.00 and 1.07. The results are summarised in
Table 3 (graphical depictions of the data can be found in Annex 2). The outliers (single
values) detected for arsenic, iron, manganese and mercury were kept for the statistical
evaluation, in absence of any technical reason justifying their rejection. A tentative removal of
these outliers did not result in a significant trend of the data, which means that the estimate
of ults is conservative.
The uncertainty of stability ults due to storage at 18 °C is estimated for a shelf-life of 2 years
and calculated as uncertainty of the slope of the regression line multiplied with the chosen
shelf life [13]:
( )sl
i
lts t
xx
su ⋅
−=
∑2
Equation (7)
with s being the standard deviation of all 48 individual results of the stability studies, xi being
the time point for each replicate, x being the average of all time points and tsl being the pre-
defined shelf life (24 months).
For all analytes, the standard uncertainty introduced by the long-term stability at +18 °C
(recommended storage temperature of the material) for 2 years is low, between 0.2 and 1.6
%.
16
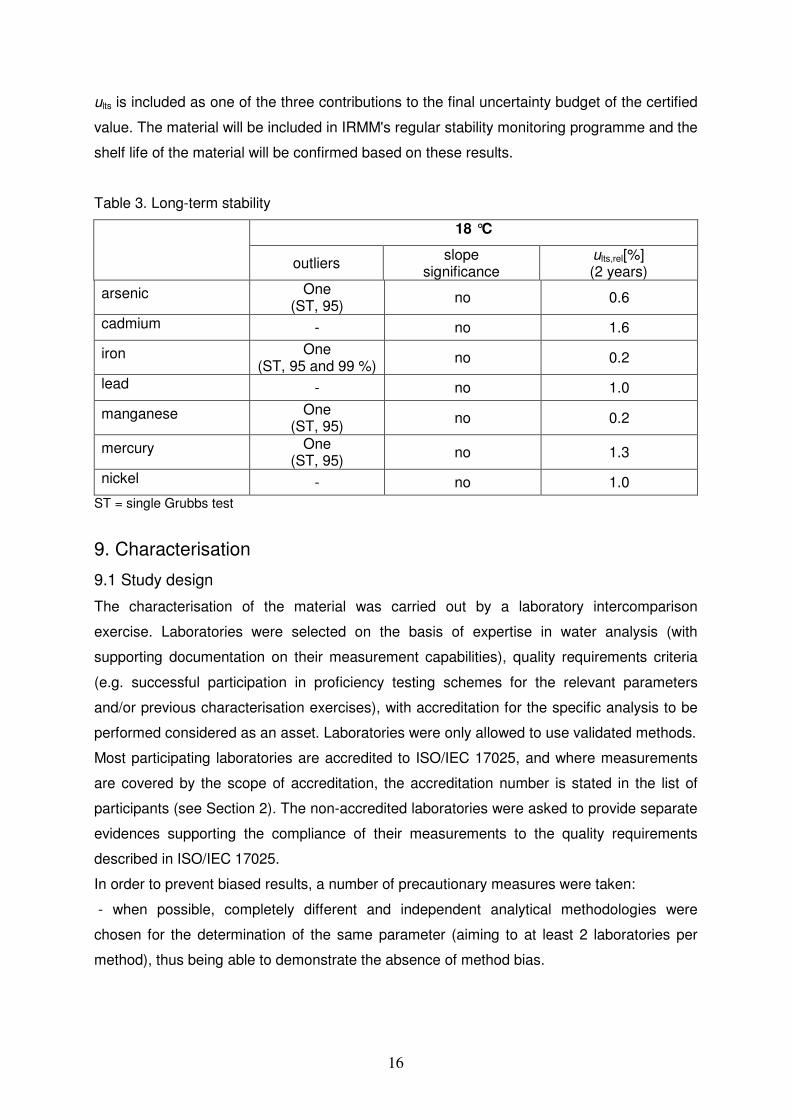
ults is included as one of the three contributions to the final uncertainty budget of the certified
value. The material will be included in IRMM's regular stability monitoring programme and the
shelf life of the material will be confirmed based on these results.
Table 3. Long-term stability
18 °C
outliers slope
significance ults,rel[%] (2 years)
arsenic One (ST, 95)
no 0.6
cadmium - no 1.6
iron One (ST, 95 and 99 %)
no 0.2
lead - no 1.0
manganese One (ST, 95)
no 0.2
mercury One (ST, 95)
no 1.3
nickel - no 1.0
ST = single Grubbs test
9. Characterisation
9.1 Study design
The characterisation of the material was carried out by a laboratory intercomparison
exercise. Laboratories were selected on the basis of expertise in water analysis (with
supporting documentation on their measurement capabilities), quality requirements criteria
(e.g. successful participation in proficiency testing schemes for the relevant parameters
and/or previous characterisation exercises), with accreditation for the specific analysis to be
performed considered as an asset. Laboratories were only allowed to use validated methods.
Most participating laboratories are accredited to ISO/IEC 17025, and where measurements
are covered by the scope of accreditation, the accreditation number is stated in the list of
participants (see Section 2). The non-accredited laboratories were asked to provide separate
evidences supporting the compliance of their measurements to the quality requirements
described in ISO/IEC 17025.
In order to prevent biased results, a number of precautionary measures were taken:
- when possible, completely different and independent analytical methodologies were
chosen for the determination of the same parameter (aiming to at least 2 laboratories per
method), thus being able to demonstrate the absence of method bias.
17
- six independent measurements per laboratory were required, meaning that a new sample
preparation had to be performed for each measurement. These measurements were
prescribed to be spread over two days, to ensure within-laboratory reproducibility conditions.
- to further demonstrate the accuracy and traceability of their data, laboratories were asked
to report results of QC samples analysed together with the characterisation samples and
were asked to insert blanks in the measuring sequence.
- samples for the characterisation study covered the whole batch produced and were
selected using a random stratified sampling scheme.
The two quality control samples received by the laboratories were the certified reference
materials BCR-610 (re-labelled as QC1, certified for the mass fraction of As, Cd and Pb) and
ORMS-4, National Research of Canada (re-labelled as QC2, certified for mass fraction of
Hg).
Laboratories were also asked to provide an estimate of their measurement uncertainty and to
describe the approach used to derive the uncertainty budget.
Laboratories received two or three (one additional unit was dispatched to the laboratories
analysing mercury) ampoules of candidate certified reference material ERM-CA615: six
independent results per each parameter were to be returned. Additionally they received one
or two (laboratories analysing mercury) quality control materials, as explained before, for
which three replicates were to be provided.
In the guidelines for characterisation measurements, an approximate concentration range for
the parameters to be analysed was provided for helping the laboratories in establishing the
correct calibration curve.
9.2 Data evaluation and results
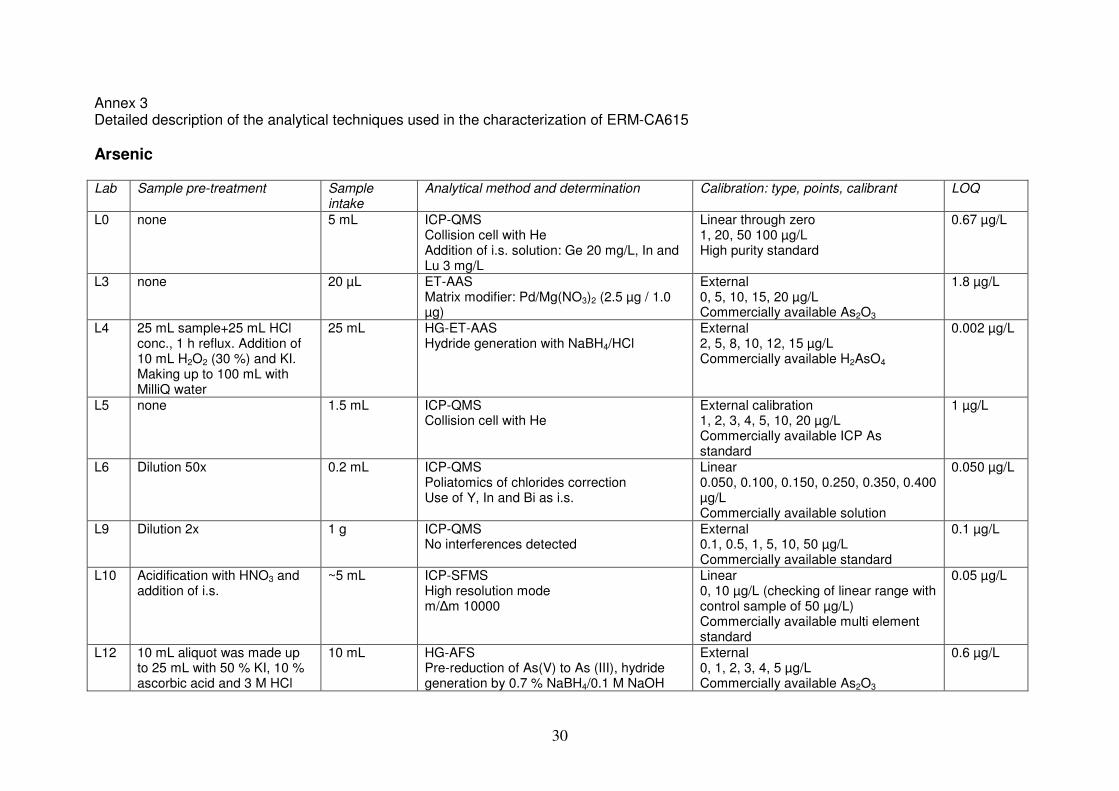
A detailed overview of the analytical techniques used by the laboratories for the
characterisation of ERM-CA615 is presented in Annex 3, listed per parameter.
Evidences of non-compliance regarding contract review and method validation for one of the
laboratories (tags L3 and L12) was obtained between commissioning and receipt of results.
Therefore, the results of this laboratory were excluded on quality management grounds
regardless of their compliance or non-compliance with the criteria applied in the technical
evaluation (see below).
Upon receipt of the datasets, the results were subject to technical evaluation. The results of
the QC samples could be directly used to check for presence of significant bias.
Datasets were rejected whenever the laboratory reported a technical problem, when one or
both quality control samples results did not agree with the certified values (according to ERM
Application Note 1 [15]) and/or the RSD of the measurement results reported for ERM-
CA615 exceeded 12 % (quality criterion set considering the required trueness asked in the
18
technical specifications of the characterisation study and the repeatability claimed by the
laboratories). A summary of the data evaluation is presented in Table 4.
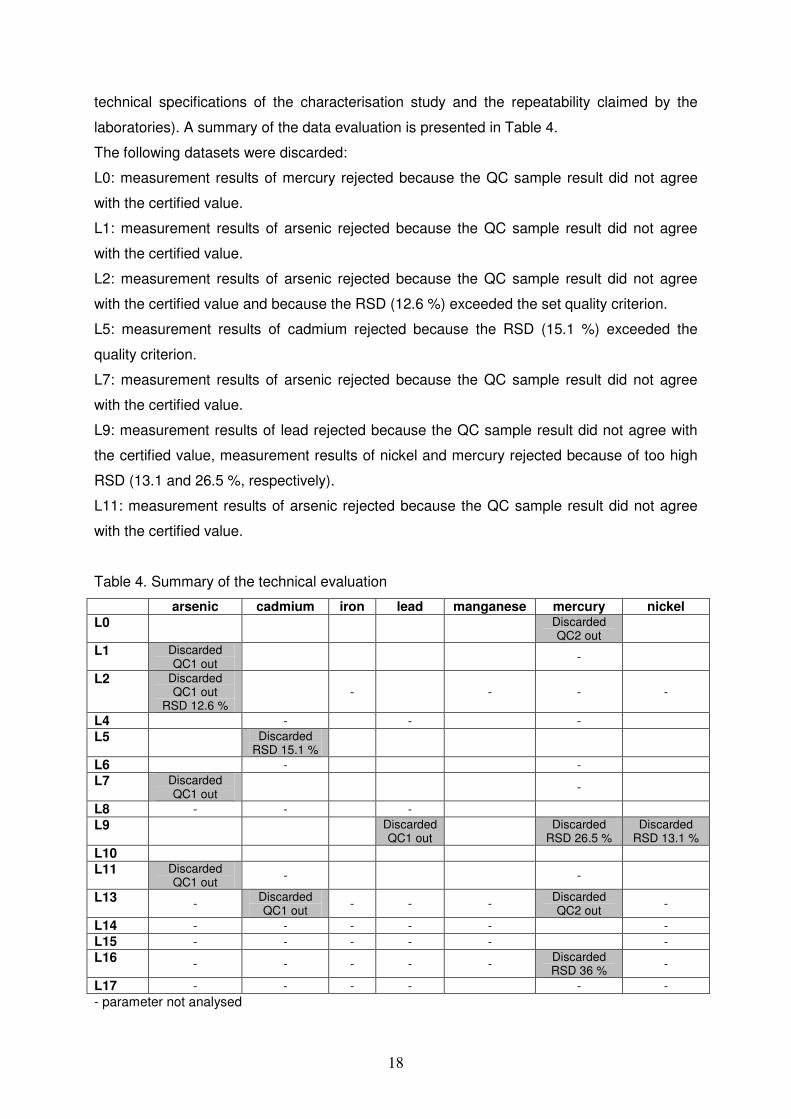
The following datasets were discarded:
L0: measurement results of mercury rejected because the QC sample result did not agree
with the certified value.
L1: measurement results of arsenic rejected because the QC sample result did not agree
with the certified value.
L2: measurement results of arsenic rejected because the QC sample result did not agree
with the certified value and because the RSD (12.6 %) exceeded the set quality criterion.
L5: measurement results of cadmium rejected because the RSD (15.1 %) exceeded the
quality criterion.
L7: measurement results of arsenic rejected because the QC sample result did not agree
with the certified value.
L9: measurement results of lead rejected because the QC sample result did not agree with
the certified value, measurement results of nickel and mercury rejected because of too high
RSD (13.1 and 26.5 %, respectively).
L11: measurement results of arsenic rejected because the QC sample result did not agree
with the certified value.
Table 4. Summary of the technical evaluation
arsenic cadmium iron lead manganese mercury nickel
L0
Discarded QC2 out
L1 Discarded QC1 out
-
L2 Discarded QC1 out
RSD 12.6 % - - - -
L4 - - -
L5
Discarded RSD 15.1 %
L6 - -
L7 Discarded QC1 out
-
L8 - - -
L9
Discarded QC1 out
Discarded
RSD 26.5 % Discarded
RSD 13.1 %
L10
L11 Discarded QC1 out
- -
L13 -
Discarded QC1 out
- - - Discarded QC2 out
-
L14 - - - - - -
L15 - - - - - -
L16 - - - - -
Discarded RSD 36 %
-
L17 - - - - - -
- parameter not analysed
19
L13: measurement results of mercury and cadmium rejected because the QC sample results
did not agree with the certified value.
L16: measurement results of mercury rejected because of too high RSD (36 %).
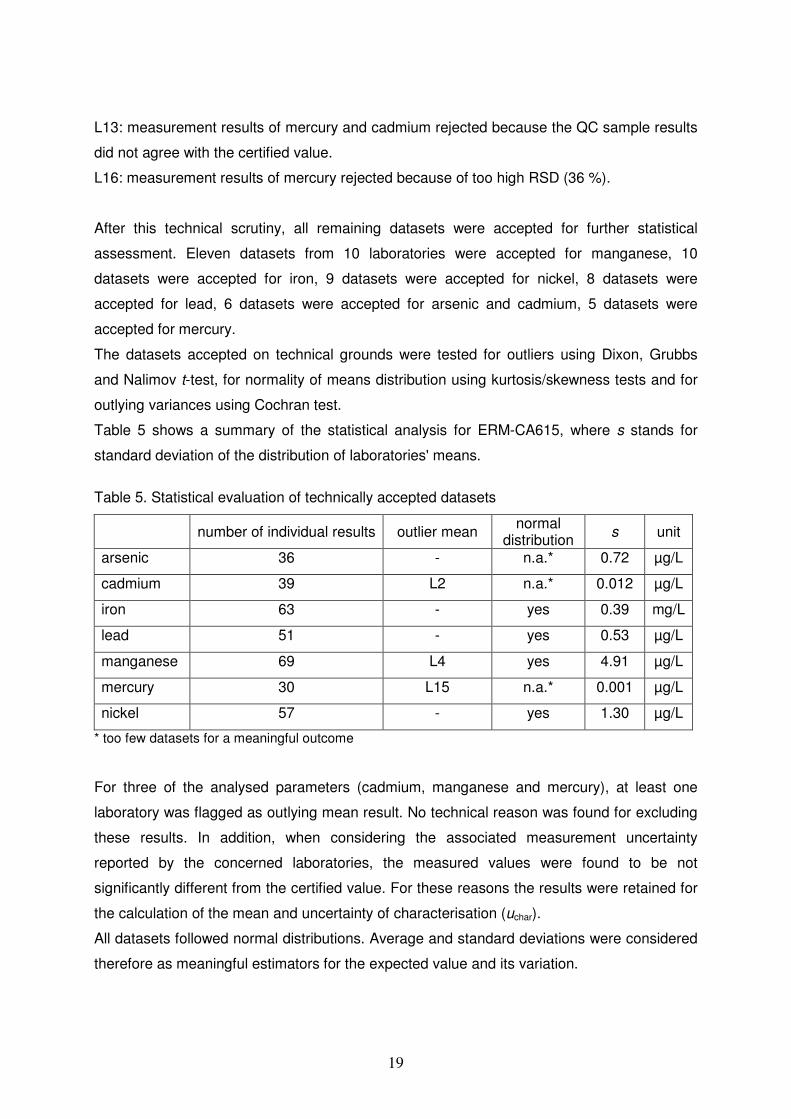
After this technical scrutiny, all remaining datasets were accepted for further statistical
assessment. Eleven datasets from 10 laboratories were accepted for manganese, 10
datasets were accepted for iron, 9 datasets were accepted for nickel, 8 datasets were
accepted for lead, 6 datasets were accepted for arsenic and cadmium, 5 datasets were
accepted for mercury.
The datasets accepted on technical grounds were tested for outliers using Dixon, Grubbs
and Nalimov t-test, for normality of means distribution using kurtosis/skewness tests and for
outlying variances using Cochran test.
Table 5 shows a summary of the statistical analysis for ERM-CA615, where s stands for
standard deviation of the distribution of laboratories' means.
Table 5. Statistical evaluation of technically accepted datasets
number of individual results outlier mean normal
distribution s unit
arsenic 36 - n.a.* 0.72 µg/L
cadmium 39 L2 n.a.* 0.012 µg/L
iron 63 - yes 0.39 mg/L
lead 51 - yes 0.53 µg/L
manganese 69 L4 yes 4.91 µg/L
mercury 30 L15 n.a.* 0.001 µg/L
nickel 57 - yes 1.30 µg/L
* too few datasets for a meaningful outcome
For three of the analysed parameters (cadmium, manganese and mercury), at least one
laboratory was flagged as outlying mean result. No technical reason was found for excluding
these results. In addition, when considering the associated measurement uncertainty
reported by the concerned laboratories, the measured values were found to be not
significantly different from the certified value. For these reasons the results were retained for
the calculation of the mean and uncertainty of characterisation (uchar).
All datasets followed normal distributions. Average and standard deviations were considered
therefore as meaningful estimators for the expected value and its variation.
20
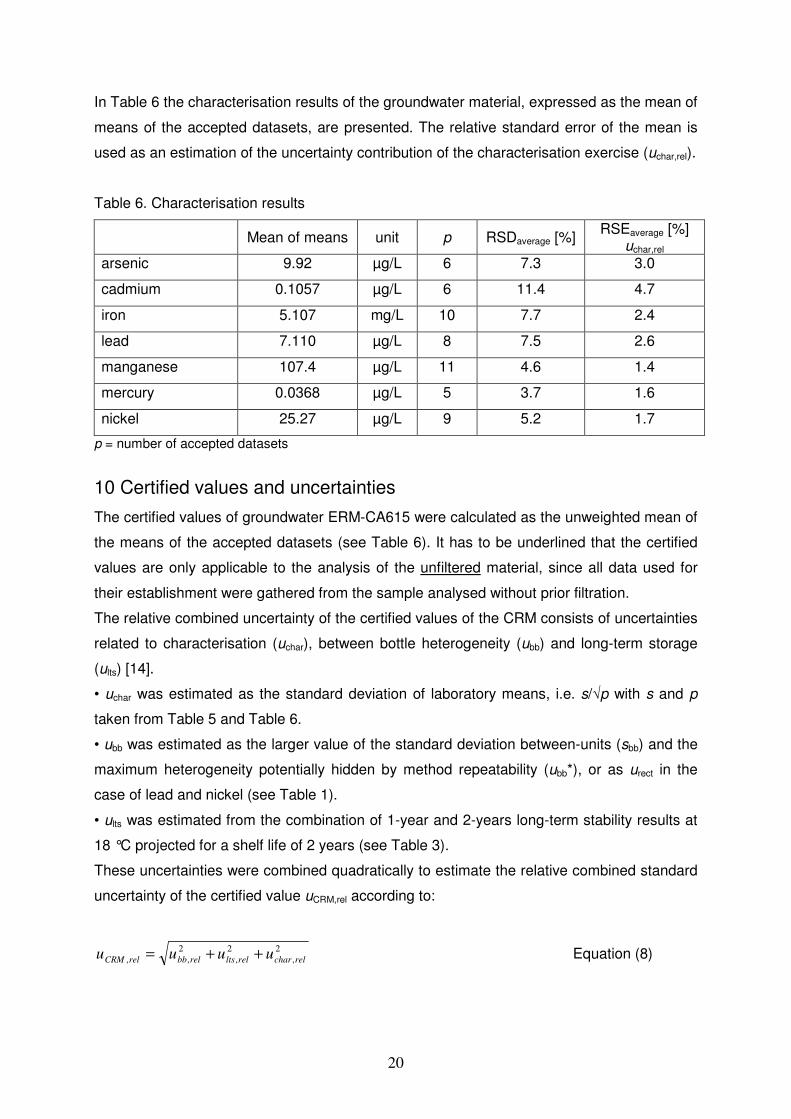
In Table 6 the characterisation results of the groundwater material, expressed as the mean of
means of the accepted datasets, are presented. The relative standard error of the mean is
used as an estimation of the uncertainty contribution of the characterisation exercise (uchar,rel).
Table 6. Characterisation results
Mean of means unit p RSDaverage [%] RSEaverage [%]
uchar,rel arsenic 9.92 µg/L 6 7.3 3.0
cadmium 0.1057 µg/L 6 11.4 4.7
iron 5.107 mg/L 10 7.7 2.4
lead 7.110 µg/L 8 7.5 2.6
manganese 107.4 µg/L 11 4.6 1.4
mercury 0.0368 µg/L 5 3.7 1.6
nickel 25.27 µg/L 9 5.2 1.7
p = number of accepted datasets
10 Certified values and uncertainties
The certified values of groundwater ERM-CA615 were calculated as the unweighted mean of
the means of the accepted datasets (see Table 6). It has to be underlined that the certified
values are only applicable to the analysis of the unfiltered material, since all data used for
their establishment were gathered from the sample analysed without prior filtration.
The relative combined uncertainty of the certified values of the CRM consists of uncertainties
related to characterisation (uchar), between bottle heterogeneity (ubb) and long-term storage
(ults) [14].
• uchar was estimated as the standard deviation of laboratory means, i.e. s/√p with s and p
taken from Table 5 and Table 6.
• ubb was estimated as the larger value of the standard deviation between-units (sbb) and the
maximum heterogeneity potentially hidden by method repeatability (ubb*), or as urect in the
case of lead and nickel (see Table 1).
• ults was estimated from the combination of 1-year and 2-years long-term stability results at
18 °C projected for a shelf life of 2 years (see Table 3).
These uncertainties were combined quadratically to estimate the relative combined standard
uncertainty of the certified value uCRM,rel according to:
2
,
2
,
2
,, relcharrelltsrelbbrelCRM uuuu ++= Equation (8)
21
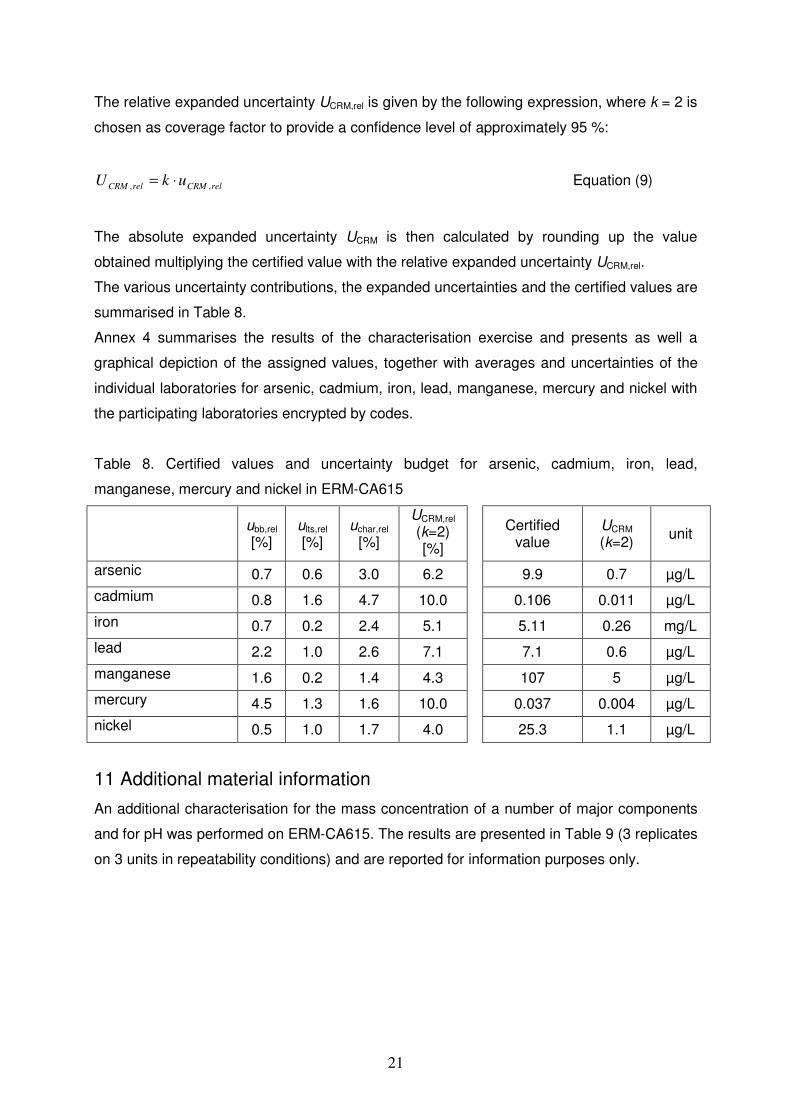
The relative expanded uncertainty UCRM,rel is given by the following expression, where k = 2 is
chosen as coverage factor to provide a confidence level of approximately 95 %:
relCRMrelCRM ukU ,, ⋅= Equation (9)
The absolute expanded uncertainty UCRM is then calculated by rounding up the value
obtained multiplying the certified value with the relative expanded uncertainty UCRM,rel.
The various uncertainty contributions, the expanded uncertainties and the certified values are
summarised in Table 8.
Annex 4 summarises the results of the characterisation exercise and presents as well a
graphical depiction of the assigned values, together with averages and uncertainties of the
individual laboratories for arsenic, cadmium, iron, lead, manganese, mercury and nickel with
the participating laboratories encrypted by codes.
Table 8. Certified values and uncertainty budget for arsenic, cadmium, iron, lead,
manganese, mercury and nickel in ERM-CA615
ubb,rel [%]
ults,rel [%]
uchar,rel [%]
UCRM,rel (k=2) [%]
Certified
value UCRM (k=2)
unit
arsenic 0.7 0.6 3.0 6.2 9.9 0.7 µg/L
cadmium 0.8 1.6 4.7 10.0 0.106 0.011 µg/L
iron 0.7 0.2 2.4 5.1 5.11 0.26 mg/L
lead 2.2 1.0 2.6 7.1 7.1 0.6 µg/L
manganese 1.6 0.2 1.4 4.3 107 5 µg/L
mercury 4.5 1.3 1.6 10.0 0.037 0.004 µg/L
nickel 0.5 1.0 1.7 4.0 25.3 1.1 µg/L
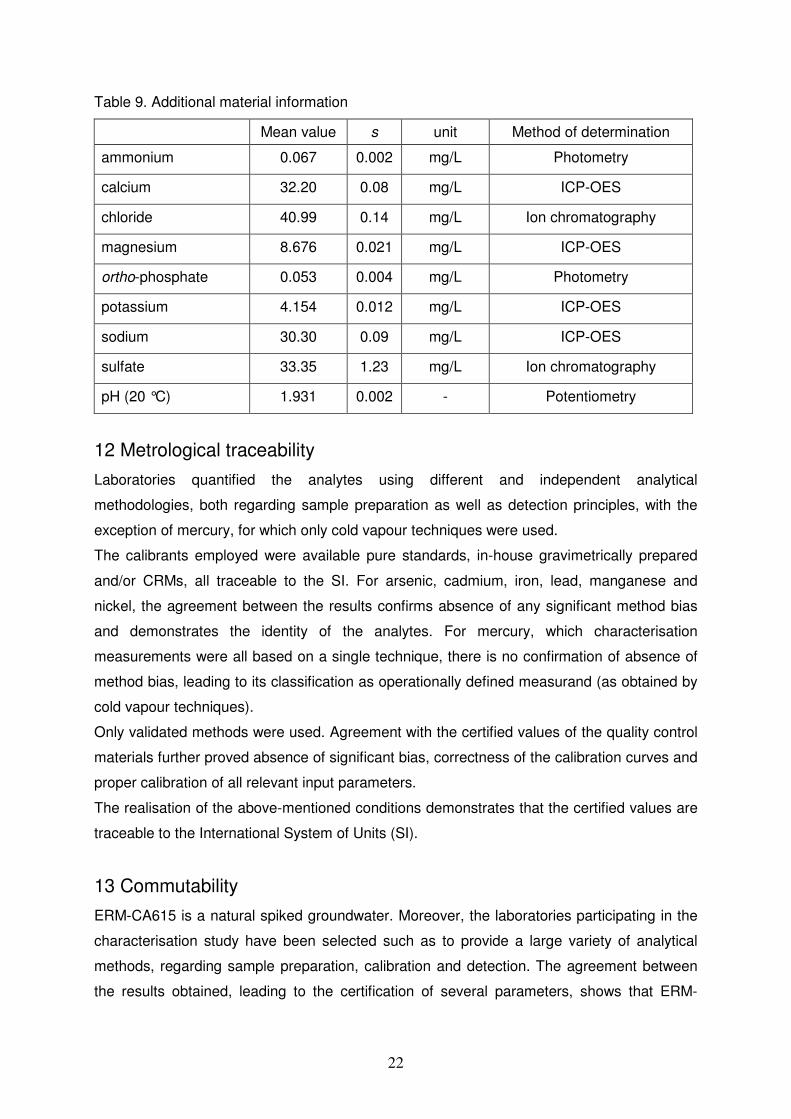
11 Additional material information
An additional characterisation for the mass concentration of a number of major components
and for pH was performed on ERM-CA615. The results are presented in Table 9 (3 replicates
on 3 units in repeatability conditions) and are reported for information purposes only.
22
Table 9. Additional material information
Mean value s unit Method of determination
ammonium 0.067 0.002 mg/L Photometry
calcium 32.20 0.08 mg/L ICP-OES
chloride 40.99 0.14 mg/L Ion chromatography
magnesium 8.676 0.021 mg/L ICP-OES
ortho-phosphate 0.053 0.004 mg/L Photometry
potassium 4.154 0.012 mg/L ICP-OES
sodium 30.30 0.09 mg/L ICP-OES
sulfate 33.35 1.23 mg/L Ion chromatography
pH (20 °C) 1.931 0.002 - Potentiometry
12 Metrological traceability
Laboratories quantified the analytes using different and independent analytical
methodologies, both regarding sample preparation as well as detection principles, with the
exception of mercury, for which only cold vapour techniques were used.
The calibrants employed were available pure standards, in-house gravimetrically prepared
and/or CRMs, all traceable to the SI. For arsenic, cadmium, iron, lead, manganese and
nickel, the agreement between the results confirms absence of any significant method bias
and demonstrates the identity of the analytes. For mercury, which characterisation
measurements were all based on a single technique, there is no confirmation of absence of
method bias, leading to its classification as operationally defined measurand (as obtained by
cold vapour techniques).
Only validated methods were used. Agreement with the certified values of the quality control
materials further proved absence of significant bias, correctness of the calibration curves and
proper calibration of all relevant input parameters.
The realisation of the above-mentioned conditions demonstrates that the certified values are
traceable to the International System of Units (SI).
13 Commutability
ERM-CA615 is a natural spiked groundwater. Moreover, the laboratories participating in the
characterisation study have been selected such as to provide a large variety of analytical
methods, regarding sample preparation, calibration and detection. The agreement between
the results obtained, leading to the certification of several parameters, shows that ERM-
23
CA615 exhibits the same behaviour as a typical laboratory sample and confirms its
commutability.
14 Instructions for use and intended use
14.1 Storage conditions
The material shall be stored at +18 °C ± 5 °C in the dark. However, the European
Commission cannot be held responsible for changes that happen during storage of the
material at the customer’s premises, especially of open samples.
14.2 Minimum sample intake
The minimum amount of sample to be used is 20 µL for Ni, Mn, Pb, Cd and As, 50 µL for Fe
and 6 mL for Hg.
14.3 Safety precautions
The usual laboratory safety measures apply.
14.4 Intended use
ERM-CA615 is intended for method validation and quality control purposes. The sample
must be used without applying any filtration step.
14.5 Use of the certified value
For assessing the trueness of an analytical method, the CRM is analysed by the laboratory
and the result is compared to the certified value as described in ERM Application Note 1 [15].
A result is unbiased if the combined uncertainty of measurement and certified value covers
the difference between the certified value and the measurement result:
• Calculate the absolute difference between the mean of the CRM measurement
results and the certified value (∆m).
• Convert the expanded uncertainty of the certified value UCRM into a standard
uncertainty (uCRM) by dividing UCRM with the coverage factor k = 2.
• Combine the standard uncertainty of the measurement result (um) with the uncertainty
of the certified value (uCRM) as follows:
22
CRMm uuu +=∆ Equation (10)
If ∆m < 2·u∆, there is no significant difference between the measurement result and the
certified value, at a confidence level of about 95 %.
24
References
[1] ISO Guide 34:2009, General requirements for the competence of reference materials
producers.
[2] ISO Guide 35:2006, Reference materials – General and statistical principles for
certification.
[3] ISO/IEC Guide 98-3:2008, Guide to the expression of uncertainty in measurement (GUM)
[4] European Commission, Directive 2000/60/EC of the European Parliament and of the
Council of 23 October 2000 establishing a framework for Community action in the field of
water policy, OJ Eur. Comm. L 327, 22.12.2000.
[5] European Commission, Decision No 2455/2001/EC of the European Parliament and of
the Council of 20 November 2001 establishing the list of priority substances in the field of
water policy and amending the Directive 2000/60/EC, OJ Eur. Comm. L331, 15.12.2001.
[6] European Commission, Directive 2008/105/EC of the European Parliament and of the
Council of 16 December 2008 on environmental quality standards in the field of water policy,
OJ Eur. Union L 348/84, 24.12.2008.
[7] European Commission, Directive 2006/118/EC of the European Parliament and of the
Council of 12 December 2006 on the protection of groundwater against pollution and
deterioration, OJ Eur. Union L 372/19, 27.12.2006.
[8] Council Directive 80/68/EEC of 17 December 1979 on the protection of groundwater
against pollution caused by certain dangerous substances amended by Council Directive
91/692/EEC (further amended by Council Regulation 1882/2003/EC), OJ L 20, 26.1.1980.
[9] P. Quevauviller, A TrAC journey into water-chemical metrology in the European Union,
Trends Anal. Chem. 26 (2007) 52 - 59.
[10] European Commission, Directive 2009/90/EC of the European Parliament and of the
Council of 31 July 2009 on technical specifications for chemical analysis and monitoring of
water status, OJ Eur. Union L 201/36, 1.8.2009.
[11] T. P. J. Linsinger, J. Pauwels, A. M. H. Van der Veen, H. Schimmel, A. Lamberty,
Homogeneity and stability of reference materials, Accred. Qual. Assur. 6 (2001) 20 - 25.
[12] A. Lamberty, H. Schimmel, J. Pauwels, The study of the stability of reference material by
isochronous measurements, Fresenius J Anal Chem 360 (1998) 359 – 361.
[13] T. P. J. Linsinger, J. Pauwels, A. Lamberty, H. Schimmel, A. M. H. van der Veen, L.
Siekmann, Estimating the uncertainty of stability for matrix CRMs, Fresenius J Anal Chem
370 (2001) 183 - 188.
[14] J. Pauwels, A. van der Veen, A. Lamberty, H. Schimmel, Evaluation of uncertainty of
reference materials, Accred. Qual. Assur. 5 (2000) 95-99.
25
[15]http://www.ermcrm.org/html/ERM_products/application_notes/application_note_1/applica
tion_note_1_english_en.pdf (22/03/2010).
Acknowledgments
The authors would like to thank Ralf Eppinger (Vlaamse Milieumaatschappij, BE) for
supporting the organisation of the sampling of groundwater, Andrea Bau', Albert Oostra, and
Paul de Vos for helping in the processing, Geert Van Britsom for the in-house ICP-MS
measurements, Giovani Kerckhove and Olivier Couteau for the EDX measurements,
Alessandra Moseriti, Anna Santoro and Robert Koeber for reviewing this report (all IRMM,
BE), Lars Jorhem (National Food Administration, SE), Thomas Prohaska (University of
Natural Resources and Life Sciences, AT) and Michel van Son (NL) as members of the
Certification Advisory Panel, for their constructive comments.
26
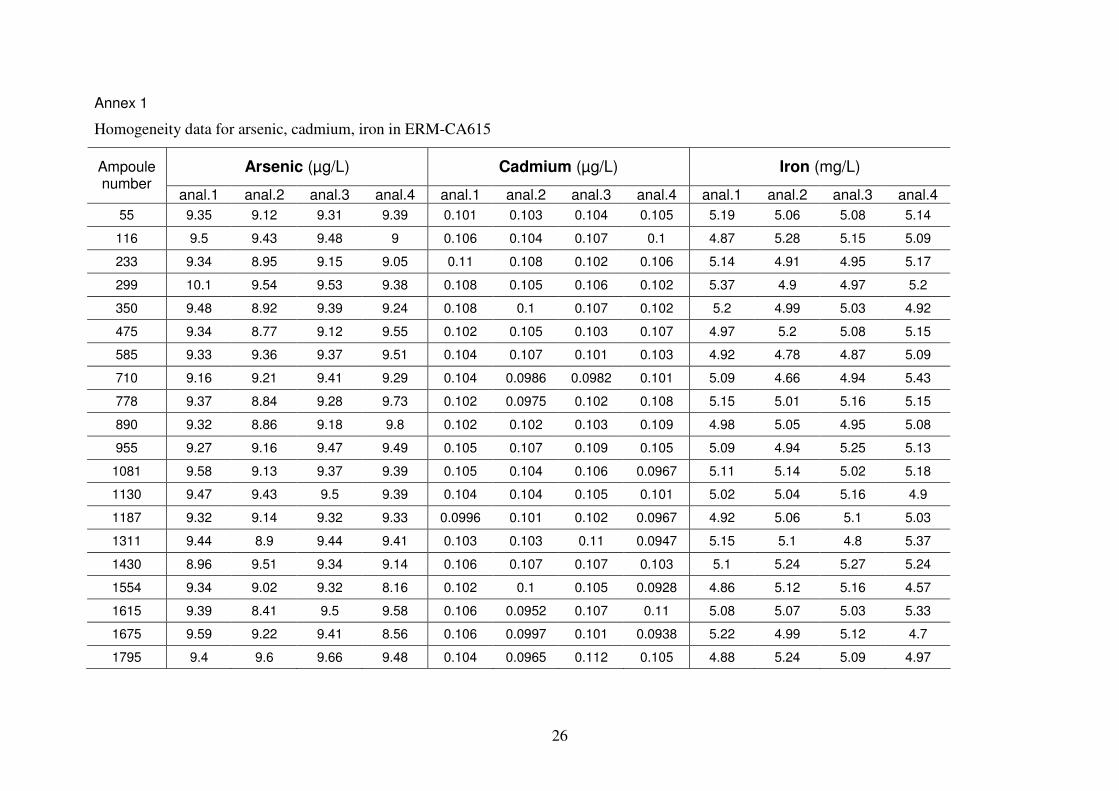
Annex 1
Homogeneity data for arsenic, cadmium, iron in ERM-CA615
Arsenic (µg/L) Cadmium (µg/L) Iron (mg/L) Ampoule number
anal.1 anal.2 anal.3 anal.4 anal.1 anal.2 anal.3 anal.4 anal.1 anal.2 anal.3 anal.4
55 9.35 9.12 9.31 9.39 0.101 0.103 0.104 0.105 5.19 5.06 5.08 5.14
116 9.5 9.43 9.48 9 0.106 0.104 0.107 0.1 4.87 5.28 5.15 5.09
233 9.34 8.95 9.15 9.05 0.11 0.108 0.102 0.106 5.14 4.91 4.95 5.17
299 10.1 9.54 9.53 9.38 0.108 0.105 0.106 0.102 5.37 4.9 4.97 5.2
350 9.48 8.92 9.39 9.24 0.108 0.1 0.107 0.102 5.2 4.99 5.03 4.92
475 9.34 8.77 9.12 9.55 0.102 0.105 0.103 0.107 4.97 5.2 5.08 5.15
585 9.33 9.36 9.37 9.51 0.104 0.107 0.101 0.103 4.92 4.78 4.87 5.09
710 9.16 9.21 9.41 9.29 0.104 0.0986 0.0982 0.101 5.09 4.66 4.94 5.43
778 9.37 8.84 9.28 9.73 0.102 0.0975 0.102 0.108 5.15 5.01 5.16 5.15
890 9.32 8.86 9.18 9.8 0.102 0.102 0.103 0.109 4.98 5.05 4.95 5.08
955 9.27 9.16 9.47 9.49 0.105 0.107 0.109 0.105 5.09 4.94 5.25 5.13
1081 9.58 9.13 9.37 9.39 0.105 0.104 0.106 0.0967 5.11 5.14 5.02 5.18
1130 9.47 9.43 9.5 9.39 0.104 0.104 0.105 0.101 5.02 5.04 5.16 4.9
1187 9.32 9.14 9.32 9.33 0.0996 0.101 0.102 0.0967 4.92 5.06 5.1 5.03
1311 9.44 8.9 9.44 9.41 0.103 0.103 0.11 0.0947 5.15 5.1 4.8 5.37
1430 8.96 9.51 9.34 9.14 0.106 0.107 0.107 0.103 5.1 5.24 5.27 5.24
1554 9.34 9.02 9.32 8.16 0.102 0.1 0.105 0.0928 4.86 5.12 5.16 4.57
1615 9.39 8.41 9.5 9.58 0.106 0.0952 0.107 0.11 5.08 5.07 5.03 5.33
1675 9.59 9.22 9.41 8.56 0.106 0.0997 0.101 0.0938 5.22 4.99 5.12 4.7
1795 9.4 9.6 9.66 9.48 0.104 0.0965 0.112 0.105 4.88 5.24 5.09 4.97
27
Annex 1 (continued)
Homogeneity data for lead, manganese, mercury and nickel in ERM-CA615
Lead (µg/L) Manganese (µg/L) Mercury (µg/L) Nickel (µg/L) Ampoule number
anal. 1 anal.2 anal.3 anal.4 anal.1 anal.2 anal.3 anal.4 anal.1 anal.2 anal.1 anal.2
55 6.92 6.79 6.79 6.91 110 112 110 107 0.031 0.038 30 41.8
116 7.08 6.81 7.01 7.01 114 112 110 106 0.04 0.038 35.7 28.2
233 6.94 6.8 6.8 6.9 110 111 104 111 0.04 0.039 27.2 26.4
299 7.16 6.88 6.9 6.97 114 101 108 108 0.037 0.037 35.7 27.6
350 7.29 7.19 6.94 7 107 105 115 108 0.04 0.038 26.3 26.9
475 6.83 7.07 6.91 7.09 109 117 106 120 0.036 0.037 26 31
585 6.85 6.88 7.01 7.19 108 97.3 110 111 0.037 0.038 30.7 28.5
710 7.22 7.16 7.1 7.11 109 94.4 108 109 0.043 0.043 26.8 25.7
778 6.86 6.97 6.89 7.53 110 100 100 105 0.038 0.036 27.2 26.3
890 6.8 7.08 7 7.08 110 115 105 108 0.037 0.038 26.5 26.5
955 6.78 7.02 7.06 7.04 108 108 110 107 0.039 0.039 27.3 27.1
1081 6.9 6.94 6.93 6.91 107 109 106 108 0.037 0.039 26.4 33.3
1130 6.83 6.93 6.89 7.13 104 105 112 107 0.032 0.035 26.1 26.8
1187 6.97 6.89 6.78 6.86 109 109 105 107 0.039 0.037 26.5 25.7
1311 7.01 7.14 6.83 7.15 110 115 115 113 0.038 0.04 27.5 28.1
1430 6.87 7.24 7.12 7.19 113 107 105 118 0.036 0.032 27.4 28.1
1554 7.02 7.08 7.02 6.45 103 102 104 98.6 0.038 0.04 26.9 26.7
1615 6.99 6.75 7.07 7.22 110 105 112 111 0.032 0.038 27.4 26.1
1675 6.95 6.91 6.84 6.1 110 113 111 104 0.036 0.037 27.1 25.6
1795 6.76 7.13 6.9 6.88 107 110 114 106 0.038 0.03 25.9 27.1
28
Annex 1 (continued)
Short-term stability data used for the homogeneity evaluation of nickel in ERM-CA615
Nickel (µg/L) Ampoule number
anal.1 anal.2 anal.3
467 24.7 24.8 25
533 24.8 24.8 24.6
600 24.5 25.4 24.3
671 24.5 24.5 24.7
722 25.3 23.8 24.5
843 24.5 24.5 24.7
856 25.3 23.9 24.8
1429 24.6 24.4 24.7
1448 24.3 24.5 24.6
1508 24.5 24.5 24.7
1618 24.3 24.4 24.6
1666 24.6 24.5 24.5
1737 24.5 24.5 24.6
1762 24.3 24.5 24.5
29
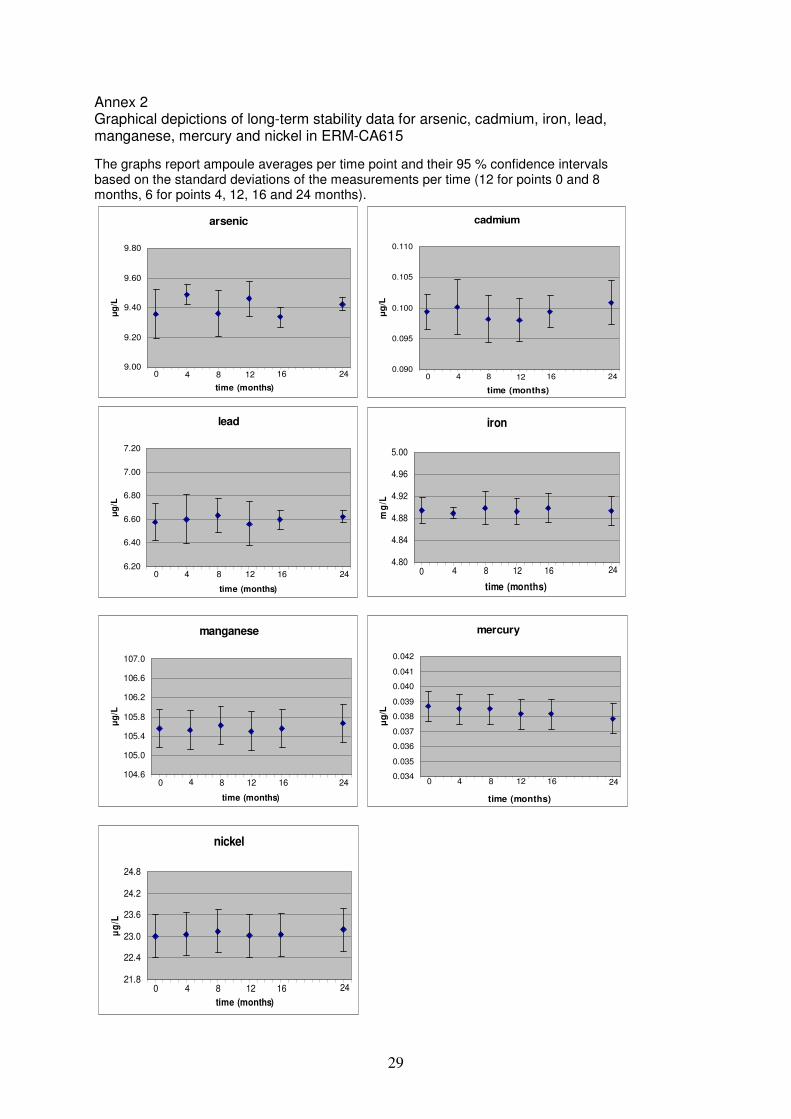
Annex 2 Graphical depictions of long-term stability data for arsenic, cadmium, iron, lead, manganese, mercury and nickel in ERM-CA615
The graphs report ampoule averages per time point and their 95 % confidence intervals based on the standard deviations of the measurements per time (12 for points 0 and 8 months, 6 for points 4, 12, 16 and 24 months).
arsenic
24160 4 8 129.00
9.20
9.40
9.60
9.80
time (months)
µg
/L
cadmium
0 4 8 12 16 240.090
0.095
0.100
0.105
0.110
time (months)µ
g/L
lead
24160 4 8 126.20
6.40
6.60
6.80
7.00
7.20
time (months)
µg
/L
iron
24160 4 8 124.80
4.84
4.88
4.92
4.96
5.00
time (months)
mg
/L
manganese
241612840104.6
105.0
105.4
105.8
106.2
106.6
107.0
time (months)
µg
/L
mercury
24160 4 8 120.034
0.035
0.036
0.037
0.038
0.039
0.040
0.041
0.042
time (months)
µg
/L
nickel
24160 4 8 1221.8
22.4
23.0
23.6
24.2
24.8
time (months)
µg
/L
30
Annex 3 Detailed description of the analytical techniques used in the characterization of ERM-CA615
Arsenic Lab Sample pre-treatment Sample
intake Analytical method and determination Calibration: type, points, calibrant LOQ
L0 none 5 mL ICP-QMS Collision cell with He Addition of i.s. solution: Ge 20 mg/L, In and Lu 3 mg/L
Linear through zero 1, 20, 50 100 µg/L High purity standard
0.67 µg/L
L3 none 20 µL ET-AAS Matrix modifier: Pd/Mg(NO3)2 (2.5 µg / 1.0 µg)
External 0, 5, 10, 15, 20 µg/L Commercially available As2O3
1.8 µg/L
L4 25 mL sample+25 mL HCl conc., 1 h reflux. Addition of 10 mL H2O2 (30 %) and KI. Making up to 100 mL with MilliQ water
25 mL HG-ET-AAS Hydride generation with NaBH4/HCl
External 2, 5, 8, 10, 12, 15 µg/L Commercially available H2AsO4
0.002 µg/L
L5 none 1.5 mL ICP-QMS Collision cell with He
External calibration 1, 2, 3, 4, 5, 10, 20 µg/L Commercially available ICP As standard
1 µg/L
L6 Dilution 50x 0.2 mL ICP-QMS Poliatomics of chlorides correction Use of Y, In and Bi as i.s.
Linear 0.050, 0.100, 0.150, 0.250, 0.350, 0.400 µg/L Commercially available solution
0.050 µg/L
L9 Dilution 2x 1 g ICP-QMS No interferences detected
External 0.1, 0.5, 1, 5, 10, 50 µg/L Commercially available standard
0.1 µg/L
L10 Acidification with HNO3 and addition of i.s.
~5 mL ICP-SFMS High resolution mode m/∆m 10000
Linear 0, 10 µg/L (checking of linear range with control sample of 50 µg/L) Commercially available multi element standard
0.05 µg/L
L12 10 mL aliquot was made up to 25 mL with 50 % KI, 10 % ascorbic acid and 3 M HCl
10 mL HG-AFS Pre-reduction of As(V) to As (III), hydride generation by 0.7 % NaBH4/0.1 M NaOH
External 0, 1, 2, 3, 4, 5 µg/L Commercially available As2O3
0.6 µg/L
31
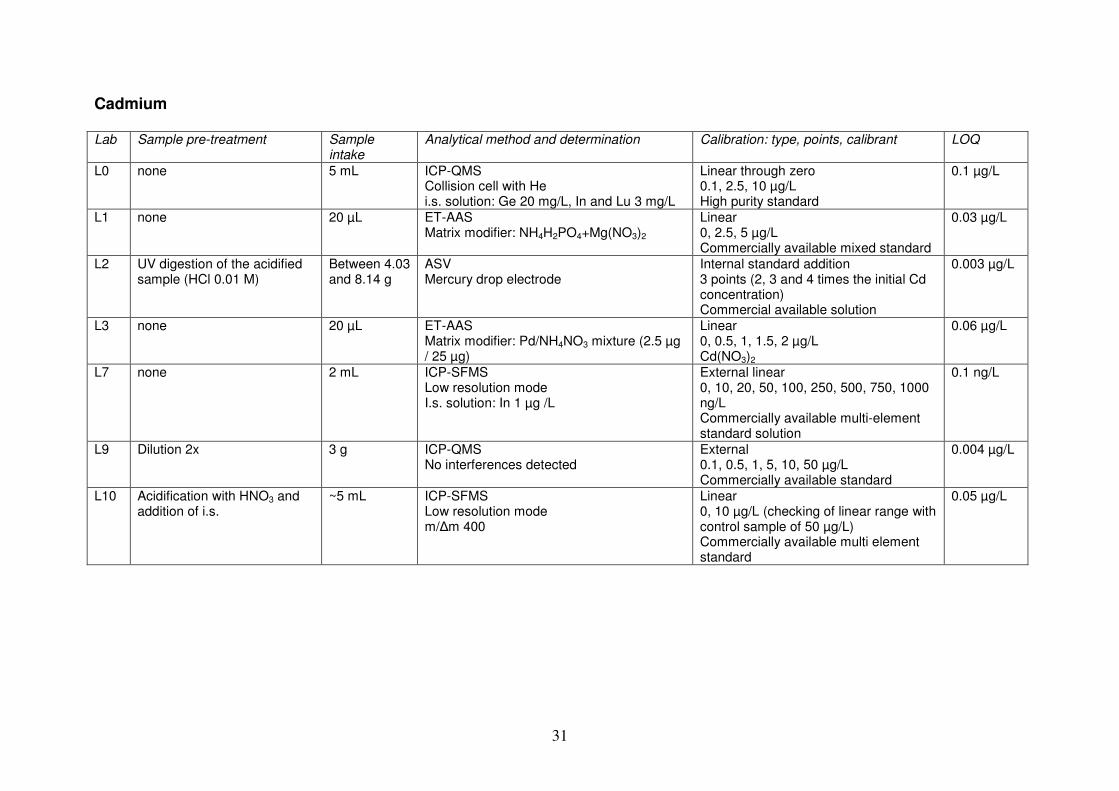
Cadmium Lab Sample pre-treatment Sample
intake Analytical method and determination Calibration: type, points, calibrant LOQ
L0 none 5 mL ICP-QMS Collision cell with He i.s. solution: Ge 20 mg/L, In and Lu 3 mg/L
Linear through zero 0.1, 2.5, 10 µg/L High purity standard
0.1 µg/L
L1 none 20 µL ET-AAS Matrix modifier: NH4H2PO4+Mg(NO3)2
Linear 0, 2.5, 5 µg/L Commercially available mixed standard
0.03 µg/L
L2 UV digestion of the acidified sample (HCl 0.01 M)
Between 4.03 and 8.14 g
ASV Mercury drop electrode
Internal standard addition 3 points (2, 3 and 4 times the initial Cd concentration) Commercial available solution
0.003 µg/L
L3 none 20 µL ET-AAS Matrix modifier: Pd/NH4NO3 mixture (2.5 µg / 25 µg)
Linear 0, 0.5, 1, 1.5, 2 µg/L Cd(NO3)2
0.06 µg/L
L7 none 2 mL ICP-SFMS Low resolution mode I.s. solution: In 1 µg /L
External linear 0, 10, 20, 50, 100, 250, 500, 750, 1000 ng/L Commercially available multi-element standard solution
0.1 ng/L
L9 Dilution 2x 3 g ICP-QMS No interferences detected
External 0.1, 0.5, 1, 5, 10, 50 µg/L Commercially available standard
0.004 µg/L
L10 Acidification with HNO3 and addition of i.s.
~5 mL ICP-SFMS Low resolution mode m/∆m 400
Linear 0, 10 µg/L (checking of linear range with control sample of 50 µg/L) Commercially available multi element standard
0.05 µg/L
32
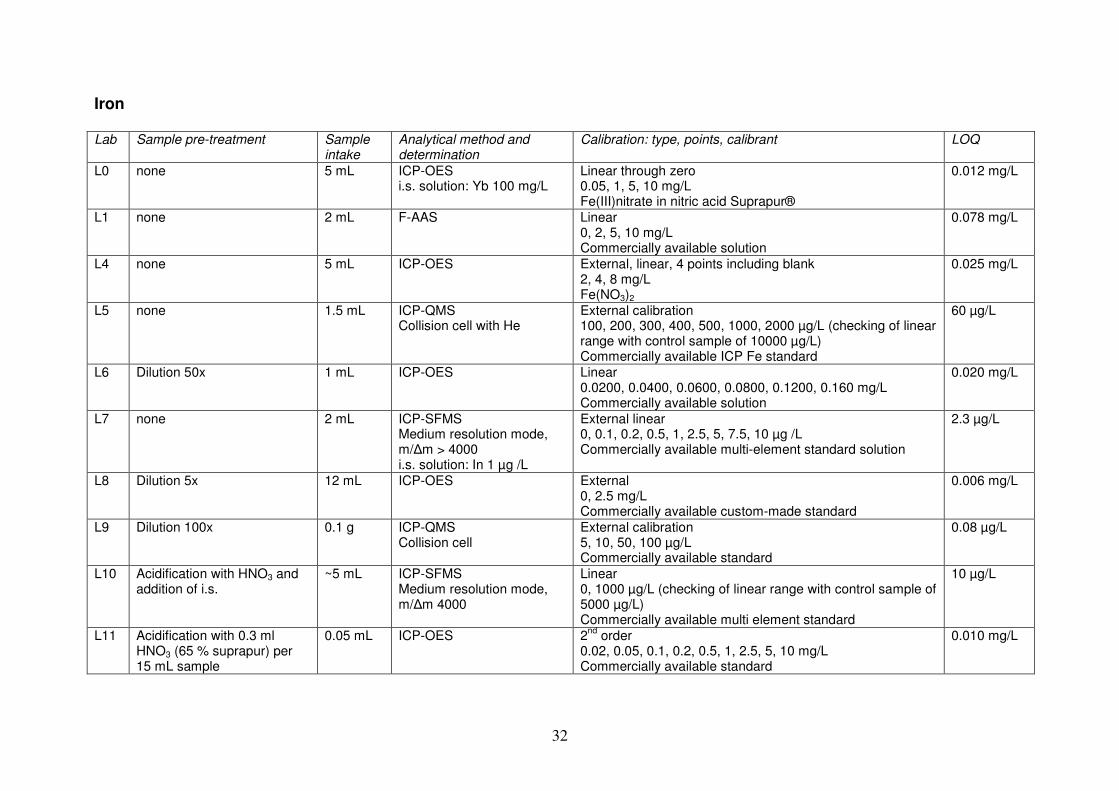
Iron Lab Sample pre-treatment Sample
intake Analytical method and determination
Calibration: type, points, calibrant LOQ
L0 none 5 mL ICP-OES i.s. solution: Yb 100 mg/L
Linear through zero 0.05, 1, 5, 10 mg/L Fe(III)nitrate in nitric acid Suprapur®
0.012 mg/L
L1 none 2 mL F-AAS Linear 0, 2, 5, 10 mg/L Commercially available solution
0.078 mg/L
L4 none 5 mL ICP-OES External, linear, 4 points including blank 2, 4, 8 mg/L Fe(NO3)2
0.025 mg/L
L5 none 1.5 mL ICP-QMS Collision cell with He
External calibration 100, 200, 300, 400, 500, 1000, 2000 µg/L (checking of linear range with control sample of 10000 µg/L) Commercially available ICP Fe standard
60 µg/L
L6 Dilution 50x 1 mL ICP-OES Linear 0.0200, 0.0400, 0.0600, 0.0800, 0.1200, 0.160 mg/L Commercially available solution
0.020 mg/L
L7 none 2 mL ICP-SFMS Medium resolution mode, m/∆m > 4000 i.s. solution: In 1 µg /L
External linear 0, 0.1, 0.2, 0.5, 1, 2.5, 5, 7.5, 10 µg /L Commercially available multi-element standard solution
2.3 µg/L
L8 Dilution 5x 12 mL ICP-OES External 0, 2.5 mg/L Commercially available custom-made standard
0.006 mg/L
L9 Dilution 100x 0.1 g ICP-QMS Collision cell
External calibration 5, 10, 50, 100 µg/L Commercially available standard
0.08 µg/L
L10 Acidification with HNO3 and addition of i.s.
~5 mL ICP-SFMS Medium resolution mode, m/∆m 4000
Linear 0, 1000 µg/L (checking of linear range with control sample of 5000 µg/L) Commercially available multi element standard
10 µg/L
L11 Acidification with 0.3 ml HNO3 (65 % suprapur) per 15 mL sample
0.05 mL ICP-OES 2nd
order 0.02, 0.05, 0.1, 0.2, 0.5, 1, 2.5, 5, 10 mg/L Commercially available standard
0.010 mg/L
33
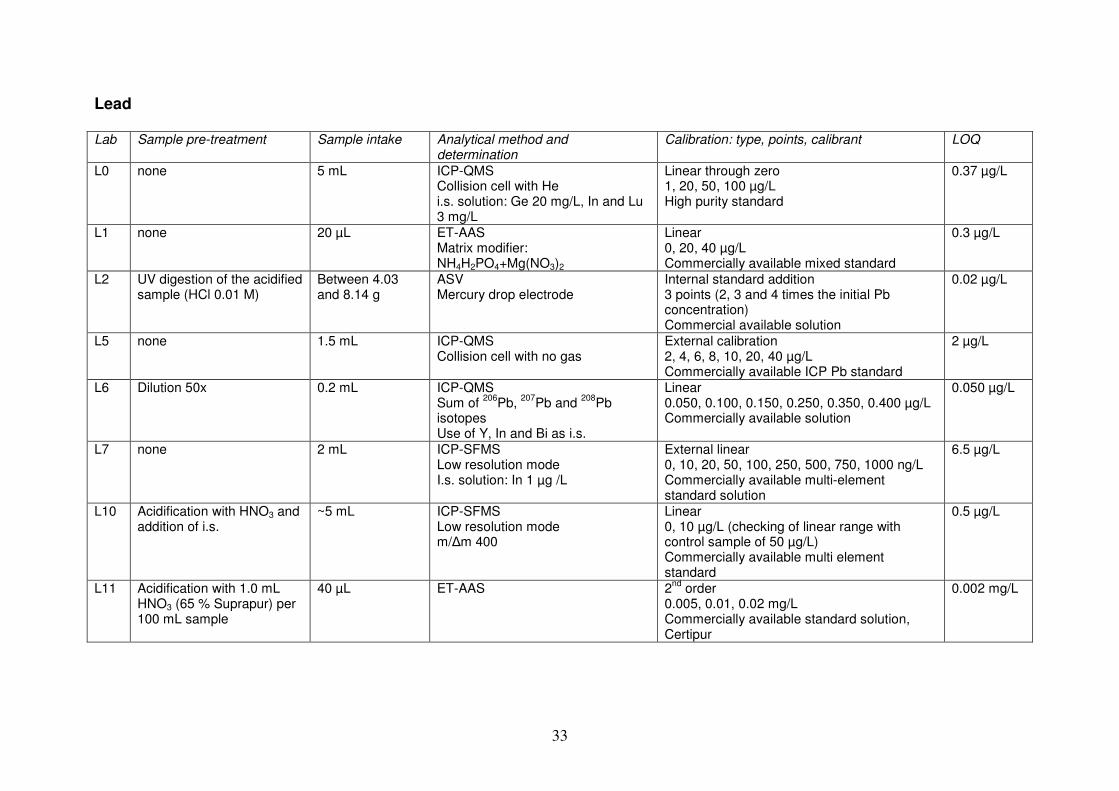
Lead Lab Sample pre-treatment Sample intake Analytical method and
determination Calibration: type, points, calibrant LOQ
L0 none 5 mL ICP-QMS Collision cell with He i.s. solution: Ge 20 mg/L, In and Lu 3 mg/L
Linear through zero 1, 20, 50, 100 µg/L High purity standard
0.37 µg/L
L1 none 20 µL ET-AAS Matrix modifier: NH4H2PO4+Mg(NO3)2
Linear 0, 20, 40 µg/L Commercially available mixed standard
0.3 µg/L
L2 UV digestion of the acidified sample (HCl 0.01 M)
Between 4.03 and 8.14 g
ASV Mercury drop electrode
Internal standard addition 3 points (2, 3 and 4 times the initial Pb concentration) Commercial available solution
0.02 µg/L
L5 none 1.5 mL ICP-QMS Collision cell with no gas
External calibration 2, 4, 6, 8, 10, 20, 40 µg/L Commercially available ICP Pb standard
2 µg/L
L6 Dilution 50x 0.2 mL ICP-QMS Sum of
206Pb,
207Pb and
208Pb
isotopes Use of Y, In and Bi as i.s.
Linear 0.050, 0.100, 0.150, 0.250, 0.350, 0.400 µg/L Commercially available solution
0.050 µg/L
L7 none 2 mL ICP-SFMS Low resolution mode I.s. solution: In 1 µg /L
External linear 0, 10, 20, 50, 100, 250, 500, 750, 1000 ng/L Commercially available multi-element standard solution
6.5 µg/L
L10 Acidification with HNO3 and addition of i.s.
~5 mL ICP-SFMS Low resolution mode m/∆m 400
Linear 0, 10 µg/L (checking of linear range with control sample of 50 µg/L) Commercially available multi element standard
0.5 µg/L
L11 Acidification with 1.0 mL HNO3 (65 % Suprapur) per 100 mL sample
40 µL ET-AAS
2nd
order 0.005, 0.01, 0.02 mg/L Commercially available standard solution, Certipur
0.002 mg/L
34
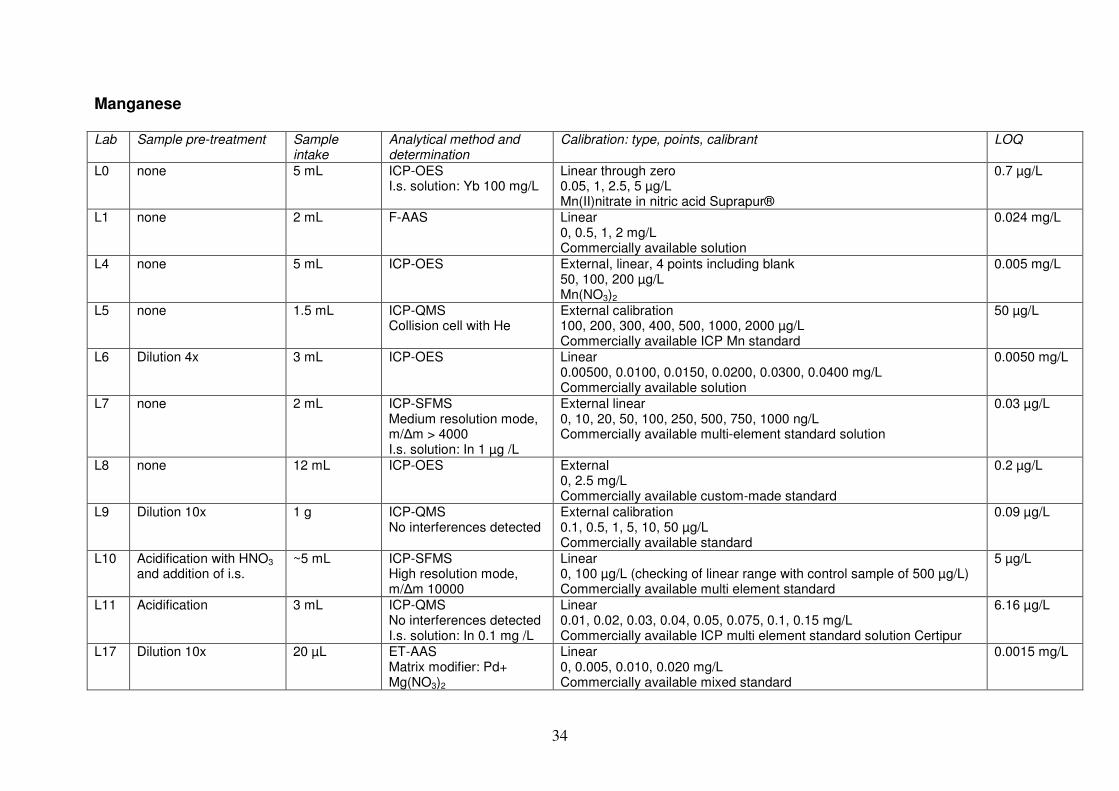
Manganese Lab Sample pre-treatment Sample
intake Analytical method and determination
Calibration: type, points, calibrant LOQ
L0 none 5 mL ICP-OES I.s. solution: Yb 100 mg/L
Linear through zero 0.05, 1, 2.5, 5 µg/L Mn(II)nitrate in nitric acid Suprapur®
0.7 µg/L
L1 none 2 mL F-AAS Linear 0, 0.5, 1, 2 mg/L Commercially available solution
0.024 mg/L
L4 none 5 mL ICP-OES
External, linear, 4 points including blank 50, 100, 200 µg/L Mn(NO3)2
0.005 mg/L
L5 none 1.5 mL ICP-QMS Collision cell with He
External calibration 100, 200, 300, 400, 500, 1000, 2000 µg/L Commercially available ICP Mn standard
50 µg/L
L6 Dilution 4x 3 mL ICP-OES Linear 0.00500, 0.0100, 0.0150, 0.0200, 0.0300, 0.0400 mg/L Commercially available solution
0.0050 mg/L
L7 none 2 mL ICP-SFMS Medium resolution mode, m/∆m > 4000 I.s. solution: In 1 µg /L
External linear 0, 10, 20, 50, 100, 250, 500, 750, 1000 ng/L Commercially available multi-element standard solution
0.03 µg/L
L8 none 12 mL ICP-OES External 0, 2.5 mg/L Commercially available custom-made standard
0.2 µg/L
L9 Dilution 10x 1 g ICP-QMS No interferences detected
External calibration 0.1, 0.5, 1, 5, 10, 50 µg/L Commercially available standard
0.09 µg/L
L10 Acidification with HNO3 and addition of i.s.
~5 mL ICP-SFMS High resolution mode, m/∆m 10000
Linear 0, 100 µg/L (checking of linear range with control sample of 500 µg/L) Commercially available multi element standard
5 µg/L
L11 Acidification 3 mL ICP-QMS No interferences detected I.s. solution: In 0.1 mg /L
Linear 0.01, 0.02, 0.03, 0.04, 0.05, 0.075, 0.1, 0.15 mg/L Commercially available ICP multi element standard solution Certipur
6.16 µg/L
L17 Dilution 10x 20 µL ET-AAS Matrix modifier: Pd+ Mg(NO3)2
Linear 0, 0.005, 0.010, 0.020 mg/L Commercially available mixed standard
0.0015 mg/L
35
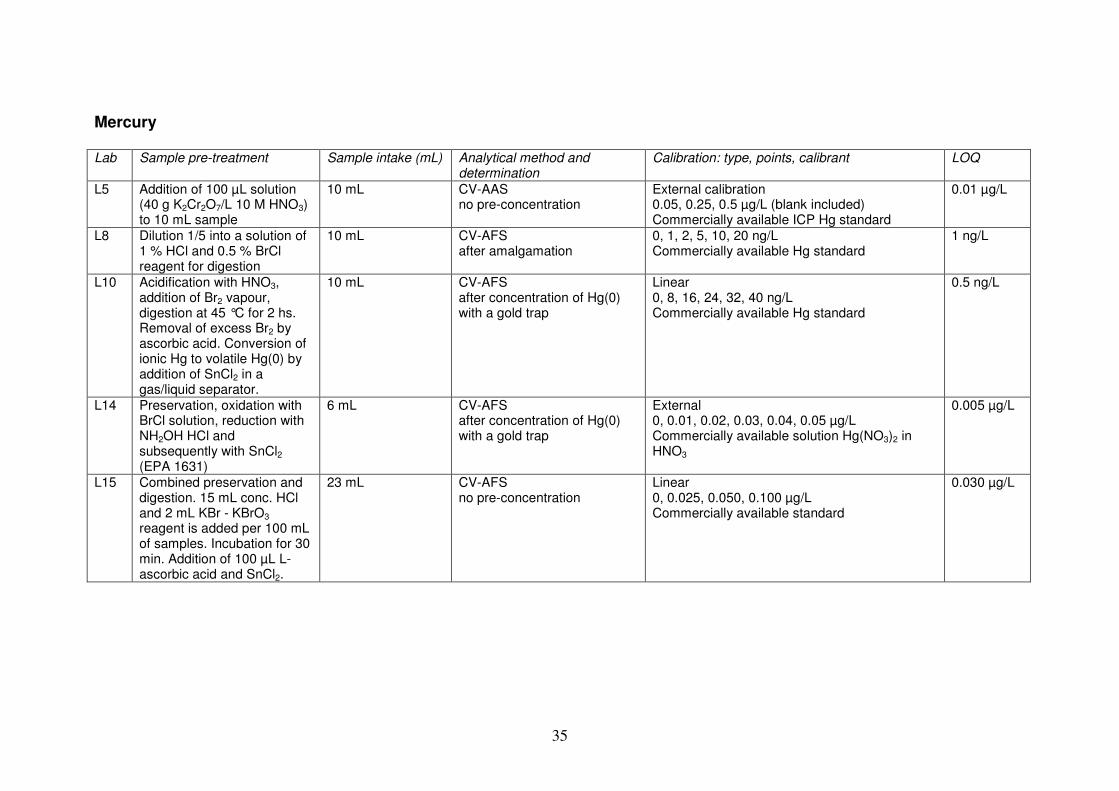
Mercury Lab Sample pre-treatment Sample intake (mL) Analytical method and
determination Calibration: type, points, calibrant LOQ
L5 Addition of 100 µL solution (40 g K2Cr2O7/L 10 M HNO3) to 10 mL sample
10 mL CV-AAS no pre-concentration
External calibration 0.05, 0.25, 0.5 µg/L (blank included) Commercially available ICP Hg standard
0.01 µg/L
L8 Dilution 1/5 into a solution of 1 % HCl and 0.5 % BrCl reagent for digestion
10 mL CV-AFS after amalgamation
0, 1, 2, 5, 10, 20 ng/L Commercially available Hg standard
1 ng/L
L10 Acidification with HNO3, addition of Br2 vapour, digestion at 45 °C for 2 hs. Removal of excess Br2 by ascorbic acid. Conversion of ionic Hg to volatile Hg(0) by addition of SnCl2 in a gas/liquid separator.
10 mL CV-AFS after concentration of Hg(0) with a gold trap
Linear 0, 8, 16, 24, 32, 40 ng/L Commercially available Hg standard
0.5 ng/L
L14 Preservation, oxidation with BrCl solution, reduction with NH2OH HCl and subsequently with SnCl2 (EPA 1631)
6 mL CV-AFS after concentration of Hg(0) with a gold trap
External 0, 0.01, 0.02, 0.03, 0.04, 0.05 µg/L Commercially available solution Hg(NO3)2 in HNO3
0.005 µg/L
L15 Combined preservation and digestion. 15 mL conc. HCl and 2 mL KBr - KBrO3 reagent is added per 100 mL of samples. Incubation for 30 min. Addition of 100 µL L-ascorbic acid and SnCl2.
23 mL CV-AFS no pre-concentration
Linear 0, 0.025, 0.050, 0.100 µg/L Commercially available standard
0.030 µg/L
36
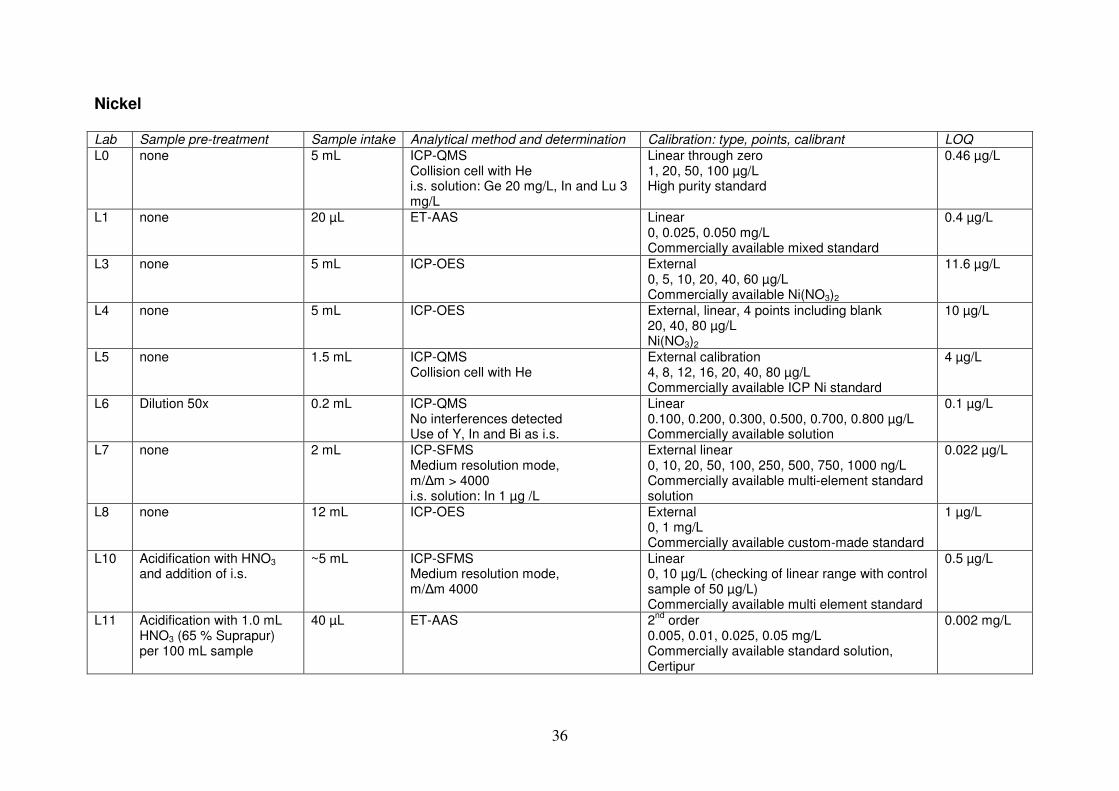
Nickel Lab Sample pre-treatment Sample intake Analytical method and determination Calibration: type, points, calibrant LOQ
L0 none 5 mL ICP-QMS Collision cell with He i.s. solution: Ge 20 mg/L, In and Lu 3 mg/L
Linear through zero 1, 20, 50, 100 µg/L High purity standard
0.46 µg/L
L1 none 20 µL ET-AAS Linear 0, 0.025, 0.050 mg/L Commercially available mixed standard
0.4 µg/L
L3 none 5 mL ICP-OES External 0, 5, 10, 20, 40, 60 µg/L Commercially available Ni(NO3)2
11.6 µg/L
L4 none 5 mL ICP-OES
External, linear, 4 points including blank 20, 40, 80 µg/L Ni(NO3)2
10 µg/L
L5 none 1.5 mL ICP-QMS Collision cell with He
External calibration 4, 8, 12, 16, 20, 40, 80 µg/L Commercially available ICP Ni standard
4 µg/L
L6 Dilution 50x 0.2 mL ICP-QMS No interferences detected Use of Y, In and Bi as i.s.
Linear 0.100, 0.200, 0.300, 0.500, 0.700, 0.800 µg/L Commercially available solution
0.1 µg/L
L7 none 2 mL ICP-SFMS Medium resolution mode, m/∆m > 4000 i.s. solution: In 1 µg /L
External linear 0, 10, 20, 50, 100, 250, 500, 750, 1000 ng/L Commercially available multi-element standard solution
0.022 µg/L
L8 none 12 mL ICP-OES External 0, 1 mg/L Commercially available custom-made standard
1 µg/L
L10 Acidification with HNO3 and addition of i.s.
~5 mL ICP-SFMS Medium resolution mode, m/∆m 4000
Linear 0, 10 µg/L (checking of linear range with control sample of 50 µg/L) Commercially available multi element standard
0.5 µg/L
L11 Acidification with 1.0 mL HNO3 (65 % Suprapur) per 100 mL sample
40 µL ET-AAS
2nd
order 0.005, 0.01, 0.025, 0.05 mg/L Commercially available standard solution, Certipur
0.002 mg/L
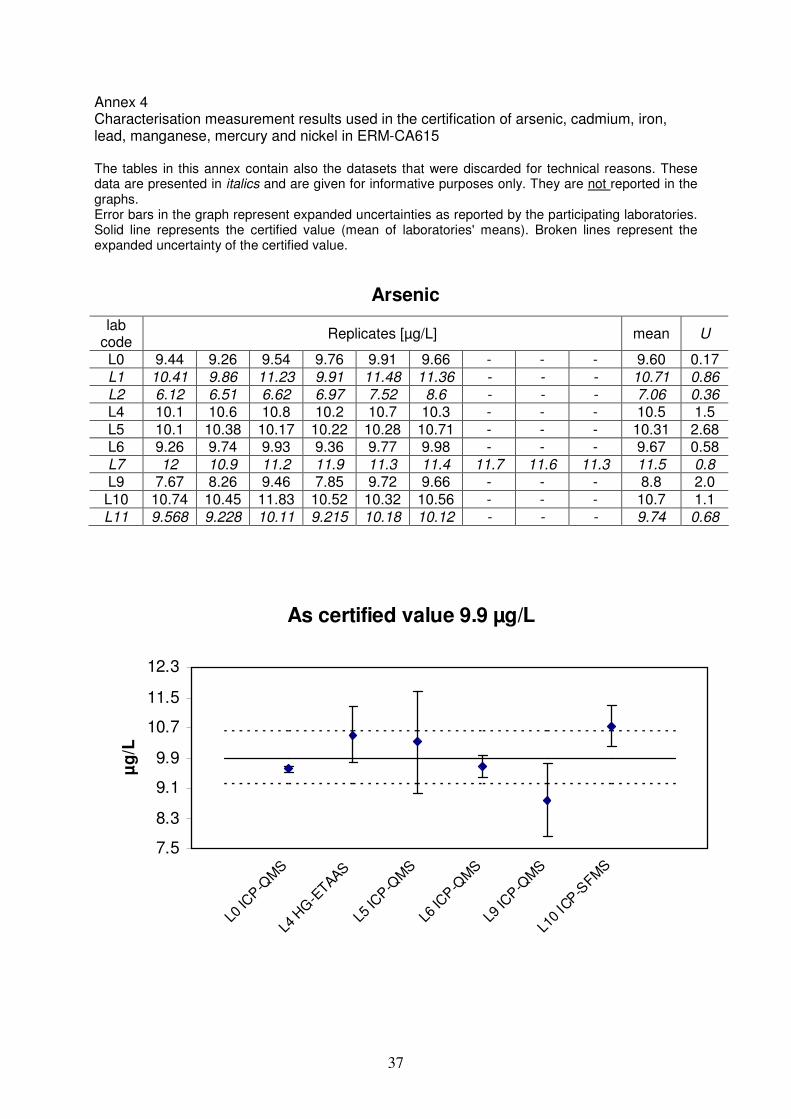
37
Annex 4 Characterisation measurement results used in the certification of arsenic, cadmium, iron, lead, manganese, mercury and nickel in ERM-CA615 The tables in this annex contain also the datasets that were discarded for technical reasons. These data are presented in italics and are given for informative purposes only. They are not reported in the graphs. Error bars in the graph represent expanded uncertainties as reported by the participating laboratories. Solid line represents the certified value (mean of laboratories' means). Broken lines represent the expanded uncertainty of the certified value.
Arsenic
lab code
Replicates [µg/L] mean U
L0 9.44 9.26 9.54 9.76 9.91 9.66 - - - 9.60 0.17 L1 10.41 9.86 11.23 9.91 11.48 11.36 - - - 10.71 0.86
L2 6.12 6.51 6.62 6.97 7.52 8.6 - - - 7.06 0.36
L4 10.1 10.6 10.8 10.2 10.7 10.3 - - - 10.5 1.5 L5 10.1 10.38 10.17 10.22 10.28 10.71 - - - 10.31 2.68 L6 9.26 9.74 9.93 9.36 9.77 9.98 - - - 9.67 0.58 L7 12 10.9 11.2 11.9 11.3 11.4 11.7 11.6 11.3 11.5 0.8
L9 7.67 8.26 9.46 7.85 9.72 9.66 - - - 8.8 2.0 L10 10.74 10.45 11.83 10.52 10.32 10.56 - - - 10.7 1.1 L11 9.568 9.228 10.11 9.215 10.18 10.12 - - - 9.74 0.68
As certified value 9.9 µg/L
7.5
8.3
9.1
9.9
10.7
11.5
12.3
L0 IC
P-Q
MS
L4 H
G-E
TAAS
L5 IC
P-Q
MS
L6 IC
P-Q
MS
L9 IC
P-Q
MS
L10
ICP-S
FMS
µg
/L
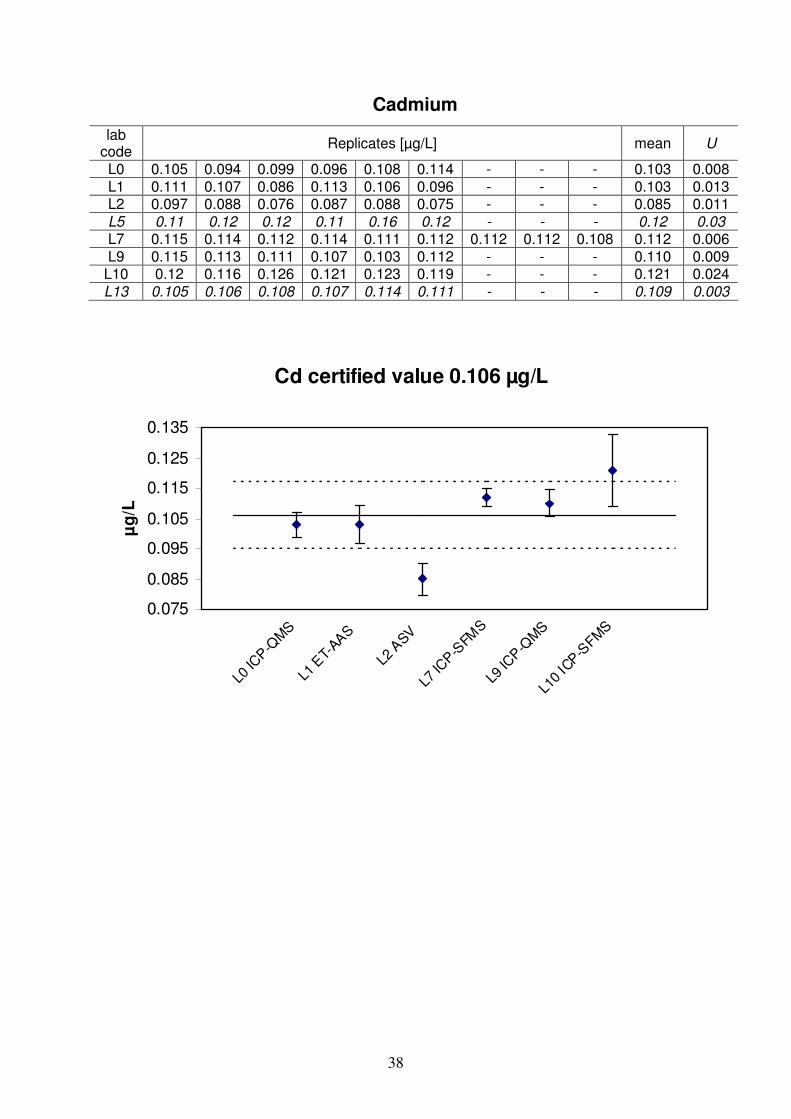
38
Cadmium
lab code
Replicates [µg/L] mean U
L0 0.105 0.094 0.099 0.096 0.108 0.114 - - - 0.103 0.008 L1 0.111 0.107 0.086 0.113 0.106 0.096 - - - 0.103 0.013 L2 0.097 0.088 0.076 0.087 0.088 0.075 - - - 0.085 0.011
L5 0.11 0.12 0.12 0.11 0.16 0.12 - - - 0.12 0.03
L7 0.115 0.114 0.112 0.114 0.111 0.112 0.112 0.112 0.108 0.112 0.006 L9 0.115 0.113 0.111 0.107 0.103 0.112 - - - 0.110 0.009
L10 0.12 0.116 0.126 0.121 0.123 0.119 - - - 0.121 0.024 L13 0.105 0.106 0.108 0.107 0.114 0.111 - - - 0.109 0.003
Cd certified value 0.106 µg/L
0.075
0.085
0.095
0.105
0.115
0.125
0.135
L0 IC
P-Q
MS
L1 E
T-AA
S
L2 A
SV
L7 IC
P-S
FMS
L9 IC
P-Q
MS
L10
ICP-S
FMS
µg
/L
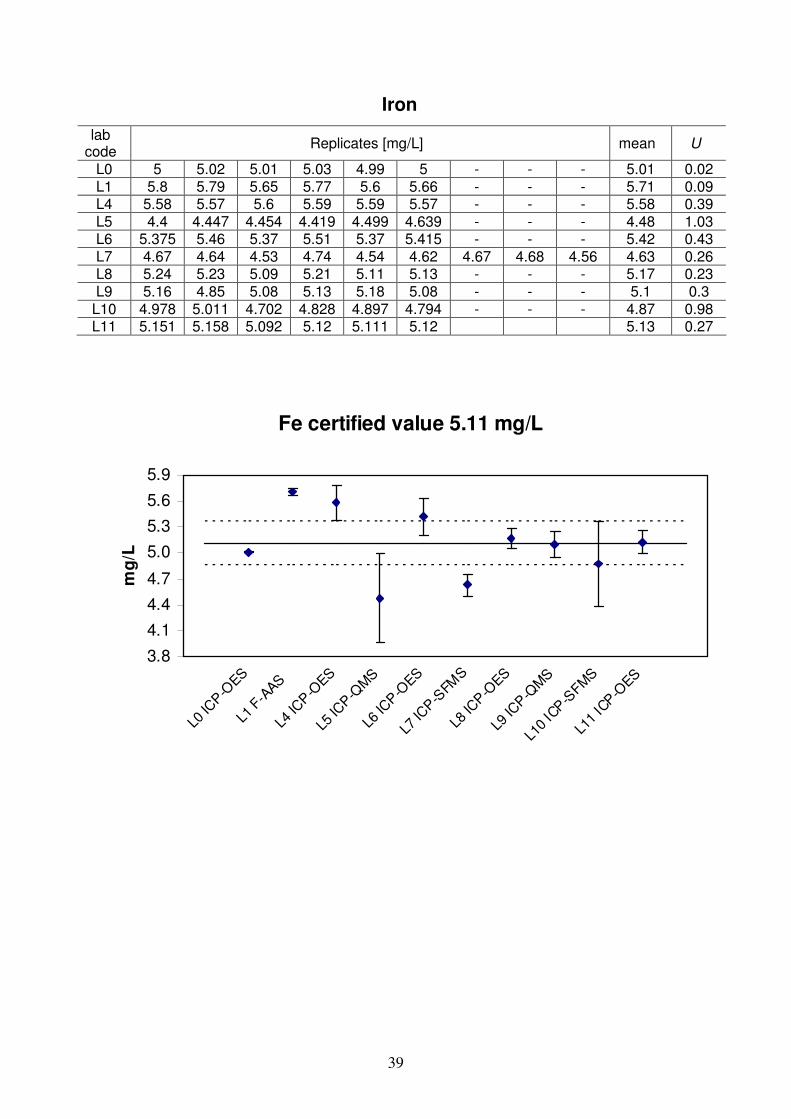
39
Iron
lab code
Replicates [mg/L] mean U
L0 5 5.02 5.01 5.03 4.99 5 - - - 5.01 0.02 L1 5.8 5.79 5.65 5.77 5.6 5.66 - - - 5.71 0.09 L4 5.58 5.57 5.6 5.59 5.59 5.57 - - - 5.58 0.39 L5 4.4 4.447 4.454 4.419 4.499 4.639 - - - 4.48 1.03 L6 5.375 5.46 5.37 5.51 5.37 5.415 - - - 5.42 0.43 L7 4.67 4.64 4.53 4.74 4.54 4.62 4.67 4.68 4.56 4.63 0.26 L8 5.24 5.23 5.09 5.21 5.11 5.13 - - - 5.17 0.23 L9 5.16 4.85 5.08 5.13 5.18 5.08 - - - 5.1 0.3
L10 4.978 5.011 4.702 4.828 4.897 4.794 - - - 4.87 0.98 L11 5.151 5.158 5.092 5.12 5.111 5.12 5.13 0.27
Fe certified value 5.11 mg/L
3.8
4.1
4.4
4.7
5.0
5.3
5.6
5.9
L0 IC
P-O
ES
L1 F
-AAS
L4 IC
P-O
ES
L5 IC
P-Q
MS
L6 IC
P-O
ES
L7 IC
P-S
FMS
L8 IC
P-O
ES
L9 IC
P-Q
MS
L10
ICP-S
FMS
L11
ICP-O
ES
mg
/L
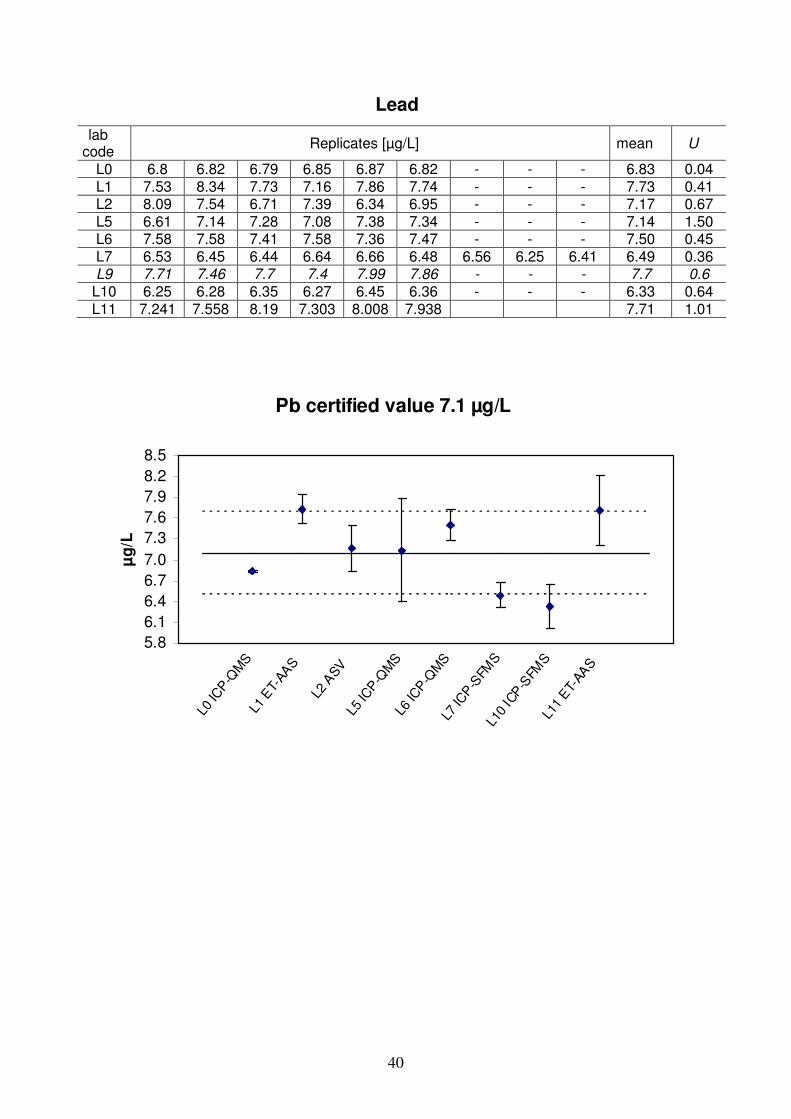
40
Lead
lab code
Replicates [µg/L] mean U
L0 6.8 6.82 6.79 6.85 6.87 6.82 - - - 6.83 0.04 L1 7.53 8.34 7.73 7.16 7.86 7.74 - - - 7.73 0.41 L2 8.09 7.54 6.71 7.39 6.34 6.95 - - - 7.17 0.67 L5 6.61 7.14 7.28 7.08 7.38 7.34 - - - 7.14 1.50 L6 7.58 7.58 7.41 7.58 7.36 7.47 - - - 7.50 0.45 L7 6.53 6.45 6.44 6.64 6.66 6.48 6.56 6.25 6.41 6.49 0.36 L9 7.71 7.46 7.7 7.4 7.99 7.86 - - - 7.7 0.6
L10 6.25 6.28 6.35 6.27 6.45 6.36 - - - 6.33 0.64 L11 7.241 7.558 8.19 7.303 8.008 7.938 7.71 1.01
Pb certified value 7.1 µg/L
5.8
6.1
6.4
6.7
7.0
7.3
7.6
7.9
8.2
8.5
L0 IC
P-Q
MS
L1 E
T-AAS
L2 A
SV
L5 IC
P-Q
MS
L6 IC
P-Q
MS
L7 IC
P-S
FMS
L10
ICP
-SFM
SL1
1 ET-
AAS
µg
/L
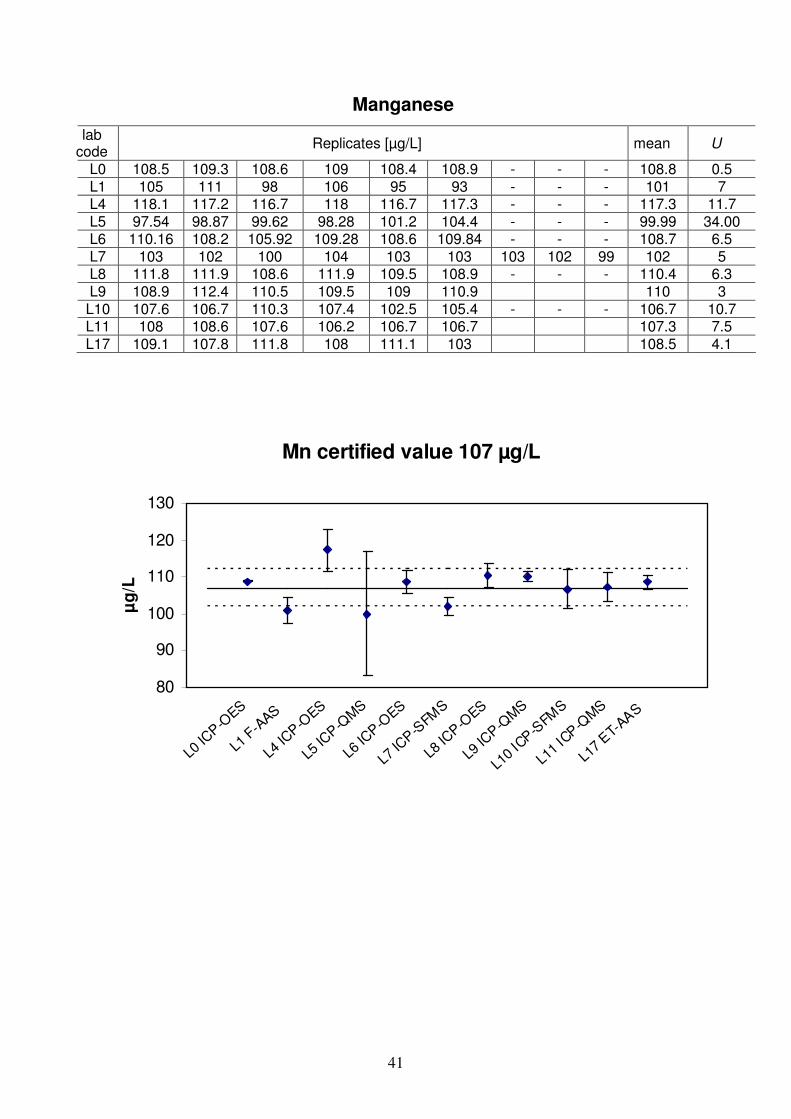
41
Manganese
lab code
Replicates [µg/L] mean U
L0 108.5 109.3 108.6 109 108.4 108.9 - - - 108.8 0.5 L1 105 111 98 106 95 93 - - - 101 7 L4 118.1 117.2 116.7 118 116.7 117.3 - - - 117.3 11.7 L5 97.54 98.87 99.62 98.28 101.2 104.4 - - - 99.99 34.00 L6 110.16 108.2 105.92 109.28 108.6 109.84 - - - 108.7 6.5 L7 103 102 100 104 103 103 103 102 99 102 5 L8 111.8 111.9 108.6 111.9 109.5 108.9 - - - 110.4 6.3 L9 108.9 112.4 110.5 109.5 109 110.9 110 3 L10 107.6 106.7 110.3 107.4 102.5 105.4 - - - 106.7 10.7 L11 108 108.6 107.6 106.2 106.7 106.7 107.3 7.5 L17 109.1 107.8 111.8 108 111.1 103 108.5 4.1
Mn certified value 107 µg/L
80
90
100
110
120
130
L0 IC
P-O
ES
L1 F
-AAS
L4 IC
P-O
ES
L5 IC
P-Q
MS
L6 IC
P-O
ES
L7 IC
P-S
FMS
L8 IC
P-O
ES
L9 IC
P-Q
MS
L10
ICP-S
FMS
L11
ICP-Q
MS
L17
ET-
AAS
µg
/L
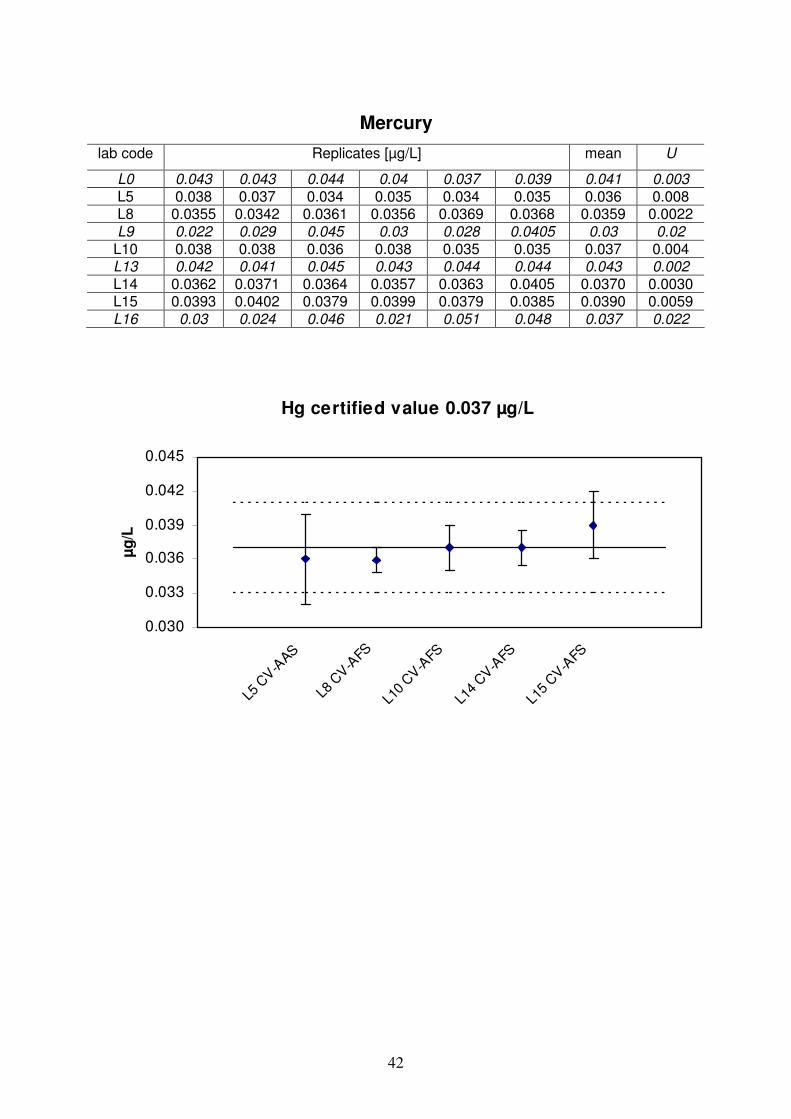
42
Mercury
lab code Replicates [µg/L] mean U
L0 0.043 0.043 0.044 0.04 0.037 0.039 0.041 0.003
L5 0.038 0.037 0.034 0.035 0.034 0.035 0.036 0.008 L8 0.0355 0.0342 0.0361 0.0356 0.0369 0.0368 0.0359 0.0022 L9 0.022 0.029 0.045 0.03 0.028 0.0405 0.03 0.02
L10 0.038 0.038 0.036 0.038 0.035 0.035 0.037 0.004 L13 0.042 0.041 0.045 0.043 0.044 0.044 0.043 0.002
L14 0.0362 0.0371 0.0364 0.0357 0.0363 0.0405 0.0370 0.0030 L15 0.0393 0.0402 0.0379 0.0399 0.0379 0.0385 0.0390 0.0059 L16 0.03 0.024 0.046 0.021 0.051 0.048 0.037 0.022
Hg certified value 0.037 µg/L
0.030
0.033
0.036
0.039
0.042
0.045
L5 C
V-A
AS
L8 C
V-A
FS
L10
CV-A
FS
L14
CV-A
FS
L15
CV-A
FS
µg
/L
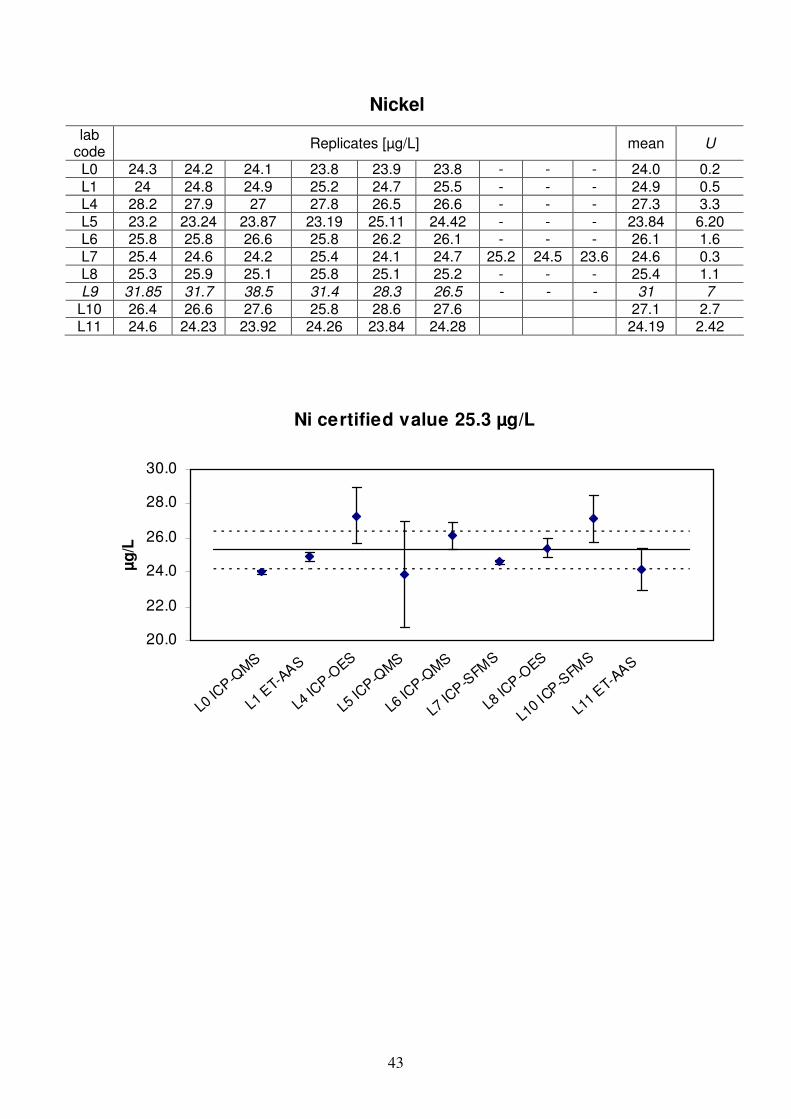
43
Nickel
lab code
Replicates [µg/L] mean U
L0 24.3 24.2 24.1 23.8 23.9 23.8 - - - 24.0 0.2 L1 24 24.8 24.9 25.2 24.7 25.5 - - - 24.9 0.5 L4 28.2 27.9 27 27.8 26.5 26.6 - - - 27.3 3.3 L5 23.2 23.24 23.87 23.19 25.11 24.42 - - - 23.84 6.20 L6 25.8 25.8 26.6 25.8 26.2 26.1 - - - 26.1 1.6 L7 25.4 24.6 24.2 25.4 24.1 24.7 25.2 24.5 23.6 24.6 0.3 L8 25.3 25.9 25.1 25.8 25.1 25.2 - - - 25.4 1.1 L9 31.85 31.7 38.5 31.4 28.3 26.5 - - - 31 7
L10 26.4 26.6 27.6 25.8 28.6 27.6 27.1 2.7 L11 24.6 24.23 23.92 24.26 23.84 24.28 24.19 2.42
Ni certified value 25.3 µg/L
20.0
22.0
24.0
26.0
28.0
30.0
L0 IC
P-QM
S
L1 E
T-AAS
L4 IC
P-O
ES
L5 IC
P-QM
S
L6 IC
P-QM
S
L7 IC
P-S
FMS
L8 IC
P-O
ES
L10
ICP-S
FMS
L11
ET-
AAS
µg
/L

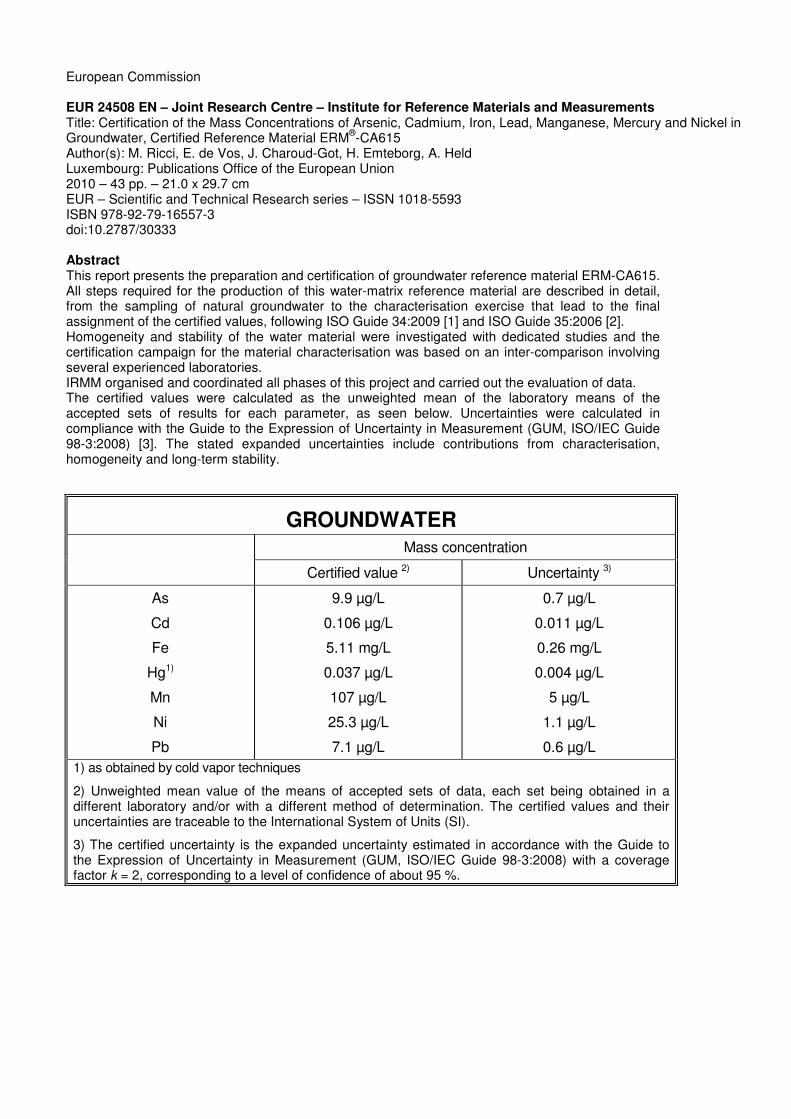
European Commission EUR 24508 EN – Joint Research Centre – Institute for Reference Materials and Measurements Title: Certification of the Mass Concentrations of Arsenic, Cadmium, Iron, Lead, Manganese, Mercury and Nickel in Groundwater, Certified Reference Material ERM
®-CA615
Author(s): M. Ricci, E. de Vos, J. Charoud-Got, H. Emteborg, A. Held Luxembourg: Publications Office of the European Union 2010 – 43 pp. – 21.0 x 29.7 cm EUR – Scientific and Technical Research series – ISSN 1018-5593 ISBN 978-92-79-16557-3 doi:10.2787/30333 Abstract This report presents the preparation and certification of groundwater reference material ERM-CA615. All steps required for the production of this water-matrix reference material are described in detail, from the sampling of natural groundwater to the characterisation exercise that lead to the final assignment of the certified values, following ISO Guide 34:2009 [1] and ISO Guide 35:2006 [2]. Homogeneity and stability of the water material were investigated with dedicated studies and the certification campaign for the material characterisation was based on an inter-comparison involving several experienced laboratories. IRMM organised and coordinated all phases of this project and carried out the evaluation of data. The certified values were calculated as the unweighted mean of the laboratory means of the accepted sets of results for each parameter, as seen below. Uncertainties were calculated in compliance with the Guide to the Expression of Uncertainty in Measurement (GUM, ISO/IEC Guide 98-3:2008) [3]. The stated expanded uncertainties include contributions from characterisation, homogeneity and long-term stability.
GROUNDWATER Mass concentration
Certified value 2)
Uncertainty 3)
As
Cd
Fe
Hg1)
Mn
Ni
Pb
9.9 µg/L
0.106 µg/L
5.11 mg/L
0.037 µg/L
107 µg/L
25.3 µg/L
7.1 µg/L
0.7 µg/L
0.011 µg/L
0.26 mg/L
0.004 µg/L
5 µg/L
1.1 µg/L
0.6 µg/L
1) as obtained by cold vapor techniques
2) Unweighted mean value of the means of accepted sets of data, each set being obtained in a different laboratory and/or with a different method of determination. The certified values and their uncertainties are traceable to the International System of Units (SI).
3) The certified uncertainty is the expanded uncertainty estimated in accordance with the Guide to the Expression of Uncertainty in Measurement (GUM, ISO/IEC Guide 98-3:2008) with a coverage factor k = 2, corresponding to a level of confidence of about 95 %.

How to obtain EU publications Our priced publications are available from EU Bookshop (http://bookshop.europa.eu), where you can place an order with the sales agent of your choice. The Publications Office has a worldwide network of sales agents. You can obtain their contact details by sending a fax to (352) 29 29-42758.

The mission of the JRC is to provide customer-driven scientific and technical support for the conception, development, implementation and monitoring of EU policies. As a service of the European Commission, the JRC functions as a reference centre of science and technology for the Union. Close to the policy-making process, it serves the common interest of the Member States, while being independent of special interests, whether private or national.
L
A- N
A- 2
45
08
- EN
- C