Embed Size (px)
Citation preview

1
CERTIFICATION OF APPROVAL
DRAG REDUCING AGENT BY WATER INJECTION USING
NATURAL POLYMER (Solanum Tuberosum)
By
AMIRA BINTI ABDUL RASIB
A project dissertation submitted to the
Petroleum Engineering Programme
Universiti Teknologi PETRONAS
In partial fulfillment of the requirement for the
BACHELOR OF ENGINEERING (Hons)
(PETROLEUM ENGINEERING)
Approved by,
_____________________
(PUAN MAZUIN JASAMAI)
Project Supervisor
UNIVERSITI TEKNOLOGI PETRONAS
TRONOH, PERAK
September 2012
2
CERTIFICATION OF ORIGINALITY
This is to certify that I am responsible for the work submitted in this project, that the
original work is my own except as specified in the references and acknowledgements,
and that the original work contained herein have not been undertaken or done by
unspecified sources or persons.
___________________________________________
AMIRA BINTI ABDUL RASIB

3
Abstract
This research presents an experimental study of drag reduction performance of natural
polymer solution in pipelines. The aim is to prove the effectiveness of using potatoes
solution or in scientific called Solanum Tuberosum as Drag Reducing Agent (DRA).
DRA is a chemical agent used to optimize the pipeline capacity by reducing drag and
lowering pressure drop across the pipeline. As the production continue, the main
problem that will be aroused due to the limited pipeline capacity which caused by drag.
Drag had caused power pumping losses, decreasing in production capacity and pipelines
corrosion. Thus, DRA is rapidly becoming an essential alternative in Oil & Gas industry
since it can be applied in short time and does not require a high initial investment. The
objectives of this project are to investigate the effect of natural polymer used as DRA in
water flowline, to determine the percentage of drag reduction after injecting the DRA
and to determine water flow rate due to different concentration of DRA. This polymer
has been tested in 1-inch diameter Galvanize Iron steel single pipeline. The pipeline is
12.25 meter long where water is pumped throughout 4 meter long of test section which 2
pressure gauges were located in order to measure the pressure drop. An injection point is
created to inject the DRA solutions at the starting point of 6 meter entrance length before
the test section. At the beginning of the experiment, 36 liter of water from storage tank is
pumped through the test section without injecting the DRA. Readings from both
pressure gauges and time taken for water to cater the drainage tank is recorded. Then,
the experiment is repeated with the same procedure with injecting the DRA at the
injection point. The difference pressure of both pressure drops is calculated in order to
get drag reduction percentage (%Dr). In the experiment, 5 different concentrations of
DRA are prepared. The result showed that Solanum Tuberosum give potential effect
when acts as DRA significantly by recorded 3.03% of Drag Reduction Percentage in the
lowest concentration, 600 ppm and 10.91% in the highest concentration which is 1000
ppm. Although it did not present the best performance as DRA, but there are advantages
of using the natural polymer as DRA. There are very abundant quantity in Malaysia,
thus, it has zero problem in getting them in a big amount to produce as DRA.
4
Acknowledgment
This Final Year Project involved many parties in order to complete it successfully. At
first, I would like to give the highest appreciation to Puan Mazuin Jasamai, whom act as
my supervisor for the entire lesson learnt in assisting me and give fully moral support in
order to complete this project.
Next, I would like to thank Dr Azuraien Jaafar, whom act as co-supervisor for
strengthen my concept in how „Drag Reducing Agent‟ works and keep helping and
assisting in modifying the prototype in order to get accurate and effective result.
Next, a token appreciation also goes to the lab technicians of Block 15, Mr Shahrul and
Mr Jukhairi from Petroleum Engineering Department for the support and kindness in
assisting me to conduct the experiment.
Lastly, I would like to thank Universiti Teknologi PETRONAS for providing the
opportunity to gain new knowledge and experiences during completing this project. This
Final Year Project will be my stepping stone in my future carrier development.

5
TABLE OF CONTENT
CERTIFICATION OF APPROVAL ……………………………… 1
CERTIFICATION OF ORIGINALITY ……………………………… 2
ABSTRACT ……………………………… 3
ACKNOWLEDGEMENT ……………………………… 4
CHAPTER 1: INTRODUCTION ……………………………… 8
1.1 BACKGROUND STUDY ……………………………… 8
1.2 PROBLEM STATEMENT ……………………………… 11
1.3 OBJECTIVES OF THE PROJECT ……………………………… 13
1.4 SCOPE OF STUDY ……………………………… 14
1.5 THE RELEVANCY OF THE PROJECT ……………………………… 15
1.6 FEASIBILITY OF THE PROJECT ……………………………… 15
CHAPTER 2: LITERATURE REVIEW ……………………………… 16
CHAPTER 3: METHODOLOGY ……………………………… 16
3.1 THE WORK FLOW ……………………………… 24
3.2 EXPERIMENTAL SETUP ……………………………… 25
3.3 EXPERIMENTAL WORK ……………………………… 31
3.4 EQUATIONS ……………………………… 34
3.5 TOOLS, EQUIPMENT & MATERIALS …………………………….... 35
CHAPTER 4: RESULT & DISCUSSION ……………………………… 36
4.1 ASSUMPTIONS ……………………………… 36
4.2 GRAPH & DISCUSSION ……………………………… 37
4.3 CALCULATIONS ……………………………… 43
4.4 LIMITATIONS ……………………………… 45
4.5 ERRORS ……………………………… 46
CHAPTER 5:
CONCLUSION & RECOMMENDATION
………………………………
47
FYP 2 GANTT CHART ……………………………… 49
REFERENCES ……………………………… 50
APPENDICES ……………………………… 52
6
Figure 1 Water injection ………………... 8
Figure 2 Damage in pipeline surface ………………... 11
Figure 3 Formula of Reynolds number ………………... 11
Figure 4 Turbulent flow in pipeline ……………….. 12
Figure 5 Flow in pipeline after injecting DRA ……………….. 16
Figure 6 Effect of polymer concentration on drag reduction
percentage
………………. 17
Figure 7 Effect of polymer concentration on DRA reduction
percentage
……………….. 18
Figure 8 Drag reduction percentage as a function of
concentration for fresh and broken DRA
……………….. 19
Figure 9 Pressure drop measured across the tube with
various flow rate of water
……………….. 19
Figure 10 Drag reduction percentage as a function of various
Reynolds number
……………….. 20
Figure 11 Effect of pipe length to drag reduction percentage ……………….. 22
Figure 12 Storage tank to centrifugal pump ……………….. 26
Figure 13 Centrifugal pump ……………….. 27
Figure 14 Centrifugal pump to injection point ……………….. 27
Figure 15 Injection point ………………... 28
Figure 16 Pressure gauge ……………….. 29
Figure 17 Drainage tank ……………….. 29
Figure 18 Drag reduction percentage vs concentration (ppm) ……………….. 36
Figure 19 Drag reduction percentage vs Reynolds number ……………….. 37
Figure 20 Flow rate vs concentration ……………….. 38
Figure 21 DRA efficiency vs concentration ……………….. 39
Figure 22 Flow increase vs concentration ……………….. 39
Figure 23 Drag reduction percentage from comparison of
natural polymer
………………... 41
Figure 24 Comparison of drag reduction percentage with
commercial DRA
………………... 42
7
Table 1 The effect of Reynolds number, concentration and
injecting ways on drag reduction
……………….. 21
Table 2 Viscosity of natural polymers ……………….. 31
Table 3 Concentration of DRA ……………….. 32

8
CHAPTER 1: INTRODUCTION
1.1 Background Study
In the production stage, hydrocarbon is displaced by sufficient pressure provided by
natural reservoir drives. After some time, the natural energy is depleted and it affects the
capacity of hydrocarbon production rate. Thus, secondary recovery is needed in order to
recover the energy depleted from reservoir. One of the methods of secondary recovery is
water injection. From a journal entitled The Water Injection Process authored by B.
Palson, D.R.Davies, A.C.Todd and J.M.Somerville from Heriot-Watt University,
Edinburgh, UK said water injection is an essential part of many modern oilfield
development plans. The water used for water injection usually consists of some sort of
brine or from other source that already been treated. After water injection well is drilled,
water was pumped to the reservoir and then gravity will help to push the liquid into the
formation.
Figure 1: Water Injection
Source: Schlumberger
The main objective of water injection is to maintain the reservoir pressure in order to
boost hydrocarbon to the production level. It will maximize the overall recovery and
accelerating hydrocarbon production. However, there is some limitation occurred in
injection flowline which effect the flow assurance and thus limit the capacity of water

9
injection into the wellbore. The implementation of water injection will reach poor
efficiency after times due to drag problem which occurs in pipeline. According to
journal entitled Evaluation of Drag Reducing Agent for Seawater Injection System
authored by H.A.Al-Anazi from SPE said drag is a result of the resistance encountered
by flowing fluid with solid surface, such as pipe wall. It means as friction exists at the
near wall region of pipe, the energy of fluid flow will be loss. As the result, it decreases
the flow rate of water injected. Basically, the contractor built pipelines with a life
expectancy of about 20 years with wall thickness, materials and corrosion rate
calculations are taken into account. However, corrosion still occurs although some
prevention already held such as regular pigging, cathodic protection, and injecting
corrosion inhibitors and so on. As the wall thickness reduces, Maximum Allowable
Operating Pressure (MAOP) also get reduces. MAOP is the measurement of how much
pressure of the pipe wall may safely hold in normal condition. If the operating still
continues in high pressure with the wall thickness has reduced, pipeline rupture will
occur. There are 2 alternatives to solve the problems which are renewing the pipelines or
inject drag reducer. Clearly, if replacing or renew the lines, the capital expenditures
(CAPEX) will be very costly and need time to be developed. However, by injecting drag
reducer, the same amount of water injection can be pumped at a lower pressure. The
drag of the water on the pipeline is reduced and thus the pressure drop is reduced.
Basically, this project which entitled „DRA by Water Injection using Natural Polymer‟ is
conducted to study the effectiveness of Natural Polymer in reducing or minimizing the
frictional pressure loss in water pipeline. As the result, by using DRA, it will help to
increase the flow rate of water and optimize the level of production. DRA is a solution
consists of a long chain polymer which will break out then interact with the water phase
in the near wall region of the pipeline. In Malaysia, natural polymers are experiencing
abundant in its quantity. Besides that, the initial investment cost in getting the natural
polymer is cheaper than any chemical substances. This is the reason why natural
polymer should be more commercialize in oil & gas industry. The essential thing about
natural polymers, it is environmental-friendly, indeed. It has no contribution in world‟s
pollution. For instance, if natural polymer acts as DRA in water treatment process, it will

10
not give any harmful for human‟s life because it is safe to be used. Instead of it, natural
polymers also will not contribute in any damage in a pipeline such as corrosion, erosion,
and so on when it was injected because it has no harmful chemical reaction. Previously,
in order to increase the flow rate of water, more pumping powers are installed to boost
the energy of the flow. However, by installing more pumps, it required higher
operational cost and time consuming. Thus, by the application of natural polymer as
DRA, it will reduce the operational cost and at the same time it can be quickly-installed
at any existing facilities. Depending on how good the flow capacity of water will be
achieved, the characteristics of DRA are examined in order to get high efficiency of drag
reduction.

11
1.2 Problem Statement
The intention of this project is to establish the purpose of reducing the friction pressure
loss in the water injection flow line. The friction between flowing water and pipe wall
occurs because of high flow velocity in the core. Large amount of energy provided by
pumping power are lost because of the turbulence structure in flow line. In turbulent
flow, the water moves in various motions and it provides eddies to form. Eddies will
absorb the energy from the main flow and cause friction pressure loss. As the result, the
flow rate of water in the flow line will reduce. Besides that, when the friction get
increases, the surface of pipeline will damage. In particular, the expectancy of maximum
production capacity of pipeline is never similar with the earlier prediction at design
stage. The main reason of this is because of corrosion. Corrosion will decrease the wall
thickness of pipeline and will create rupture and roughness inside the pipeline. In order
to prevent fracture from occur, Maximum Allowable Operating Pressure need to be
reduces, consequently decreases the production capacity in pipeline.
Figure 2: Damage in pipeline surface
DRe
=density of solution (kg/m³)
= velocity of solution in pipeline (m/s)
D = pipe diameter (m)
Figure 3: Formula of Reynolds Number

12
In the turbulent flow, Reynolds number is larger than 4000. In the other words, Reynolds
number can be formulated as inertia force (drag) over viscous force. Drag was occurred
by the various motions of water molecules in flow line. Some of the molecules are
remain at the origin place which influenced by the inertia force. Inertia force is the
tendency in resist any changes in its motion. The static molecules will form at the
laminar sublayer which near to the pipe wall.
Figure 4: Turbulent Flow in Pipeline
Meanwhile, the molecules of flowing water will move in different direction of inertia
existed, thus it provides drag. It leads the water flows slower because the friction holds
the molecules at the buffer region. As a result, energy of the molecules at turbulent core
become reduces hence, the flow rate of water in flow line get decreases. That is why
DRA which consists of a small amount of a long chained polymer, with a very high
molecular weight is needed in water flow line.

13
1.3 Objectives of the Project
The aim of this project is to increase the performance of flowline which been reduced
because of friction pressure loss occurred due to turbulent flow. Thus, by injecting DRA
inside the flow line, it will disturb the development of turbulence structure and at the
same time absorb the energy from eddies in the flow. It will increase the capacity of
water injection and reduce the cost of pumping powers.
The objectives of this project are:
i. To investigate the effect of Solanum Tuberosum used as DRA in water flow line
ii. To determine difference of pressure drops and to calculate drag reduction
percentage
iii. To determine water flow rate due to different concentration of DRA

14
1.4 Scope of Study
This project is limited to research and experiment of a prototype aimed in evaluating the
performance of flowline. This project is involved Solanum Tuberosum as the additive of
DRA. The rheology sample test is conducted in order to obtain the characteristics of
additive which fulfill the minimum requirement of DRA. The value of density and
viscosity of additive from rheology test are needed in order to obtain Reynolds number
of the flow. The DRA is only tested in turbulent flow. In turbulent flow, friction occurs
between flowing fluid and pipe wall and it provides energy loss in main flow. Thus, by
using DRA, it will suppress eddies by absorb its energy and at the same time disturb the
degree of turbulence. As a result, friction pressure losses in pipeline become reduce and
it increases the capacity of water flow rate. The efficiency of DRA is determined by the
percentage of drag reduction and the difference of pressure drop at given concentration
of DRA and water flow rate.

15
1.5 The Relevancy of the Project
The Drag Reducing Agent application is successful and working well in Oil & Gas
industry. With injecting DRA in pipeline, it optimized pipeline capacity and increase
throughput from its baseline. Moreover, it savings on energy and operating costs from
adding the booster pump in order to increase the pipeline capacity.
By carry out this project, the effectiveness of natural polymer acts as DRA can be study
closely and observe its usefulness in the industry.
1.6 Feasibility of the Project
This project needs an experiment to be carried out in order to gain the result. The entire
project needs to be completed within the time given. It started with the objective on
determine the type of natural polymer need to be used and then to the phase of proving
Solanum Tuberosum can act as DRA in pipeline. The key of success for this project is to
follow closely the Gantt Chart and Key Milestone that already discussed earlier.

16
CHAPTER 2: LITERATURE REVIEW
2.1 Drag Reducing Agent
According to a study featured in journal entitled An Experimental Study of Drag
Reduction of Polymer Solutions in Coiled Tubing authored by Subhash N.Shah and
Y.Zhou from University of Oklahoma, said “Frictional pressure in turbulent flow can be
drastically reduced by adding small quantities of certain long chain polymers to the
solvent. This phenomenon is called drag reduction”. Generally, drag reduction was
discovered by Toms in 1949. He was investigating the mechanical degradation of high
polymer solutions in pipe flow. In turbulent flow, the collisions between water
molecules become increase and thus, smaller eddies are formed. It is easier for DRA to
suppress smaller eddies rather than larger eddies.
Figure 5: Flow in Pipeline after injecting DRA
Based on Figure 5, after injecting DRA in flow line, turbulent flow was disturbed. DRA
absorbed the energy of eddies and reduced degree of turbulence. Hence, friction pressure
loss in flow line is decreased and the capacity of water became higher. In this journal, it
focused on how polymer concentration effect on drag reduction ratio.
Friction occur at wall
surface

17
2.2 Characteristics of DRA
Figure 6: Effect of Polymer Concentration on Drag Reduction Percentage
From Figure 6, it shows polymer concentration of 40lb/Mgal produced highest drag
reduction percentage. Meanwhile, the lowest concentration which is 10lb/Mgal produced
lowest drag reduction percentage. It happened due to a low ratio between additive
concentration and degree of turbulence. For a low ratio, the additive is easy to break or
known as degradation. In this stage, the additive is not effective. That is why it shows
drastic reduction in drag reduction percentage. The concentrations of polymer give
important impact to drag reduction in order to improve capacity of water in flow line.
When Reynolds number increases from 10000 to 1000000, the degree of turbulence
increases. It can be seen that the drag reduction percentage generally increases with
increasing Reynolds number. It also can be seen that for each concentration, the %Dr
also increases with increasing Reynolds number until it reach its limitation.
18
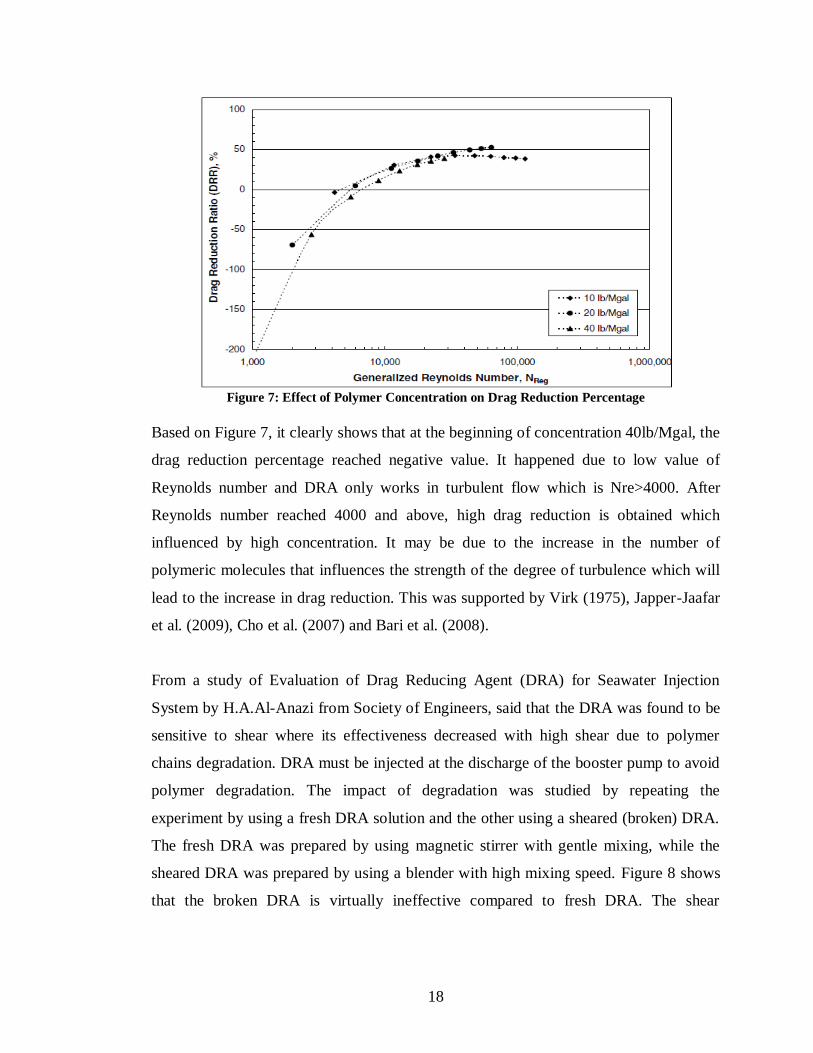
Figure 7: Effect of Polymer Concentration on Drag Reduction Percentage
Based on Figure 7, it clearly shows that at the beginning of concentration 40lb/Mgal, the
drag reduction percentage reached negative value. It happened due to low value of
Reynolds number and DRA only works in turbulent flow which is Nre>4000. After
Reynolds number reached 4000 and above, high drag reduction is obtained which
influenced by high concentration. It may be due to the increase in the number of
polymeric molecules that influences the strength of the degree of turbulence which will
lead to the increase in drag reduction. This was supported by Virk (1975), Japper-Jaafar
et al. (2009), Cho et al. (2007) and Bari et al. (2008).
From a study of Evaluation of Drag Reducing Agent (DRA) for Seawater Injection
System by H.A.Al-Anazi from Society of Engineers, said that the DRA was found to be
sensitive to shear where its effectiveness decreased with high shear due to polymer
chains degradation. DRA must be injected at the discharge of the booster pump to avoid
polymer degradation. The impact of degradation was studied by repeating the
experiment by using a fresh DRA solution and the other using a sheared (broken) DRA.
The fresh DRA was prepared by using magnetic stirrer with gentle mixing, while the
sheared DRA was prepared by using a blender with high mixing speed. Figure 8 shows
that the broken DRA is virtually ineffective compared to fresh DRA. The shear

19
degradation is associated with chain elongation. Chain degradation is observed when
shear rate increased to critical point after the drag reduction decreased drastically.
Figure 8: Drag reduction percentage as a function of Concentration for Fresh and Broken DRA
Figure 9: Pressure Drop measured across the tube with various Flow Rate of Water
Figure 9 shows the pressure drop measured across the tube of seawater as 10ppm as a
baseline at various Reynolds number. It indicates that the DRA did not reduce the
pressure drop in laminar flow (Re<3000). Meanwhile, pressure drop was decreased at
turbulent flow. For example, at Re=4851, after adding 10ppm of DRA, the pressure drop
reduced from 430 to 390 psi. It confirmed that DRA only works in turbulent flow. It also

20
can be proved based on results in Figure 10 which it shows that by using high
concentration of DRA, 40ppm in turbulent flow (Re>4000), percentage of drag
reduction increased. Meanwhile, by using high concentration of DRA in laminar flow
(Re<3000), the percentage of drag reduction are reached negative values. This is due to
increase in seawater viscosity when the DRA is added. As can be see clearly in the
figure below, the percentage of drag reduction started to decline when DRA
concentration is more than 40ppm for Re 4851 and 5390. It is due to over dosage of the
buffer zone that formed at turbulent flow case. It can be said that more drag reduction
can be achieved if the flow rate could be increased more.
Figure 10: Drag Reduction Percentage as a function of Concentration at various Reynolds number
According to Shao Xueming from Zheijiang University, drag reduction measurements of
turbulent flow are conducted by focusing on the effect of injection position of DRA, the
Reynolds number as well as the effect of polymer concentration on turbulent structure.
In this experiment, DRA was injected in two ways which are from vertically at the wall
of pipe and horizontally along the centerline of pipe. In order to measure the flow of
water injection, the measurement of flow rate also was conducted by using flow meter.
These were performed in a re-circulatory pipe system and screw pump, which avoid
strong degradation of polymer was used in order to boost the energy of water. To
determine the effect of Reynolds number on DRA, turbulent pipe flow of water and
polymer were measured in range of Re= 20000 to 35000. The amounts of drag reduction

21
for different Reynolds number are shown in Table 1, which flow rate of water is
increased. By increasing the velocity of water flowing, it will lead to the extended large
eddies in the viscous sublayer region to the buffer region. The expended larger eddies
produce increased stream wise irregular velocity in buffer region. From table, it shows
that the injection of water itself has no effect on DRA, whereas the addition of polymer
will increase drag reduction. It also shows that the injecting polymer at the centre of
pipeline is more effective rather than at the wall and the amount of drag reduction
increases with Reynolds number.
Table 1: The effect of Reynolds number, Concentration and Injecting ways On Drag Reduction
Instead of Reynolds number, concentration of polymer also plays an importance role to
drag reduction. As per table above, by injecting DRA at the centre of pipeline, the higher
concentration of polymer is, the higher mean velocity is. The total pressure gradient for
this experiment is kept constant, so the increase in velocity means that the drag in the
pipe is reduced. As stated above, 2 ways of injection position are used. For the same
concentration of polymer, injecting DRA horizontally along the centerline of pipe will
cause larger drag reduction than at the wall. It happens because the polymer solution
diffused quickly and widely when being injected at the centre and at the same time, it
can affect the large scale vortex structures which appear in the core region of pipe.
Meanwhile, the DRA which injected at wall only can suppress the small scale vortex at
sublayer region.
22
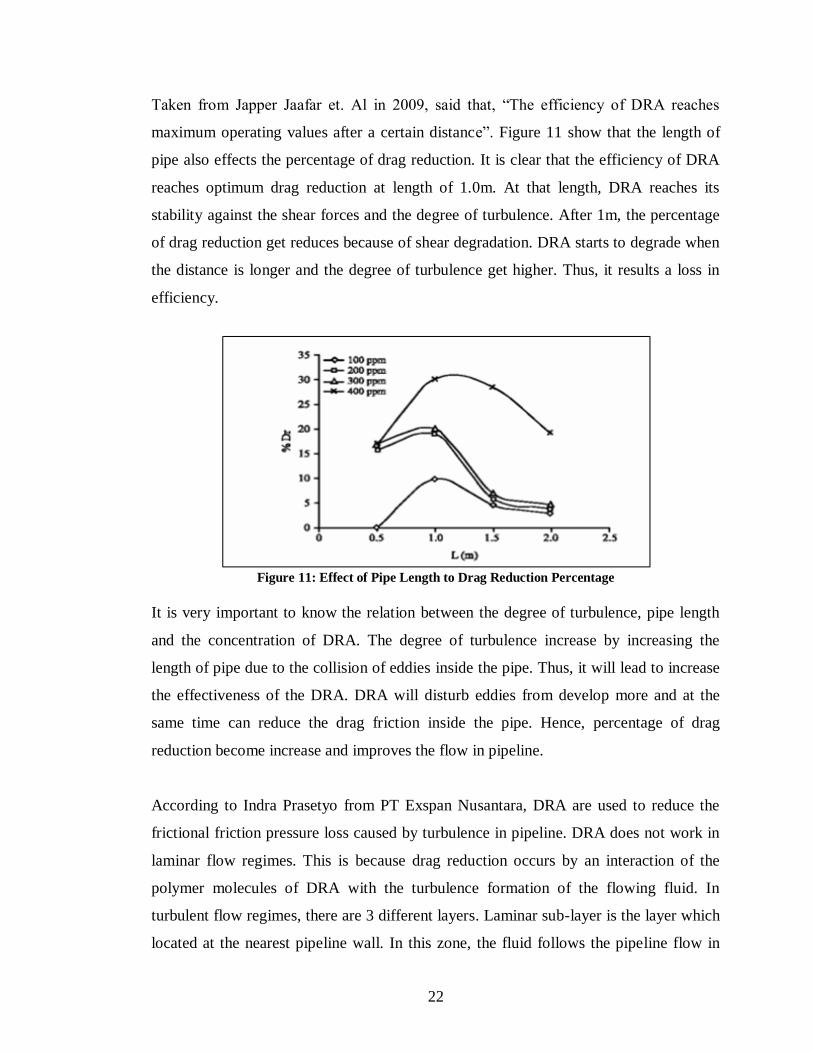
Taken from Japper Jaafar et. Al in 2009, said that, “The efficiency of DRA reaches
maximum operating values after a certain distance”. Figure 11 show that the length of
pipe also effects the percentage of drag reduction. It is clear that the efficiency of DRA
reaches optimum drag reduction at length of 1.0m. At that length, DRA reaches its
stability against the shear forces and the degree of turbulence. After 1m, the percentage
of drag reduction get reduces because of shear degradation. DRA starts to degrade when
the distance is longer and the degree of turbulence get higher. Thus, it results a loss in
efficiency.
Figure 11: Effect of Pipe Length to Drag Reduction Percentage
It is very important to know the relation between the degree of turbulence, pipe length
and the concentration of DRA. The degree of turbulence increase by increasing the
length of pipe due to the collision of eddies inside the pipe. Thus, it will lead to increase
the effectiveness of the DRA. DRA will disturb eddies from develop more and at the
same time can reduce the drag friction inside the pipe. Hence, percentage of drag
reduction become increase and improves the flow in pipeline.
According to Indra Prasetyo from PT Exspan Nusantara, DRA are used to reduce the
frictional friction pressure loss caused by turbulence in pipeline. DRA does not work in
laminar flow regimes. This is because drag reduction occurs by an interaction of the
polymer molecules of DRA with the turbulence formation of the flowing fluid. In
turbulent flow regimes, there are 3 different layers. Laminar sub-layer is the layer which
located at the nearest pipeline wall. In this zone, the fluid follows the pipeline flow in

23
laminar regime. In the center of the pipeline is the turbulent core layer. This is the
largest layer which includes eddies in random motion and also carries variation of
molecules velocity. In between of those layers lies the buffer layer. This layer is very
important because it is here where turbulence first forms. When a part of laminar
sublayer which called streak moves to the buffer region, it will begin to oscillate and
moving faster in different directions and gets closer to the turbulence core. Then, the
streak becomes unstable and creates turbulence in the core. When the streak moves
randomly, it wastes the energy and causing the drag and pressure loss. After injecting
the DRA to the turbulence of flowing fluid, it will interfere or inhibit the formation of
turbulent burst and prevent the turbulence from being formed, or reduce the degree of
turbulence. DRA works by absorb the energy of the streak and in turn, reduce the drag
and pressure loss.

24
CHAPTER 3: METHODOLOGY
3.1 The Work Flow
Literature Review
Research on:
Drag
Drag Reducing Agent (DRA)
Characteristics of good DRA
Characteristics of natural polymers
Degree of turbulence and Reynolds number
Related problems faced in oil field
Objectives of Project
Project Schedule
Identifying the experiment
Material Selection
Lab Experiment
Result and Discussion
Conclusion and
Recommendation
Model Fabrication &
Modification

25
3.2 Experimental Setup
The purpose of this experiment is to investigate the effect of variety concentration of
natural polymer used as DRA. In order to determine the effectiveness of DRA, pressure
drop along the pipeline and flow rate of water is evaluated. This experiment is conducted
in 2 ways which run the water without the DRA (acts as base case) and with the DRA.
For this experiment, the previous prototype is modified to cater the requirement of this
project. Two pressure gauges will be installed at inlet of test section (which located at
discharge of the pump) and at the outlet of flowline in order to measure the pressure
drop of water before and after adding the DRA.
The test section consists of constant diameter of single flow system which is 1-inch. This
system consists of two tanks which are storage tank and drainage tank. Storage tank will
be connected with centrifugal pump which will boost the water pass through the test
section until end at drainage tank. The injection point of DRA needs to be located after
the discharge pump because DRA cannot survive in high shear force generated by
centrifugal pump. DRA will be degraded and it will reduce its efficiency and as a result,
drag reduction will be reduced.
Without inject DRA:
After water was pump by centrifugal pump into the test section, pressure gauge at the
inlet will measure the pressure of water and same goes to pressure gauge at the outlet of
the flowline. Then, the difference of those pressures will be calculated and be as delta
P1.
With inject DRA
The procedure for this experiment is the same with the experiment of without injecting
the DRA. DRA will be injected at the discharge of pump (at injection point) after water
flow through the test section. Pressure gauges will measure the pressure of water at inlet
and outlet of the pipe. The difference of pressures will be as delta P2.

26
Below are the equipments used with the real image :
a) Storage tank to centrifugal pump
Figure 12: Storage tank to centrifugal pump
Storage tank is located on the fabricated stand with approximately at 1 meter from the
ground. The purpose is to ensure the water can flow with the mean of potential energy
by putting it higher than the inlet point of centrifugal pump. Tank connector is connected
between the storage tank and 2-inch ball valve in order to make sure the water flow from
tank to the pump. Then, ball valve is used to control the flow of water from the tank to
the pump through the clear hosepipe.
27
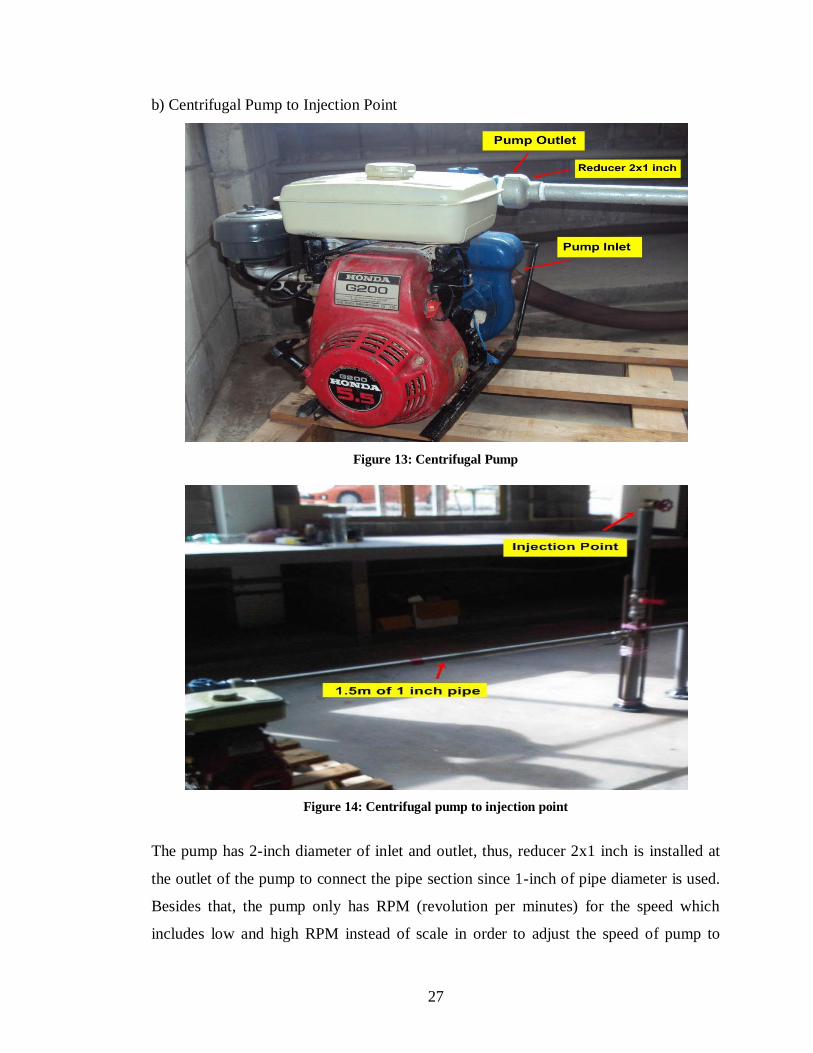
b) Centrifugal Pump to Injection Point
Figure 13: Centrifugal Pump
Figure 14: Centrifugal pump to injection point
The pump has 2-inch diameter of inlet and outlet, thus, reducer 2x1 inch is installed at
the outlet of the pump to connect the pipe section since 1-inch of pipe diameter is used.
Besides that, the pump only has RPM (revolution per minutes) for the speed which
includes low and high RPM instead of scale in order to adjust the speed of pump to

28
pump the water through the pipe section. Meanwhile, 1.5 meter of 1 inch pipe is
installed before the injection point as an entrance length in order to fully develop
velocity profile in turbulent flow. According to journal by Int. J.Chem Technol entrance
length is the length of the pipe between the start and the point where the fully develop
flow begins. It denoted by Le and is a function of Reynolds number. As for turbulent
flow, the entrance length is estimated by the equation :
Le = 50 (D)
Where pipe diameter used = 0.0254m. Thus,
Le = 50(0.0254) = 1.27m 1.5m (minimum entrance length)
c) Injection Section
Injection point is installed after the discharge of the pump. It is because, DRA cannot
survive the high shear force condition which generated by pump. DRA is very shear
sensitive and drag reducing performance could be affected when it passing through high
shear force region in pipeline system and its effectiveness reduced with high shear due
to polymer chain degradation.
Figure 15: Injection point

29
Gate valve is installed at the top of injection section in order to avoid the DRA solution
from bursting out when the pump is pumping the water in high speed. Meanwhile, ball
valve is installed to control the flow of DRA solution to enter through the test section.
d) Test Section
Test section is consists of 4 meter long straight pipe and 2 pressure gauge are installed at
the beginning and at the end of section in order to monitor the pressure drop. After the
last pressure gauge, drainage tank is located to collect the output of water and measure
the volume of it. The drainage tank can hold up approximately up to 45 liter same as
storage tank but for this experiment, the volume of water needed is 36 liter.
Figure 16: Pressure Gauge
Figure 17: Drainage Tank

30
3.3 Experimental Work
3.3.1 Viscosity & Density Reading
Before choosing the suitable DRA to be used, several types of polymers are evaluated.
After done some research about the characteristics of natural polymer to be a good DRA,
5 types of natural polymers are selected. Those polymers are been selected based on
their gel strength. Then, rheology test are conducted to analyze the content of gel
strength and viscosity of each polymer.
Sample Viscosity Gel
Strenght (lb/100ft2)
Ɵ 600
(RPM)
Ɵ 300
(RPM) μa (cp) μp (cp)
YP (lb/100ft2)
Solanum Tuberosum
25 14 12.5 11 3 4
Mung Beans
33 17 16.5 16 1 5
Turnip 12 7 6 5 2 2
Tuber stem 8 5 4 3 2 0
Banana stem
10 5 5 5 0 0
Table 2: Viscosity of Natural Polymers
From Table 2, Solanum Tuberosum is selected to be as drag reducer because it has high
value of gel strength. In fact, high gel strength can avoid poor protein degradation.
3.3.2 Concentration Preparation
Before conducting the experiment, several concentrations of Solanum Tuberosum
solution are prepared. At first, Solanum Tuberosum fruits are blended and filtered in
order to get its puree. The puree was prepared from 0.5kg of Solanum Tuberosum,
concentrated into 1 litre of distilled water solution. Then, to prepare each concentration,
the weight of Solanum Tuberosum is measure accordingly based on :

31
6101
totalDRA
DRA
VCV
VDRA = volume of DRA (gram)
CDRA = concentration of DRA
Vtotal = volume of water (constant) = 1L
Concentration
(ppm) 600 700 800 900 1000
Weight of
Solanum
Tuberosum (g)
0.6 0.7 0.8 0.9 1.0
Table 3: Concentrations of DRA
After prepare the solution, magnetic stirrer is used to stir the solution. It is to ensure the
solution is fully mixed and completely dilute. The mixing time for each solution is 1
hour. Then, density and viscosity of each concentration is measured in order to calculate
the Reynolds number which is used in tabulating all data.
Magnetic Stirrer

32
3.3.3 Conducting the experiment
Procedure:
Schematic diagram of prototype
Without injecting DRA (base case)
1. In running the experiment, the storage tank was filled with water and must
ensure it equals 36 liter. The ball valve under the storage tank was closed to
avoid the water from exit through the hosepipe.
2. After the tank reached requires volume, the pump was started and the ball valve
under the tank was opened to permit the water to flow through the test section.
Time was monitored right after water started to exit the tank.
3. Pressure at the inlet and outlet of the test section was measured by the pressure
gauge
4. Time was recorded when water filled the drainage tank until reached 36 liter.
5. The pump was turned off.
6. All data were tabulated and acts as the base case for the experiment.
With injecting DRA
1. Step 1 (base case) was repeated accordingly.
2. The solution of DRA was filled inside the injection section and ball valve below
the injection section was closed to avoid the solution enter the test section.

33
3. Step 2 (base case) was repeated.
4. The ball valve was opened to permit the DRA solution mix with flowing water.
5. Step 3, 4 and 5 (base case) were repeated accordingly.
6. All data were tabulated.
For this experiment, 5 different concentrations of DRA solution were used which are
600, 700, 800, 900 and 1000 ppm. Each run was repeated 5 times, and results with the
best repeatability was used in the analysis.

34
3.4 Equations
There are some equation involves for this experiment.
i. To calculate concentration of DRA
6101
totalDRA
DRA
VCV
ii. To calculate flow rate of water
tTime
VVolumeQFlowRate
,
,,
iii. To calculate Reynolds number
DRe
iv. To calculate entrance length
)(50 DLe
v. To calculate drag reduction percentage
100Re%
withoutDRA
withDRAwithoutDRA
P
PPductionDrag
vi. To calculate DRA efficiency
DRA
DRAC
ductionDragE
Re%
vii. To calculate flow increase
1001)%100(
100556.0
DRFI

35
3.5 Tools, Equipments and Materials
The material, tool and equipments needed specifically for the experiments which are
listed below:
1. Total of 12.25 meter of 1 inch galvanized iron steel pipe
2. 0.5 meter of 2 inch galvanized iron steel pipe
3. Two ball valve of 1 inch
4. Two ball valve of 2 inch
5. One gate valve of 2 inch
6. One 90 degree of elbow of 1 inch
7. One tank connector
8. One tee of 1X1 inch
9. One tee of 1X ½ inch
10. Two reducer of 2X1 inch
11. Two pail of 45.43 liter capacity
12. One centrifugal pump
13. Two pressure gauge with scale 0-100 psi and thread of 3/8 inch
14. 5 concentrations of DRA (Solanum Tuberosum)

36
CHAPTER 4: RESULT & DISCUSSION
4.1 Assumptions
In this project, there are several assumptions had been made because of limitations and
errors occurred during conducting the experiment. Those assumptions are made in order
to get good and accurate result.
1. Turbulent profile is fully developed.
Since the type of pipe used is galvanized iron steel, which is not transparent, thus it is
assumed that turbulent profile is developed for the first section of pipe, at 1.5 meter
long. This assumption is made based on the calculation of entrance length which is:
)(50 DLe
Where pipe diameter used = 0.0254m. Thus,
Le = 50(0.0254) = 1.27m 1.5m (minimum entrance length).
2. DRA substance is 100% dissolved in distilled water.
In preparation of DRA concentration, DRA substance is mixed with 1000ml of distilled
water and stirrer using magnetic stirrer. The mixing rate is 1 hour for each concentration.
It is assumed that by that rate, DRA solution is well mixed and no precipitation
occurred.
3. DRA solutions are totally mixed with water inside pipeline.
It is difficult to determine either DRA solution is mix well enough with water in pipeline
after injection when using galvanized pipe. Thus, it is better to assume that DRA
solution is well mixed with water right after DRA flow through the test section.

37
4.2 Graph & Discussion
Figure 18: Drag Reduction Percentage vs Concentration (ppm)
From Figure 18, it is clearly showed that percentage of drag reduction is keep increasing
from the lowest DRA concentration to the highest concentration. For 600 ppm, the value
of drag reduction percentage is reflected to 3.03% and 700 ppm of DRA concentration is
reflected to 4.85%. Meanwhile, for concentration of 800 ppm, 900 ppm and 1000 ppm
are used, the percentage of drag reduction inclined to 6.06%, 9.09% and up to 10.91%.
This occurred because when high concentration of DRA is injected to the test section, it
increased the ratio between DRA molecule and the degree of turbulence. In fact, more
DRA molecules are reacted with turbulent structure. It disturbed and reduced the degree
of turbulence and at the same time reduced the energy loss and friction pressure loss.
Thus, the drag reduction is increased due to high concentration of DRA. Meanwhile, for
a low concentration of DRA, the chain of polymer is easy to break or known as
degradation. It is due to low ratio between DRA molecules and degree of turbulence.
Thus, it reduced the performance of DRA to reduce friction pressure loss and as a result,
the percentage of drag reduction is reduced.
Drag Reduction Percentage vs Concentration (ppm)
3.03
4.85
6.06
9.09
10.91
0
2
4
6
8
10
12
600 700 800 900 1000
Concentration (ppm)
%D
r

38
Figure 19: Drag Reduction Percentage vs Reynolds Number
Refer to Figure 19, it showed that the percentage of drag reduction is increased when
Reynolds Number is increased. When the Reynolds number is increased, the percentage
of drag reduction is increased from 3.03% up to 10.91%. DRA only works in turbulent
flow which is Re > 5000. When Reynolds number is increased, the degree of turbulence
also increased. The molecules of water moved in random motion and unstable. It wasted
the energy and causing drag and pressure loss. By injecting the DRA to the flowing
water, it disturbed the formation of turbulence and absorbed the energy of it. As a result,
it reduced the friction pressure loss and increased the percentage of drag reduction.
Drag Reduction Percentage vs Reynolds Number
3.03
4.85
6.06
9.09
10.91
0
2
4
6
8
10
12
206325.8869 209549.7289 216525.9343 225623.6627 231458.7574
Reynolds Number
%D
r

39
Figure 20: Flow Rate vs Concentration
According to Figure 20, the capacity of flowing water is increased with high
concentration of DRA. Before injecting the DRA, the flow rate of water flowing from
storage tank to drainage tank is 0.002727m³/s. Meanwhile, after injecting the DRA, the
flow rate of water in increased and based on the graph, it stated that from the lowest
concentration, 600 ppm, the flow rate is 0.00277m³/s and for the highest concentration,
1000 ppm, the flow rate is 0.00310m³/s. It proved that the water flowed in short time
after injecting the DRA (in increasing concentration) at the test section. It occurred
because after DRA is injected, it inhibited the formation of turbulent burst and absorbed
the energy of the streak. Thus, it reduced drag and friction pressure loss in the pipeline.
As a result, the capacity of water is increased with the concentration of DRA.
0.0027270.00277
0.00281
0.00290
0.00303
0.00310
0.0025
0.0026
0.0027
0.0028
0.0029
0.0030
0.0031
0.0032
0 600 700 800 900 1000
Flo
w R
ate
m^
3/s
Concentration (ppm)
Flow Rate (mᶟ/s) vs Concentration (ppm)

40
Figure 21: DRA Efficiency vs Concentration
Figure 22: Flow Increase vs Concentration
From Figure 21, the highest DRA efficiency is referred to 1000 ppm which is 1.09
meanwhile the lowest DRA efficiency is goes to 600 ppm of DRA concentration which
is 0.51. According to the result, it proved that DRA with 1000 ppm is the ideal
concentration for this experiment. It is because as refer to Figure 18, it stated that 1000
ppm gives the highest value of drag reduction percentage which is 10.91%. In addition,
DRA Efficiency vs Concentration (ppm)
0.51
0.690.76
1.01
1.09
0.00
0.20
0.40
0.60
0.80
1.00
1.20
600 700 800 900 1000
Concentration (ppm)
ED
RA
Flow Increase vs Concentration (ppm)
2.80
1.73
3.54
5.44
6.63
0
1
2
3
4
5
6
7
600 700 800 900 1000
Concentration (ppm)
FI
%

41
Figure 22 which showed the relationship between flow increase and concentration of
DRA also proved that 1000 ppm is an ideal concentration of DRA and has potential to
be good DRA. It increased in pump ability of water from 1.73% up to 6.63%.

42
Comparison of Results
In this experiment, there are 2 types of natural polymer used as DRA are evaluated. This
evaluation is held in order to measure the performance of DRA in reducing the pressure
drop in pipeline and at the same time, increased the capacity of water. Basically, there
are Solanum Tuberosum and Mung Beans.
Figure 23: Drag Reduction Percentage from Comparison of Natural Polymers
According to Figure 23, the highest percentage of drag reduction is provided by Mung
Beans at 1000 ppm. It increased up to 17.58% compared to Solanum Tuberosum which
only has 10.91% as the highest percentage of drag reduction.
Drag Reduction Percentage vs Concentration (ppm)
6.06
10.3011.52
15.15
17.58
3.03
4.856.06
9.09
10.91
0
2
4
6
8
10
12
14
16
18
20
600 700 800 900 1000
DRA Concentration (ppm)
%D
r Mung Beans
Solanum Tuberosum

43
Figure 24: Comparison of Drag Reduction Percentage with commercial DRA
Besides that, comparison between Solanum Tuberosum and commercial DRA is also
conducted and the result is based on Figure 24. Although the result showed that Solanum
Tuberosum is lower than commercial DRA , but it still has potential to be as a good drag
reducer in industries after considers some adjustments and minimize the limitations
which needs more time to expand this research. Despite the DRA is raw, it is still
comparable to commercial DRA.
Drag Reduction Percentage vs Concentration (ppm)
3.03
10.91
24.24
39.39
0
5
10
15
20
25
30
35
40
45
600 1000
Concentration (ppm)
%D
r Solanum Tuberosum
Commercial DRA

44
4.3 Calculations
a) Sample calculation for concentration preparation
6101
totalDRA
DRA
VCV
VDRA = Volume of DRA needed (g)
VTotal = Total volume of distilled water (ml)
CDRA = DRA concentration
To prepare 600 ppm:
6101
1000600
mlppmVDRA
= 0.6 gram of DRA needed
b) Sample calculation for drag reduction percentage
100Re%
withoutDRA
withDRAwithoutDRA
P
PPductionDrag
To calculate drag reduction percentage for 600ppm:
%03.31005.16
165.16%
Dr
c) Sample calculation for Efficiency Factor for DRA
DRA
DRAC
ductionDragE
Re%
EDRA = Efficiency factor for DRA
CDRA = DRA Concentration

45
To calculate efficiency factor for 600 ppm:
EDRA = 100600
%03.3
= 0.51%
d) Sample calculation for Flow Increase
1001)%100(
100556.0
DRFI
FI = Flow Increase
%Dr = Percentage of Drag Reduction
To calculate FI for 600 ppm:
FI = 100103.3100
100556.0
= 1.73%

46
4.4 Limitations
In completing the experiment, there are several limitations that had influenced possible
outcome. There are:
i. Time is of the essence
It is very time constraint in order to complete the experiment especially in preparing the
samples in different concentrations. There are limited magnetic stirrers provided in lab
for all students. Thus, everyone needs to take turn in using that equipment. Besides, after
the solutions already prepared, each of it must be stirred around 1 hour to get well mixed
and dilute totally in distill water.
ii. Pump ability
The centrifugal pump consists of two different speeds which are low and high RPM.
But, when low RPM is used in pumping the water through the test section, it did not give
any reading at the outlet of test section (pressure gauge 2). It might happened because of
the length of test section already added which is from 4m to 6m. The pump is not able to
pump the water in low speed through the longer pipe. Thus, for this experiment, only
high RPM is used.

47
4.4 Errors
There are errors occurred during the experiment.
1. Systematic error
Systematic error cannot be estimated even by repeating the experiment with same
equipment. For this project, systematic error occurred when the readings of pressure
gauge is measured. It is difficult to get the readings since the needle of pressure gauge is
moved upwards and downwards repeatedly and fast. Besides that, viscometer used to
measure DRA‟s viscosity and gel strength also has difficulty to read. The reading is not
at the constant value hence, to reduce the error, the reading is measured for several times
and averaged value is taken. In running the experiment, centrifugal pump is used to
boost water through the pipeline. But, the centrifugal pump only has „low‟ and „high‟
reading for its revolution per minute (RPM).Thus, the level of energy that is delivered
from the pump is not the same for each run because the value of RPM is unknown.
2. Parallax error
Parallax error is error in reading the instrument employing a scale and pointer because
the observer‟s eye and pointer are not in a line perpendicular to the plane of the scale.
For this project, this error happened when the readings of pressure gauge are measured.
To minimize the effect of error, the averaged reading is taken.
3. Human error
This error occurred when time is taken to determine time needed to fill the tank with
water in order to get its flow rate. The stop watch is stopped when water reached 36 liter.
But, for the time being, the stop watch cannot be stopped at the same time because of the
human limitation which cannot give same reaction between brain and hand.

48
CHAPTER 5: CONCLUSION & RECOMMENDATIONS
5.1 Conclusion
After the experiment is conducted, the objective to study the performance and effect of
Solanum Tuberosum used in DRA is achieved. Although this type of natural polymer
did not shown the best performance in the percentage of drag reduction, but it can be
potential drag reducer after considering some adjustments. As mention in background
study, using DRA in water injection is a vital concept of displace the oil in reservoir
when natural energy is depleted. It will help to maintain or re-pressurized reservoir
pressure by reduce the drag friction in pipeline. Thus, friction pressure losses inside the
pipe will reduce and as a result, the capacity of water injection will increase.
Besides that, the initial investment cost in getting Solanum Tuberosum is cheaper than
any chemical substances. Thus, natural polymer should be more commercialize in oil &
gas industry. The essential thing about natural polymers, it is environmental-friendly,
indeed. It has no contribution in world‟s pollution
Overall, to accomplish this project, the significant of DRA in oil & gas industry need to
be learned and the concept of how DRA will only react in turbulence flow also how to
increase the performance of DRA in the easiest and cheapest way must be discovered.
49
5.2 Recommendations
For future continuation on this research, there have a lot of improvements need to be
done in order to minimize the errors and limitations encountered during the experiment.
Below are the recommendations for next reference:
1) Change galvanized steel pipe to transparent pipe as easier to observe condition
inside the pipeline.
2) Use more stable centrifugal pump in delivering its power which has values of its
RPM instead of „low‟ and „high‟ only.
3) Use digital scale of pressure gauge which has „average, min, max‟ reading
function in order to get accurate values.
4) Use suitable tank which has divisions as to measure volume of water inside
storage and drainage tank
5) Use more accurate injector mechanism to inject DRA right to the core of pipeline
such as nozzle with check valve rather than use tee section as injector
mechanism.
6) To ensure centrifugal pump is in good condition. No leaking occurs.
7) Add on some dye or stain in DRA solution as easier to observe either DRA is
mix well enough with water in pipeline or not.
8) Provide more options in pipe diameter instead of one diameter only.
9) Get as much as possible all the knowledge and information about this project.

50
FYP 2 GANTT CHART
Activities/ Week 1 2 3 4 5 6 7 8 9 10 11 12 13 14
Continue the work
Continue modify the prototype
Commence Rheology test for natural polymer
Drafting progress report
Prepare DRA concentrations
Commence the experiment
Measure pressure drop for base case (water only)
Measure pressure drop for each concentration of
natural polymer (water + DRA)
Prepare progress report
Submission of progress report
Submission of poster
Submission of final report
Submission of technical paper
Final oral presentation
Submission of Hard Bound Copies

51
REFERENCES
1. Xueming, S. (2002). Experimental research on drag reduction by polymer
additives in turbulent pipe flow. 80(April, 2002),
2. Al-Anazi, H. A. (2006). Evaluation of drag reducing agent (DRA) for
seawater injection system: lab and field cases.SPE 100844 (Sept, 2006),
3. Nelson, J. (2003). Optimising production using drag reducing agents in water
injection. (Oct, 2003)
4. Palsson, B. (2003). The water injection process; a technical and economic
integrated approach. 81(Part A, March 2003)
5. N.Shah, S. (2001). An experimental study of drag reduction of polymer
solutions in coiled tubing. SPE 68419(March 2001)
6. Kang, C. (1998). Effect of drag reducing agents in multiphase flow
pipelines. 120(March 1998)
7. Berge, B. K. (1996). Increased pipeline throughput using drag reducer
additives (dra); field experiences. SPE 36835(Oct, 1996)
8. Laura Thomas, Tim Burden. (2007). Heavy oil drag reducing agent (dra):
Increasing pipeline deliveries of heavy crude oil. By ConocoPhillips
Specialty Products Inc. [ viewed on 14/11/2011 ]
9. Ulli Pietsch and Brad Koberstein. (2005). Establishing parameters required
for real-time on-line drag reducing agent modelling. [ viewed on 13/12/2011 ]
10. X. Shen and A. I. Sirviente. K. Kim, M. J. Solomon. (2004, Oct 6). Effect of
macromolecular polymer structures on drag reduction in a turbulent channel
flow. 16(11), [ viewed on 21/10/2011 ]
11. R.Deveswaran* V Jhansipriya Marabathuni, S.Bharath, B.V.Basavaraj,
V.Madhavan. (2011). Studies on hibiscus esculentus mucilage as a
pharmaceutical excipient. Vol.2 (1), 8-17. [ viewed on 21/11/2011 ]
12. Ulli Pietsch and Brad Koberstein. (2005). Establishing parameters required
for real-time on-line drag reducing agent modelling. [ viewed on 13/12/2011 ]
13. AbdelSalam Al-Sarkhi. (2011). „Effect of mixing on frictional loss reduction
by drag reducing polymer in annular horizontal two-phase flows‟. [ viewed
on 1/12/2011 ]

52
14. Muhammad Aw Yong Abdullah and B. S. Olsen,. (1999, April). Tapis - new
opportunities from a maturing field. Paper presented at 1999 spe asia pacific
oil and gas conference and exhibition. [ viewed on 5/12/2011 ]
15. Subhash N.Shah and Y.Zhou, SPE (2001, March). An experimental study of
drag reduction of polymer solutions in coiled tubing. Paper presented at 2001
SPE/ICoTA Coiled Tubing Round Table [ viewed on 10/12/2011 ]
16. Dr. Nahid Sediqi. (2007, Dec 27). Effect of drag reducing agent on intake
valve deposit [ viewed on 22/11/2011 ]
17. Samuel E. Campbell, SPE, Baker Petrolite and Vladimir Jovancicevic, SPE.
(2001, February).Performance improvements from chemical drag reducers.
Paper presented at Houston, Texas 2001 SPE international symposium on
oilfield chemistry [ viewed on 24/10/2011 ]

53
APPENDIX A
EXPERIMENTAL DATA SHEET RESULT

54
A.1 Result of Experiment
PIPE
Length (m) 12.25
Pipe D (m) 0.0254
Volume Pipe (m³)
0.006207167
Area Pipe
(m²) 0.000506773
Constant 1000000
DRAINAGE TANK
Volume (l) 36
Volume (m³) 0.036
Table 4: Data of Pipeline & Drainage Tank
BASE CASE
DRA Conc. (ppm)
Time (s) P1 (psi) P2 (psi) ∆P %DR
NONE 13.2 22.5 6 16.5 NONE
Table 5: Pressure Drop of Base Case (without DRA)
DRA Conc. (ppm)
Time (s)
P1 (psi) P2
(psi) ∆P
%DR (without
DRA-with DRA)/without
DRA
600 13 22.5 6.5 16 3.03
700 12.8 22.5 6.8 15.7 4.85
800 12.4 22.5 7 15.5 6.06
900 11.9 22.5 7.5 15 9.09
1000 11.6 22.5 7.8 14.7 10.91
Table 6: Pressure Drop with DRA
COMMERCIAL DRA
DRA Conc. (ppm)
Time (s) P1 (psi) P2 (psi) ∆P %DR
600 10.5 22.5 10 12.5 24.24
1000 10.2 22.5 12.5 10 39.39
Table 7: Pressure Drop with Commercial DRA

55
Tabulated Data
HIGH RPM
DRA Vol. (g)
DRA Conc. (ppm)
µ (cp)
µ (kg/m³)
ρ (kg/m³) t Q (m³/s) V (m/s) NRE P (1) P (2) ∆P %DR EDRA FI
0.6 600 1.0 0.00067 998.95 13 0.00277 5.4644 206325.9 22.5 6.5 16 3.03 0.51 1.73
0.7 700 1.0 0.00067 998.95 12.8 0.00281 5.5498 209549.7 22.5 6.8 15.7 4.85 0.69 2.80
0.8 800 1.0 0.00067 999.95 12.4 0.00290 5.7288 216525.9 22.5 7 15.5 6.06 0.76 3.54
0.9 900 1.0 0.00067 999.95 11.9 0.00303 5.9696 225623.7 22.5 7.5 15 9.09 1.01 5.44
1.0 1000 1.0 0.00067 999.95 11.6 0.00310 6.1239 231458.8 22.5 7.8 14.7 10.91 1.09 6.63

56


![UvA-DARE (Digital Academic Repository) Turbulent drag · PDF file... with the drag reducing agent, ... Most Widely Used Drag Reducing Polymer agents [15]. Xanthan gum Polyethylene](https://img.pdfslide.us/doc/110x75/5aa65ede7f8b9a185d8e899d/uva-dare-digital-academic-repository-turbulent-drag-with-the-drag-reducing.jpg)