Embed Size (px)
Citation preview

U.S. International Trade CommissionPublication 4085 July 2009
Washington, DC 20436
Certain Passenger Vehicle and Light Truck Tires From China
Investigation No. TA-421-7

U.S. International Trade Commission
COMMISSIONERS
Shara L. Aranoff, Chairman Daniel R. Pearson, Vice Chairman
Deanna Tanner Okun Charlotte R. Lane
Irving A. Williamson Dean A. Pinkert
Robert A. Rogowsky
Staff assigned
Address all communications to Secretary to the Commission
United States International Trade Commission Washington, DC 20436
Director of Operations
Nathanael Comly, Investigator Amy Sherman, Investigator Eric Land, Industry Analyst
Ray Cantrell, Industry Analyst James Fetzer, Economist
David Boyland, Accountant William Gearhart, Attorney Steven Hudgens, Statistician
George Deyman, Supervisory Investigator

U.S. International Trade CommissionWashington, DC 20436
www.usitc.gov
Publication 4085 July 2009
Certain Passenger Vehicle and Light Truck Tires From China
Investigation No. TA-421-7


i
CONTENTS
Page
Determination . . . . . . . . . . . . . . . . . . . . . . . . . . . . . . . . . . . . . . . . . . . . . . . . . . . . . . . . . . . . . . . . . . 1Views of the Commission . . . . . . . . . . . . . . . . . . . . . . . . . . . . . . . . . . . . . . . . . . . . . . . . . . . . . . . . . 3Separate Views on Remedy of Chairman Shara L. Aranoff . . . . . . . . . . . . . . . . . . . . . . . . . . . . 39Separate and Dissenting Views of Vice Chairman Daniel R. Pearson and
Commissioner Deanna Tanner Okun . . . . . . . . . . . . . . . . . . . . . . . . . . . . . . . . . . . . . . . . . . . . 45
Part I: Introduction . . . . . . . . . . . . . . . . . . . . . . . . . . . . . . . . . . . . . . . . . . . . . . . . . . . . . . . . . . . . I-1Background . . . . . . . . . . . . . . . . . . . . . . . . . . . . . . . . . . . . . . . . . . . . . . . . . . . . . . . . . . . . . . . . . . I-1Statutory criteria and organization of the report . . . . . . . . . . . . . . . . . . . . . . . . . . . . . . . . . . . . . . I-1
Statutory criteria . . . . . . . . . . . . . . . . . . . . . . . . . . . . . . . . . . . . . . . . . . . . . . . . . . . . . . . . . . . I-1Organization of the report . . . . . . . . . . . . . . . . . . . . . . . . . . . . . . . . . . . . . . . . . . . . . . . . . . . . I-2
U.S. market summary . . . . . . . . . . . . . . . . . . . . . . . . . . . . . . . . . . . . . . . . . . . . . . . . . . . . . . . . . . I-2Summary data and data sources . . . . . . . . . . . . . . . . . . . . . . . . . . . . . . . . . . . . . . . . . . . . . . . . . . I-2Previous and related investigations . . . . . . . . . . . . . . . . . . . . . . . . . . . . . . . . . . . . . . . . . . . . . . . . I-3The subject merchandise . . . . . . . . . . . . . . . . . . . . . . . . . . . . . . . . . . . . . . . . . . . . . . . . . . . . . . . . I-3
Scope of the investigation . . . . . . . . . . . . . . . . . . . . . . . . . . . . . . . . . . . . . . . . . . . . . . . . . . . . I-3Tariff treatment . . . . . . . . . . . . . . . . . . . . . . . . . . . . . . . . . . . . . . . . . . . . . . . . . . . . . . . . . . . . I-4
Like or directly competitive domestic article . . . . . . . . . . . . . . . . . . . . . . . . . . . . . . . . . . . . . . . . I-4Physical properties and uses . . . . . . . . . . . . . . . . . . . . . . . . . . . . . . . . . . . . . . . . . . . . . . . . . . I-4Manufacturing processes . . . . . . . . . . . . . . . . . . . . . . . . . . . . . . . . . . . . . . . . . . . . . . . . . . . . . I-7
Like or directly competitive product issues . . . . . . . . . . . . . . . . . . . . . . . . . . . . . . . . . . . . . . . . . I-10The U.S. market . . . . . . . . . . . . . . . . . . . . . . . . . . . . . . . . . . . . . . . . . . . . . . . . . . . . . . . . . . . . . . I-11
U.S. producers . . . . . . . . . . . . . . . . . . . . . . . . . . . . . . . . . . . . . . . . . . . . . . . . . . . . . . . . . . . . . I-11U.S. importers . . . . . . . . . . . . . . . . . . . . . . . . . . . . . . . . . . . . . . . . . . . . . . . . . . . . . . . . . . . . . I-18U.S. purchasers . . . . . . . . . . . . . . . . . . . . . . . . . . . . . . . . . . . . . . . . . . . . . . . . . . . . . . . . . . . . I-19Apparent U.S. consumption . . . . . . . . . . . . . . . . . . . . . . . . . . . . . . . . . . . . . . . . . . . . . . . . . . . I-19
Part II: The question of rapidly increasing U.S. imports . . . . . . . . . . . . . . . . . . . . . . . . . . . . . . II-1U.S. imports . . . . . . . . . . . . . . . . . . . . . . . . . . . . . . . . . . . . . . . . . . . . . . . . . . . . . . . . . . . . . . . . . II-1U.S. imports relative to production . . . . . . . . . . . . . . . . . . . . . . . . . . . . . . . . . . . . . . . . . . . . . . . . II-4U.S. producers’ imports and purchases . . . . . . . . . . . . . . . . . . . . . . . . . . . . . . . . . . . . . . . . . . . . . II-7
Part III: The question of material injury . . . . . . . . . . . . . . . . . . . . . . . . . . . . . . . . . . . . . . . . . . . III-1U.S. capacity, production, and capacity utilization . . . . . . . . . . . . . . . . . . . . . . . . . . . . . . . . . . . III-1U.S. producers’ U.S. shipments, company transfers, and export shipments . . . . . . . . . . . . . . . . . III-6U.S. producers’ inventories . . . . . . . . . . . . . . . . . . . . . . . . . . . . . . . . . . . . . . . . . . . . . . . . . . . . . III-8U.S. employment, wages, and productivity . . . . . . . . . . . . . . . . . . . . . . . . . . . . . . . . . . . . . . . . . III-8U.S. producers’ and importers’ comments regarding whether imports of subject tires from
China have been a cause of material injury to the domestic industry . . . . . . . . . . . . . . . . . . . III-10Financial experience of U.S. producers . . . . . . . . . . . . . . . . . . . . . . . . . . . . . . . . . . . . . . . . . . . . III-12
Background . . . . . . . . . . . . . . . . . . . . . . . . . . . . . . . . . . . . . . . . . . . . . . . . . . . . . . . . . . . . . . . III-12Operations on subject tires . . . . . . . . . . . . . . . . . . . . . . . . . . . . . . . . . . . . . . . . . . . . . . . . . . . III-12Research and development expenses, capital expenditures, assets, and
return on investment . . . . . . . . . . . . . . . . . . . . . . . . . . . . . . . . . . . . . . . . . . . . . . . . . . . . . . III-18
Continued.

ii
CONTENTS
PageActual or anticipated negative effects on U.S. producers of imports of
subject tires from China . . . . . . . . . . . . . . . . . . . . . . . . . . . . . . . . . . . . . . . . . . . . . . . . . . . III-20
Part IV: The question of threat of material injury . . . . . . . . . . . . . . . . . . . . . . . . . . . . . . . . . . . IV-1The Chinese industry and market . . . . . . . . . . . . . . . . . . . . . . . . . . . . . . . . . . . . . . . . . . . . . . . . . IV-1
Producers in China . . . . . . . . . . . . . . . . . . . . . . . . . . . . . . . . . . . . . . . . . . . . . . . . . . . . . . . . . . IV-1U.S. producers’ subject tire manufacturing facilities in China . . . . . . . . . . . . . . . . . . . . . . . . IV-3Operations in China . . . . . . . . . . . . . . . . . . . . . . . . . . . . . . . . . . . . . . . . . . . . . . . . . . . . . . . . . IV-6China’s export markets . . . . . . . . . . . . . . . . . . . . . . . . . . . . . . . . . . . . . . . . . . . . . . . . . . . . . . IV-8
U.S. importers’ inventories . . . . . . . . . . . . . . . . . . . . . . . . . . . . . . . . . . . . . . . . . . . . . . . . . . . . . . IV-12US. imports after December 31, 2008 . . . . . . . . . . . . . . . . . . . . . . . . . . . . . . . . . . . . . . . . . . . . . IV-12
Import restrictions or remedies in other countries . . . . . . . . . . . . . . . . . . . . . . . . . . . . . . . . . . . . IV-13The global tire industry . . . . . . . . . . . . . . . . . . . . . . . . . . . . . . . . . . . . . . . . . . . . . . . . . . . . . . . . . IV-13
Part V: The question of the causal relationship between the alleged injury and imports . . . . V-1U.S. market penetration of imports . . . . . . . . . . . . . . . . . . . . . . . . . . . . . . . . . . . . . . . . . . . . . . . . V-1Prices and related information . . . . . . . . . . . . . . . . . . . . . . . . . . . . . . . . . . . . . . . . . . . . . . . . . . . V-3
Channels of distribution . . . . . . . . . . . . . . . . . . . . . . . . . . . . . . . . . . . . . . . . . . . . . . . . . . . . . . V-3Market segmentation . . . . . . . . . . . . . . . . . . . . . . . . . . . . . . . . . . . . . . . . . . . . . . . . . . . . . . . . V-4Supply considerations . . . . . . . . . . . . . . . . . . . . . . . . . . . . . . . . . . . . . . . . . . . . . . . . . . . . . . . V-7Demand considerations . . . . . . . . . . . . . . . . . . . . . . . . . . . . . . . . . . . . . . . . . . . . . . . . . . . . . . V-9Substitutability issues . . . . . . . . . . . . . . . . . . . . . . . . . . . . . . . . . . . . . . . . . . . . . . . . . . . . . . . V-12Factors affecting purchasing decisions . . . . . . . . . . . . . . . . . . . . . . . . . . . . . . . . . . . . . . . . . . V-12Comparisons of domestic products and subject imports . . . . . . . . . . . . . . . . . . . . . . . . . . . . . V-15Comparisons of domestic products and nonsubject imports . . . . . . . . . . . . . . . . . . . . . . . . . . V-17Comparisons of imports from China and nonsubject imports . . . . . . . . . . . . . . . . . . . . . . . . . V-18Elasticity estimates . . . . . . . . . . . . . . . . . . . . . . . . . . . . . . . . . . . . . . . . . . . . . . . . . . . . . . . . . V-18Factors affecting pricing . . . . . . . . . . . . . . . . . . . . . . . . . . . . . . . . . . . . . . . . . . . . . . . . . . . . . V-21Pricing practices . . . . . . . . . . . . . . . . . . . . . . . . . . . . . . . . . . . . . . . . . . . . . . . . . . . . . . . . . . . V-21Price data . . . . . . . . . . . . . . . . . . . . . . . . . . . . . . . . . . . . . . . . . . . . . . . . . . . . . . . . . . . . . . . . . V-23Lost sales and lost revenues . . . . . . . . . . . . . . . . . . . . . . . . . . . . . . . . . . . . . . . . . . . . . . . . . . . V-36
Part VI: U.S. producers’ efforts to compete and requested relief . . . . . . . . . . . . . . . . . . . . . . . VI-1Efforts by U.S. producers to compete . . . . . . . . . . . . . . . . . . . . . . . . . . . . . . . . . . . . . . . . . . . . . . VI-1Requested import relief . . . . . . . . . . . . . . . . . . . . . . . . . . . . . . . . . . . . . . . . . . . . . . . . . . . . . . . . . VI-1
Appendixes
A. Federal Register notices . . . . . . . . . . . . . . . . . . . . . . . . . . . . . . . . . . . . . . . . . . . . . . . . . . . . . . . A-1B. Hearing witnesses . . . . . . . . . . . . . . . . . . . . . . . . . . . . . . . . . . . . . . . . . . . . . . . . . . . . . . . . . . . . B-1C. Summary data . . . . . . . . . . . . . . . . . . . . . . . . . . . . . . . . . . . . . . . . . . . . . . . . . . . . . . . . . . . . . . . C-1D. Supplemental questionnaire responses on market segmentation . . . . . . . . . . . . . . . . . . . . . . . . D-1
Note.--Information that would reveal confidential operations of individual concerns may not be publishedand therefore has been deleted from this report. Such deletions are indicated by asterisks.

1 19 U.S.C. § 2451(b)(1). 2 For purposes of this investigation, certain passenger vehicle and light truck tires are defined as new pneumatictires, of rubber, from the People’s Republic of China, of a kind used on motor cars (except racing cars) andon-the-highway light trucks, vans, and sport utility vehicles, provided for in subheadings 4011.10.10, 4011.10.50,4011.20.10, and 4011.20.50 of the Harmonized Tariff Schedule of the United States ("HTS"). The HTS subheadingsare provided for convenience and customs purposes; the written description of the product under investigation isdispositive. 3 Vice Chairman Daniel R. Pearson and Commissioner Deanna Tanner Okun made a negative determination. 4 Vice Chairman Daniel R. Pearson and Commissioner Deanna Tanner Okun, having made a negativedetermination regarding market disruption, were not eligible to vote on a proposed remedy.
UNITED STATES INTERNATIONAL TRADE COMMISSION
Investigation No. TA-421-7
CERTAIN PASSENGER VEHICLE AND LIGHT TRUCK TIRES FROM THE PEOPLE’SREPUBLIC OF CHINA
DETERMINATION
On the basis of information developed in the subject investigation, the United States InternationalTrade Commission (Commission) determines, pursuant to section 421(b)(1) of the Trade Act of 1974,1
that certain passenger vehicle and light truck tires2 from the People’s Republic of China are beingimported into the United States in such increased quantities or under such conditions as to cause orthreaten to cause market disruption to the domestic producers of like or directly competitive products3 (74 FR 30321, June 25, 2009).
RECOMMENDATION ON PROPOSED REMEDY4
Chairman Shara L. Aranoff and Commissioners Charlotte R. Lane, Irving A. Williamson, andDean A. Pinkert propose that the President, for a three-year period, impose a duty, in addition to thecurrent rate of duty, on imports of certain passenger vehicle and light truck tires from China as follows: 55 percent ad valorem in the first year, 45 percent ad valorem in the second year, and 35 percent advalorem in the third year. They further propose that, if applications are filed, the President direct the U.S.Department of Labor and the U.S. Department of Commerce to provide expedited consideration of TradeAdjustment Assistance for firms and/or workers that are affected by subject imports.
BACKGROUND
The Commission instituted this investigation effective April 24, 2009 following receipt of apetition filed by the United Steel, Paper and Forestry, Rubber, Manufacturing, Energy, Allied Industrialand Service Workers International Union, Pittsburgh, PA. Notice of the institution of the Commission’sinvestigation and of the scheduling of a public hearing to be held in connection therewith was given byposting a copy of the notice on the Commission’s website (www.usitc.gov) and by publishing the notice inthe Federal Register of April 29, 2009 (74 FR 19593). The hearing was held on June 2, 2009 inWashington, DC; all persons who requested the opportunity were permitted to appear in person or bycounsel.


1 19 U.S.C. § 2451(b)(1). 2 Vice Chairman Daniel R. Pearson and Commissioner Deanna Tanner Okun dissent and make a negativedetermination. They join section III (background and scope of investigation), section IV (statutory framework),section V (domestic industry). 3 For purposes of clarity, throughout these views we have used the term “subject imports” to refer to the importsfrom China of certain passenger vehicle and light truck tires that fall within the scope of this investigation asdescribed in the Commission’s notice of investigation published in the Federal Register. We generally use the term“domestically produced tires” to refer to tires produced by U.S. tire manufacturers that are like the subject imports.
3
VIEWS OF THE COMMISSION
VIEWS ON MARKET DISRUPTION
I. Determination
Pursuant to section 421(b)(1) of the Trade Act of 19741 and on the basis of the informationobtained in this investigation, the Commission determines that certain passenger vehicle and light trucktires from China are being imported into the United States in such increased quantities or under suchconditions as to cause market disruption to the domestic producers of certain passenger vehicle and lighttruck tires.2
II. Introduction
The petition in this investigation was filed on April 20, 2009, by the United Steel, Paper andForestry, Rubber, Manufacturing, Energy, Allied Industrial and Service Workers International Union(“USW”). Ten domestic producers comprise the domestic industry. The responding parties to theinvestigation are the American Coalition for Free Trade in Tires; American Pacific Industries Inc. andFullrun Tyre Corp. Ltd.; Cooper Tire & Rubber Company; GITI Tire (China) Investment Co., Ltd., andGITI Tire (USA) Ltd.; Les Schwab Warehouse Center, Inc.; the Subcommittee of Tire Producers of theChina Chamber of Commerce of Metals, Minerals, and Chemicals Importers and Exporters; and TBCCorporation.
The domestic like product consists of tires used on passenger vehicles and light trucks. Such tiresare generally mounted onto the wheels of passenger cars, sport utility vehicles, vans, and light trucks;tires of a kind mounted on the wheels of racing cars are excluded from this investigation. All passengervehicle and light truck tires sold in the U.S. market must meet standards established by the NationalHighway Traffic Safety Administration and must meet U.S. Department of Transportation markingrequirements. The passenger vehicle and light truck tires imported from China and those that areproduced domestically can be used interchangeably.3
III. Background and scope of investigation
The imported passenger vehicle and light truck tires from China that are the subject of thisinvestigation consist of the following:
new pneumatic tires, of rubber, from China, of a kind used on motor cars (except racing cars) andon-the-highway light trucks, vans, and sport utility vehicles, provided for in subheadings

4 74 Fed. Reg. 19593 (Apr. 29, 2009). 5 Confidential Staff Report (CR) at I-3, Public Staff Report (PR) at I-2. Citations to the CR include revisionsmade pursuant to Memorandum INV-GG-052 (June 16, 2009). 6 Petition at Annex-7-8. 7 CR at I-5, n. 7, PR at I-3, n. 7. 8 Petition at Annex-7. 9 Petition at Annex-8. 10 CR at I-4, PR at I-2. 11 CR/PR at IV-1. 12 CR at V-6, PR at V-5. 13 CR at I-4, PR at I-2. 14 19 U.S.C. § 2451(b)(1).
4
4011.10.10, 4011.10.50, 4011.20.10, and 4011.20.50 of the Harmonized Tariff Schedule of theUnited States.4
The tires at issue in this investigation are generally mounted onto the wheels of passenger cars,sport utility vehicles, vans, and light trucks.5 Passenger vehicle and light truck tires overlap substantiallyin terms of size, as measured by the tire’s rim diameter code, and the vast majority have rim diametersranging in size from 14 to 20 inches.6 Specifically excluded from the scope of this investigation, inaddition to pneumatic racing car tires, are new pneumatic tires of a kind used on medium, large, andheavy trucks and buses; new pneumatic tires of a kind used on agricultural or forestry vehicles andmachines and construction or industrial handling vehicles or machines; new pneumatic tires of a kindused on aircraft, bicycles, motorcycles, trailers, all-terrain vehicles, and vehicles for turf, lawn andgarden, and golf applications; pneumatic tires that are not new, including recycled and retreaded tires; andnon-pneumatic tires, such as solid rubber tires.7 Such tires generally are produced in different plants thanpassenger vehicle and light truck tires.8 Most tires for buses and medium and larger trucks have rimdiameters greater than 20 inches, while tires for specialty trailers and similar vehicles have rim diametersof 12 inches or less.9
The Commission received information from the 10 firms that accounted for virtually all U.S.production of subject tires during 2008.10 The Commission sent foreign producers’ questionnaires to 75firms identified in proprietary Customs data; those firms are believed to account for at least 85 percent ofexports to the United States of subject tires from China from 2004 to 2008. The Commission receivedresponses from 36 of those firms.11 To gather additional information about market segmentation, theCommission also sent a supplemental questionnaire to all U.S. producers of subject tires and to the largest26 importers of subject tires from China, and responses were received from all U.S. producers and 25 ofthe largest importers.12 U.S. import data used by the Commission are based on official Commercestatistics.13
IV. Statutory framework
The determination that the Commission must make is set out in section 421(b)(1)14 of the TradeAct, which states in part that the Commission, upon the filing of a petition or receipt of a request orresolution, shall promptly conduct an investigation –

15 19 U.S.C. § 2451(c)(1). 16 19 U.S.C. § 2451(d).
5
to determine whether products of the People’s Republic of China are being imported intothe United States in such increased quantities or under such conditions as to cause orthreaten to cause market disruption to the domestic producers of like or directlycompetitive products.
This standard is satisfied if the following conditions are met –
(1) there is market disruption or the threat of market disruption to domesticproducers of the like or directly competitive products; and
(2) imports from China are in such increased quantities or under such conditions asto cause or threaten to cause such market disruption.
The term “market disruption” is defined in section 421(c)(1)15 to exist –
whenever imports of an article like or directly competitive with an article produced by adomestic industry are increasing rapidly, either absolutely or relatively, so as to be asignificant cause of material injury, or threat of material injury, to the domestic industry.
Thus, the following conditions must be satisfied to warrant a finding of market disruption –
(1) imports of the subject product from China are increasing rapidly, eitherabsolutely or relatively;
(2) the domestic industry is materially injured, or threatened with material injury;and
(3) such rapidly increasing imports are a significant cause of the material injury orthe threat of material injury.
Section 421(d)16 provides that the Commission, in determining whether market disruption exists,shall consider objective factors, including –
(1) the volume of imports of the product which is the subject of the investigation;(2) the effect of imports of such product on prices in the United States for like or
directly competitive articles; and(3) the effect of imports of such product on the domestic industry producing like or
directly competitive articles.
Section 421(d) further provides that the presence or absence of any of these three factors “is notnecessarily dispositive of whether market disruption exists.”
V. Domestic industry
Section 421(c) defines the domestic industry in terms of the producers of “like or directlycompetitive” products. In making its determination under section 421(c), the Commission follows a two-

17 See Circular Welded Non-alloy Steel Pipe From China, Inv. No. TA-421-6, USITC Pub. 3807 (October 2005)at 7, citing earlier decisions. 18 Trade Reform Act of 1974, Report of the Committee on Finance, Rept. No. 93-1298, 93rd Cong., 2d Sess.(1974). The Committee report states that “‘like’ articles are those which are substantially identical in inherent orintrinsic characteristics (i.e., materials from which made, appearance, quality, texture, etc.), and ‘directlycompetitive’ articles are those which, although not substantially identical in their inherent or intrinsic characteristics,are substantially equivalent for commercial purposes, that is, are adapted to the same uses and are essentiallyinterchangeable therefor.” Id. at 122. 19 Circular Welded Non-alloy Steel Pipe From China, Inv. No. TA-421-6, USITC Pub. 3807 (October 2005) at 7,citing earlier decisions. 20 Id. 21 Id. 22 Id. 23 Petitioner’s pre-hearing brief at 6. 24 Petitioner’s pre-hearing brief at 6-8.
6
step process of first determining what constitutes the product like or directly competitive with the importssubject to the investigation and then identifying the producers of that product (the domestic industry).17
A. Like or directly competitive domestic article
(1) The statutory framework and Commission practice
When assessing what constitutes the like or directly competitive product, the Commission appliesthe definitions of “like or directly competitive” in the legislative history of what is now section 202 of theTrade Act18 and considers such factors as (1) the physical properties of the article, (2) its customstreatment, (3) its manufacturing process (i.e., where and how it is made), (4) its uses, and (5) themarketing channels through which the product is sold.19 If the Commission finds that there is domesticproduction of a like product, the Commission has not found it necessary to look further and determinewhether there is also domestic production of directly competitive products.20 The Commission considersthe decision regarding the like or directly competitive product to be a factual determination.21
After identifying the like or directly competitive goods, the Commission then determines whetherthere are clear dividing lines between the domestic goods and thus whether there are one or severaldomestic products like (or directly competitive with) the imported goods.22
(2) Arguments of the parties
Petitioner and respondents appear to be in general agreement as to the definition of the like ordirectly competitive product and agree that there is one domestic industry.
Petitioner asserts that domestic passenger vehicle and light truck tires are like the subject importsand that there is one “like” domestic product – passenger vehicle and light truck tires.23 Petitioner arguesthat this is supported by information relating to the five factors that the Commission traditionallyexamines and has provided a factor-by-factor analysis in its pre-hearing brief.24
Respondents in general agree with petitioner’s assertion that there is one “like” domestic product,domestic passenger vehicle and light truck tires. Although respondents argue that competition between

25 Respondent Subcommittee of Tire Producers of the China Chamber of Commerce of Metals, Minerals andChemical Importers and Exporters and the China Rubber Industry Association (hereafter Subcommittee of ChinaTire Producers) describes Tier 1 tires as consisting of “flag brands” (such as Bridgestone, Goodyear, and Michelin),Tier 2 tires as consisting of “secondary brands” (such as the former U.S. flag brands BF Goodrich, Uniroyal, andGeneral and foreign brands), and Tier 3 tires as consisting of private brands and lower level “associate” brandsowned by major producers. It asserts that the Tier 1 and Tier 2 tires command pricing premiums as compared withTier 3 economy tires. Pre-hearing brief of Subcommittee of China Tire Producers at 16-17. 26 Hearing tr. at 360-61 (Ms. Trossevin). In response to a question from Commissioner Okun, Ms. Trossevin,speaking on behalf of the American Coalition for Free Trade in Tires, stated: “[t]here is no argument here that theseare separate like products, so it’s not surprising you don’t see the bright lines” (tr. at 360); “attenuated competition isrecognized by the Commission as a concept within a single like product” (tr. at 360-61); and “[s]o what we aretelling you is yes, you have one like product, no bright line. But you do have these three major market segments”(tr. at 361). See also post-hearing brief of GITI Tire (China) Investment Co., Ltd., and GITI Tire (USA) Ltd.(hereafter “GITI Tire”) at 5: “[t]he distinctions between these tiers are not as clear and sharp as the distinctionbetween holding a contract to supply a line of tires to an OEM and selling tires to a distributor for retail sale. . . . Ifthe different tiers of replacement tires were that clearly distinguishable, respondents would be making a like productargument in this case. Instead, the same ‘like product’ is divided into three tiers based in significant part on brandequity.” 27 Pre-hearing brief of the American Coalition for Free Trade at 3. 28 See pre-hearing brief of GITI Tire at 3. See also post-hearing brief of GITI Tire, at 5, where GITI Tire assertsthat the distinction between tires produced for the OEM market and those produced for the replacement market issharper than that between tires in the three tiers. GITI Tire, however, does not argue that tires produced for theOEM market are a separate like product or that the domestic tires produced for the OEM market are not “like” thesubject imports. 29 Federal Register of April 29, 2009, 74 F.R. 19593.
7
the imported and domestic tires is attenuated, with the domestic product consisting primarily of “Tier 1”and “Tier 2” tires and the subject imports consisting primarily of “Tier 3” tires,25 they do not argue thatthere are three like products.26 One respondent, however, argues that the “like” domestic product is not“directly competitive” with the subject imports,27 and another respondent argues that the subject importsdo not compete with U.S. tires in the OEM market.28
(3) Analysis
After considering the factors the Commission traditionally applies (i.e., physical properties,customs treatment, production processes and facilities, uses, and marketing channels), includingadditional information and arguments with respect to these factors, we find that domestically producedpassenger vehicle and light truck tires are like the imported passenger vehicle and light truck tires fromChina described in the Notice of Investigation. We also find that the various types and sizes of domesticpassenger vehicle and light truck tires are part of a continuum, with no clear dividing lines between them.
We begin our analysis by examining the imported product. Our Notice of Investigation describesthe imported product as follows:
new pneumatic tires, of rubber, from China, of a kind used on motor cars (except racing cars) andon-the-highway light trucks, vans, and sport utility vehicles, provided for in subheadings4011.10.10, 4011.10.50, 4011.20.10, and 4011.20.50 of the Harmonized Tariff Schedule of theUnited States.29
30 CR at I-10, PR at I-7; and Petitioner’s pre-hearing brief at 6-7. 31 See, e.g., Berra testimony, tr. at 370, stating that Community Wholesale Tire has private brand Hercules tires inits warehouse in the same sizes, lines, and quality as tires made by Cooper in plants in both the United States andChina. 32 CR at I-9, PR at I-6. 33 See, e.g., petition at Annex 2; petitioner’s posthearing brief, Exh. 21 (Consumer Report, Tires and Car Care,downloaded June 5, 2009). 34 CR at I-6, PR at I-4. 35 Supplier Business, “The Tire Report,” at 9, 19-20, 55-56, attached as Exhibit 18 to petitioner’s pre-hearingbrief, also cited in the CR at I-15, PR at I-10-11. See also CR at I-10-12, PR at I-7-9. 36 Petition at Annex-6-7, listing domestic plants in which both passenger vehicle and light truck tires are made onthe same equipment and with the same workers and noting domestic plants in which non-subject tires are produced.
8
Physical properties. The evidence indicates that the physical properties of the domesticpassenger vehicle and light truck tires and subject imports are substantially identical. They are producedlargely from the same basic raw materials (e.g., natural and synthetic rubber, carbon black, oils, etc.) andhave the same basic components (e.g., inner liner, body ply, sidewall beads, apex, belt package, tread, andcushion gum).30 The evidence shows that both domestic producers and importers ship a relatively fullrange of passenger vehicle and light truck tires.31 Domestic and imported tires sold in the U.S. marketmust meet the same National Highway Traffic Safety Administration standards and be marked inaccordance with U.S. Department of Transportation requirements.32 Tires are produced in a range of sizesto match the wheel size of the passenger vehicle or light truck, however, which is generally determined bythe vehicle manufacturer. Tires of a given size are also manufactured in a variety of designs to meetcustomer performance preferences such as long tread wear (which may involve use of a harder rubber inthe tread), better road grip (which may involve use of a softer rubber in the tread but result in faster treadwear and shorter tire life), and superior handling in winter weather (which may involve tread designs withwider and deeper grooves).33
Customs treatment. The subject tires are classifiable under HTS subheadings 4011.10.10,4011.10.50, 4011.20.10, and 4011.20.50.34
Manufacturing process. The evidence indicates that the domestic product and the subjectimports are manufactured through the same processes. An estimated 99 percent of tires are producedusing a more or less conventional process, which begins with the mixing of specific chemicals (naturalrubber, synthetic rubber, carbon black, and other chemicals) to form various rubber compounds (e.g., thetread is made from one compound, the carcass from another, and the sidewalls from a third). Thecompounds are then combined with the steel cord and textiles when appropriate, and the whole is formedinto a specific shape (a “green” tire). The green tire is then cooked (cured) under pressure at about 200degrees centigrade (which leads to a non-reversible chemical change in the compound) to form the hard,resilient type of rubber found in a finished tire. Depending on the ingredients used in the variouscompounds, the finished tire can provide different properties, including good rolling resistance, superbgrip, and so forth. Chinese tires are built on equipment purchased from Western equipment producers. Many of the leading tire producers use proprietary technology in producing their brands of tires, whetherin China, the United States, or third countries.35 Virtually all domestic producers that manufacture thesubject tires produce both passenger vehicle and light truck tires in the same production facilities usingthe same production equipment and production-related workers.36

37 CR at V-20, PR at V-15. 38 CR at I-28, PR at I-19. 39 CR/PR Table V-2. 40 Trade Reform Act of 1974, Report of the Committee on Finance, Rept. No. 93-1298, 93rd Cong., 2d Sess.(1974) at 122. Our finding here includes the full range of tire sizes covered by HTS subheading 4011.10.10,including tires having a rim diameter greater than 18 inches as described in HTS statistical heading 4011.10.10.70. In its prehearing brief, respondent Fullrun Tyre Corp. argues, among other things, that petitioner meant to excludesuch tires from the investigation. Pre-hearing brief of Fullrun Tyre Corp., Ltd. at 2. We regard the petition and theCommission’s scope of investigation as covering these larger rim diameter tires. They fall within subheading4011.10.10 of the HTS and are not among the tire products petitioner asked to be excluded. Moreover, they areidentified as passenger car tire sizes in the 2009 Tire and Rim Association report included in Appendix B of thepetition. Accordingly, our domestic like product finding includes tires falling within this description. 41 The evidence in the record does not support a finding that there are clear dividing lines among sizes and typesof domestic passenger vehicle and light truck tire products, and no party made such an argument. Our finding hereof no clear dividing lines is supported by responses to a supplemental Commission questionnaire relating tosegmentation in the replacement tire market. Although the responses provide some evidence that the replacementmarket can be divided into three categories/segments (or tiers), the responses identified brand and price as theprimary bases for the differentiation, not physical characteristics, uses, manufacturing process, customs treatment, ormarketing channels. Of the 15 responding firms that believe the replacement market is segmented, all 15 describedcategory 1 as consisting of major, flagship, or premium brands; 14 described category 2 as consisting of secondary,associate, or foreign producer brands; and 13 described category 3 as private label, mass-market, lesser knownbrands, or non-branded. Most responding firms agree on the specific brands that are in category 1, but there is lessagreement as to what is included in category 2 and category 3. CR at V-6-7, PR at V-56 and CR/PR Table D-1. Asthe summary of respondents’ arguments above makes clear, they argue that we should find that the domestic productis “like” the subject imports and that there is one like product. Their arguments with respect to segmentation in thereplacement tire market relate to competition between the subject imports and the domestic tires. Our views with
(continued...)
9
Uses. The evidence indicates that the domestic product and the subject imports have the sameuses. At least 80 percent of responding producers, importers, and purchasers indicated that domesticallyproduced tires and the subject imports from China are at least “frequently” used interchangeably, and amajority of each group said that they are “always” used interchangeably.37
Marketing channels. With respect to the replacement market, the evidence indicates that thedomestic and imported tires are primarily sold to warehousing distributors, who in turn sell to consumingcontractors or end users.38 In 2008, U.S. producers reported that 82.3 percent of their U.S. shipments oftires were to the replacement market and the remaining 17.7 percent were to original equipmentmanufacturers, and U.S. importers reported that 95.0 percent of their U.S. shipments of the subjectimports from China were to the replacement market and the remaining 5.0 percent were to originalequipment manufacturers.39
(4) Conclusions
In view of the similarities between the imported and domestically produced passenger vehicle andlight truck tires in physical properties, customs treatment, manufacturing process, uses, and marketingchannels, we find that domestically produced passenger vehicle and light truck tires are “like” the subjectimports in that they are “substantially identical in inherent or intrinsic characteristics (i.e., materials fromwhich made, appearance, quality, texture, etc.).”40 We also find that the various sizes and types of “like”domestic tires, including tires produced for the replacement and OEM markets, are part of a continuum ofproducts.41 42

41 (...continued)respect to the competition issue respondents raise are explained in detail in the causation section of these views. 42 As indicated above, two respondents argue that the subject imports and domestic products, although “like” eachother, are not “directly competitive” with each other. They argue that (1) the subject imports are sold mostly in thereplacement market and do not compete directly with domestic tires sold in the OEM market and (2) the subjectimports are principally sold in a different segment of the replacement market than the subject domestic tires and arenot directly competitive with them. Although we need not reach this issue, having found that the subject domestictires are “like” the subject imports from China, we nevertheless note that there is a definition of “directlycompetitive” in the legislative history of the Trade Act of 1974. It states that “‘directly competitive’ articles arethose which, although not substantially identical in their inherent or intrinsic characteristics, are substantiallyequivalent for commercial purposes, that is, are adapted to the same uses and are essentially interchangeabletherefor.” Trade Reform Act of 1974, Report of the Committee on Finance, S. Rep. No. 1298, 93rd Cong., 2d Sess.,at 122 (1974). Respondents do not frame their argument in terms of this definition, nor do they claim that thedomestic and imported subject tires are not substantially identical. The information in the record summarized aboveclearly shows that the subject domestic and imported tires are adapted to the same uses and are essentiallyinterchangeable. 43 CR/PR Table I-2.
10
In view of the above, we find, based on the record, that domestic passenger vehicle and lighttruck tires are like the subject imports from China and that there is one like product.
B. The domestic industry
Neither section 421 nor its legislative history defines the term “domestic industry.” The term,however, is defined in other statutory authorities. Section 202(c)(6)(A)(i) of the Trade Act (19 U.S.C. §2252(c)(6)(A)(i)) defines the term “domestic industry” to mean –
with respect to an article, the domestic producers as a whole of the like or directly competitivearticle or those producers whose collective production of the like or directly competitive articleconstitutes a major proportion of the total domestic production of such article.
In previous section 421 investigations, the Commission, having found domestic production of alike product, has found the domestic industry to consist of the domestic firms and workers producing thatproduct.
In the current investigation, the Commission identified 10 domestic producers of passengervehicle and light truck tires43 and collected usable financial and other data from all firms. We find thatthe operations of those 10 firms, and their workers, constitute the domestic industry.
VI. Rapidly increasing imports
A. Statutory framework
The first of the three statutory criteria for finding market disruption is that subject imports fromChina “are increasing rapidly, either absolutely or relatively.” The statute suggests that the rapid increaseshould be recent or continuing, as opposed to in the distant past. Section 421 does not otherwise define“rapidly increasing.”
44 Petitioner’s pre-hearing brief at 9-10. 45 Petitioner’s pre-hearing brief at 11. 46 Pre-hearing brief of the Subcommittee of China Tire Producers at 8-9. 47 Pre-hearing brief of GITI Tire at 11-12. 48 Pre-hearing brief of the American Coalition for Free Trade in Tires, at 19-20. 49 In terms of quantity, the subject imports from China increased from 14.6 million tires in 2004 to 20.8 million in2005, 27.0 million in 2006, 41.5 million in 2007, and 46.0 million in 2008. In terms of value, they increased from
(continued...)
11
B. Arguments of the parties
The parties disagree with respect to whether subject imports are increasing rapidly. Citing data inthe Commission’s report, petitioner asserts that subject imports from China are increasing rapidly in bothabsolute and relative terms. Petitioner notes that (1) imports of the subject tires from China increased 215percent by volume and nearly 300 percent by value during the period of investigation (2004-2008); (2)the rapid increase in subject imports has been both recent and continuing; (3) in percentage terms thesubject imports have enjoyed double-digit increases every year since 2004; and (4) the subject importshave increased by more than 70 percent since 2006.44 Petitioner further notes, based on data in theCommission’s report, that subject imports increased by 22 percentage points relative to domesticproduction and more than 12 percentage points relative to apparent domestic consumption during theperiod examined.45
Respondents make various arguments to the effect that imports of the subject tires from China arenot increasing rapidly. The Subcommittee of China Tire Producers asserts that the increase has been“gradual,” with the largest increase occurring from 2006 to 2007, when there was a shortage in the U.S.replacement market due to the exit of U.S. producers from the Tier 3 economy segment of the market. The Subcommittee further argues that the increase in subject imports from 2007 to 2008 was “only 11percent” and that the subject imports actually decreased by 14.7 percent in the first quarter of 2009 ascompared to the first quarter of 2008.46 Respondent GITI Tire asserts that the rate of increase “plunged”in 2008 as a result of the economic downturn and reduced levels of driving and that the increase inimports “abated” in the year preceding the filing of the petition and does not constitute the “spike” inimports the statute was intended to address.47 The American Coalition for Free Trade asserts that none ofthe three scenarios for finding rapidly increasing subject imports that the Commission identified in BrakeDrums and Rotors is present in this investigation (i.e., a relatively sharp increase in one year, a steady,less dramatic increase over two or three years, or a rapid upswing after subject imports have fluctuated upand down). Instead, the Coalition asserts that there was a small annual increase from 2004 to 2006, aslightly higher increase in 2007, and then a small increase again in 2008. The Coalition also asserts thatincreases in subject imports from China in relative terms are derived from a small base and thus cannot beviewed as “sharp” or “dramatic.”48
C. Analysis
In deciding whether the increasing rapidly test is met, we look to the increase and rate of increasein subject imports and focus on recent increases in subject imports. We find that the test is satisfied andthat the subject imports are increasing rapidly in both absolute and relative terms.
In absolute terms, imports of the subject tires from China increased throughout the period ofinvestigation and were the highest, in terms of both quantity and value, in 2008, at the end of the period.49

49 (...continued)$453.3 million in 2004 to $691.9 million in 2005, $931.7 million in 2006, $1.493 billion in 2007, and $1.788 billionin 2008. CR/PR at Table C-1. 50 CR/PR at Table C-1. 51 CR/PR at Table C-1. 52 The ratio of subject imports to U.S. production rose from 6.7 percent in 2004 to 10.0 percent in 2005, 14.6percent in 2006, 23.0 percent in 2007, and 28.7 percent in 2008. CR/PR at Table II-2. The ratio of subject importsto U.S. apparent consumption increased from 4.7 percent in 2004 to 6.8 percent in 2005, 9.3 percent in 2006, 14.0percent in 2007, and 16.7 percent in 2008. CR/PR at Table V-1. 53 CR/PR at Table II-2. 54 CR/PR at Table V-1. 55 We also note that one respondent asserts, in support of its claim that the subject imports are not increasingrapidly, that the subject imports declined in actual terms during the first quarter of 2009. The data the Commissioncompiled and relied upon in this investigation, however, did not include first quarter 2009 data because a relativelycomplete data series for that period would not have been available in time for use in this investigation. The firstquarter 2009 import data also are of no probative value in determining whether the subject imports are increasingrapidly in relative terms in the absence of a data series that includes first quarter 2009 data on U.S. production andU.S. apparent consumption. Thus, consideration of first quarter 2009 import data alone would not change ourfinding that imports of the subject imports from China are increasing rapidly, both absolutely and relatively.
12
The quantity of subject imports rose by 215.5 percent between 2004 and 2008, by 53.7 percent between2006 and 2007, and by 10.8 percent between 2007 and 2008.50 The value of subject imports rose evenmore rapidly, increasing by 294.5 percent between 2004 and 2008, by 60.2 percent between 2006 and2007, and by 19.8 percent between 2007 and 2008.51
Both the ratio of subject imports to U.S. production and the ratio of subject imports to U.S.apparent consumption rose throughout the period examined, and both ratios were at their highest levels ofthe period in 2008.52 The ratio of subject imports to U.S. production increased by 22.0 percentage pointsbetween 2004 and 2008, with the two largest year-to-year increases occurring at the end of the period in2007 and 2008.53 The ratio of subject imports to U.S. apparent consumption increased by 12.0 percentagepoints during the period examined, with the two largest year-to-year increases also occurring at the end ofthe period in 2007 and 2008.54
We do not agree with respondents that the increases in subject imports from China during theperiod examined were “gradual” or “small,” or that subject imports had “abated” by the end of the period. Rather, we find that the subject imports increased, both absolutely and relatively, throughout the periodby significant amounts in each year and, as stated above, were at their highest levels at the end of theperiod in 2008. Whether viewed in absolute or relative terms, and whether viewed in terms of theincrease from 2007 to 2008 alone or the increase in the last two full years (or even the last three years),the increases were large, rapid, and continuing at the end of the period – and from an increasingly largebase.55
In view of the above, we find that the first statutory criterion for finding market disruption – thatsubject imports are increasing rapidly – is fully satisfied.

56 Section 771(7)(A); 19 U.S.C. § 1677(7)(A). 57 Trade Reform Act of 1974, Senate Report No. 93-1298, 93rd Cong., 2nd Sess., reprinted in 1974 U.S.C.C.A.N.7186, 7343-44. 58 See, e.g., Certain Welded Non-alloy Steel Pipe From China, Inv. No. TA-421-6, USITC Pub. 3807 (October2005) at 15, citing earlier decisions. 59 See, e.g., Certain Welded Non-alloy Steel Pipe From China, Inv. No. TA-421-6, USITC Pub. 3807 (October2005) at 15-16, citing earlier decisions.
13
VII. Material injury
A. Statutory framework
The second statutory criterion for finding market disruption is whether the domestic industry ismaterially injured or threatened with material injury. Neither section 421 nor its legislative historydefines “material injury” or “threat,” identifies the economic factors to be considered, or expressly adoptsor references any definitions, factors, or Commission practice under other statutory authorities that theCommission should apply or look to for guidance. The term “material injury,” however, appears in bothsection 406 of the Trade Act of 1974 and Title VII of the Tariff Act of 1930. Title VII of the Tariff Actof 1930 defines “material injury” to mean “harm which is not inconsequential, immaterial, orunimportant.”56 Section 406 does not define “material injury,” but its legislative history contrasts theterm with the “serious” injury referred to in section 201:
the market disruption test is intended to be more easily met than the serious injury tests insection 201. . . .[T]he term “material injury” in section 406 is intended to represent alesser degree of injury than the term “serious injury” standard employed in section 201.57
In the absence of express direction in section 421, the Commission has found that “materialinjury” in section 421 cases represents a lesser degree of injury than “serious injury” under section 202 ofthe Trade Act.58 This lesser degree of injury applies to the analysis of both present injury and threat ofinjury. The Commission also has found it appropriate, in analyzing present material injury, to consider allrelevant economic factors that have a bearing on the state of the industry, including the three broadfactors in section 202(c)(1)(A) relating to the idling of productive facilities, the inability of firms tooperate at a reasonable level of profitability, and unemployment or underemployment. In addition, theCommission has considered other relevant economic factors, such as production, shipments, sales,inventories, capacity and capacity utilization, market share, employment, wages, productivity, profits,capital expenditures, and research and development expenditures. It has not viewed any single factor asdispositive and has considered all relevant factors within the context of the relevant business cycle andconditions of competition that are distinctive to the affected industry.59
B. Arguments of the parties
The parties disagree as to whether the material injury criterion is satisfied, with petitioner arguingthat the domestic industry is materially injured and threatened with further material injury andrespondents arguing that it is not.
Petitioner argues that the domestic industry has experienced significant idling of productivefacilities during the period examined and cites the closing of four plants, as well as declines in production
60 Petitioner’s pre-hearing brief at 12-13. 61 Petitioner’s pre-hearing brief at 15. 62 Petitioner’s pre-hearing brief at 18-19. 63 Petitioner’s pre-hearing brief at 38. 64 Petitioner’s pre-hearing brief at 39. 65 Pre-hearing brief of Subcommittee of China Tire Producers at 10-12. 66 Pre-hearing brief of GITI Tire at 16-19.
14
capacity and production.60 Petitioner asserts that the industry is unable to operate at a reasonable level ofprofitability, noting that the industry’s operating income and operating margins declined from positivenumbers to losses.61 In addition, petitioner notes that the industry has experienced significantunemployment and underemployment, with a loss of 4,000 jobs since 2004 and the projected loss of anadditional 3,000 jobs in 2009 due to announced plant closings. Petitioner also cites other fallingindicators, including declining shipments, industry market share, industry hours worked, and wagespaid.62 With respect to threat of material injury, petitioner points out the increased capacity in China toproduce the subject tires, the decrease in the share of tire production in China that is shipped to thedomestic Chinese market, and declines in capacity utilization in China, all of which contributed to thesignificant underutilized capacity that is evident from 2006 to 2008.63 Petitioner also cites responses toCommission questionnaires indicating that tire producers in China plan to increase capacity by 19.1million tires in 2009 and by an additional 3.5 million tires in 2010, and to increase exports to the UnitedStates by 1.32 million tires in 2009.64
Respondents assert that the domestic industry is not materially injured or threatened with materialinjury. They argue that, when viewed in the context of the business cycle and compared with otherindustries impacted by the general economic climate, the industry is not experiencing material injury. Intheir view, the industry is undergoing a positive restructuring having nothing to do with imports, and thisrestructuring will leave the industry more efficient and profitable when the recession ends. Theycharacterize the restructuring as involving the shift of domestic production from Tier 3 (economy) tires tohigher performance, higher value-added tires in Tier 1 and Tier 2, and the relocation of Tier 3 tireproduction to Mexico and other lower-cost countries, including China.65
Respondents further claim that even with the economic downturn and reduced U.S. driving in2008, seven of the top 11 tire manufacturers, including U.S. producers Bridgestone and Continental,experienced increased global sales during 2008. In their view, the domestic industry achieved theseresults by using imports from China as part of a long-term strategic business plan to improve profitability. They contend that the domestic industry’s results were even more favorable in 2007. Respondents notethat while some domestic producers were closing older tire plants producing for the mass market, otherdomestic producers were adding new production for market niches that focus more on brand equity andhigher value; they cite, in particular, Toyo’s new plant that opened in 2005 and was later expanded,Kumho’s announcement in January 2008 that it will build a plant in Georgia, and Continental’s andPirelli’s announcement of new U.S. plant investments and production line expansions.66
C. Finding and analysis
For the reasons set forth below, we find that the domestic industry producing passenger vehicleand light truck tires is materially injured.
(1) Overview of the domestic industry

67 CR at I-16 , PR at I-11 and CR/PR Table I-2. 68 CR at III-14, PR at III-12. 69 CR/PR at Table V-2. 70 CR/PR at Table V-1. 71 CR at V-12, PR at V-9. 72 Two of the plants were closed by Continental in 2006, one was closed by Bridgestone in 2006, and one wasclosed by Goodyear in 2007. CR/PR at Table I-3. Michelin reported capacity reductions at its U.S. plants in 2005,2006, and 2007, and *** increase in 2008; Cooper reported *** increase in capacity in 2005, *** decline in 2006,and *** decline in 2007; and Yokohama reported capacity reductions in 2007 and 2008. CR/PR at Table III-1. 73 CR/PR at Table I-3. 74 CR/PR at Table I-3.
15
An indicated above, the domestic industry producing the types of tires at issue in this caseconsists of 10 domestic producers. The Commission collected financial and other data from *** of thesefirms on their U.S. operations for the period 2004-2008. The U.S. producers of such tires range fromlarge multinational companies with global production and sales and varying levels of vertical integrationto smaller producers with only domestic operations. In 2008, U.S. producers manufactured such tires in28 plants, with most of these plants producing the tires with dedicated equipment, machinery, andworkers.67 Four U.S. producers (Bridgestone, Cooper, Goodyear, and Michelin) account for *** percentof cumulative U.S. sales.68 In 2008, approximately 82 percent of the domestic shipments of U.S.producers went to the replacement market, and the remaining shipments went to original equipment (newcar and light truck) manufacturers (OEMs).69 Domestic producers collectively manufacture a full range ofstyles and sizes of passenger vehicle and light truck tires, which are sold in various price ranges.
Demand for passenger vehicle and light truck tires depends on changes in the numbers of newpassenger vehicles and light trucks produced in the United States, changes in the numbers of existingpassenger vehicles and light trucks that need replacement tires, and changes in the total number of milesdriven. U.S. apparent consumption fluctuated during the period examined, but was highest in 2004 andlowest in 2008.70 Demand for OEM tires declined during 2008 due to decreased passenger carproduction. Demand for replacement market tires also declined during 2008 because of a decrease inmiles traveled, consumers’ desire to get more miles out of existing tires, and the weak economy.71
(2) Analysis of factors
We find that the domestic industry producing the subject tires is materially injured. As explainedbelow, the data show a continuous decline over the period examined in U.S. producers’ domesticcapacity, production, and shipments. The data also show continuous declines in the number of workersemployed in the industry, the number of hours they worked and the amount they earned. All of theseindicators were at their lowest levels in 2008, as were the industry’s financial results.
U.S. producers’ average production capacity fell throughout the period examined, due largely tothe closures in 2006 and 2007 of four plants and other reductions in capacity.72 Three more plants areslated to be closed in 2009.73 The four plants that were closed had a combined capacity of 43.4 milliontires a year.74 The decline in capacity caused by these closings and capacity reductions was offset only insmall part by the opening of a new, relatively small U.S. plant by Toyo in 2005 and expansions at several

75 CR at I-20-I-25, PR at I-15-18; CR at III-1 to III-7, PR at III-1 to III-6; CR/PR at Table III-1. The annualcapacity of the Toyo plant is *** million tires, well below the capacity of 43.4 million tires of the four plants thatclosed in 2006 and 2008. CR/PR at Table I-3. In 2004, Cooper announced it would make capital equipmentinvestments in its plants that would increase annual capacity by more than 2.9 million tires. Toyo reported that ***and announced in May 2007 that it would expand the plant’s capacity to 3.3 million tires annually by 2009. CR at I-20-25, PR at I-15-18. Pirelli reported increases in capacity in each year of the period examined, but its U.S.production was relatively small throughout the period. After reporting *** decline in capacity in 2007 as comparedto 2006, Bridgestone reported *** increase in capacity in 2008. CR/PR at Table III-1. 76 CR/PR at Table C-1. U.S. producers’ capacity declined from 226.8 million tires in 2004 to 222.9 million tiresin 2005, 215.2 million tires in 2006, 196.3 million tires in 2007, and 186.4 million tires in 2008. Id. 77 U.S. producers’ capacity utilization was at its highest during the period examined in 2004, at 96.3 percent. Capacity utilization then fell to 93.2 percent in 2005 and 85.9 percent in 2006 (the lowest level of the period), rose to91.9 percent in 2007, and fell again to 86.0 percent in 2008. CR/PR at Table C-1. 78 CR/PR at Table C-1. U.S. producers’ production declined from 218.4 million tires in 2004 to 207.8 milliontires in 2005, 184.8 million tires in 2006, 180.3 million tires in 2007, and 160.3 million tires in 2008. Id. 79 CR/PR at Table C-1. U.S. producers’ shipments declined from 194.7 million tires in 2004 to 181.8 million tiresin 2005, 163.8 million tires in 2006, 155.7 million tires in 2007, and 136.8 million tires in 2008. Id. 80 CR/PR at Table C-1. We do not regard U.S. producers’ inventories as a meaningful indicator of the domesticindustry’s condition in view of the fact that U.S. producers generally produce subject tires in response to orders anddo not hold significant inventories. ***.
16
plants.75 U.S. producers’ average annual capacity fell by 17.8 percent from 226.8 million tires in 2004 to186.4 million tires in 2008. Nearly 75 percent of this decline (28.8 million tires) occurred in the last twoyears of the period examined,76 reflecting in large part the plant closures and capacity reductions notedabove.
Notwithstanding the decrease in capacity, U.S. producers’ capacity utilization trended downwardduring the period examined and was lower in 2007 and 2008 than in either 2004 or 2005, prior to theplant closures. U.S. producers’ capacity utilization reached its lowest level in 2006, the year in whichthree plants closed. Capacity utilization rose in 2007, but to a level that was still below the 2004 and2005 levels, and then fell sharply in 2008 almost to the 2006 level.77
U.S. producers’ production and shipments also declined in each year of the period examined andwere at their lowest levels in 2008. Production declined by 26.6 percent from 218.4 million tires in 2004to 160.3 million tires in 2008. The largest year-to-year percentage decline in U.S. producers’ productionoccurred in 2008 (11.1 percent), while the largest year-to-year decline in actual volume occurred in2006.78 U.S. producers’ U.S. shipments fell by 29.7 percent from 194.7 million tires in 2004 to 136.8million tires in 2008, with the largest decline occurring between 2007 and 2008, when such shipments fellby 12.1 percent from 155.7 million tires to 136.8 million tires.79
U.S. producers’ inventories were moderate throughout the period, although the quantitiesfluctuated during the period examined. U.S. producers’ ending inventories initially rose between 2004and 2005, and then fell in 2006 to their lowest level of the period examined; they rose again in 2007 and2008. U.S. producers’ ending inventory quantity in 2008 of 21.7 million tires was below the levelsreported in 2004 (22.0 million tires) and 2005 (22.8 million tires). Inventories as a percentage of totalshipments, however, were at their highest level for the period at the end of 2008.80
U.S. employment as measured by the number of U.S. production and related workers (PRWs)declined each year during the period examined, as did the number of hours worked. Both were at their

81 CR/PR at Table C-1. The number of U.S. PRWs declined from 36,411 in 2004 to 35,595 in 2005, 34,037 in2006, 31,842 in 2007, and 31,243 in 2008. Id. 82 CR/PR at Table C-1. The number of hours worked declined from 76.0 million in 2004 to 73.6 million in 2005,69.7 million in 2006, 67.2 million in 2007, and 63.1 million in 2008. Id. 83 Wages paid by U.S. producers declined from $1.79 billion in 2004 to $1.78 billion in 2005, $1.76 billion in2006, $1.65 billion in 2007, and $1.57 billion in 2008, or by 12.5 percent between 2004 and 2008, 6.3 percentbetween 2006 and 2007, and an additional 5.0 percent between 2007 and 2008. CR/PR at Table C-1. 84 Wages paid by U.S. producers were $23.61 per hour in 2004 and rose to $24.19 per hour in 2005 and $25.29per hour in 2006. Hourly wages then fell to $24.61 per hour in 2007 and rose slightly (by 1.2 percent) to $24.91 in2008. CR/PR at Table C-1. 85 CR/PR at Table C-1. U.S. producers’ productivity was at its highest level of the period examined, 2.9 tires perhour, in 2004. It then fell to 2.8 tires per hour in 2005 and 2.6 tires per hour in 2006. Productivity rose slightly in2007 to 2.7 tires per hour, but then fell to 2.5 tires per hour in 2008, the lowest level of the period. 2004 and 2008,productivity fell by 11.5 percent. Id. 86 *** firms reported data for 2004 and 2005, and *** reported data for 2006, 2007, and 2008. CR III-14, PR III-12 and CR/PR at Table III-7. 87 CR/PR at Table C-1. 88 CR/PR at Table III-7. U.S. producers reported total operating income of $256.2 million in 2004 and $165.5million in 2005, an operating loss of $114.5 million in 2006, operating income of $507.2 million in 2007, and anoperating loss of $262.8 million in 2008. Id.
17
lowest level of the period in 2008. U.S. producers’ productivity fluctuated, but was also at its lowestlevel in 2008. The number of U.S. PRWs declined by 14.2 percent from 36,411 in 2004 to 31,243 in2008. The largest one-year decline occurred in 2007, reflecting the closing of three plants in 2006;however, the number of PRWs continued to fall in 2008.81 Hours worked by PRWs similarly fell eachyear during the period examined and by 17.0 percent between 2004 and 2008. The largest one-yeardecline occurred between 2007 and 2008, when the number of hours worked fell by 6.1 percent.82 Totalwages paid declined in each year during the period examined,83 and, although hourly wages increasedthrough 2006, they fell in 2007 and remained below the 2006 level in 2008.84 U.S. producers’productivity, as measured in tires produced per hour, fluctuated during the period examined, but was at itslowest level of the period in 2008.85
U.S. producers’ reported operating income on their domestic passenger vehicle and light trucktire operations86 was highest in 2007, the only year during the period examined when the increase in theunit value of net sales exceeded the unit cost of goods sold. Operating income was lowest in 2008, whenU.S. producers overall operated at a loss.87 The number of producers reporting operating losses rangedfrom three to seven during the period examined, with the lowest number reporting operating losses in2007, and the highest number reporting operating losses in 2006. Six firms reported operating losses in2008. All firms reported decreases in operating income or increases in operating losses in 2008 ascompared to 2007.88
U.S. producers’ R&D expenses and capital expenditures fluctuated within relatively narrowranges during the period examined, and both trended upwards as the domestic producers sought to

89 CR at I-20-I-25, III-4-III-7, PR at I-15-I-18, III-4-III-6 and CR/PR Table III-8. 90 CR/PR at Table III-8. Industry R&D expenses increased from $270.7 million in 2004 (the lowest level of theperiod) to $296.2 million in 2005, fell to $288.6 million in 2006, rose to $307.1 million in 2007 (the highest level ofthe period), and then declined slightly to $306.7 million in 2008. Id. 91 CR/PR at Table III-8. Industry capital expenditures increased from $550.8 million in 2004 (the lowest level ofthe period) to $688.2 million in 2005, fell to $576.5 million in 2006, and rose to $597.4 million in 2007 and $729.3million in 2008. Id. 92 19 U.S.C. § 2451(c)(2). 93 Section 406(e)(2)(B)(ii), 19 U.S.C. § 2436(e)(2)(B)(ii). 94 Omnibus Trade and Competitiveness Act of 1988, House Conf. Report No. 100-576, 100th Cong., 2nd Sess.,reprinted in 1988 U.S.C.C.A.N. 1547, 1724.
18
modernize their facilities and increase efficiency.89 R&D expenses were at their highest level in 2007,90
and capital expenditures were at their highest level in 2008.91 In summary, we find that the domestic industry producing passenger vehicle and light truck tires
is materially injured. Virtually all the industry indicators declined during the period examined. U.S.producers’ capacity, production, shipments, number of U.S. PRWs and hours worked, productivity, andfinancial performance were all at their lowest levels of the period in 2008. U.S. producers’ capacityutilization, which was at its lowest in 2006, nearly equaled that level in 2008. Four plants were closedduring the period examined, and in light of the current conditions, U.S. producers have announced plansto close three more plants in 2009. Only two indicators, R&D expenses and capital expenditures, appearto have increased toward the end of the period.
VIII. Significant cause
A. Statutory framework
The third statutory criterion for finding market disruption is whether the rapidly increasingimports are a significant cause of material injury or threat of material injury. The term “significant cause”is defined in section 421(c)(2) of the Trade Act of 1974 to mean “a cause which contributes significantlyto the material injury of the domestic industry, but need not be equal to or greater than any other cause.”92 Section 406 of the Trade Act uses the same causation test and definition.93 The legislative history ofsection 406 describes the significant cause standard as follows:
Under this standard, the imports subject to investigation need not be the leading or mostimportant cause of injury or more important than (or even equal to) any other cause, solong as a direct and significant causal link exists. Thus, if the ITC finds that there areseveral causes of the material injury, it should seek to determine whether the importssubject to investigation are a significant contributing cause of the injury or are such asubordinate, subsidiary or unimportant cause as to eliminate a direct and significantcausal relationship. . . . 94
Section 421(d) includes a list of three factors that the Commission is required to consider indetermining whether market disruption exists and that relate to the Commission’s causation analysis:
(1) the volume of imports of the product which is the subject of the investigation; (2) the effect of imports of such product on prices in the United States for like or directly
competitive articles; and

95 19 U.S.C. § 2451(d). 96 19 U.S.C. § 2436(e)(2)(C). 97 Section 771(7)(B)(i) of the Tariff Act of 1930, 19 U.S.C. § 1677(7)(B)(i). 98 Petitioner’s pre-hearing brief at 20-23. 99 Petitioner’s pre-hearing brief at 28-29. 100 Petitioner’s pre-hearing brief at 30-33. 101 Petitioner’s pre-hearing brief at 33-34. 102 Petitioner’s pre-hearing brief at 36. 103 Petitioner’s pre-hearing brief at 36.
19
(3) the effect of imports of such product on the domestic industry producing like or directlycompetitive articles.95
The presence or absence of any of these factors is not necessarily dispositive of whether market disruptionexists. The three factors are similar to a list of factors in section 406(e)(2)(C) of the Trade Act of 197496
and parallel the criteria in Title VII of the Tariff Act of 1930 that the Commission must consider indetermining whether a domestic industry is injured by reason of dumped or subsidized imports.97
B. Arguments of the parties
Petitioner argues that rapidly increasing imports from China are a significant cause of materialinjury or the threat of material injury to the domestic industry. It contends that the subject imports aresignificant and have increased their market share at the direct expense of the domestic industry, citingdata from the Commission’s report showing overall changes in market share and responses to purchaserquestionnaires.98 Petitioner disputes respondents’ claims that U.S. tire producers voluntarily abandonedthe lower-priced tier of the U.S. market in favor of foreign production. Instead, petitioner asserts thatlow-cost imports from China drove down prices and profitability to such an extent that domesticproducers could no longer compete, and those producers were forced to close the plants they could nolonger operate profitably.99
Petitioner further argues that the imported and domestic tires are highly substitutable and that thesubject imports are underselling domestic tires by significant margins and suppressing domestic prices.100 Petitioner asserts that the Commission’s purchaser questionnaire responses show the extent to whichdomestic producers’ sales have been displaced by subject Chinese imports and notes that there is a ***.101 Petitioner also maintains that the subject imports are having a significant adverse impact on the domesticindustry, citing domestic plant closings, reductions in domestic capacity and production, and declines inshipments, sales, market share, employment, net sales, gross profit and operating profit during the periodexamined.102 Petitioner also claims that the increased share of the U.S. market taken by Chinese importsduring the period examined has been entirely at the expense of U.S. producers, noting that imports fromother principal foreign suppliers have either declined or remained flat and have significantly higheraverage unit values than imports from China.103
According to respondents, imports from China are not a significant cause of material injury orthreat of material injury to the domestic industry. They present four basic arguments: (1) the main reasonwhy Chinese imports have entered the U.S. market is to fill the void left after U.S. tire producers

104 See, e.g., pre-hearing brief of the Subcommittee of China Tire Producers at 14; post-hearing brief of GITI Tireat 10; pre-hearing brief of the American Coalition for Free Trade in Tires at 6-7; and post-hearing brief of LesSchwab Warehouse Center at 2. 105 See, e.g., pre-hearing brief of the Subcommittee of China Tire Producers at 14; and post-hearing brief of theAmerican Coalition for Free Trade in Tires at 18-20. 106 See, e.g., pre-hearing brief of the Subcommittee of China Tire Producers at 14. 107 See, e.g., pre-hearing brief of GITI Tire at 23, 28-33, citing the following as circumstances affecting U.S. tireproduction: the current recession, the contraction in the OEM tire market, sharp increases in raw material costs andraw material shortages, automation for increased productivity, imports from non-subject countries, higher gasolineprices resulting in less driving, strikes and labor actions, high legacy costs of U.S. tire producers, and other factorssuch as equipment restraints. 108 Pre-hearing brief of GITI Tire at 34-35, discussing the Commission’s decision in Certain Brake Drums andRotors From China, Inv. No. TA-421-3, USITC Pub. 3622, August 2003. 109 Pre-hearing brief of Les Schwab Warehouse Center at 8-10. 110 Post-hearing brief of American Pacific Industries, Inc., at 6-7, citing Suramerica de Aleaciones Laminadas,C.A. v. United States, 17 C.I.T. 146 (1993). 111 CR at I-7, PR at I-4. 112 CR at I-9, PR at I-6.
20
voluntarily decided to reduce or eliminate their U.S. production of economy (Tier 3) replacement tires;104
(2) competition between U.S. produced tires and the subject imports is attenuated, with the subjectimports competing principally in the Tier 3 segment of the replacement market, not in the highperformance Tier 1 and Tier 2 segments or the OEM market;105 (3) because of this attenuated competition,subject Chinese imports have had little, if any, effect on the volume and price of tires in market segmentsin which they are not present and thus little if any effect on U.S. producers;106 and (4) there are severalfactors other than subject imports, including the recent state of the economy, that have adversely affectedU.S. tire production.107
Respondents further argue that the facts in this investigation are similar to those in Brake Drumsand Rotors, in which the Commission made a negative determination;108 they say that no marketdisruption can be found when the U.S. producers allegedly affected by the Chinese imports largely ***import restrictions or have any plans to make adjustments to their operations if relief is provided;109 andthat, given the limited extent of U.S. producers’ support for the petition, the Commission should make anegative determination in line with the reasoning of the U.S. Court of International Trade in theSuramerica case.110
C. Finding
For the reasons stated below, we find that the rapidly increasing imports of passenger vehicle andlight truck tires from China are a significant cause of material injury to the domestic passenger vehicleand light truck tire industry.
D. Conditions of competition
All passenger vehicle and light truck tires have the same basic components and the same basicfunction,111 and domestically produced as well as imported passenger vehicle and light truck tires sold inthe United States must meet certain minimum Federal performance and marking requirements.112 Theyare manufactured in a range of sizes to meet the specifications of vehicle manufacturers, however, and

113 CR at I-8-I-14, V-20, PR at I-5-I-10, V-16 and CR/PR Table V-6. 114 CR at V-20, PR at V-15-16. 115 CR/PR at Table V-2. 116 CR/PR at Table V-2. 117 The supplemental questionnaire relating to segmentation in the replacement tire market that the Commissionsent to domestic tire producers and to certain importers of the subject tires from China framed the questions andresponses in terms of “categories” rather than “tiers.” The Commission report for that reason generally uses the term“category” and refers to three categories. Respondents, however, generally use the term “tier” in their briefs andrefer to three tiers. For purposes of consistency with the Commission report, we use the term “category” in theseviews except when summarizing respondents’ arguments, but we regard the terms “category” and “tier” as havingsubstantially the same meaning. 118 Each firm that received a questionnaire was asked to place its shipments/purchases into the three categories asit defined or perceived them. The Commission did not impose a definition on the responding firms. 119 INV supplemental questionnaire responses. 120 Tr. at 360-61 (Trossevin). 121 Tr. at 368 (Berra). In response to a question from Commissioner Williamson, Mr. Berra (president ofCommunity Wholesale Tire, Inc., testifying on behalf of the American Coalition for Free Trade in Tires) said thefollowing: “in our area there is still substantial production of tier three tires in the U.S. Cooper Tire and Rubber
(continued...)
21
they also vary somewhat in raw material inputs and technology that may impart different performancecharacteristics relating to tire wear, vehicle handling, and performance in certain road conditions.113 Boththe Chinese and U.S. producers manufacture a broad range of tire sizes and styles and variousperformance characteristics, and the subject tires and U.S. tires are generally used interchangeably in theU.S. market.114
Passenger vehicle and light truck tires are principally sold in two markets: the OEM market andthe replacement market. Chinese and U.S. producers sell in both markets.115 The replacement market isby far the more important market for both groups of producers in terms of the volume of sales, but isrelatively more important for Chinese producers. In 2008, 17.7 percent of U.S. producers’ U.S.shipments were to the OEM market, with the remaining 82.3 percent to the replacement market. For thesubject imports from China, 5.0 percent of shipments to the U.S. market in 2008 were to the OEMmarket, with the remaining 95.0 percent to the replacement market. The share shipped to the OEMmarket by U.S. producers declined each year during the period examined, while the share of subjectimports from China shipped to the OEM market increased irregularly and was at its highest in 2006 at 7.3percent.116
Information in the record indicates that tires sold in the replacement market fall into threecategories (or “tiers”)117 of tires based on brand and price, but there are no clear dividing lines amongcategories and there is no consensus among producers, importers, and purchasers as to how to define thecategories, particularly as to the tires that fall into categories 2 and 3. Responses to a supplementalCommission questionnaire show that there are significant U.S. shipments of U.S.-produced tires in allthree categories, with shipments in category 1 the largest, shipments in category 3 the second largest, andshipments in category 2 the smallest.118 U.S. shipments of the subject tires from China fall into all threecategories, with the largest share falling into category 3, the second largest share falling into category 2,and a very small share falling into category 1.119 In addition, counsel for one respondent observed at theCommission’s public hearing that there are no bright lines among the categories,120 and there wasdisagreement among respondents’ witnesses at the hearing about which brands fell into which category.121

121 (...continued)Company is very active in that end of the business still. And the other manufacturers are in it to a very small degree. Much smaller degree.” See also Berra testimony, tr. at 370, stating that Community Wholesale Tire has privatebrand Hercules tires in its warehouse in the same sizes, lines, and quality as tires made by Cooper in plants in boththe United States and China. But see testimony of Ross Kogel, president of Tire Wholesalers Company, Inc.,testifying on behalf of GITI Tire, tr. at 369, stating that he regarded the private brands produced by Cooper as fitting“more into the tier two bracket whereas the Chinese and the foreigns are more in the tier three.” He also indicatedthat in his experience there is no U.S. production of Tier 3 tires. Tr. at 369. 122 CR at V-12, PR at V-9. 123 CR at V-12, PR at V-9; and RMA press release, Mar. 16, 2009. 124 CR/PR at Table C-1. Imports from China grew by 42.7 percent from 2004 to 2005, by 29.9 percent from 2005to 2006, and by 53.7 percent from 2006 to 2007, and by 10.8 percent from 2007 to 2008. Id. 125 CR/PR at Table C-1. 126 See our discussion above of rapidly increasing subject imports. 127 CR/PR at Table V-1. As measured by the share of the quantity of apparent U.S. consumption, subject importsfrom China increased from 4.7 percent in 2004 to 6.8 percent in 2005, 9.3 percent in 2006, 14.0 percent in 2007, and
(continued...)
22
Demand trends for subject tires depend on changes in the number of new passenger vehicles andlight trucks produced in the United States, the number of existing passenger vehicles and light trucks thatneed replacement tires, and the total number of miles driven. The demand for replacement tires fell in2008 as the number of miles driven decreased, consumers tried to get more miles from current tires, andthe economy weakened.122 In addition, as domestic production of passenger cars and light trucksdecreased in 2008, the demand for OEM tires for passenger cars and light trucks fell.123
The quantity of U.S. imports from China rose each year during the period examined and was215.5 percent higher in 2008 than in 2004. In contrast, the quantity of U.S. imports from countries otherthan China has declined in each year since 2005 (after increasing initially in 2005) and was 5.4 percentlower in 2008 than in 2004. As a result, total U.S. imports of subject tires from all sources (as measuredby quantity) rose by 23.2 percent from 2004 to 2008; total imports rose during the first four years of theperiod, but declined by 1.1 percent in 2008.124
E. Analysis
In performing our analysis, we first consider information relevant to the three statutory factorsthat relate to our causation analysis – i.e., the volume of subject imports, the effect of subject imports onprices, and the effect of subject imports on the domestic industry. As the data cited above show, importsof passenger vehicle and light truck tires from China are increasing rapidly in absolute terms. The subjectimports increased each year during the period examined and were at their highest level of the period in2008. Subject imports increased by 215.5 percent from 14.6 million tires in 2004 to 46.0 million tires in2008. The greatest and most rapid increase in subject import volume has occurred since 2006. Subjectimports increased by 53.7 percent from 27.0 million tires in 2006 to 41.5 million tires in 2007, and by anadditional 10.8 percent to 46.0 million tires in 2008.125 Thus, the data show a large and rapid increase insubject imports, particularly since 2006.126
The large increase in the volume of subject imports is also reflected in those imports’ large andgrowing share of the U.S. market. Subject imports increased their share of the U.S. market by 12percentage points (more than threefold) between 2004 and 2008, from 4.7 percent in 2004 to 16.7 percentin 2008. More than half of this increase, 7.4 percentage points, has occurred since 2006.127

127 (...continued)16.7 percent in 2008. Id. 128 CR at V-31-32, PR at V-23-24. The six pricing products included four tires for passenger vehicles and two forlight trucks. For a description of the six products, see CR at V-31-32, PR at V-23-24. Six U.S. producers and 26importers provided usable pricing data for sales of the requested products. Pricing data reported by these firmsaccounted for approximately 14 percent of U.S. producers’ domestic shipments of subject tires and 36 percent ofU.S. shipments of subject imports from China in 2008. CR at V-32, PR at V-24. 129 CR at V-45, PR at V-35. 130 The average margin of underselling for all six products in 2004 was 10.8 percent. The average margin rose to14.8 percent in 2005, 18.8 percent in 2006, and 25.4 percent in 2007, before declining to 23.6 percent in 2008. See CR/PR at Tables V-9-V-14. 131 CR at V-20, PR at V-15. 132 CR/PR at Table III-5. U.S. producers reported an operating income of $256.2 million in 2004, an operatingincome of $165.5 million in 2005, an operating loss of $114.5 million in 2006, an operating income of $507.2million in 2007, and an operating loss of $262.8 million in 2008. *** U.S. producers reported financial data for2004 and 2005, and *** reported financial data for 2006 through 2008. Id.
23
We have also considered the effect of subject imports on the prices of U.S.-produced tires. Pricing data obtained by the Commission show nearly universal underselling by the subject merchandise. The Commission requested that U.S. producers and importers of subject tires provide quarterly data forthe total quantity and value of six tire products shipped to unrelated OEM and replacement customers inthe U.S. market during January 2004-December 2008.128 The resulting data provide 120 instances inwhich prices for domestic tires and subject imports from China could be compared. In 119 of these 120comparisons (99 percent), the subject imported product was priced below the domestic product. Themargins of underselling averaged 18.9 percent and ranged from 0.4 percent to 44.9 percent.129
Moreover, the margins of underselling for all six products increased during the period examinedand for five of the six were at their highest levels of the period in 2007 and/or 2008. The average marginof underselling for all six products increased by the greatest amount in 2007, the year in which thevolume of rapidly increasing imports rose by the greatest amount.130 In 2008, the average margin ofunderselling for the six products remained at nearly the same level as in 2007 (23.6 percent in 2008 ascompared to 25.4 percent in 2007) and was significantly above the average for the six products in each ofthe years 2004-2006. These increases in the average margin of underselling coincided with increasingvolumes of subject imports. Subject imports increased by 6.2 million tires in 2005 (from the 2004 level),and by an additional 6.2 million tires in 2006, 14.5 million tires in 2007, and 4.5 million tires in 2008.
The close substitutability of the domestic product and the subject imports combined withpervasive underselling by significant and growing margins enhanced the ability of subject imports todisplace domestically produced tires in the U.S. market. Over 50 percent of U.S. producers, importersand purchasers responding to the Commission’s questionnaires indicated that domestically produced tiresand the subject imports are “always” used interchangeably. At least 80 percent of these U.S. producers,importers and purchasers stated that the domestically produced tires and the subject imports are at least“frequently” used interchangeably.131
With the exception of 2007, the domestic industry’s operating income fell throughout the periodexamined. The industry operated at a loss in 2008, and that loss represented the industry’s worst one-yearperformance of the period.132 The decline in U.S. producers’ financial condition is reflected in the

133 U.S. producers’ total net sales declined from 221.8 million tires in 2004 to 209.1 million tires in 2005, 190.5million tires in 2006, 180.1 million tires in 2007, and 159.1 million tires in 2008. CR/PR at Table III-5. 134 CR/PR at Table C-1. 135 CR at V-46, PR at V-36. 136 CR/PR at Table V-1. 137 Compare, e.g., CR/PR at Table II-1 with CR/PR at Tables III-1, III-2, and III-4.
24
continuous decline, throughout the period, of U.S. producers’ net sales volume,133 which reflects decliningproduction and shipments. It is also reflected in U.S. producers’ increasing per-tire costs, which rose bythe largest amount of the period between 2007 and 2008. Per-tire other factory costs and general sellingand administrative expenses rose between 2007 and 2008 by the largest amount of the period, which waslargely attributable to a declining net sales base. The rise in domestic producers’ ratio of cost of goodssold to net sales is also attributable in part to an increase in the cost of raw materials, which was mostlydue to the rapid increase in the price of petroleum product inputs in synthetic rubber. There is evidencethat continued underselling by the subject imports prevented domestic producers from raising pricessufficiently to offset higher production costs and thus suppressed prices. Domestic producers’ ratio ofcost of goods sold to net sales increased from 84.7 percent in 2004 to 90.1 percent in 2008, an increase of5.4 percentage points over the period.134 The sharp increase in this ratio in 2008, when the volume ofsubject imports was highest and the margin of underselling was nearly at its greatest, indicates that U.S.producers were experiencing a cost-price squeeze and unable to pass increasing raw material costs on totheir customers. The Commission received information from three domestic producers that they eitherhad to reduce prices or roll back announced price increases to avoid losing sales to competitors sellingsubject tires from China.135
We find that there is a direct and significant connection between the rapidly increasing imports ofsubject tires from China and the domestic tire industry’s deteriorating financial performance anddeclining capacity, production, shipments, and employment. As discussed above, the volume of importsfrom China is significant both in absolute and relative terms, and the increase in such imports has beencontinuous and rapid throughout the period examined. The increase in the volume of imports has beenparticularly rapid since 2006. As indicated above, Chinese producers primarily compete in the lower-priced end of the U.S. market. The large and rapidly increasing volumes of subject tires from China havegreatly displaced U.S. producers in that segment of the market. As subject imports’ market share(measured by quantity) increased by 12.0 percentage points over the period examined, the domesticindustry’s market share declined by 13.7 percentage points.136
Furthermore, the pricing data described above show that underselling by the subject Chinese tireshas been significant and continuous throughout the period examined and that the margin of undersellinghas increased over the period. This underselling by the large and rapidly increasing volume of subjectChinese tires eroded the domestic industry’s market share, leading to a substantial reduction since 2004 indomestic capacity, production, shipments, and employment during the period examined. All of theseindicators were at their lowest levels of the period in 2008 when subject imports were at their highest, andthe largest declines in these indicators have occurred since 2006 when subject imports exhibited thegreatest and fastest increases.137 As imports of low-priced Chinese tires increased, U.S. producers wereforced to reduce capacity so as to focus on the parts of their business in which they could expect toremain profitable despite the impact of subject imports from China. Thus, we find that the substantialreduction in domestic capacity and the closures of U.S. plants during the period examined were largely inreaction to the significant and increasing volume of subject imports from China, and were not, as
138 CR/PR at Table IV-3. In their responses to a Commission questionnaire, subject Chinese tire producersreported that their capacity to produce subject tires increased from 93.2 million tires in 2004 to 118.1 million tires in2005, 148.0 million tires in 2006, 201.8 million tires in 2007, and 235.2 million tires in 2008. They also reportedthat their production of subject tires rose from 83.7 million tires in 2004 to 106.9 million tires in 2005, 134.0 milliontires in 2006, 182.0 million tires in 2007, and 195.6 million tires in 2008. Their shipments of subject tires rose from84.3 million tires in 2004 to 108.6 million tires in 2005, 138.5 million tires in 2006, 186.7 million tires in 2007, and198.7 million tires in 2008. Their exports to the United States rose from 14.1 million tires in 2004 to 19.4 milliontires in 2005, 29.1 million tires in 2006, 46.4 million tires in 2007, and 47.9 million tires in 2008. They reported thatthe share of the total quantity of their shipments that was exported to the United States rose from 16.7 percent in2004 to 17.9 percent in 2005, 21.0 percent in 2006, and 24.8 percent in 2007, then fell to 24.1 percent in 2008. CR/PR at Table IV-3. 139 For supporting data see the preceding footnote. 140 Id. 141 Id. 142 U.S. capacity and shipment data are based on information in CR/PR at Table C-1. 143 Chinese producers reported that the share of total shipments sent to the U.S. market increased from 16.7 in2004 to 17.9 percent in 2005, 21.0 percent in 2006, and 24.8 percent in 2008; it then fell to 24.1 percent in 2008. They reported that the share of the total quantity of shipments that went to the Chinese home market similarly fellfrom 47.0 percent in 2004 to 42.3 percent in 2005, 40.2 percent in 2006, and 38.4 percent in 2007; it then rose to38.8 percent in 2008. They reported that the share exported to markets other than the United States initiallyincreased, but trended downward after 2005. The reported share of shipments exported to such other marketsincreased from 35.3 percent in 2004 to 38.7 percent in 2005, then declined to 36.9 percent in 2006 and 34.0 percentin 2007, before increasing to 35.4 percent in 2008. CR/PR at Table IV-3.
25
respondents argue, part of a strategy by domestic tire producers to voluntarily abandon the low-priced,“value” segment of the U.S. market.
The role of increasing subject imports in the diminished performance of the U.S. industry isfurther confirmed by the information reported to the Commission by the Chinese producers of the subjecttires. Their questionnaire responses indicate significant growth in subject Chinese producers’ productioncapacity, production, and shipments during the period examined, as well as significant growth in exportsto the U.S. market and in the share of shipments exported to the U.S. market.138 The responses also showthat the largest one-year increase in subject Chinese industry capacity, shipments, and share of shipmentsexported to the U.S. market occurred between 2006 and 2007,139 just prior to the largest declines in U.S.capacity and production and approximately at the same time as three of the four U.S. plant closures. Between 2004 and 2008, subject Chinese producers’ annual capacity increased from 93.2 million tires to235.2 million tires, with a 53.8 million increase in tire capacity occurring between 2006 and 2007alone.140 Annual shipments similarly expanded from 84.3 million tires in 2004 to 198.7 million tires in2008, with a one-year expansion in shipments of 48.2 million tires between 2006 and 2007.141 AlthoughU.S. producers’ capacity and shipments were more than double subject Chinese producers’ capacity andshipments in 2004,142 subject Chinese capacity and shipments exceeded U.S. capacity and shipments bysizable margins by 2008. Moreover, the share of subject Chinese producers’ shipments directed to theU.S. market increased by nearly 50 percent during the period examined, while the shares of subjectChinese producers’ shipments to the home market fell.143
The impact of subject imports is also reflected in a comparison between the increased share of theU.S. market taken by the imports from China and the reduction in U.S. producers’ U.S. market share. Asnoted above, between 2004 and 2008, subject imports increased their share of the U.S. market by 12.0percentage points, while the share held by U.S. producers fell by 13.7 percentage points. Since 2006,U.S. producers’ market share fell by 6.6 percentage points, while imports from China increased their U.S.

144 CR/PR at Table V-1. 145 CR/PR at Table C-1. 146 Subject imports from China increased from 14.6 million tires in 2004 to 20.8 million tires in 2005 (or by 42.7percent), 27.0 million tires in 2006 (or by an additional 29.9 percent), and 41.5 million tires in 2007 (or by anadditional 53.7 percent). CR/PR at Table C-1. 147 All three companies cited import competition as a factor in their plant closings: Bridgestone cited “fiercecompetition from low-cost producing countries” as a factor in closing its Oklahoma City plant in 2006; Continentalcited “global competition” and “manufacturing costs [that] are cheaper overseas” as contributing to the closure of itsCharlotte, NC, plant in 2006; and for Goodyear, pressure from low-cost imports was cited as contributing to closureof its Tyler, TX, plant in 2008. CR at I-20-22, PR at I-15-17. 148 See, e.g., Supplier Business, “The Tire Report,” 2008, at 20:
It is difficult to comprehend the level of tire activity in China. Sales of tire manufacturing equipment intoChina have dominated the last ten years of machinery sales. During the recession in the 2001-2004 periodin the western world, machinery sales into the established markets declined to low levels, while sales toChina kept many machinery makers from going bankrupt. The ‘China boom’ has not ended, but – at leastuntil the middle of 2008 – has been disguised by improving sales in the rest of the world. China is still thelargest market by far for rubber and tire building machinery.
This influx of western equipment has lifted the number of Chinese tire makers from a few dozen to over200, most of them with a single factory. This compares with around 400 tire factories in the rest of theworld today. Many of these new Chinese factories are equipped with modern equipment and have thetechnology to make tires suited for export around the world.
149 CR at II-9, PR at II-7. Excluding purchases, U.S. producers’ subject imports accounted for only *** percentof all subject imports in 2008. Id.
26
market share by 7.4 percentage points.144 Thus, since 2006, imports from China gained a greater share ofthe U.S. market than was lost by domestic producers, indicating that they also took market share awayfrom third-country sources.
Moreover, imports continued to increase rapidly even in 2008 when U.S. apparent consumptionwas falling. Subject imports increased by 4.5 million tires in 2008, while U.S. apparent consumptiondeclined by 20.4 million tires. Imports from third countries declined by 6.0 million tires in 2008, or by6.1 percent, roughly consistent with the 6.9 percent decline in U.S. apparent consumption in 2008. Meanwhile, domestic production of subject tires declined by 20.0 million tires in 2008, or by 11.1percent, and absorbed virtually all the decline in U.S. apparent consumption that year.145
We have considered the arguments of the various parties regarding the timing of the increase insubject imports and the material injury to the domestic industry and the allegedly attenuated nature ofcompetition. We do not agree that domestic producers voluntarily abandoned the lower-priced part of theU.S. tire market and that the subject imports simply filled the void left by their departure. Imports fromChina were already increasing before Bridgestone, Continental, and Goodyear announced the plantclosings that occurred in 2006 and 2008.146 The three companies confirmed in statements issued at thetime of the announcements that low-priced competition from Asia, including China, was an important partof their decisions.147 Moreover, articles in trade publications referred to a surge in the purchase ofWestern tire production equipment by Chinese tire manufacturers during the last ten years,148 indicatingthat Chinese producers were expanding their capacity to produce and export tires. U.S. producers werenot among the largest importers of subject tires from China during the period examined and collectivelyaccounted for only approximately 23.5 percent of subject imports, including purchases in 2008.149 Thus,we find that a more reasonable explanation for U.S. producers’ capacity reductions in 2006 and thereafter
150 This is clear from trade publications contemporaneous with U.S. producers’ actions in 2006. For example, seethe article in MTD Modern Tire Dealer, “China and You: Expect more tire imports in the years to come,” Mar. 1,2006. The article noted that China exported an estimated 21 million tires to the United States in 2005, and describedthe overall effect on domestic supply as “profound” and likely to remain so as imports increase. The article alsosaid, with respect to Chinese production and shipments of tires for the replacement market, that “everyone agreesthere will be rapid growth in the segment, especially with all the activity from foreign investing.” 151 CR at V-6-V-7, PR at V-5-V-6. 152 INV supplemental questionnaire responses. 153 CR/PR at Table V-3.
27
was a reaction to increases in subject imports from China that were already occurring and, given the sizeand degree of the increases, likely would continue in the future.150
In addition, although we agree with respondents that the record supports the view that the U.S.replacement market generally can be segmented into three categories, we find that the information in therecord of this investigation does not support their claim that competition between U.S.-produced tires andthe subject imports is attenuated, with the subject imports competing principally in the Tier 3 segment ofthe replacement market, but not in the Tier 1 and Tier 2 segments or the OEM market. Given that we donot find that competition is attenuated, we do not find that subject imports that are present in one marketsegment have little, if any, effect on the volume and price of U.S.-produced tires in the other marketsegments and thus little if any effect on U.S. producers. For the reasons set forth below, we find thatU.S.-produced tires and subject imports from China both have a significant presence in the Tier 2 andTier 3 (category 2 and category 3) segments of the replacement market, both are also present in the Tier 1segment (category 1) and the OEM market, and there is significant competition between the subjectimports and domestic tires in the U.S. market.
As noted above, the Commission gathered additional information relating to this marketsegmentation issue through a supplemental questionnaire sent to U.S. producers and the largest importersof subject tires from China. Although the firms submitting responses were in general agreement as to theexistence of three categories, there was less agreement as to which tires were included in the two lower-priced categories. For example, three importers placed “associate” brands in category 2, while three otherimporters placed them in category 3.151
Firms responding to the supplemental questionnaire provided a wide range of estimates of theshare of U.S. producers’ and subject Chinese tire shipments that fall into each category. The responsesreveal that the largest share of U.S. producers’ shipments falls into category 1 and that the largest share ofsubject import shipments falls into category 3. Shipments in 2008 of both domestically produced tiresand subject imports from China, however, fell into all three categories. The share of U.S. producershipments that fell into category 3 is larger than the share that fell into category 2, and U.S. producershipments of category 3 tires accounted for about 18.6 percent of total U.S. shipments. There weresignificant U.S. shipments of subject tires from China that fell into category 2. Such shipments equaled64.3 percent *** of the quantity in category 3 (as reported by subject importers responding to the INVsupplemental questionnaire).152 In addition, there is competition between the subject imports and U.S.-produced tires in the OEM market, with the subject imports accounting for 4.9 percent of that market in2008 and domestically produced tires accounting for 51.6 percent in 2008.153

154 Certain Brake Drums and Rotors From China, Inv. No. TA-421-3, USITC Pub. 3622 (August 2003). 155 Pre-hearing brief of GITI Tire at 34-35. 156 Id. at 34. 157 Post-hearing brief of American Pacific Industries, Inc., at 6-7, citing Suramerica Aleaciones Laminadas, C.A.v. United States, 17 C.I.T. 146 (1993). 158 For example, American Pacific cites Suramerica as holding that, while the opposition of a majority of thedomestic industry does not compel a negative determination, the statute “requires that an ITC determination besupported by substantial evidence on the whole record. Absent compelling evidence of threat, it is not reasonable toconclude that the domestic industry is threatened when a majority opposes or does not support that finding.” American Pacific Post-hearing Brief at 7, citing 17 C.I.T. 146 at 162-63. The Court of Appeals, however, explicitlyfound this language from the opinion below to be in error. Suramerica Aleaciones Laminadas, C.A. v. United States,44 F.3d 978, 984 (Fed. Cir. 1994). 159 Certain Orange Juice from Brazil, USITC Pub. 3930, Inv. No. 731-TA-1089 at 14 (First Remand) (June2007). See Tropicana Products, Inc. v. United States, 2008 Ct. Intl. Trade LEXIS 16 at 26-28 (Feb. 5, 2008). 160 19 U.S.C. § 2451(b)(1) referring to the entities described in 19 U.S.C. § 2252(a).
28
We have also considered respondents’ argument that the facts in this investigation are similar tothose in the Brake Drums and Rotors investigation154 and that we should make a negative determinationon causation grounds for the same reasons cited there.155 The facts in the present investigation, however,are very different from those in Brake Drums and Rotors. Not only do we find that the facts here supporta finding that the domestic industry is materially injured (in Brake Drums and Rotors the Commissionbased its negative determination on a finding of no material injury or threat of material injury), but wefind that they do not show the degree of product differentiation between economy and premium productsthat the Commission found in Brake Drums and Rotors. In Brake Drums and Rotors, the Commissionfound competition between the imported and domestic products to be attenuated. It found that U.S.producers marketed domestically produced brake drums and rotors as brand-name premium products,while they marketed the brake drums and rotors they purchased from Chinese and third-country producersas economy-line products. The Commission found that the effect, if any, of the subject imports on thedomestic brake drum and brake rotor industries was limited and less than the effect that would be requiredto find causation under the statute.156 In the present investigation, U.S. tire manufacturers marketdomestically produced tires in the OEM tire market and all three segments of the replacement tire market. Moreover, unlike the distinction between premium and economy brake rotors, passenger tires include awide range of products along a quality, price, and performance spectrum. Thus, the domesticallyproduced tires compete with the subject imports in all markets in which the subject imports are present.
We have also considered American Pacific’s argument that, given the limited domestic industrysupport for the petition, the Commission should follow the reasoning of the U.S. Court of InternationalTrade (CIT) in the Suramerica case and make a negative determination.157 We first note that Suramericainvolved an investigation conducted under Title VII of the Tariff Act of 1930, not section 421. Moreover,American Pacific appears to rely on the opinion of the CIT in Suramerica, rather than that of the U.S.Court of Appeals for the Federal Circuit, which on appeal significantly curbed the CIT’s reasoning.158 American Pacific also does not address more recent court decisions, such as the Tropicana case,159 thathave reached a different conclusion with respect to the issue raised in Suramerica. Moreover, section 421specifically provides for investigations on the basis of a petition filed by a union that is representative of adomestic industry;160 accordingly, a union should be able to obtain relief if the facts support anaffirmative determination. Employment-related factors are among those that the Commission considers inmaking a determination, and the degree of producer support for the petition is not determinative. In thisinvestigation we are aware that domestic producers representing *** of production have taken a neutralposition with respect to the need for relief. Nonetheless, as in Tropicana, we find that the objective data

161 See, e.g., pre-hearing brief of GITI Tire at 23, 28-33.
29
concerning the industry’s performance and its causal relation to subject imports are unequivocal and belieany claim that the domestic producers’ *** is indicative of the lack of either injury or causation.
We have also considered the other possible causes of material injury cited by respondents,including the current recession, the contraction in the OEM tire market, sharp increases in raw materialcosts and raw material shortages, automation for increased productivity, imports from non-subjectcountries, higher gasoline prices resulting in less driving, strikes and labor actions, U.S. tire producers’high legacy costs, and other factors such as equipment restraints.161 We note that section 421, unlikesection 202 of the Trade Act, does not require a weighing of causes, but only that we find that rapidlyincreasing subject imports, in and of themselves, are a significant cause of material injury or the threatthereof to the domestic industry. As discussed above, we have found in this investigation that the rapidlyincreasing subject imports from China are a significant cause of material injury to the domestic industry. CONCLUSION
As explained above, we find the existence of market disruption due to certain rapidly increasingpassenger vehicle and light truck tire imports from China that are a significant cause of material injury tothe domestic industry producing certain passenger vehicle and light truck tires. As further discussedabove, we find that the subject passenger vehicle and light truck tire imports from China are “in suchincreased quantities” as to cause market disruption to domestic producers. The significant increase in thevolume of such imports coincided with significant underselling of the domestic products by the subjectimports. It also coincided with the sharp decline in the domestic industry’s performance indicators. Therising volume of subject imports from China has displaced domestic sales, and this displacement has ledto declining domestic production, shipments, capacity utilization, employment, and profitability.
We therefore make an affirmative determination that certain passenger vehicle and light trucktires from China are being imported into the United States in such increased quantities or under suchconditions as to cause market disruption to the domestic producers of passenger vehicle and light trucktires.

162 Chairman Aranoff does not join these views on remedy. See Separate Views on Remedy of Chairman SharaL. Aranoff. 163 19 U.S.C. § 2451(f) 164 19 U.S.C. § 2451(g)(2)(D).
30
VIEWS ON REMEDY
A. Remedy proposal
For the reasons set forth below, we propose the following action to remedy the market disruptionwe have found to exist –
That the President impose a duty, in addition to the existing rate of duty, for a three-yearperiod, on imports of the subject tires from China, with the amount of the additional dutyset at 55 percent ad valorem in the first year, 45 percent ad valorem in the second year,and 35 percent ad valorem in the third year.
We find that this action will remedy the market disruption we find to exist.162
We believe that the tariffs will significantly reduce subject imports and boost U.S. industry salesand prices, resulting in increased profitability. This profitability will lead to the preservation of jobs andthe creation of new ones, as well as encourage investment. We expect that this remedy will have little orno impact on the U.S. production of automobiles and light trucks because tires account for a very smallshare of the total cost of those products. In addition, tires account for a relatively small share of theannual cost of owning and operating an automobile or light truck.
We also recommend that the President take such action as is within his authority to direct the U.S.Department of Commerce and the U.S. Department of Labor to expedite the consideration of petitions fortrade adjustment assistance filed by domestic firms or workers producing the subject tires.
B. Statutory framework
Section 421(f) of the Trade Act of 1974163 provides that the Commission, upon making anaffirmative determination, “shall propose the amount of increase in, or imposition of, any duty or otherimport restrictions necessary to prevent or remedy the market disruption.” It provides that only thoseCommissioners who made an affirmative determination are eligible to vote on remedy. Neither thestatute nor its legislative history provides any further guidance or instruction on remedy.
Section 421(g)(2)(D) of the Trade Act164 requires that the Commission include, in its report to thePresident and the U.S. Trade Representative, a description of –
(i) the short- and long-term effects that implementation of the action recommended .. . is likely to have on the petitioning domestic industry, on other domesticindustries, and on consumers; and
(ii) the short- and long-term effects of not taking the recommended action on thepetitioning domestic industry, its workers, and the communities whereproduction facilities of such industry are located, and on other domesticindustries.
165 CR/PR at Table V-2. 166 CR at V-6-7, PR at V-5-6. As we note in the market disruption section of these views, respondents argue thatthe subject tires from China are concentrated in the Tier 3 (category 3) segment of the replacement market and thatdomestic producers have largely abandoned that market segment. 167 Staff table entitled “U.S. Production and Imports by Category (shipments),” submitted to the Commission’sEDIS system on June 18, 2009. As noted in the Market Disruption section of these views, each firm that received aquestionnaire was asked to place its shipments/purchases into the three categories as it defined or perceived them. The Commission did not impose a definition on the responding firms. 168 CR at V-20, PR at V-15.
31
C. Conditions of Competition
In evaluating the various remedy options, we considered the conditions of competition in thedomestic market and likely developments affecting such conditions during the next several years. TheU.S. market for passenger vehicle and light truck tires consists of two principal segments: (1) the OEMmarket (producers of new cars and light trucks) and (2) the replacement market.
The vast majority of shipments by U.S. tire producers and subject tire importers are to thereplacement market. The share of U.S. producers’ shipments to the replacement market increasedthroughout the period examined and rose from 76.7 percent in 2004 to 82.3 percent in 2008 as OEMmarket demand decreased. Subject imports, which were shipped almost exclusively to the replacementmarket in 2004, subsequently increased their presence in the OEM market; 7.3 percent of subject importswere shipped to the OEM market in 2006. This share decreased to 5.0 percent in 2008.165
U.S. producers and subject tire importers each ship a broad range of tire sizes and types throughsimilar marketing channels. U.S. producers and subject tire importers sell in both the replacement andOEM markets. Most shipments to the replacement market are to distributors who then sell to the finalconsumers, whereas shipments to the OEM market are directly to new car and light truck manufacturers.
Most U.S. producers and importers responding to a supplemental Commission questionnaireagreed that the replacement market can be segmented into three categories or tiers. They generally agreedthat category 1 includes major, flagship, or premium tire brands and that lesser known brands, associatebrands, foreign brands, whereas unbranded tires fall into category 2 or 3. However, there was lessagreement as to which tires fall into category 2 as opposed to category 3.166 The responses, however,indicate that U.S. shipments of domestically produced tires and subject imports fall into all threecategories, with the majority of shipments of domestic tires falling into category 1 and the majority ofshipments of imports from China falling into category 3.167 A greater number of domestic shipments fallinto category 3 than category 2. A significant quantity of shipments of imports from China fall intocategory 2, and only a small amount fall into category 1. This indicates that there is a substantial overlapbetween domestically produced tires and the subject imports. It also indicates that there is substantialcompetition between domestically produced tires and the subject imports at the category 2 and 3 levelsand, to a lesser degree, at the category 1 level. As indicated above, there is also competition between thedomestically produced tires and the subject imports in the OEM market.
Significantly, there is a high degree of substitutability between domestically produced tires andsubject tires imported from China. At least 50 percent of responding producers, importers, and purchasersstated that tires produced in the United States and tires imported from China are “always” usedinterchangeably.168 At least 80 percent of responding producers, importers, and purchasers stated thatsubject tires produced in the United States and imports from China are at least “frequently” used

169 CR at V-20, PR at V-15. 170 CR at V-20-V-22, PR at V-15-V-16 and CR/PR Tables V-6 through V-8. 171 CR/PR at Table V-8. 172 CR at V-45, PR at V-36. 173 Derived from data in CR/PR at Tables V-9 through V-14 and Table C-1. 174 CR at V-12, PR at v-9. 175 CR at V-12, PR at V-9; RMA press release, Mar. 16, 2009. 176 CR/PR at Table C-1. 177 CR/PR at Table C-1.
32
interchangeably.169 The U.S. product was ranked comparable with imports from China by at least half ofresponding purchasers with respect to delivery terms, discounts offered, extension of credit, lowertransport costs, minimum quantity requirements, packaging, product consistency, quality exceeding andquality meeting industry standards, and reliability of supply. At least half of responding purchasersranked the U.S. product superior to imports from China with respect to availability, delivery time,minimum quantity required, product range, reliability of supply, and technical support.170
Although the subject imports and domestically produced tires have a high degree ofsubstitutability, the subject imports are sold at prices significantly lower than those of the domestic tires. In the questionnaire responses, the U.S. product was ranked inferior in price to imports of subject tiresfrom China by two-thirds of responding purchasers.171 Pricing evidence in the record supports theseresponses and shows significant underselling of U.S.-produced tires by the subject imports during theperiod examined and a widening of the margin of underselling. As discussed above, the subject importedproduct was priced below the domestic product in 99 percent of available comparisons.172 The margin ofunderselling by the Chinese tire products widened significantly during the period examined and was at itsgreatest level, 25.4 percent, in 2007, the year in which the volume of subject imports from Chinaincreased by the greatest amount, then remained high at 23.6 percent in 2008, when subject importsincreased by an additional 10.8 percent.173
(1) Demand Conditions
Demand trends for subject tires depend on the number of new passenger vehicles and light trucksproduced in the United States, the number of existing passenger vehicles and light trucks that needreplacement tires, and the total number of miles driven. The demand for replacement tires fell in 2008 asthe number of miles driven decreased, consumers tried to get more miles from current tires, and theeconomy weakened.174 In addition, as domestic production of passenger cars and light trucks decreased in2008, the demand for OEM tires for passenger vehicles and light trucks fell.175
U.S. apparent consumption of subject tires, on a quantity basis, decreased in every year of theperiod examined except in 2007. The increase from 2006 to 2007 was only 1.6 percent, and consumptionthereafter fell by 6.9 percent to 275.7 million tires in 2008, the lowest level of the period.176 As measuredin value, U.S. apparent consumption increased throughout the period except in 2008, when it fell by 0.3percent.177 The increase in the total value of apparent consumption despite the decline in consumptionquantity reflects the significant increase in the average unit value of tires sold in the U.S. market.
A modest change in the average price of subject tires is not likely to have a significant effect onthe total demand for subject tires because there are few, if any, substitutes for tires. In addition, tires
178 One importer (***) reported that subject tires make up 4 percent of the final cost of a new light truck and lessthan 1 percent of the cost of a passenger vehicle, while another importer (***) reported this share to be 1 percent forlight trucks. CR at V-15, PR at V-11. 179 Three of the 10 U.S. producers of tires reported producing other products on the same equipment andmachinery and using the same production and related workers employed to produce the subject domestic tires. CRat I-16, PR at I-11. 180 CR/PR at Table C-1. 181 For example, *** told the Commission that it currently runs *** different tire products through its *** plant ona given day and will cycle through *** types of tires over 3 or 4 days. ***. 182 ***. 183 CR/PR at Table IV-3. We note that the quantity of exports to the United States in 2008 reported by subjectChinese producers is higher than the amount reported in official U.S. Department of Commerce import statistics. See CR/PR at Table II-1.
33
account for a relatively small share of the final cost of new automobiles and light trucks and also accountfor a relatively small share of the annual cost of owning and operating an automobile or light truck.178
(2) Domestic supply conditions
U.S. producers have the ability to respond to changes in demand with moderate changes in thequantity of shipments of U.S.-produced tires supplied to the U.S. market. U.S. producers are able torespond because they have unused capacity and some ability to produce products not within the scope ofinvestigation.179 In 2008, U.S. producers operated at a capacity utilization rate of 86.0 percent, which wassubstantially below the capacity utilization rate of 96.3 percent reported in 2004 and the capacityutilization rates above 90 percent that were reported in 2005 and 2007.180 This unused capacity indicatesthat U.S. producers could readily increase their production. Moreover, at least several domestic plants arecapable of producing a wide range of tire sizes and types on any given day and thus already have theability to respond quickly to any changes in demand for specific sizes and types of tires.181 In addition,recent reductions in employment and hours worked suggest that there is a supply of skilled labor thatcould be used to support increased domestic tire production. This supply responsiveness is constrainedsomewhat by a limited ability to divert shipments from alternate markets and a somewhat limited abilityto use inventories to increase shipments to the U.S. market. Domestic producers generally manufacturetires in response to orders and do not maintain extensive inventories.182
(3) Import supply conditions
Subject Chinese producers have a substantial ability to increase the quantity of shipments ofsubject tires to the U.S. market. The main factors contributing to the responsiveness of supply for subjectproducers are the availability of unused tire-making capacity, projected imminent increases in capacity,the ability to divert shipments from alternate markets, and the ability to shift from production of productsnot within the scope of the investigation. Subject producers project that their capacity to produce thesubject tires will increase by 10 percent in 2009 as compared to actual 2008 capacity, and that it willincrease by an additional 5 percent in 2010. They also project that their total shipments of subject tireswill increase by 13 percent in 2009 as compared to 2008 and increase by an additional 10 percent in 2010.
Subject Chinese producers project that their export shipments to the U.S. market will increase by9 percent (4.4 million tires) in 2009 as compared to 2008 and by an additional 7 percent (3.5 million tires)in 2010.183 Subject Chinese producers also reported that their capacity utilization has declined since 2005and was 83.2 percent in 2008, indicating that they have a significant amount of unused capacity.

184 CR/PR at Table IV-3. 185 CR/PR at Table II-1. 186 CR/PR at Table V-1. 187 Commissioners Lane and Pinkert note that, as the Commission has previously stated, “[i]n general, a simple advalorem tariff is preferred over other remedy options because it tends to be less trade distorting.” Certain Steel WireGarment Hangers From China, Inv. No. TA-421-2, USITC Pub. 3575 (February 2003) at 28. 188 Petitioner’s pre-hearing brief at 42-43. 189 Petitioner’s final comments on remedy at 10. 190 Cooper Tire & Rubber, which is both a domestic producer of subject tires and an importer of subject tires fromChina, takes no position regarding petitioner’s remedy. Cooper recommends, however, that any quota be managedby the U.S. government, such as through a licensing or visa system. Cooper explains that it is concerned about howa quota would be administered procedurally because its business license for its Kushan plant in China requiresCooper to export all the tires produced in the plant during the first five years; production at the plant began inFebruary 2008. Final comments of Cooper Tire & Rubber at 2-3.
34
Although they project that their capacity utilization will increase in 2009 and 2010, the projectedutilization rates would still be lower than the utilization rates reported for 2004 through 2007. Moreover,the projected capacity utilization rates would be based on progressively higher levels of capacity.184
Countries other than China also export passenger vehicle and light truck tires to the United States. Canada, Japan, and Korea were the largest non-subject sources of tires, collectively accounting for at leasthalf of U.S. non-subject imports each year during 2004-2008.185 Non-subject imports held a fairlyconsistent share of the U.S. market during 2004-2008, accounting for approximately one-third of U.S.consumption.186
D. Proposed relief
As indicated above, the statute authorizes the Commission “to propose the amount of increase in,or imposition of, any duty or other import restrictions necessary to prevent or remedy the marketdisruption.” We find that an increase in the rate of duty on imports of the subject tires, for a three-yearperiod, with the amount of the additional duty set at 55 percent ad valorem in the first year, 45 percent advalorem in the second year and 35 percent ad valorem in the third year, is necessary to remedy theexisting market disruption.
In determining the form and amount of relief to propose, we took into account the submissions ofthe parties. In addition, we have taken into account the market disruption that we have found to exist,including the rapid increase in subject imports, the volume of those imports, and the underselling by thesesubject imports. We have also evaluated the various options available to us, including a tariff increase, atariff-rate quota, and a quantitative restriction.187 We have considered other relevant information in therecord, including projections provided by Chinese producers about increases in their capacity, totalshipments, and shipments to the U.S. market in 2009 and 2010.
Petitioner recommends that the Commission propose a quota on the subject tires for a three-yearperiod in the amount of 21 million tires in the first year, with increases of 5 percent in the amount of thequota in each of the following two years.188 Petitioner expresses a preference for a quota over a dutybecause of concern that Chinese government policies might undermine the effects of a duty.189 190

191 Petitioner’s pre-hearing brief at 42-43. 192 Final comments on remedy of Subcommittee of China Tire Producers at 2. 193 Final comments of GITI Tire at 7-9. 194 Final comments of Les Schwab Warehouse Center at 6. 195 Final comments of Les Schwab Warehouse Center at 9. 196 Final comments of GITI Tire at 9-11. 197 Id. at 11-12. 198 We find that a more rapid phase-down would be inappropriate given both the magnitude of the marketdisruption at issue and the Chinese industrial policies that, at least in part, account for it. See, e.g., earlier discussionof restrictions on Cooper Tire & Rubber’s business license.
35
Petitioner also recommends that the quota be administered at the 10-digit HTS level to avoid “a skewingof imports into the larger sizes.”191
Respondents argue that no restriction on imports of subject tires is appropriate because (1) anyrestriction would contravene the domestic industry’s strategy of moving away from the economy segmentof the market, (2) there is no evidence the domestic industry would use a remedy to improve or expand itsdomestic production base, (3) a remedy might complicate the domestic industry’s negotiations with itslabor union,192 (4) a remedy will harm tire dealers and their customers, (5) a remedy would create a safetyhazard (by raising prices and thus causing consumers to delay replacing tires),193 and (6) a remedy wouldonly result in the U.S. market being supplied by third countries.194 Assuming the Commission were topropose a remedy, Les Schwab Warehouse Center argues that tariffs would result in lower costs to theeconomy and consumers compared to a quota.195 GITI Tire argues that the more appropriate approach isto address the plight of tire workers through the American Recovery and Reinvestment Act, the assistanceprogram for the auto industry, as well as the Trade Adjustment Assistance program.196 In addition, GITITire suggests that the Commission recommend that Chinese producers be required to comply with certainenvironmental and labor standards at their Chinese plants.197
After considering the various options, we have found in this case that an increase in duty as statedabove is the most appropriate remedy to address the market disruption caused by rapidly increasingimports from China. This increase in the tariff would significantly improve the competitive position ofthe domestic industry, increasing domestic production, shipments, and employment and restoring thedomestic industry to at least a modest level of profitability. The increase should accomplish this byreducing the quantity of subject imports and raising their price in the U.S. market. In proposing thisremedy, we are mindful of record evidence that domestic producers have already significantly reducedtheir capacity to produce for the lower-priced end of the market in which imports from China competemost extensively. Nevertheless, there is substantial competition between U.S.-produced tires and importsfrom China in all segments of the market, and the imposition of higher duties will increase prices andpermit U.S. producers to utilize their available capacity to increase production, sales, and employment. Additional revenue from increased prices and sales will improve the profitability.
We have recommended that the increased duties be phased down in annual 10 percentage-pointincrements over the three-year remedy period. This recommendation recognizes that the remedy is onlytemporary in nature and is designed to give the domestic industry and its workers breathing space inwhich to adjust to import competition, which will be encouraged by the phasing down of the duties.198 Inaddition, reducing the size of the duty each year is likely to limit the extent to which non-subject suppliersmay increase their exports to the United States in response to the relief on imports from China. We alsoexpect the level of tariff protection that is necessary to offset market disruption to decrease as new
199 For example, ***. 200 We also note that petitioner’s proposed quota has a tariff-equivalence of about 65 percent ad valorem, whichwe view to be higher than necessary to remedy the market disruption we have found. 201 CR/PR at Table II-3. 202 CR/PR at Table C-1. 203 CR/PR at Table II-3.
36
investments and other adjustments are implemented. The action we are recommending is not intended toaddress the effects of the current recession or to restore the domestic industry to a level of shipments andprofitability that might prevail in a healthier national economy, but only to address the market disruptioncaused by the subject imports. We expect this remedy to have little or no effect on the U.S. automobileand light truck industry because tires account for a very small part of the cost of manufacturing a car orlight truck.
We recommend that the remedy remain in place for a three-year period because we believe that aremedy of such duration is needed to give firms and workers in the industry the time to identify andimplement needed adjustments to import competition. Although domestic producers did not identify anyspecific planned adjustments in their questionnaire responses, other information in the record indicatesthat domestic producers have put plant and equipment upgrades on hold pending more favorable marketopportunities.199 Moreover, we anticipate that the relief may encourage certain domestic producers toreconsider planned plant closures.
We have considered the quota proposed by petitioner, but believe a duty increase to be the moreappropriate remedy in this case because of the nature of the competition between the imported anddomestic tires and the nature of the product, including the wide variety of sizes of tires sold in themarketplace. A quota administered on a 10-digit HTS level, as proposed by petitioner, would be tooinflexible because it would not take into account changes in market demand for different sizes of tires. Inour view, it would likely result in quotas for some 10-digit HTS categories being quickly filled, whileothers are left largely unfilled. At the same time, we share petitioner’s view that a single quota coveringall subject tires from China would be likely to encourage a shift in the mix of tires shipped by subjectChinese producers to the United States toward the higher performance (and higher priced) tires in whichthe U.S. industry is currently more competitive.200 We note that this risk would even be present with the10-digit HTS approach advocated by the petitioner, as producers of subject imports would have anincentive to move up-market within each sub quota. Finally, our aim is to address the market disruptioncaused by the rapidly increasing imports, as opposed to returning the domestic industry to a condition thatmay have existed in 2005 or another year, as the latter would be impractical given changes in the industryin the intervening years.
We note that the United States imports a significant quantity of subject tires from countries otherthan China. Information in the record shows that the quantity of these imports has declined since 2006201
and that their average unit values are much higher than those of imports from China and closer to theaverage unit value of U.S.-produced tires over the 2004-2008 period.202 U.S. tire producers are significantimporters of third-country tires, accounting for about 72 percent of such imports in 2008. Imports byU.S. producers of third-country tires, however, have been declining since 2005.203 Given the recentdownward trend in U.S. imports of third-country tires, their higher prices, and the role of U.S. producers
204 Moreover, as noted above, one of the reasons we propose a reduction each year in the size of the additionaltariff is to reduce any incentive there may be for third-country imports to increase. 205 Commissioner Lane notes that in the first year of relief, the average of the outcomes from the COMPASModel shows that the domestic industry’s domestic sales are likely to increase by approximately 6.8 million units onaverage. Although the model does not specifically project the impact of such an increase in output on employment,at the highest level of productivity reflected in the period of investigation 6.8 million tires would equate to over 2.3million additional hours for production related workers in the industry. While these hours may be a combination ofadditional hours for existing employees and new jobs, they nevertheless equate to nearly 1,200 jobs on a full-timebasis. At the average 2008 wage rate, these additional hours would produce increased wages for domestic workersof $58.4 million. Commissioner Lane further notes that although this level of increased hours and wages iscalculated based on a single year’s average productivity, the result is consistent with other record evidence. Therecord indicates that the variable wage portion of producing a tire is $8.73. Applying this variable wage cost per tireto an increase in output of 6.8 million tires results in expected increased wages of over $59 million. Thus, eithercalculation supports the expectation that the additional volumes that will be produced by the domestic industry if theCommission’s proposed remedy is implemented will lead to a substantial increase in hours worked and wages. 206 Staff document, “Table 1: Summary effects of remedy, 55 percent tariff,” June 29, 2009. 207 Staff document, “Table 1: Summary effects of remedy, 55 percent tariff” June 29, 2009. 208 Staff document, “Table 1: Summary effects of remedy, 55 percent tariff” June 29, 2009. 209 CR at V-15, PR at V-11. The COMPAS economic model used by the Commission estimates the extent ofmarket changes likely to result from import relief. The results of the model are expressed in terms of percentagechanges from the most recent base period, in this case the year 2008.
The COMPAS model estimates a first-year impact on consumers of $459 million to $534 million. This(continued...)
37
in their importation, we anticipate that these imports will capture a minority of the reduction in subjectimports if our proposed remedy is implemented.204
E. Short- and Long-Term Effects of the Recommended Remedy
The relief we are proposing would remedy the market disruption by imports from China that wehave found and does not exceed the amount necessary to remedy market disruption. It is intended toincrease production, shipments, sales, and prices of domestic tires, boost domestic employment,205 andrestore the domestic industry to at least a minimum level of profitability.
As explained above, in the first year we propose a 55 percent tariff on all imports of subject tires. This duty would likely reduce shipments of subject tires by 38.2 to 58.4 percent in the first year.206 Increases in shipments by domestic producers would likely make up for most of the reduction in thevolume and market share of subject imports. Although both domestic and non-subject import shipmentswould likely increase by 3.4 to 6.8 percent, the volume of domestic shipments is much higher than that ofnon-subject import shipments, and domestic shipments will thus likely enjoy a much more substantialincrease.207 Further, the increased tariff will not preclude growth if market conditions change. The tariffis likely to result in a modest increase in prices for domestic and imported tires. Domestic industry andnon-subject import prices are estimated to increase by 1.3 to 2.2 percent.208
The increased quantity and prices of domestic industry shipments would significantly improvethe domestic industry’s revenues. The benefit provided by the tariff – a revenue increase of 5.1 to 8.6percent – should allow the industry to go from incurring operating losses to earning operating profits. Any negative effects on U.S. consumers will likely be very small in absolute terms and even smaller inrelative terms, given that tires are generally a small cost component in their ultimate end uses in passengervehicles and light trucks.209

209 (...continued)equates to only $1.73 to $2.00 per tire sold in the U.S. market. Moreover, after considering the increased tariffrevenue, the net impact on total U.S. welfare ranges from a $71.0 million loss to a $73.3 million gain.
38
It is not possible to predict market effects with precision following the initial year of relief. Ingeneral, it is expected that as the volume of subject imports is restrained, the domestic industry will beable to respond by increasing production as necessary and ultimately improving capacity utilization,employment, and financial performance.
F. Short- and Long-Term Effects of Not Taking the Recommended Action
In the absence of appropriate relief, the domestic industry’s negative operating income,decreasing employment and production, and other negative performance indicators can be expected tocontinue and likely worsen. Subject tires have increased their share of the U.S. market significantly eventhough U.S. consumption has declined. The U.S. producers’ decreased shipments have been moderatedsomewhat by price increases, although these price increases have generally not covered sharply increasingraw material and other costs. In the absence of a remedy, the domestic industry producing subject tires islikely to experience substantial revenue losses, production and shipment declines, and furtheremployment reductions.

1 19 U.S.C. § 2451(f). 2 19 U.S.C. § 2451(f). 3 19 U.S.C.§ 2481. 4 19 U.S.C.§ 2451(g)(2)(D).
39
SEPARATE VIEWS ON REMEDY OF CHAIRMAN SHARA L. ARANOFF
The statute authorizes the Commission to “propose the amount of increase in, or imposition of,any duty or other import restrictions necessary to prevent or remedy the market disruption.”1 In order toremedy the market disruption that I have found to exist, I recommend as follows:
That the President impose a duty, in addition to the existing rate of duty, for a three-year period,on imports of the subject tires from China, with the amount of the additional duty set at 55percent ad valorem in the first year, 45 percent ad valorem in the second year, and 35 percent advalorem in the third year.
If applications are filed, I recommend that the President direct the U.S. Department of Commerceand the U.S. Department of Labor to provide expedited consideration of any petitions for trade adjustmentassistance filed by firms or workers affected by the subject imports.
Statutory Framework
Section 421(f) of the Trade Act of 1974 provides that the Commission, upon making anaffirmative determination, or if it is equally divided in its determination, “shall propose the amount ofincrease in, or imposition of, any duty or other import restrictions necessary to prevent or remedy themarket disruption.”2 It provides that only those Commissioners who agreed in the affirmativedetermination are eligible to vote on remedy, and that other Commissioners may provide their views onremedy. Neither the statute nor its legislative history provides any further guidance or instruction onremedy.
Section 421(f) thus authorizes the Commission to propose as a remedy any import restriction,including but not limited to an increased duty, a tariff-rate quota, a quantitative restriction, or other importrestriction.3
Section 421(g)(2)(D)4 requires that the Commission’s report to the President and the U.S. TradeRepresentative include a description of –
(i) the short- and long-term effects that implementation of the actionrecommended…is likely to have on the petitioning domestic industry, on otherdomestic industries, and on consumers; and
(ii) the short- and long-term effects of not taking the recommended action on thepetitioning domestic industry, its workers, and the communities whereproduction facilities of such industry are located, and on other domesticindustries.

5 Petition at 23-24. 6 Hearing Tr. at 177 and petitioner’s post-hearing brief (June 8, 2009), exhibit 43 at 42.
40
Proposed Relief
In determining what remedy to propose, I took into account the nature of the market disruptionthat I have found to exist - specifically the rapid increase in imports of subject tires from China, the largeabsolute volume of those imports, and the underselling by the imports. It is my view that, in order to beeffective, a remedy must address and alleviate these specific elements of market disruption, by reducingthe volume of imports from China in the U.S. market and raising the prices of the remaining volume ofsuch imports in an effective way and for an effective period of time.
The remedy that I am proposing achieves these results. According to estimates by Commissionstaff, a 55 percent additional tariff in the first year would reduce the volume of subject imports fromChina by 38 to 58 percent, and would raise prices of subject imports from China by 12 to 23 percent. This would have the effect of reducing market share of subject imports to 7.3 to 10.6 percent (from 16.7percent), based on the quantity of apparent consumption in 2008, and of largely negating the averageunderselling margins of 23.6 percent associated with subject imports in 2008.
Imposition of the proposed duties is not the only possible action that would eliminate the marketdisruption caused by subject imports. Petitioner recommends that the Commission propose a quota onsubject imports tires for a three-year period in the amount of 21 million in the first year, with a 5 percentincrease in the amount of the quota in each of the second and third years.5 Petitioner expresses apreference for a quota over a duty, arguing this would create the greatest possible certainty in the marketand would provide no new incentive for Chinese producers to invest in the production of higher valuetires, which petitioner believes could undermine the benefits of the remedy.6 Although I do not disagreewith petitioner that the proposed 21 million unit import quota would address the market disruption foundin this investigation, and may have a somewhat larger effect on the volume and price of subject importsthan the tariff scheme that I am recommending, I find that the imposition of a tariff provides a betteroverall remedy for this industry.
The U.S. market consumes tires representing a wide variety of sizes and performancecharacteristics and consumer preferences for different kinds of tires change over time based, inter alia, onthe popularity of different car and light truck models. A quota administered at the HTS 10-digit level, asproposed by petitioner, is likely too inflexible to take into account changes in market demand for differentsizes and types of tires. Thus, while some quota categories may be quickly filled, other categories couldbe left largely unfilled, which may result in an unnecessary reduction in consumer choice. By contrast, asingle quota covering all subject tires from China would likely encourage a shift in the mix of tiresshipped from China to the United States towards the higher performance (and higher priced) tires inwhich the U.S. industry is currently more competitive. Given the current economic climate and theassociated uncertainty regarding the likely level of U.S. tire consumption over the next several years, Ibelieve that a tariff scheme will provide the domestic industry and the market with greater flexibility tomeet consumer needs.
I recommend that the remedy remain in place for a three-year period, in order to provide areasonable planning horizon for domestic producers. Although domestic producers did not identify intheir questionnaire responses specific adjustment projects they would undertake if relief were granted inthis investigation, they did discuss plant and equipment upgrades on hold pending more favorable market

7 Hearing Tr. at 72; trip notes, Tour of Goodyear plant in Fayetteville, NC, May 26, 2009 ***. 8 An increase in domestic production of 5.8 percent, the maximum predicted by the Commission’s model, wouldtranslate into an additional 9.3 million units. By way of comparison, the production capacity of the three domesticplants currently scheduled to close in 2009 is 22.5 million units. CR/PR at Table I-3. 9 Petitioner generally finds higher effects of their proposed remedy on domestic production and employment thanCommission staff found of their own analysis of petitioner’s remedy. This difference is largely due to differentassumptions. I find that, based on the record, the supply responsiveness estimates underlying the analysis byCommission staff are more reasonable than petitioner’s estimates. Assumptions made by the petitioner includerelatively large domestic supply responsiveness to price changes, relatively high Chinese producer supplyresponsiveness, and relatively low third-country producer supply responsiveness. Memo EC-GG-004, June 19,2008. See also Exhibit 43 of petitioner’s post-hearing brief at 2-3 and 21-22.
41
opportunities.7 A three-year remedy period should provide the industry with sufficient market stability tomake these deferred financial commitments, many of which are aimed at improving competitiveness atthe higher end of the market.
I further recommend that the increased duties be phased down in annual 10-percentage-pointincrements during the remedy period. Phasing down the tariff level over time will allow a more gradualtransition in the marketplace, since the relief afforded is temporary. Moreover, it will reduce theincentive for third-country producers and importers to make investments intended to expand theirpresence in the U.S. market.
Short- and Long-Term Effects of the Recommended Remedy
The statute requires that the Commission include, in its report to the President and the U.S. TradeRepresentative, a description of the short and long-term effects that implementation of the actionrecommended is likely to have on the petitioning domestic industry, on other domestic industries, and onconsumers.
The action I am recommending is likely to raise domestic producers’ revenues by 5.1 to 8.6percent in the first year, which should be sufficient to restore the domestic industry to modestprofitability. The recommended remedy is not intended to address the effects of the current recession orto restore the domestic industry to a level of shipments and profitability that prevailed in any particularyear, because decreasing demand, rising raw material costs, natural disasters and other factors all affectedthe operating performance of the domestic industry between 2004 and 2008 in addition to the marketdisruption caused by imports from China. Thus, the level of profitability likely to prevail once the marketdisruption is remedied would not be expected to exceed that experienced by the domestic industry in theearlier years of the POI when a stronger economy contributed to healthier operating results.
The proposed remedy is likely to increase domestic production by 2.9 to 5.8 percent.8 Makingthe reasonable assumption that an increase in domestic production is likely to translate into a comparableincrease in employment, I would similarly expect an increase in employment of 2.9 to 5.8 percent in thefirst year, or approximately 900 to 1,800 jobs. To the extent that workers at some domestic tireproduction facilities are currently working short shifts, this positive employment effect may manifestitself at least in part in the form of an increase in hours worked, rather than jobs saved or new jobscreated, due to the temporary nature of the remedy.9
I do not foresee any adverse effects on the domestic industry producing passenger cars and light

10 CR at V-15, PR at V-11. 11 CR at V-6 to V-8, PR at V-5 to V-6. 12 Staff document, “Table 1: Summary effects of remedy, 55 percent tariff” June 29, 2009. 13 Final comments on remedy by GITI Tire at 8. 14 CR/PR at Table II-3 and see Table C-1.
42
trucks, because tires represent a very small share of the cost of producing such vehicles.10 Nor are therelikely to be significant adverse effects on domestic retailers of replacement tires or on consumer choice,because the U.S. market is served by a large variety of tires at different price points and differentperformance levels.11 Moreover, although the prices of subject tires are, as noted above, likely to increaseby 12 to 23 percent, prices for domestically produced and non-subject tires are likely to increase by only1.3 to 2.2 percent.12 Thus, it is not plausible, as respondents suggest, that consumers would be unable toafford to replace their tires thereby creating a public safety hazard as a result of the proposed remedy.13
I disagree with the respondents’ argument that third-country imports will simply fill the demandleft by restrictions imposed on imports from China. Such an argument is both legally and factuallyunfounded as the statute instructs the Commission to propose the relief that will prevent or remedy marketdisruption due to the subject tires from China. As a legal matter, it is sufficient that the proposed tariffscheme remedies the market disruption attributable to subject imports, regardless of whether the domesticindustry captures most or all of the sales volume formerly served by subject imports. As a factual matter,information in the record shows that the volume of third-country imports has declined since 2005, andthat unit values of third-country imports are on average well above those of imports from China andcloser to those of domestic tires. U.S. tire producers are significant importers of these third-country tires,accounting for approximately 73 percent of such imports in 2008, and imports by U.S. producers of third-country tires have been declining since 2005.14 The Commission’s model takes into account the existenceof these third-country imports in gauging the likely effects of the proposed remedy, and predicts thatshipments of domestically produced and third-country tires are each likely to increase by 3.4 to 6.8percent and experience similar, but small, price increases of 1.3 to 2.2 percent. For all these reasons, I donot find that third-country imports are likely to fully replace subject imports from China in the U.S.market or, to the extent that they do expand their market presence, to do so at prices as low as thoseassociated with subject imports. In sum, a rising volume of non-subject imports is not likely to prevent ameaningful benefit to the domestic industry from the proposed relief.
It is not possible to predict with precision the market effects of the proposed remedy followingthe initial year of relief. In general, it is expected that, as the volume of subject imports and extent ofunderselling by imports from China are restrained, the domestic industry will be able to respond byincreasing production and employment, improving capacity utilization and financial performance, andconsidering opportunities for capital investments and other plant improvements.
Short- and Long-Term Effects of Not Taking the Recommended Action
The statute further requires that the Commission include, in its report to the President and theU.S. Trade Representative, a description of the short and long-term effects of not taking the recommendedaction on the petitioning domestic industry, its workers, and the communities where production facilitiesof such industry are located, and on other domestic industries.
In the absence of appropriate relief, it is likely that subject imports from China will continue togain market share in the U.S. market at the expense of the domestic industry despite the decline indomestic demand, particularly in light of the projected increases in capacity by Chinese tire producers and
15 CR/PR at Table IV-3 and see Table V-13. 16 At the hearing, Jim Wansley, former president of USW local 746L at the Goodyear plant in Tyler, Texas,closed in 2006, testified on the cumulative adverse effects of the plant closing on the local community, includinghow the tire plant directly supported local suppliers and service providers and generated taxes to support publicservices, and that plant employees helped sustain local restaurants and shops. See Hearing tr. at 87-93.
43
the continued aggressive pricing by importers of the subject tires.15 The plant closures announced bydomestic producers for 2009 will be unavoidable and may be followed by additional closures in 2010,with significant adverse effects on workers and the surrounding communities.16 Absent a rapid and robustincrease in demand in 2010, which is at best uncertain, the domestic industry will likely lack the incentiveor ability to fund needed plant upgrades that would make the industry more competitive in the higher endof the market, leading to further erosion of the industry’s competitiveness and market share in the longterm.


1 The petition in this investigation was filed on April 20, 2009, by the United Steel, Paper and Forestry, Rubber,Manufacturing, Energy, Allied Industrial and Service Workers International Union (“USW”). The domestic industryis comprised of 10 domestic producers. The responding parties to the investigation are the American Coalition forFree Trade in Tires (“Coalition”); American Pacific Industries and Fullrun Tyre Corp. Ltd.; Cooper Tire & RubberCompany; GITI Tire (China) Investment Co., Ltd., and GITI Tire (USA) Ltd. (“GITI”); Les Schwab WarehouseCenter, Inc.; the Subcommittee of Tire Producers of the China Chamber of Commerce of Metals, Minerals, andChemicals Importers & Exporters (“Subcommittee”); and TBC Corporation.
45
SEPARATE AND DISSENTING VIEWS OF VICE CHAIRMANDANIEL R. PEARSON AND COMMISSIONER DEANNA TANNER OKUN
I. DETERMINATION
Pursuant to section 421(b) of the Trade Act of 1974 (19 U.S.C. § 2451(b)(1)) and on the basis ofthe information obtained in this investigation, we determine that certain passenger vehicle and light trucktires from China are not being imported into the United States in such increased quantities or under suchconditions as to cause or threaten to cause market disruption to the domestic producers of certainpassenger vehicle and light truck tires.
We join our colleagues in the discussions regarding background,1 statutory framework, anddomestic industry, including like or directly competitive domestic articles. We write separately to discussconditions of competition and to provide our analysis of the statutory factors.
II. SUMMARY
We find that the record before the Commission does not indicate that certain passenger vehicleand light truck tires (“tires”) from China are being imported into the United States in such increasedquantities or under such conditions as to cause or threaten to cause market disruption to the domesticproducers of tires. Indeed, we find that imposing a trade restrictive quota or tariff on the subject importswill be far more likely to cause market disruption than to alleviate it for domestic producers who havealready undertaken significant strategic adjustments to adapt to a changing global market.
While we find that subject imports are increasing rapidly and that the domestic industry ismaterially injured, we do not find that subject imports from China are a significant cause of materialinjury to the domestic industry. Thus, we find that market disruption does not exist.
The following factors are particularly important to our conclusion that subject imports are not asignificant cause of the material injury suffered by this industry and its workers. Domestic producers,who are not before the Commission, and *** on the request for relief, made significant strategic businessdecisions to shift U.S. production toward higher-value tires and capitalize on consumer brand loyalty. These decisions, including closing high-cost U.S. factories and factories producing small-size and lower-value tires, occurred before subject imports were a significant presence in the U.S. market. The plantclosings announced for 2009 are the result of the recession and the decline in demand for tires. Significantly, the U.S. producers making these decisions ***.
Domestic producers are global competitors marketing flagship brand name tires at a premium. They shifted their focus to higher-value/premium tires, including the larger-size and performance tires, atthe leading edge of the U.S. market. A majority of U.S. producers’ sales are in segments, includingoriginal equipment manufacturers (“OEM”) and premium/tier 1 tires, where subject imports are not

2 U.S. House of Representatives, Committee on Ways and Means, Permanent Normal Trade Relations with thePeople’s Republic of China, H.R. No. 106-632, 106th Cong., 2nd Sess., at 16.
46
competing in any meaningful manner. Nevertheless, domestic tire producers have not abandoned the tier2 and tier 3 segments and continue to compete with subject and nonsubject imports in these segments. Nonsubjects have long played a large and important role in the U.S. market. In fact, imports from allother sources dwarfed imports of tires from China, even in 2008. Domestic producers, as result ofsubstantial investments in foreign tire operations prior to 2004 and throughout the period examined,account for a substantial share of both subject and non-subject imports.
Domestic producers’ efforts to restructure product line and capitalize on selling higher-valueproducts were succeeding in increasing industry profitability. While Chinese imports increased involume and market share, these increases did not correlate with industry profitability. In fact, thedomestic tire industry was most profitable in 2007 when the largest increase in subject imports occurred. The domestic industry’s improvement would have continued if already weak demand had not plummetedin 2008 with the recession. The near collapse of the U.S. automobile industry lent a devastating blow tothe OEM tire market in 2008.
For these reasons, we find that a trade-restricting remedy will not provide relief to the domestictire industry and its workers, and is not in the national economic interest of the United States. In anindustry where domestic producers have already taken positive steps to adjust to global competition, wefind that not only will trade restrictions not provide effective relief to tire industry workers but will riskdisrupting the U.S. market by creating an adverse impact on U.S. producers. We are mindful that theindustry adjustments during the period examined already have displaced substantial numbers of tireworkers, and that the announced plant closings due to the current economic conditions will again be bornemost directly by the industry’s workers. That is why we respectfully urge the President to focus onproviding economic adjustment assistance to displaced tire workers through continued use of the TradeAdjustment Assistance or other programs that might be available to suppliers to the battered U.S.automobile industry. If the President chooses a trade measure, we would suggest a Tariff Rate Quota,with a quota set at 41.5 million tires and an over quota tariff rate of 55 percent in the first year, 45 percentin the second year, and 35 percent in the third year. Such an approach avoids a large increase in the basecost of the tires purchased by the poorest customers, and provides greater stability in pricing in the U.S.market.
III. MARKET DISRUPTION DOES NOT EXIST
At the outset, we note that Congress added section 421 to the Trade Act of 1974 by the U.S.-China Relations Act of 2000. Section 421 implements a transitional bilateral safeguard provision (i.e., the“anti-surge mechanism”) in the U.S.-China Bilateral Trade Agreement relating to China’s accession to theWorld Trade Organization. This safeguard provision applies to imports from China and, similar to othersafeguard provisions, applies without regard as to whether subject imports are fairly traded or not. Thelegislative history to section 421 explains that this safeguard provision
permit[s] the United States to provide relief to domestic industries and workers where products ofChinese origin are being imported in such increased quantities and under such conditions as tocause or threaten to cause market disruption to the domestic producers as a whole of like ordirectly competitive products. The relief is to be imposed only to the extent and for such periodas the President considers necessary to prevent or remedy the market disruption.2

3 U.S. House of Representatives, Committee on Ways and Means, Permanent Normal Trade Relations with thePeople’s Republic of China, H.R. No. 106-632, 106th Cong., 2nd Sess., at 19. 4 19 U.S.C. § 2451 (c)(1). 5 CR at V-12, PR at V-9. 6 CR/PR at Table C-1. 7 CR at V-14, PR at V-9. Reasons cited for the decrease in demand included the downturn in the economy, lowervehicle production, fewer miles being driven, overstretched tire life, and more radial tire use. Id. 8 CR at V-14, PR at V-9. Reasons cited for the increase included economic growth (particularly until 2008), anincreased use in performance wheels, and the continued popularity of SUVs, light trucks, and crossover vehicles. Id.
47
Congress also cautioned that, “[t]his is a temporary, extraordinary trade remedy specifically designed toaddress concerns about potential increased import competition from China. . . .”3
Market disruption exists “whenever imports of an article like or directly competitive with anarticle produced by a domestic industry are increasing rapidly, either absolutely or relatively, so as to be asignificant cause of material injury, or threat of material injury, to the domestic industry.”4 Thus, thefollowing conditions must be satisfied to determine that market disruption exists –
(1) imports of the subject product from China are increasing rapidly, eitherabsolutely or relatively;
(2) the domestic industry is materially injured, or threatened with material injury;and
(3) such rapidly increasing imports are a significant cause of the material injury orthe threat of material injury.
While subject imports increased rapidly and the domestic industry has experienced materialinjury, we find that such imports are not a significant cause of the material injury. Thus, we find thatsubject imports have not caused market disruption to the domestic producers of tires.
A. Conditions of Competition
The following conditions of competition inform our analysis of whether subject imports areincreasing rapidly, the domestic industry is materially injured, and such imports are a significant cause ofmaterial injury.
Demand Considerations. Demand for passenger vehicle and light truck (except racing cars) tiresis derived from the demand for new passenger vehicles and light trucks produced in the United States andthe need for replacement tires for existing passenger vehicles and light trucks.5 Apparent U.S.consumption for subject tires declined from 2004 to 2006, increased slightly in 2007, and then droppedsharply to its lowest level in 2008, as the U.S. economy slowed.6 Questionnaire responses were mixed asto whether demand for subject tires in the U.S. market had increased or decreased since 2004. Seven ofeight U.S. tire producers indicated that demand for subject tires in the U.S. market has decreased since2004.7 However, the majority of responding importers (21 of 26) reported that demand in the U.S. markethad increased.8

9 CR/PR at Table V-3. U.S. producers shipped 17.7 percent of their U.S. shipments to the OEM market and 82.3percent to the replacement market in 2008. U.S. importers shipped only 5 percent of their U.S. shipments fromChina but 21.9 percent of their U.S. shipments from other countries to the OEM market in 2008. CR/PR at TablesV-2 and V-3. While the OEM market may be less profitable for tire manufacturers, the objective of establishing atire in the OEM market in order to enhance subsequent sales in the replacement market appears to be the primaryjustification for accepting lower relative profitability on OEM sales. CR at III-14, n. 53, PR at III-12, n. 53. 10 While use of passenger vehicles and light trucks increased in the U.S. market from 2004 to 2007, U.S.production of such vehicles decreased by 27 percent from 2004 to 2008. CR/PR at Figures V-2 and V-4. 11 CR at V-12, PR at V-9. 12 CR at V-12, PR at V-9. 13 CR at I-29, n. 74 and V-12, PR at I-19, n. 74 and V-9. RMA predicts larger percentage declines in the OEMmarket than in the replacement market in 2009. CR at I-29, n. 74, PR at I-19, n. 74. 14 The Commission collected data from *** of these firms on their U.S. operations during the period 2004-2008. 15 CR at I-16, PR at I-11 and CR/PR Table I-2. 16 CR at III-14, PR at III-12. 17 CR at III-14, PR at III-12. ***, along with most of the smaller-volume producers in general, sell only into thereplacement market. Id. 18 CR/PR at III-1. For example, in July 2006, Michelin reported a reduction in production of 30 to 40 percent atits plant in Opelika, Alabama. CR at I-23, PR at I-17.
48
Demand for subject tires can be broken down into demand for tires sold in OEMs and demand forreplacement tires, with the replacement market accounting for over three-fourths of U.S. shipments.9 According to the Rubber Manufacturers Association (RMA), demand for OEM tires declined during 2008due to decreased passenger car production,10 and increased demand for vehicles with high fuel economy,a shift to P-metric passenger tires, and increased market share of imported light trucks.11 RMA reportedthat demand for replacement tires also declined during 2008 because of a decrease in miles traveled,consumers trying to get more miles out of existing tires, and the weak economy.12 RMA expects demandfor replacement and OEM market passenger vehicle and light truck tires to decrease in 2009 by 21 milliontires to 261 million tires, but to increase in 2010 to 270 million tires as the economy improves.13
Supply Considerations. There are three sources of supply for subject tires: domestic production,subject imports, and nonsubject imports.
The domestic industry producing the subject tires consists of 10 domestic producers.14 U.S.producers of subject tires range from large multinational companies with global production and sales andvarying levels of vertical integration to smaller volume producers with only domestic operations. In2008, U.S. producers manufactured the subject tires in 28 plants, with most of these plants producingonly, or virtually only, subject tires on the equipment and machinery and with the workers used toproduce the subject tires.15 Four U.S. producers, Bridgestone, Cooper, Goodyear, and Michelin, accountfor *** of cumulative U.S.-produced sales.16 These producers, with the exception of Cooper, sell intoboth the OEM market and the replacement market.17 Domestic producers manufacture a full range ofstyles and sizes of subject tires, which are sold in various price ranges.
Six U.S. producers (***) reported a decline in U.S. production and capacity due to plant closures,supply disruptions, or strikes.18 There were four U.S. plant closings during the period of investigation: Continental (Mayfield and Charlotte, 2006); Bridgestone (Oklahoma City, 2006); and Goodyear (Tyler,
19 See, e.g., CR at I-20 - I-23, III-4 - III-6, III-24 and III-25, PR at I-15-I-17, III-4-III-5and III-16 and CR/PRTable I-3. The capacity and announcements/closure dates for the four U.S. plants are: Continental (Mayfield,Kentucky), capacity of 4.0 million tires, in June 2004 announced indefinite suspension of tire production by end of2004, and permanently closed the facility at the end of 2006; Continental (Charlotte, North Carolina), capacity of 9.3million tires, in January 2006 announced reduction in production, in March 2006 announced indefinite suspension ofproduction and in May 2006 announced production would cease in July 2006; Bridgestone (Oklahoma City,Oklahoma), capacity of 18.4 million tires, in July 2006 announced closure of plant by end of 2006; and Goodyear(Tyler, Texas), capacity of 11.7 million tires, in October 2006 announced closure of plant in 2007. Id. 20 U.S. producers also announced expansions at some U.S. plants: Continental (Mount Vernon, 2008); Cooper(Albany, Texarkana, Tupelo, Findlay, 2004); and Toyo (White plant opened December 2005 and expansionannounced May 2007). 21 CR at I-16, n. 44, PR at I-11, n. 44. 22 CR at IV-6 to IV-10, PR at IV-3 to IV-6. 23 CR at IV-6, IV-7, and IV-9, PR at IV-3 to IV-6. 24 CR/PR at Table II-1. 25 CR at II-9, PR at II-7. 26 CR/PR at Table C-1. Nonsubject imports accounted for 31.9 percent of apparent U.S. consumption in 2004,33.6 percent in 2005, 34.5 percent in 2006, 33.4 percent in 2007, and 33.7 percent in 2008. Id. 27 CR/PR at Table II-1. 28 CR/PR at Table II-1.
49
2007).19 20 In addition, as a result of the current economic conditions, three additional plants closings arescheduled for 2009: Cooper (Albany, announced December 2008); Bridgestone (LaVergne, announcedJanuary 2009); and Michelin (Opelika, announced April 2009).21 Also, Bridgestone, Cooper, Goodyear,and Toyo reported some reduced production at some of their plants during the period of investigation fora variety of reasons (raw material shortage, recession, labor strike).
Seven of the ten U.S. producers (Bridgestone, Cooper, Goodyear, Michelin, Pirelli, Toyo, andYokohama) have subject tire manufacture facilities in China.22 All but two of these U.S. producers(Cooper in 2004 and Pirelli in 2005) had established their subject tire manufacturing operations in Chinaprior to 2004 and the substantial increases in subject imports.23
In 2006, U.S. imports from China were 27.0 million tires, making it the largest foreign supplier inthe U.S. market, with imports slightly higher than those from long-time supplier Canada. Imports fromChina continued to increase to levels at least double that of any other single foreign source in 2007 and2008.24 U.S. producers’ imports and purchases of subject tires from China accounted for 20.9 percent ofthe quantity of total subject tires imported from China in 2004, 21.8 percent in 2005, 26.1 percent in2006, 26.4 percent in 2007, and 23.5 percent in 2008.25
Nonsubject imports have long played a large and important role in the U.S.market. Nonsubjectimports supplied about one-third of apparent U.S. consumption in each year of the period examined.26 Total imports from all sources other than China continued to dwarf subject imports from China, even in2008; nonsubject imports as a share of total imports by quantity declined from 87.1 percent in 2004 to66.9 percent in 2008.27 The majority of nonsubject imports were from Canada, Japan, Korea, Indonesia,Brazil, and Mexico.28 U.S. producers were responsible for over *** of total nonsubject imports in each

29 CR/PR at Table II-3. 30 CR/PR at Table II-4. For the largest U.S. producers, ***, nonsubject imports as a share of U.S. productionranged from a low of *** to a high of ***. Id. 31 At least 80 percent of responding producers, importers, and purchasers indicated that subject tires produced inthe United States and imported from China are at least “frequently” used interchangeably. CR at V-20, PR at V-15. 32 CR at I-5 and I-9, PR at I-3, I6 and I-7. 33 CR at V-4 and V-6, PR at V-4 and V-5. 34 CR at V-6, PR at V-5. 35 Not all firms that responded to the standard producer and importer questionnaires responded to thesupplemental questionnaires. 36 CR/PR at Table D-1. 37 CR/PR at Table D-1. For example, *** classified associate brands as tier 3 but *** classified associate brandsas tier 2. 38 CR/PR at Tables D-1 and D-3. For instance, *** reported that *** percent of its U.S. shipments are tier 1 tires,yet not a single questionnaire respondent named *** as a tier 1 brand; *** listed *** as a tier 2 brand. 39 *** classified tires solely based on price. *** all included price descriptions when describing the differenttiers. CR/PR at Table D-1.
50
year of the period.29 Moreover, nonsubject imports as a share of U.S. production were substantial in eachyear of the period examined.30
Substitutability and Product/Market Considerations. The passenger vehicle and light truck tiresimported from China and produced domestically can be used interchangeably.31 All passenger vehicleand light truck tires sold in the U.S. market must meet standards established by the National HighwayTraffic Safety Administration and must meet U.S. Department of Transportation marking requirements.32
Subject tires, however, are not a commodity product. They are produced in a range of sizes tomatch the wheel size of the passenger vehicle or light truck, which is generally determined by the vehiclemanufacturer. Tires of a given size also are generally manufactured in a variety of designs to meetcustomer performance preferences such as long tread wear (which may involve use of a harder rubber inthe tread), better road grip (which may involve use of a softer rubber in the tread that results in fastertread wear and shorter tire life), and superior handling in winter weather (which may involve treaddesigns with wider and deeper grooves). In addition to differences in design and performance, the marketis differentiated to some extent by brand names, which permit certain companies to charge a higher pricethan others, and other segments, including the OEM and the aftermarket or replacement market.
There is consensus among the parties that the subject tire market is segmented between the OEMand replacement markets, and, to some degree, that there are categories or tiers within the replacementmarket.33 However, there is no consensus on how to define what types of tires are classified in each tier,or what brands are classified in each tier within the replacement market.34 In addition to examiningindustry publications placed on the record, the Commission issued supplemental questionnaires to gatheradditional information about competition among tiers.35 The record indicated that in general, tier 1comprises premium or flagship brands; tier 2 comprises mid-level, secondary/associate, or smallerproducer brands; and tier 3 comprises entry-level or non-recognizable branded tires.36 The majority ofquestionnaire responses classify private brands as tier 3 tires but are mixed as to where to place associatebrands, with some responses placing them in tier 2 and others placing them in tier 3.37 In addition, marketparticipants do not agree on what specific brands are classified in each tier.38 Other responses classifytires based on price.39

40 CR/PR at Table D-2. 41 Hearing Tr. at 360-61 (Ms. Trossevin). In response to a question from Commissioner Okun, Ms. Trossevin,speaking on behalf of the Coalition stated: “So what we are telling you is yes, you have one like product, no brightline. But you do have these three major market segments” (Hearing Tr. at 361). See also GITI’s post-hearing briefat 5: “The distinctions between these tiers are not as clear and sharp as the distinction between holding a contract tosupply a line of tires to an OEM and selling tires to a distributor for retail sale. . . . If the different tiers ofreplacement tires were that clearly distinguishable, respondents would be making a like product argument in thiscase. Instead, the same ‘like product’ is divided into three tiers based in significant part on brand equity.” 42 See GITI’s pre-hearing brief at 3. See also GITI’s post-hearing brief at 5, where GITI Tire asserts that thedistinction between tires produced for the OEM market and those produced for the replacement market is sharperthan that between tires in the three tiers. GITI Tire, however, does not argue that tires produced for the OEM marketare a separate like product or that the domestic tires produced for the OEM market are not “like” the subject imports. 43 CR/PR at Tables V-2 and V-3. Whereas U.S. importers shipped only 5 percent of their U.S. shipments fromChina to the OEM market, U.S. producers shipped 17.7 percent of their U.S. shipments and U.S. importers shipped21.9 percent of their U.S. shipments from other countries to the OEM market in 2008. U.S. producers shipped 82.3percent of their U.S. shipments to the replacement market in 2008. Id. 44 Based on the supplemental questionnaire responses, *** of total reported U.S. shipments of imports from Chinawere tier 1 tires, *** were tier 2 tires, and *** were tire 3 tires. 45 CR/PR at Table D-6. 46 Responses to producer questionnaire, question II-6. 47 See, e.g., Subcommittee’s posthearing brief at Exh. 6-Bridgestone’s Annual Report 2006 (“During the year adecision was made to close the Oklahoma City tire plant, which produces tires in the low-end segment of the marketwhere demand is shrinking and fierce competition from low-cost producing companies is increasing) and Exh. 7;Coalition’s posthearing brief at Exhs.5 and 6; GITI’s posthearing brief at Exh. 7; Petitioner’s prehearing brief at Exh.7; CR at III-25, n. 62, PR at III-16, n. 62 (“Factors also justifying the plant’s closure were identified as rising costs,Goodyear’s announced decision in June 2006 to exit the wholesale private label market, and reduced demand for thetypes of tires produced at the Tyler, TX plant.”).
51
Accordingly, there are wide variations in the estimates for the share of the total U.S. marketaccounted for by each tier. Producers and importers reported that tier 1 ranged from 21 percent to 78percent of the total U.S. tire market; tier 2 ranged from 7 percent to 52 percent of the market; and tier 3ranged from 10 percent to 50 percent of the market.40
While not arguing that there is a clear dividing line among each of the tiers, respondents, ingeneral, contend that competition is attenuated between domestically produced tires which are primarilyin tier 1 and 2 tires for the OEM and replacement markets, and subject imports which are primarily in tier3 tires for the replacement market.41 42 Whereas the U.S. product and nonsubject imports compete in boththe OEM and replacement market, most subject imports are sold in the replacement market.43 TheChinese product competes to only a limited degree in the premium or tier 1 segment of the replacementmarket.44
In narrative responses, U.S. producers *** all noted a U.S. market shift between 2004 and 2008to U.S. production of more higher-value, premium, flag brands and fewer commodity, budget/entry-level,private/associate tires.45 Respondents also have argued that U.S. producers have largely exited productionof tier 3 tires and now import these tires from their affiliates and other producers in both China andnonsubject countries. In producer questionnaire responses, ***.46 Also, according to some public pressreports on the various U.S. plant closings during the period, one of the reasons for the closure of bothBridgestone’s Oklahoma City plant and Goodyear’s Tyler plant was that the plants made smaller-sizedtires that were increasingly unpopular in the marketplace.47

48 *** reported some U.S. shipments of domestically produced tier 3 tires. Note that supplemental questionnairerespondents reported shares as a percent of the total market; staff calculated data based on the reported shares in thesupplemental questionnaire responses and reported U.S. shipment data from the producer questionnaire responses. 49 CR at V-28, PR at V-21. Raw material costs increased from $4.3 billion in 2004 to $5.3 billion in 2008. CR/PR at Table III-5. 50 CR at V-28, PR at V-21. The quarterly average prices of natural rubber and synthetic rubber increased by 29percent and 114 percent, respectively, between the first quarter of 2004 and the fourth quarter of 2008. Thequarterly average prices of natural rubber and synthetic rubber declined by 17 percent and 28 percent, respectively,between fourth of quarter 2008 and first quarter of 2009. Id. and Figure V-5. 51 See e.g., Circular Welded Non-Alloy Steel Pipe from China, Inv. No. TA-421-6, USITC Pub. 3807 (October2005); Certain Brake Drums and Rotors from China, Inv. No. TA-421-3, USITC Pub. 3622 (August 2003) at 14-16;Certain Ductile Iron Waterworks Fittings from China, Inv. No. TA-421-4, USITC Pub. 3657 (December 2003) at11-12; Uncovered Innerspring Units from China, Inv. No. TA-421-5, USITC Pub. 3676 (March 2004) at 10. Whileneither section 421 nor its legislative history expressly adopts either the section 406 practice or its legislative history,we note that section 406(e)(2)(B)(I) of the Trade Act states that imports are increasing rapidly “if there has been asignificant increase in such imports (either actual or relative to domestic production) during a recent period of time.”
52
U.S. production is focused on the higher-value, premium branded products and the OEM market,segments in which the subject imports are not competing in any meaningful manner. Nevertheless,subject imports also are not limited to those identified as tier 3, nor has U.S. production of tier 3 tiresceased. According to data submitted in supplemental questionnaire responses, the eight U.S. producersthat responded reported that overall, *** percent of their U.S. shipments in 2008 were tier 1 tires; ***percent were tier 2 tires; and *** percent were tier 3 tires.48 Of the five U.S. producers that reported datafor their imports from China in 2008, *** reported that all of their subject imports in 2008 were of tier 3tires; *** reported higher percentages of subject imports of tier 1 and 2 tires than tier 3 tires. Of the sevenU.S. producers that reported data for their imports from nonsubject countries in 2008, *** reported higherpercentages of nonsubject imports of tier 1 and 2 tires than tier 3 tires.
Among responding importers, excluding U.S. producers, 10 reported that *** of their importsfrom China in 2008 were tier 3 tires; three importers reported some subject imports of tier 2 tires. Siximporters, excluding U.S. producers, reported that *** of their nonsubject imports in 2008 were tier 3tires; two importers reported some nonsubject imports of tier 2 tires.
Other considerations. Escalating raw material costs accounted for approximately 50.5 percent ofthe total cost of goods sold for U.S. producers during 2004 to 2008.49 Natural rubber and synthetic rubberare the primary components of raw material costs.50
B. Rapidly increasing imports
Statutory Framework. To find market disruption, the statute requires that the Commission findthat imports of a product from China “are increasing rapidly, either absolutely or relatively.” Thus, theincrease must be occurring “rapidly.” The requirement is met if the rapid increase is in either absolute orrelative terms. The use of the word “are” suggests that the rapid increase should be recent and continuing,as opposed to in the distant past. Section 421 does not otherwise define “rapidly increasing” or the timingor circumstances of the increase. In the absence of express direction, we have determined that imports areincreasing rapidly if there has been a significant increase in such imports (either absolute or relative todomestic production or consumption) during a recent period of time.51
Although we do not regard the legislative history of section 406 to be controlling here, as it wasnot expressly adopted by section 421 or cited in its legislative history, it does not appear to be

52 The relevant legislative history of section 406 states as follows:
In applying the term “rapidly”, the ITC should examine whether imports have recently surged overhistorical levels. In conducting this inquiry, ITC should balance the amount of the increase andthe period of time involved. Thus, if the ITC finds that the increase is concentrated in a singleyear, it should look for a relatively sharp increase. If, on the other hand, the increase has occurredover a 2-3 year period, the longer period will provide a more stable basis for comparison and mayshow a steady trend toward higher import levels that meets the “rapidly increasing” requirement. Thus, in the latter situation, the increase need not be as sharp or as dramatic as that required over ashorter period. If imports have fluctuated up and down, the fact that imports are on a rapidupswing can satisfy the “rapidly increasing” requirement, even though imports have not reachedlevels attained in a previous period. If, however, the ITC finds that imports are stable, declining inabsolute terms and relative to domestic production, or increasing slowly, the “rapidly increasing”requirement would not be met.
Omnibus Trade and Competitiveness Act of 1988, House Conf. Rep. No. 100-576, 100th Congress, 2nd Sess.,reprinted in 1988 U.S.C.A.A.N. at 1723-24. 53 Uncovered Innerspring Units from China, Inv. No. TA-421-5, USITC Pub. 3676 (March 2004) at 10, n. 40(Chairman Okun and Commissioners Koplan and Pearson). 54 U.S. House of Representatives, Committee on Ways and Means, Permanent Normal Trade Relations with thePeople’s Republic of China, H.R. No. 106-632, 106th Cong., 2nd Sess., at 16, 19 (emphasis added). 55 Uncovered Innerspring Units from China, Inv. No. TA-421-5, USITC Pub. 3676 (March 2004) at 10, n. 40(Chairman Okun and Commissioners Koplan and Pearson). 56 Petitioner’s pre-hearing brief at 9-10.
53
inconsistent with the conclusions we reached in previous investigations. References in the legislativehistory of section 406 to a “steady trend toward higher import levels” and “imports on a rapid upswing”suggest a focus on recent imports and the current situation. With regard to the rapidity of the increase, thelegislative history indicates that the test can be met in one of three ways: through a relatively sharpincrease when the increase is concentrated in one year; through a steady, less dramatic increase over alonger period of two to three years; or as a result of a rapid upswing after imports have fluctuated up anddown.52
In Uncovered Innerspring Units from China, we stated that we would focus our analysis on themore recent time rather than the beginning of the period of investigation because it is more relevant to thepurpose underlying the statute.53 First, the legislative history to section 421 states that the legislation“implements the anti-surge mechanism established under the U.S.-China Bilateral Trade Agreement.” Second, Congress specifically designed the product-specific safeguard to “address concerns aboutpotential increased import competition from China in the future.”54 We also stated that we interpret thesection 421 legislative history as providing relief only if market disruption occurs or continues to occurafter China’s accession to the World Trade Organization (December 2001).55 Thus, we focus on the morerecent period of time and examine whether subject imports have increased sharply in the last year.
Arguments of the parties. The parties disagree with respect to whether imports are increasingrapidly. Petitioner asserts that imports from China are increasing rapidly in both absolute and relativeterms. Petitioner contends that imports of the subject tires from China increased by 215 percent byvolume and nearly 300 percent by value during the period of the investigation (2004-2008), that the rapidincrease in imports has been both recent and continuing, that in percentage terms the subject imports havemade double digit increases every year since 2004, and that since 2006, subject imports have increased bymore than 70 percent.56 Petitioner further argues that subject imports increased by 22 percentage points

57 Petitioner’s pre-hearing brief at 11. 58 Subcommittee’s pre-hearing brief at 8. 59 GITI’s pre-hearing brief at 10-11. 60 Coalition’s pre-hearing brief at 19-20. 61 In terms of quantity, the subject imports from China increased from 14.6 million tires in 2004 to 20.8 million in2005, 27.0 million in 2006, 41.5 million in 2007, and 46.0 million in 2008. In terms of value, they increased from$453.3 million in 2004 to $691.9 million in 2005, $931.7 million in 2006, $1.493 billion in 2007, and $1.788 billionin 2008. CR/PR at Table C-1. 62 CR/PR at Table C-1. 63 CR/PR at Table C-1. 64 The ratio of subject imports to U.S. production rose from 6.7 percent in 2004 to 10.0 percent in 2005, 14.6percent in 2006, 23.0 percent in 2007, and 28.7 percent in 2008. CR/PR at Table II-2. The ratio of subject importsto apparent U.S. consumption increased from 4.7 percent in 2004 to 6.8 percent in 2005, 9.3 percent in 2006, 14.0
(continued...)54
relative to domestic production and more than 12 percentage points relative to apparent domesticconsumption during the period examined (2004-2008).57
The Chinese respondents, on the other hand, posit arguments that imports of the subject tires fromChina are not increasing rapidly. Chinese respondent Subcommittee of Tire Producers asserts that theincrease has been “gradual,” with the largest increase occurring from 2006 to 2007, when there was ashortage in the U.S. replacement market due to the exit of U.S. producers from the Tier 3 economysegment of the market. It further contends that the increase in subject imports from 2007 to 2008 was“only 11” percent, and that the subject imports actually decreased by 14.7 percent in the first quarter of2009 as compared to the first quarter of 2008.58 Chinese respondent GITI asserts that the rate of increase“plunged” in 2008 as a result of the economic downturn and reduced levels of driving, and that theincrease in imports “abated” in the year preceding the petition and does not constitute the “spike” thestatute was intended to address.59 The American Coalition for Free Trade asserts that none of the threescenarios for finding rapidly increasing imports that the Commission identified in Brake Drums andRotors (a relatively sharp increase in 1 year, a steady less dramatic increase over 2 or 3 years, or a rapidupswing after imports have fluctuated up and down) is present in this case. Instead, the Coalitioncontends that there was a small annual increase from 2004 to 2006, a slightly higher increase in 2007, andthen a small increase again in 2008. It also asserts that increases subject imports in relative terms arederived from a small base and cannot be viewed as “sharp” or “dramatic.”60
Analysis. We find that imports of tires from China are increasing rapidly. Our analysis looks tothe increase and rate of increase in imports, and focuses on recent increases in imports.
In absolute terms, imports of the subject tires from China increased throughout the period ofinvestigation and were the highest, in terms of quantity and value, at the end of the period, in 2008.61 Asmeasured in quantity, subject imports rose by 215.5 percent during the period examined (2004-2008).62 As measured in value, subject imports rose even more rapidly, by 294.5 percent from 2004 to 2008. Focusing on the more recent period, subject imports by quantity increased by 53.7 percent from 2006 to2007, and 10.8 percent from 2007 to 2008, and by value increased by 60.2 percent from 2006 to 2007,and 19.8 percent from 2007 to 2008.63
Both the ratio of subject imports to U.S. production and the ratio of subject imports to apparentU.S. consumption rose throughout the period examined and both ratios were at their highest levels of theperiod in 2008.64 From 2004 to 2008, the ratio of subject imports to U.S. production increased by 22.0

64 (...continued)percent in 2007, and 16.7 percent in 2008. CR/PR at Table V-1. 65 CR/PR at Table II-2. 66 CR/PR at Table V-1. 67 We also note that one of the respondents asserted, in support of its claim that the subject imports are notincreasing rapidly, that the subject imports declined in actual terms during the first quarter of 2009. However, thedata series the Commission compiled and relied upon in this investigation did not include first quarter 2009 databecause a relatively complete data series for that period would not have been available in time to use in thisinvestigation. Even if the first quarter import data that the respondent cites are of some limited value in examiningtrends in actual imports, they are of no probative value in determining whether the subject imports are increasingrapidly in relative terms in the absence of a data series that includes first quarter 2009 U.S. production and apparentU.S. consumption data. Consideration of such first quarter 2009 import data does not change our finding thatimports of the subject imports from China are increasing rapidly, both absolutely and relatively. 68 Section 771(7)(A); 19 U.S.C. § 1677(7)(A).
55
percentage points.65 Similarly, the ratio of subject imports to apparent U.S. consumption increased by12.0 percentage points during the period examined.66 Focusing again on the more recent period, the twolargest year-to-year increases for both the ratio of subject imports to U.S. production and to apparent U.S.consumption occurred at the end of the period in 2007 and 2008, respectively.
We considered the arguments made by the parties, including the respondents. We do not agreewith respondents that the increases during the period examined as whole, during 2007 and 2008, or during2008 alone, were “gradual” or “small,” or that imports had “abated” by the end of the period. Rather, wefind that imports increased, both absolutely and relatively, throughout the period by significant amountsin each year and were at their highest level at the end of the period in 2008. Whether viewed in absoluteor relative terms, and whether viewed in terms of the increase from 2007 to 2008 alone, or the increasesduring the last 2 full years (or even the last 3 years), the increases were large, rapid, and continuing at theend of the period – and from an increasingly larger base.67
Finding. For the reasons set forth above, we find that imports of tires from China are increasingrapidly, in either absolute or relative terms, and that the increase was significant during the recent period. Thus, this first statutory criterion is satisfied.
C. Material Injury
Statutory Framework. The second criterion concerns whether the domestic industry ismaterially injured or threatened with material injury. Neither section 421 nor its legislative historydefines the terms “material injury” or “threat,” identifies economic factors to be considered, or cross-references any definitions, factors, or Commission practice under other statutory authorities to which theCommission might look for instruction. However, the term “material injury” appears in both section 406of the Trade Act of 1974 and Title VII of the Tariff Act of 1930. Title VII of the Tariff Act defines“material injury” to mean “harm which is not inconsequential, immaterial, or unimportant.”68 Section 406does not define “material injury,” but its legislative history contrasts the term with “serious” injury usedin section 201 –

69 Trade Act of 1974, Senate Report No. 93-1298, 93rd Cong., 2nd Sess., reprinted in 1974 U.S.C.A.A.N. 7186,7343-44. 70 See, e.g., Certain Welded Non-alloy Steel Pipe From China, Inv. No. TA-421-6, USITC Pub. 3807 (October2005) at 15, citing earlier decisions. 71 See, e.g., Certain Welded Non-alloy Steel Pipe From China, Inv. No. TA-421-6, USITC Pub. 3807 (October2005) at 15-16, citing earlier decisions. 72 Petitioner’s pre-hearing brief at 12-13. 73 Petitioner’s pre-hearing brief at 15, 18-19. Petitioner also claims that the industry’s return on assets was muchlower than the average return on assets for all large U.S. rubber and plastic companies in 2008. Id. at 17. 74 Petitioner’s pre-hearing brief at 38. 75 Petitioner’s pre-hearing brief at 39.
56
the market disruption test is intended to be more easily met than the serious injury tests insection 201. . . . the term “material injury” in section 406 is intended to represent a lesserdegree of injury than the term “serious injury” standard employed in section 201.69
In the absence of express direction in section 421, the Commission has found that “materialinjury” in section 421 cases represents a lesser degree of injury than “serious injury” under section 202 ofthe Trade Act.70 This lesser degree of injury applies for both present injury and threat of injury analyses. The Commission also has found it appropriate, in analyzing present material injury, to consider allrelevant economic factors that have a bearing on the state of the industry, including the three broadfactors in section 202(c)(1)(A) relating to idling of productive facilities, inability of firms to operate at areasonable level of profitability, and unemployment or underemployment. The Commission also hasconsidered other relevant economic factors, such as production, shipments, sales, inventories, capacityand capacity utilization, market share, employment, wages, productivity, profits, capital expenditures, andresearch and development expenditures. We do not view any single factor as necessarily dispositive, andhave considered all relevant factors within the context of the relevant business cycle and conditions ofcompetition that are distinctive to the affected industry.71
Arguments of the parties. The parties disagree as to whether the domestic industry is materiallyinjured and threatened with further material injury.
Petitioner asserts that the domestic industry has experienced significant idling of productivefacilities during the period examined and cites the closing of four plants and declines in productioncapacity and production.72 According to Petitioner, the industry is unable to operate at a reasonable levelof profitability and has experienced declines in operating income and operating margins from positivenumbers to losses, as well as declines in other indicators including shipments, market share, hoursworked, and wages paid.73 In addition, Petitioner points out that the industry has experienced significantunemployment and underemployment, with a loss of 4,000 jobs since 2004 and the projected loss of anadditional 3,000 jobs later in 2009 due to announced plant closings. Petitioner claims that increasedcapacity in China to produce the subject tires, a decrease in the share of tire production in China shippedto the domestic market in China, and declines in capacity utilization in China, threaten material injury tothe domestic industry.74 In addition, Petitioner cites projections in responses to Commissionquestionnaires indicating that tire producers in China plan to increase capacity by an additional 19.1million tires in 2009, and another 3.5 million tires in 2010, with exports to the United States to increaseby an additional 1.32 million tires in 2009.75
Chinese respondents contend that, when viewed in the context of the business cycle andcompared to other industries impacted by the general economic climate, the U.S. industry producing

76 Subcommittee’s pre-hearing brief at 10-12. 77 GITI’s pre-hearing brief at 16-19. 78 The Commission collected financial and other data from *** of the ten U.S. tire producers on their U.S.operations during the period 2004-2008. 79 CR/PR at Table C-1. U.S. producers’ capacity declined from 226.8 million tires in 2004 to 222.9 million tiresin 2005, 215.2 million tires in 2006, 196.3 million tires in 2007, and 186.4 million tires in 2008. Id. 80 CR at I-20 to I-25, III-1 to III-7, PR at I-15 to I-18, III-1 to III-6 and CR/PR at Table III-1. 81 CR/PR at Table C-1. U.S. producers’ production declined from 218.4 million tires in 2004 to 207.8 milliontires in 2005, 184.8 million tires in 2006, 180.3 million tires in 2007, and 160.3 million tires in 2008. Id.
57
subject tires is not experiencing material injury. In their view the domestic industry is undergoing apositive restructuring having nothing to do with imports, which will leave the industry more efficient andprofitable when the recession ends. They characterize the restructuring as involving the shift ofproduction from economy sector (tier 3) tires to higher performance, value-added tier 1 and tier 2 tires,with the production of tier 3 tires moved abroad to Mexico and other lower cost countries, includingChina.76 Respondents claim that even with the economic downturn and fewer miles driven in 2008, 7 ofthe top 10 tire manufacturers, including U.S. producers ***, experienced increased sales during 2008, byusing Chinese imports as part of a long-term strategic business plan to improve profitability. Theymaintain that the domestic industry’s results were even more favorable in 2007. They also note that whilesome domestic producers were closing older tire plants producing for the mass market, other domesticproducers were adding new production for market niches that focus more on brand equity and higher-value tires, and cite the new Toyo plant that opened in 2006 and has been further expanded; Kumho’sannouncement in January 2008 that it will build a plant in Georgia; and U.S. plant investments and plantline expansions announced by Continental and Pirelli.77
Analysis. We find that the domestic industry producing the subject tires is materially injured. The data show a continuous decline in U.S. producers’ domestic capacity, production, and shipments, aswell as in U.S. employment and hours worked throughout the period examined. Each of those indicatorswere at their lowest level in 2008.78 Four U.S. tire plants were closed during the period examined, andthree more are slated to be closed during 2009; only one new plant opened during the period ofinvestigation, in 2005. Domestic producers’ operating profits and losses and capacity utilizationfluctuated during the period examined, with financial performance (operating losses) at its lowest level in2008.
We considered U.S. producers’ average production capacity, production, and capacity utilization. Domestic producers’ average capacity declined throughout the period examined due largely to four plantclosures and capacity reductions in other plants. U.S. producers’ average capacity fell from 226.8 milliontires per year in 2004 to 186.4 million tires per year in 2008, or by 40.5 million tires (17.8 percent).79 Nearly half of the total decline (18.9 million tires) occurred from 2006 to 2007, reflecting the closure ofthree U.S. plants producing subject tires in 2006 (two plants were closed by Continental in 2006, and onelarge plant by Bridgestone in 2006). The declines caused by these closings and reductions were offsetonly in small part by the opening of a new U.S. plant by Toyo in 2005 and expansions at several plants.80 During the period examined, U.S. producers’ production declined from 218.4 million tires in 2004 to160.3 million tires in 2008, or by 58.1 million tires (26.6 percent). The largest year-to-year decline in thevolume of domestic producers’ production occurred from 2005 to 2006 (23.0 million tires).81 U.S.producers’ capacity utilization was relatively high but trended downward during the period examined,

82 U.S. producers’ capacity utilization was at its highest during the period examined in 2004, at 96.3 percent, andthen fell to 93.2 percent in 2005, fell to its lowest level of the period in 2006 at 85.9 percent, rose to 91.9 percent in2007, and then fell to 86.0 percent in 2008. CR/PR at Table C-1. 83 CR/PR at Table C-1. U.S. producers’ U.S. shipments declined from 194.7 million tires in 2004 to 181.8million tires in 2005, 163.8 million tires in 2006, 155.7 million tires in 2007, and 136.8 million tires in 2008. Id. 84 CR/PR at Table C-1. In this case we do not regard U.S. producers’ inventories as a significant indicator of thedomestic industry’s condition. U.S. producers generally produce subject tires in response to orders and do not holdsignificant inventories. ***. 85 CR/PR at Table C-1. The number of U.S. production workers declined from 36,411 in 2004 to 35,595 in 2005,34,037 in 2006, 31,842 in 2007, and 31,243 in 2008. Id. 86 CR/PR at Table C-1. The number of hours worked declined from 76.0 million in 2004 to 73.6 million in 2005,69.7 million in 2006, 67.2 million in 2007, and 63.1 million in 2008. 87 CR/PR at Table C-1. U.S. producers’ productivity was at it highest level of the period examined, 2.9 tires perhour, in 2004, and then fell to 2.8 tires per hour in 2005 and fell again in 2006 to 2.6 tires per hour. U.S. producers’productivity rose slightly in 2007 to 2.7 tires per hour, and then fell to the lowest level of the period in 2008 at 2.5tires per hour. Between 2004 and 2008, productivity fell by 11.5 percent, and between 2007 and 2008 fell by 5.3percent. Id. 88 *** firms reported data for 2004 and 2005, and *** reported data for 2006, 2007, and 2008. CR at III-14, PRat III-12 and CR/PR at Table III-7. 89 CR/PR at Table C-1. 90 CR/PR at Table C-1. The domestic industry had an operating income margin of *** in 2008. Id.
58
reaching its lowest level in 2006, the year in which three plants closed. Capacity utilization was higher in2007, and then declined in 2008.82
Domestic producers’ U.S. shipments of subject tires also declined each year during the periodexamined and were at their lowest levels in 2008, declining from 194.7 million tires in 2004 to 136.8million tires in 2008, or by 57.9 million tires (29.7 percent).83 U.S. producers’ inventories as a share oftotal shipments fluctuated, but generally increased during the period examined.84
We also considered U.S. employment in the production of tires, hours worked, and productivity. U.S. employment as measured in the number of U.S. production and related workers (PRW) producingthe subject tires declined each year during the period examined, as did the number of hours worked. Bothwere at their lowest level of the period in 2008. U.S. producers’ productivity fluctuated, but was also atits lowest level in 2008. The number of U.S. PRWs declined from 36,411 in 2004 to 31,243 in 2008, orby 14.2 percent. The largest one-year decline occurred in 2007, after the plant closings; the numbercontinued to fall in 2008.85 Hours worked by PRWs similarly fell each year during the period examined –by 17.0 percent between 2004 and 2008. However, the largest one-year decline occurred between 2007and 2008, when the number of hours worked fell by 6.1 percent.86 U.S. producers’ productivity, asmeasured in tires produced per hour, fluctuated during the period examined, but was at its lowest level ofthe period in 2008.87
We also considered U.S. producers’ reported operating income and operating loss data on theirdomestic passenger vehicle and light truck tire operations for each of the five years examined.88 With theexception of 2007, the domestic industry’s financial performance was anemic throughout the periodexamined. Operating income fluctuated over the period examined, falling from $256.2 million in 2004 toa loss of $114.5 million in 2006 and then increasing to a period high of $507.2 million in 2007, beforedeclining to another loss of $262.8 million in 2008.89 Operating income margins followed operatingincome, with modest positive margins in 2004, 2005, and 2007, and negative margins in 2006 and 2008.90

91 CR/PR at Table III-7. U.S. producers reported total operating income of $256.2 million in 2004 and $165.5million in 2005, an operating loss of $114.5 million in 2006, operating income of $507.2 million in 2007, and anoperating loss of $262.8 million in 2008. Id. 92 CR/PR at Table III-8. Industry R&D expenses increased from $270.7 million in 2004 (the lowest level of theperiod) to $296.2 million in 2005, fell to $288.6 million in 2006, and then rose to $307.1 million in 2007, the highestlevel of the period, and fell slightly to $306.7 million in 2008. Id. 93 CR/PR at Table III-8. Industry capital expenditures increased from $550.8 million in 2004 (the lowest level ofthe period) to $688.2 million in 2005, fell to $576.5 million in 2006, and then rose to $597.4 million in 2007 and to$729.3 million in 2008, the highest level of the period. Id. 94 19 U.S.C. § 2451(c)(2).
59
The number of producers reporting operating losses ranged from three to seven during the periodexamined, with the lowest number, three, reporting operating losses in 2007, and the highest number,seven, reporting operating losses in 2006. All firms reported declining operating income or increasingoperating losses in 2008 as compared to 2007.91
We also considered industry R&D expenses and capital expenditures during the period examined. Both of these indicators fluctuated within relatively narrow ranges during the period examined, and bothtrended upwards. R&D expenses were at their highest level in 2007,92 while capital expenditures were attheir highest level in 2008.93
In summary, we find that the domestic industry producing the subject tires is materially injured. Virtually all the industry indicators declined during the period examined and were at their lowest levels in2008. U.S. producers’ average capacity, production, and shipments, the number of U.S. production andrelated workers and hours worked, U.S. producers’ productivity, and U.S. industry financial performancewere all at their lowest or worst level of the period in 2008. Four plants were closed during the periodexamined, and in light of the current economic conditions, U.S. producers have announced plans to closethree more plants in 2009. Only two indicators, R&D expenses and capital expenditures appear to be uptowards the end of the period, and a third, inventories, which is not a significant indicator for thisindustry, shows no discernible trend.
We note that the trends observed for plant closings, capacity, research and development, andcapital expenditures are consistent with an industry undergoing a major restructuring during the periodexamined. The industry’s performance in 2007 demonstrated that the closures of high-cost plants and thereorganization of the product line toward higher-value tires was resulting in an improving bottom line andwould have continued if already weak demand had not dramatically declined in 2008 with the recession. The change in the business climate in 2008, however, reversed those positive trends. As discussed below,the fact that the industry’s performance turned negative in 2008 was not the result of subject imports, butwas due to the effects of the economic recession.
Finding. For the reasons set forth above, we find that the domestic industry producing passengervehicle and light truck tires is materially injured. Thus, this second statutory criterion is satisfied.
D. Subject Imports Are Not A Significant Cause Of Material Injury
Statutory Framework. The term “significant cause” is defined in section 421(c)(2) of the TradeAct to mean “a cause which contributes significantly to the material injury of the domestic industry, butneed not be equal to or greater than any other cause.”94 Section 406 of the Trade Act uses the same

95 Section 406(e)(2)(B)(ii), 19 U.S.C. § 2436(e)(2)(B)(ii). 96 Omnibus Trade and Competitiveness Act of 1988, House Conf. Report No. 100-576, 100th Cong., 2nd Sess.,reprinted in 1988 U.S.C.A.A.N. 1547, 1724. 97 19 U.S.C. § 2451(d). 98 19 U.S.C. § 2451(e)(2)(C). 99 Section 771(7)(B)(i) of the Tariff Act of 1930, 19 U.S.C. § 1677(7)(B)(i). 100 Petitioner’s pre-hearing brief at 20-23. 101 Petitioner’s pre-hearing brief at 28. 102 Petitioner’s pre-hearing brief at 31-33.
60
causation test and definition.95 The legislative history of section 406 describes the significant causestandard as follows –
Under this standard, the imports subject to investigation need not be the leading or mostimportant cause of injury or more important (or even equal to) any other cause, so long as a directand significant causal link exists. Thus, if the ITC finds that there are several causes of thematerial injury, it should seek to determine whether the imports subject to investigation are asignificant contributing cause of the injury or are such a subordinate, subsidiary or unimportantcause as to eliminate a direct and significant causal relationship. . . . 96
Section 421(d) includes a list of three objective factors that the Commission is required toconsider in determining whether market disruption is exists and that relate to the Commission’s causationanalysis:
(1) the volume of imports of the product which is the subject of the investigation;
(2) the effect of imports of such product on prices in the United States for like or directlycompetitive articles; and
(3) the effect of imports of such product on the domestic industry producing like or directlycompetitive articles.97
The presence or absence of any of these factors is not necessarily dispositive of whether market disruptionexists. The three factors are similar to a list of factors in section 406(e)(2)(C) of the Trade Act98 andparallel the criteria in Title VII of the Tariff Act that the Commission must consider in determiningwhether a domestic industry is injured by reason of dumped imports.99
Arguments of the parties. Petitioner argues that the subject imports are significant and haveincreased their market share at the direct expense of the domestic industry.100 It asserts that a surge inChinese tires has displaced domestic producers at many accounts, reducing their domestic production,capacity, and employment, which in turn has forced U.S. producers to close four plants, with three moreplant closures slated for the near future. According to Petitioner, the respondents are seeking to “re-writehistory” by “reversing the sequence of events apparent in the record” – low-cost imports from Chinadrove down prices and profitability to such an extent that domestic producers could no longer compete,and those producers were force to close the plants they could no longer operate profitably.101 Petitionercontends that the subject imports are underselling domestic tires by substantial margins and aresuppressing domestic prices.102 Petitioner asserts that subject imports are having a significant adverse

103 Petitioner’s pre-hearing brief at 35-36. 104 See, e.g., Subcommittee’s prehearing brief at 10-15 and 34-35; Les Schwab’s prehearing brief at 8-12; LesSchwab’s posthearing brief at 2;Coalition’s prehearing brief at 1-2; API’s posthearing brief at 6-7; GITI’s prehearingbrief at 10 and 27-33. 105 CR/PR at Table C-1. 106 CR/PR at Table C-1. 107 CR/PR at Table C-1.
61
impact on the domestic industry, and cites the large increase in subject imports and news releases thatattribute domestic plant closings to low cost imports, including from Asia.103
Chinese respondents argue that imports are not a significant cause of material or threat of materialinjury to the domestic industry. The pre- and post-hearing briefs and hearing testimony of the variousrespondents all contained a similar theme – that main reason why Chinese imports have entered the U.S.market is to fill the void left after U.S. tire producers decided to reduce or eliminate their U.S. productionof economy (tier 3) tires; that competition between U.S. produced tires and the subject imported tires isattenuated; that because of this attenuated competition, Chinese imports have little if any effect on thevolume and price of tires in market segments in which they are not present and thus little if any effect onU.S. producers; and there are several other factors other than Chinese imports, including the recent stateof the economy, that have affected U.S. tire production.104
Analysis. In performing our analysis, we first considered information relevant to the threestatutory factors that relate to our causation analysis – volume of imports, the effect of imports ondomestic prices, and the impact of imports on the domestic industry. For the reasons discussed below, wedo not find a sufficient causal nexus between the increasing subject imports and the performance of thedomestic tire producers.
Volume
As discussed above, imports of subject tires from China are increasing rapidly. The volume ofsubject imports increased each year both absolutely and relatively during the period examined. Thelargest increase in subject imports by quantity and value occurred from 2006 to 2007, 53.7 percent and60.2 percent, respectively.105 Subject imports as a share of apparent U.S. consumption increased from 4.7percent in 2004 to 16.7 percent in 2008, with the largest increase occurring from 9.3 percent in 2006 to14.0 percent in 2007.106 U.S. producers, however, experienced a steady decline in U.S. market share from2004 to 2007, with both subject and nonsubject imports capturing some of its share of the market from2004 to 2006.107

108 Twenty-five of 31 responding purchasers indicated that price was a very important factor in their purchasingdecisions. CR at V-16, PR at V-12 and CR/PR at Table V-5. 109 At least 80 percent of responding producers, importers, and purchasers indicated that subject tires produced inthe United States and imported from China are at least “frequently” used interchangeably. CR at V-20, PR at V-18and CR/PR at Table V-6. 110 Hearing Tr. at 111-114, and 166-168. 111 Hearing Tr. at 96, 157, 189, 226-227, 235, 245, 274-275, 281, 290-292. 112 For a further discussion of possible price effects, see infra Section V.D. regarding Distributional effects onconsumers. 113 CR at V-31 and V-32, PR at V-23 and V-24. No sales of subject Chinese tires to the OEM market werereported. 114 Pricing data reported by these firms accounted for approximately 14 percent of U.S. producers’ shipments ofsubject tires and 36 percent of U.S. shipments of subject imports from China in 2008. CR at V-32, PR at V-24. 115 In the 120 quarterly pricing comparisons, subject imports undersold the U.S. product in 119 quarters. CR/PRat Tables V-9 to V-14 and V-17. In 69 of 78 quarterly pricing comparisons, the prices of U.S.-produced tires sold tothe OEM market were lower than prices of comparable U.S.-produced tires sold to the replacement market. CR atV-45, PR at V-35 and CR/PR at Tables V-9, and V-11 to V-15. 116 See CR at V-45, PR at V-35. 117 CR at V-46 and V-47, PR at V-36.
62
Price
Price is considered a very important factor in purchasing decisions108 and subject tires producedin the United States and imported from China overall are frequently used interchangeably.109 However,tires are not a commodity product and are differentiated by factors such as size, speed rating, load factor,mileage per tire, the ride and handling quality of the tire, how the tire matches up to the particular vehiclemodel, and a range of other factors; these factors can affect the final price of the tire.110 Moreover,branding plays a role in the terms of price, and the major tire manufacturers have built brand equity overthe years in names such as Goodyear and Michelin.111 In addition, as described above, marketparticipants have described the three tiers of the market by using brand names, indicating that flagshipbrands are tier 1, smaller brands are tier 2, and non-recognized brands are tier 3.112
The Commission collected pricing data on six tire products for sales to the replacement marketfrom U.S. producers and importers, and for sales to the OEM market from U.S. producers.113 Six U.S.producers and 26 importers provided usable pricing data, although not all firms reported pricing for allproducts for all quarters.114 The pricing data for all six products show that the Chinese productsconsistently undersold the comparable domestic products in all but one quarterly price comparison duringthe period examined.115 We recognize that these comparisons include combinations of tires with differentspeed ratings, load indices, and levels of performance, which may have resulted in aggregation of tireshaving different price points.116 Thus, the consistent underselling could in part be a reflection of thisaggregation of products. While three of 10 responding producers reported that they had lost revenues andtwo of eight reported that they had lost sales, no producer reported specific examples of either lostrevenues or lost sales.117
Prices of both subject imports and the U.S.-produced tires generally increased over the period. While the increases in prices did not entirely cover increases in costs, the evidence suggests that any pricesuppression was not the result of subject imports. The cost-of-goods-sold (COGS) to sales ratio increasedsteadily from 84.7 percent in 2004 to 89.6 percent in 2006, but declined to 84.3 percent in 2007 (i.e., the

118 CR/PR at Table C-1. 119 See, e.g., Subcommittee’s Posthearing Brief at Exh. 11-Goodyear’s 2003 10K Report (“To maintain globalcompetitiveness, Goodyear has implemented rationalization actions over the past several years for the purpose ofreducing excess capacity, eliminating redundancies, and reducing costs...Goodyear has reduced employment levelsby 16,400 from December 31, 2000 and almost 25,400 since 1998, primarily as a result of rationalization activities . . . As part of the 2003 rationalization program, Goodyear closed its Huntsville, Alabama tire facility in thefourth quarter.”) and Exh. 13-Cooper’s 2004 10K Report (“The business environment for the automotive industrycontinues to be challenging at the present time. Pricing pressure on the U.S.-based OEMs, as evidenced bycontinued high levels of discounting at the retail level, increased health care, pension, and other retirement-relatedcosts, and the impact of global overcapacity have reduced the overall profitability of the industry and have resultedin continued pressure on suppliers for price concessions.”). 120 CR/PR at Table C-1. 121 See, e.g., responses to producer questionnaire II-6; Hearing Tr. at 159 (Gerard, “They are not as small as theyused to be. My wife’s car has a 13-inch tire. It was a 1987 Sprint. If you bought that same kind of vehicle today, itwould probably have larger tire[s].”); 313-315 (Mayfield regarding fuel efficient cars, “The tires that will getproduced and put on new vehicles, if they do in fact transform to more fuel efficient vehicles, they’re going torequire tires that have much more fuel efficient components in them . . . .it’s going to be new technology, it’s goingto be new sizes that we’ll see in the marketplace that going to require new technologies and new tooling and newinvestments in tire plants that source those products.”); and 315 (Borgman, “In the last ten years we’ve witnessed anexplosion in tire sizes and typically our foreign manufacturers have been more responsive to building those newsizes than our domestic manufacturers . . . . Yes, larger sizes.”); ***.
63
lowest level for the period occurred when the largest increase in subject imports occurred), and thenincreased to 90.1 percent in 2008 – slightly higher than the 2006 level.118
Impact
As discussed above, we find that the domestic industry is materially injured. We conclude,however, that the effect of the subject imports on the domestic tire producers, if any, has been limited, andless than the effect that would be required to find that the rapidly increasing imports are a “significant”cause of material injury.
As an initial matter, we note that this is an industry that has been marked by poor performance,well before significant volumes of subject imports entered the U.S. market.119 Focusing on the period ofinvestigation, we do not find clear correlations between trends in subject import volumes and prices, andthe performance of the domestic industry. In fact, when the largest increases in subject import volumeand market share occurred from 2006 to 2007 (53.7 percent and 4.7 percentage points, respectively), thedomestic industry experienced its strongest financial performance (operating income margin of 4.5percent).120 The industry’s improved financial performance in 2007 to almost sustainable profit levelswas the culmination of the industry’s strategic decision to consolidate and focus its U.S. production onhigher-value, premium products.
Faced with continued poor performance and a reduced U.S. market for smaller-sized and lower-value tires,121 the domestic producers made strategic decisions to rationalize their production. Theevidence demonstrates that U.S. producers, which are global competitors, decided to focus U.S.production on the premium flagship brand name tires and higher-value/premium tires that are at theleading edge of the U.S. market. This production shift, to some degree, followed the shift in demand bythe automobile industry for larger-size tires and away from the smallest tire sizes, even for the new small-size fuel-efficient cars. U.S. producers consolidated U.S. production by closing high cost U.S. factories

122 See, e.g., Hearing Tr. at 233-234 (James Mayfield, formerly employed by Continental, told the Commission atthe hearing that the closure of Continental’s two plants during the period had nothing to do with subject imports, butwere rather because those two plants were the highest-cost plants of all of Continental’s facilities, and he also cited areport by the USW that criticizes Continental’s management but does not refer to subject imports at all) and CR atIII-24 and III-25, n. 62, PR at III-16, n. 62. 123 As discussed above, the decisions to close these plants were before the subject imports rose substantially in2007. For Continental’s Mayfield plant, indefinite suspensions were announced in 2004 and the plant permanentlyclosed in 2006; for Continental’s Charlotte plant, layoffs began in June 2005; for Bridgestone’s Oklahoma Cityplant, it produced smaller tires at the lower-value end of the market. See CR at I-20 - I-23, and III-24 and III-25, n.62, PR at I-15-I-17, and III-16, n. 62; see also Coalition’s posthearing brief at 1-2; Subcommittee’s brief at 34-35(Respondents argue that for a causal nexus to exist between the U.S. plant closures and rapidly increasing importsfrom China, the surge in imports had to come first, and in this case, growth in subject imports followed plantclosings. They also point out that plant closing decisions are made over a period of many months and may bedelayed, for instance by union contracts. Respondents have placed numerous articles on the record regarding U.S.plant closings during the period.) 124 Supplemental questionnaire responses.
64
and factories that primarily focused on small-sized or low-value tires.122 The three U.S. plant closings in2006, and even the one in 2007, were not a response to increased subject imports, as they occurred beforesubject imports were a significant presence in the U.S. market, as discussed above.123 These closingswere part of long-term decisions by the domestic producers, which began prior to 2004 and prior to theincreases in subject imports, and were directly related to U.S. producers’ shifting U.S. production tohigher-value products to improve financial performance.
We recognize that domestic tire producers have not abandoned the tier 3 market, as respondentsmaintain. As discussed above, the domestic industry’s tire production is concentrated in tier 1 (***) andalmost evenly split between tier 2 (***) and tier 3 (***) tire production.124 Thus, domestic product andsubject imports continue to compete in the tier 2 and tier 3 markets. The evidence demonstrates that U.S.producers have shifted some of their production of lower-value/tier 3 tires from their U.S. plants to plantsabroad (in both China and nonsubject countries) as they focused on the U.S. production of higher-valuetires. Prior to 2004, and throughout the period examined, U.S. producers made substantial investments inforeign operations. U.S. producers accounted for over *** of total nonsubject imports in each year of theperiod and for a range of *** of total subject imports. In terms of volume, U.S. producers ***. Finally,the evidence indicates that the plant closings announced for 2009 are primarily the result of the recessionand the decline in demand for tires.
We recognize that from 2006 to 2007 (after the 2006 plant closures ), U.S. producers’ shipmentsdecreased by 5.0 percent, but also consider that U.S. producers saw an increase in the value of net sales, adecrease in COGS to net sales, an increase in productivity, and an operating loss turn to an operatingprofit, as subject imports increased by 53.7 percent and apparent U.S. consumption only increased by 1.6percent. We view this as evidence that the domestic industry’s efforts to restructure its product line weresucceeding in increasing industry profitability and would have continued if already weak demand had notplummeted in 2008 with the recession. The near collapse of the U.S. automobile industry lent adevastating blow to the OEM tire market in 2008. Thus, the fact that the industry’s performance turnednegative in 2008 was not the result of subject imports (whose rate of increase had slowed), but was due tothe effects of the economic recession on U.S. producers’ sales to both the OEM and the replacementmarkets.

125 Four U.S. producers, ***, responded “no” to the question of whether any increase in subject imports has beena cause of material injury to the domestic industry. An additional four producers, ***, responded that they were notin a position to answer, *** took no position, and *** did not respond to the question. *** reported that theysupport the petition; the other *** producers reported that they take no position on the petition. While *** reportedthat it supports the position, it indicated that subject imports have not caused it material injury, and it reported that itcould not respond at this time to whether it would make adjustments to operations to compete more effectively withimports from China if import relief is granted as a result of this investigation. 126 Jurisprudence regarding Title VII of the Tariff Act cases provides us some guidance on the issue of the weightto afford industry views. The Federal Circuit stated in Suramerica de Aleaciones Laminadas, C.A. v. United States,44 F.3d 978, 984 (Fed. Cir. 1994):
The views of the potentially threatened domestic industry on the nature of the threat and the views ofconsumers of the imports are without doubt relevant to whether the domestic industry faces a threat ofmaterial injury. The industry best knows its own economic interests and, therefore, its views can beconsidered an economic factor. Indeed an industry’s failure to acknowledge an affirmative threat has directsignificance. . . .[omitting case cite]. And in the difficult enterprise of projecting future economic harm, theindustry’s views take on added relevance. Moreover, publicly expressed industry support for the petition,or lack of it, is probative evidence of those views.. . . ITC must weigh industry views and views of other interested parties, together with all other relevanteconomic factors as appropriate under the record of each particular investigation. ITC may use its sounddiscretion in determining the weight to afford these and all other factors, but ITC cannot ignore them.
Id; see also Allegheny Ludlum Corp. v. United States, 287 F.3d 1365, 1375-76 (Fed. Cir. 2002).65
Finally, we find it telling that U.S. tire producers, with few exceptions, have indicated that subjectimports ***.125 We are mindful that under section 421, a certified or recognized union or group ofworkers which is representative of an industry has a right to file a petition and seek relief. We alsorecognize that industry views must be weighed with views of other interested parties, including the viewsof the workers, and together with all other relevant economic factors as appropriate under the record ofeach particular investigation.126 In doing so, we use our sound discretion to determine the weight toafford industry views and all other factors. In this investigation, we find the industry views of probativevalue in shedding light on the factors we must consider in our analysis. In particular, the fact that U.S.producers making the decisions about rationalizing the U.S. industry to fit the global tire marketplacereported that they were not materially injured by subject imports, and do not plan to make changes tooperations if a remedy is granted, is entitled to significant weight in our analysis of whether there is acausal nexus between subject imports and the performance of the domestic industry.
Finding. For the reasons, set forth above, we find that the record does not indicate a sufficientcausal link between subject import trends and the domestic industry’s performance. Thus, the thirdstatutory criterion is not satisfied and by definition market disruption does not exist.
IV. CONCLUSION
Having found, for the reasons set forth above, that while subject imports increased rapidly and thedomestic industry has experienced material injury, such imports are not a significant cause of the materialinjury, we find that subject imports have not caused market disruption to the domestic producers of tires. Accordingly, we make a negative determination that certain passenger vehicle and light truck tires fromChina are not being imported into the United States in such increased quantities or under such conditionsas to cause or threaten to cause market disruption to the domestic producers of certain passenger vehicleand light truck tires.
V. VIEWS REGARDING REMEDY

66
A. Summary
Section 421(f) instructs the Commission to propose the amount of increase in or imposition ofany duty or other import restrictions necessary to prevent or remedy market disruption. The same sectionalso states: "Members of the Commission who did not agree to the affirmative determination may submitin the report" to the President and the U.S. Trade Representative "separate views regarding what action, ifany, should be taken to prevent or remedy market disruption."
While we do not find market disruption to exist, we submit our views on remedy below, as hasbeen done previously in Section 421 investigations.
In sum, we urge the President not to take any trade-restricting action in this matter. It is our viewthat whereas subject imports have not been a significant cause of market disruption, any trade-restrictingremedy will not provide relief to the domestic tire industry and its workers, and is not in the nationaleconomic interest of the United States. In an industry where domestic producers have already takenpositive steps to adjust to global competition, we find that not only will trade restrictions not provideeffective relief to tire industry workers but will risk disrupting the U.S. market by creating an adverseimpact on U.S. producers. We are mindful that the industry adjustments during the period examinedalready have displaced substantial numbers of tire workers, and that the announced plant closings due tothe current economic conditions will again be borne most directly by the industry’s workers. That is whywe respectfully urge the President to focus on providing economic adjustment assistance to displaced tireworkers through continued use of the Trade Adjustment Assistance or other programs that might beavailable to suppliers to the battered U.S. automobile industry. Implementing a trade restriction would befar more likely to cause market disruption than to alleviate it.
If the President chooses a trade measure, we would suggest a Tariff Rate Quota, with a quota setat 41.5 million tires and an over quota tariff rate of 55 percent in the first year, 45 percent in the secondyear, and 35 percent in the third year. Such an approach avoids a large increase in the base cost of thetires purchased by the poorest customers, and provides greater stability in pricing in the U.S. market.
B. Two most likely scenarios
The record in this investigation does not permit us to answer with certainty how the marketplacewould respond to imposition of a restriction on the importation of tires from China. Regardless of whichtrade-restrictive remedy is implemented, the two most likely scenarios are:
(1) the curtailment of subject imports would limit supply in the U.S. market and raise costs forconsumers significantly, at least for the short term, while providing little or no relief for the U.S.tire industry and its workers. Domestic producers have indicated that they have no plans to adjusttheir operations in response to a trade remedy, so they would not be expected to hire or retainmany additional workers; or
(2) the global marketplace for tires is sufficiently fluid such that trade flows would be quicklyredirected, consumer costs would not rise appreciably, and there would be no noticeable increasein domestic tire production. The United States would import fewer tires from China and moretires from other countries with low production costs, but the overall supply of imported tires inthe United States would not change in a meaningful way.
In either case, trade restrictions will not provide effective relief to U.S. tire industry workers.
C. The proposed quota remedy

127 Memorandum EC-GG-004 (June 19, 2009) (Public Version) at Table 3. 128 The ITC economic model indicates a range of 4.9 to 6.4 percent for the increase in domestic shipments. EC–GG-004 at Table 3. 129 EC-GG-004 at Table 3 and CR/PR at Table C-1. 130 We note that petitioner has estimated that the proposed quota would save 3,000 jobs, USW prehearing brief at44-45, but we find that the record suggests that the employment effect would be lower. We have calculated theadditional jobs using the 6-percent domestic shipments figure from Table 3 of EC-GG-004. We note that thecalculation of additional workers would be lower if we had used the mid-range of increases in domestic production,since based on the modeling, the range for domestic production would be lower than the range for domesticshipments. Derived from EC-GG-004 at Table 3 and CR/PR at Table C-1. 131 EC-GG-004 at Table 3. The ITC economic model indicates a range of range $310 million to $524 million netwelfare loss. Id.
67
Petitioner USW has proposed a quota remedy, limiting imports of subject import tires from Chinato 21 million tires in the first year, with the quota total further restricted to the 2005 HTS distributionpattern.
Net welfare loss: Economic modeling available to the Commission indicates that the quota of 21million Chinese tires suggested by the USW would raise U.S. tire prices by 1.4 to 2.9 percent, andincrease U.S. producers’ tire shipments by 4.9 to 6.4 percent. Given that the value of U.S. consumptionof these tires was over $16 billion per year in 2007 and 2008, the price increases related to the quotawould lead to a net welfare loss of between $310 million and $524 million annually.127
For purposes of our analysis, we assume that the quota of 21 million Chinese tires leads to a 6-percent128 increase in U.S. producers’ tire shipments relative to the roughly 137 million tires shipped byU.S. producers in 2008.129 That would mean the manufacture of an additional 8.2 million tires in theUnited States. How many workers would be required to build those tires? Multiplying the 31,243workers employed in 2008 by 6 percent yields an additional 1,875 workers.130 This assumes that all 8.2million extra tires are shipped by newly hired or retained workers, rather than being manufactured byexisting employees working longer hours. As a practical matter, it seems reasonable to assume that asubstantial portion of the tires would be made by existing employees.
In the event that 1,875 jobs are preserved (through reduced plant closures) in response to theimport restriction, what would be the cost to society for each retained position? For purposes of ouranalysis, we assume that the net welfare loss of a 21-million-tire quota would be $400 million annually.131 Dividing $400 million by 1,875 jobs gives an average net welfare cost to society of $213,333 for eachposition that is not lost, a very high cost considering that the average wage in the industry was$24.91/hour, or $51,813 for a 2,080-hour year.
Distributional effects on consumers: The record in this investigation demonstrates that thelarge majority of tires imported from China are relatively low in price. Testimony at the public hearingindicated that a substantial portion of consumers buying Chinese tires have fairly low incomes and oftenare not able to afford higher-priced tires. These consumers may not be able to afford and may delaypurchasing new sets of tires, and thus would continue driving on tires that are worn out and possiblyunsafe. If an import restriction is successful at limiting import supply and raising prices in the UnitedStates, lower-income people will bear a disproportionate share of the burden.
Quota rents: If quotas restrict trade in a meaningful way, they will develop value (“quota rent”)that can be captured by someone in the marketing chain. It is not clear whether imposition of a quotawould produce rents in this case. One reason is the timing. Any remedy would take effect fairly quickly

132 Establishing this new program within the constraints of the Administrative Procedures Act could take manymonths to implement.
68
following a White House decision to implement it. Tires currently are shipped from China on an ongoingbasis. As a practical matter under a quota, tires initially would enter the United States on a first-come-first-served basis as they clear customs. Once a first-come-first-served system starts to operate, it mayprove challenging to go back and establish a system with which to capture quota rents.
A second reason is the structure of the marketplace. There are a number of Chinese producerswho would compete actively among themselves to ship as many tires as possible before the quota is filled. The only way to capture quota rents is if the Chinese government quickly establishes an export licenseregime and allocates the permission to ship some portion of the quota to individual firms. Similarly, U.S.importers are likely to scramble worldwide to find alternate suppliers and probably would view anypossible quota rents as ephemeral and not worth pursuing. They also would need the assistance of theU.S. government in order to establish an import licensing regime.
Capturing the quota rents in the United States: If a quota succeeds in restricting low-pricedimports, the U.S. government would have the theoretical possibility of capturing the quota rents. It mightdo this by setting up an auction or some other mechanism to sell the right to import some quantity ofChinese tires. However, the United States has not done this in other trade remedy cases, and it is not clearwhether it could be done here with sufficient speed to be successful.132 If a program to capture the quotarents is implemented, it could have the effect of transferring money from the relatively low-incomepurchasers of low-valued tires to the U.S. Treasury. This would tend to exacerbate the distributionalinequities of any import restriction.
Capturing the quota rents in China: If the United States implements a quota system without amechanism to capture quota rents in this country, the government of China would be free to try to capturethe quota rents. This could be done by controlling the export of subject tires to the United States througha system of export licenses. China’s extensive experience in managing export licenses for textiles andapparel may enable it to implement such a regime reasonably expeditiously. This would lead to anoutcome wherein the United States implements a policy that transfers money from lower-income peoplein the United States to the government of China.
Moving up the value chain: Any quota system that effectively restricts U.S. imports of low-valued tires could provide an incentive for Chinese tire producers to sell more sophisticated and higher-valued tires in the United States. The record does not demonstrate the extent to which producers in Chinawould be capable of moving up the value chain, but the imposition of quotas has led to similar results inother cases, most notably the 1980s-era agreement with Japan limiting automobile imports. If theindustry in China is capable of moving up the value chain, post-remedy competition may take placeacross the entire range of tire quality/performance and price, potentially injuring the domestic industry inits strongest markets – the higher-valued tire markets on which the U.S. producers have focused.
A temporary band-aid: It is not clear whether having a remedy that lasts only three years wouldbe of any lasting benefit to U.S. tire producers or their workers. A policy that only delays marketplaceadjustments until somewhat later may serve to undermine the U.S. industry by discouraging rational andtimely adjustments that may help the firms increase their competitiveness in the dynamic global economy,particularly in the current climate where the U.S. automobile industry and automobile suppliers areundergoing significant restructuring. The domestic industry has already made significant efforts toreorganize in the face of changing global conditions, with the adjustment efforts beginning in the 1990s.

133 CR at IV-6 - IV-10, PR at IV-3 - IV-6 and CR/PR at Table IV-6. 134 Hearing Tr. at 326 (Mr. Kogel). 135 CR at IV-6-IV-10, PR at IV-3-IV-6 and CR/PR at Tables II-4 and IV-2. 136 CR at VI-3, PR at VI-1. 137 Hearing Tr. at 73 (Mr. Stewart), 266 (Mr. Kogel), 282, 368 (Mr. Berra). 138 CR at IV-7, PR at IV-3-4 ***.
69
Substitutability among low-value tires: The U.S. industry focuses on the higher-valued tiresand produces substantially fewer lower-value tires. China produces lower-value tires, but it certainly isnot the only country to do so. If imports into the United States of Chinese tires are restricted, it is likelythat it would be easier to replace them with tires produced in other lower-value countries than withgenerally higher-valued tires produced in the United States.
Liquidity and flexibility in the global marketplace: The record in this investigation does nottell us enough about the global tire market to provide a sense of certainty as to whether any traderestriction would be effective. The record does indicate most major U.S. tire producers have globaloperations.133 The record also tells us that nonsubject imports already have a substantial presence in theU.S. market in both the replacement and OEM markets. If the worldwide market is sufficiently flexible,it is likely that any effort to restrict the flow of Chinese tires into the United States would quickly beoffset by the importation of similar lower-valued tires from other countries. At the public hearing on June2, respondents were asked how they thought the marketplace would react in the event that a quota wentinto effect. An importer of subject Chinese tires answered that his first alternative would be to try toobtain tires from a firm in South Korea. His second alternative would be to seek tires from a differentfirm in South Korea. His third alternative would be to source tires from Mexico.134 In other words, he didnot think it would take too long or be too difficult to find lower-valued tires to replace those he currentlywas obtaining from China. All that would be required to render an import restriction ineffective in amarket where many countries already manufacture tires and have established markets in the United Statesare a few adroit business decisions.
The role of multinational corporations: Several major tire companies, including U.S.producers, have manufacturing operations not only in China, but also in other countries.135 If an importrestriction serves to curtail their ability to import Chinese tires into the United States, they may be able toshift production from one country to another. As a hypothetical example, tires that previously may havebeen exported from Thailand to Russia might now be directed to the United States, while tires thatformerly had been exported from China to the United States might be sent instead to Russia. Thesophisticated nature of multinational firms makes it more likely that any effort to restrict Chinese importsinto the United States will have little or no effect on aggregate imports. This outcome would beconsistent with statements by some multinational firms manufacturing tires in the United States that theyhave no plans to adjust their U.S. operations in response to an import restriction on tires from China.136
Distributional effects on producers: Whether or not an import restriction targeted againstChinese tires is effective in raising prices in the United States, that restriction may have a substantiveeffect on U.S. firms producing tires in China. Cooper Tire is of particular concern. Cooper is a majorproducer of lower-valued private brand tires in the United States137 and also operates two tire plants inChina.138 Cooper imports some of the tires it produces in China into the United States. Although therecord in this investigation does not permit a definitive conclusion, those imports from China seem likelyto complement Cooper’s U.S. product line. The availability of Chinese imports may help to undergirdand strengthen the viability of Cooper’s U.S. production. Any import restriction aimed at Chinese tires islikely to prevent the shipment of at least a part of Cooper’s intended imports. Such a limitation may make

139 This accounts for the existing 4 percent duty and 11.2 percent overseas transportation cost.70
Cooper less competitive than other firms that manufacture tires in the United States, or other U.S.manufacturers which produce tires in nonsubject countries. It should be noted that ***. Thus, *** couldreceive an advantage relative to Cooper from the imposition of an import restriction against Chinese tires.
D. The proposed tariff remedy
The Commission majority has recommended to the President that a tariff of 55 percent beimplemented in the first year, dropping to 45 percent and 35 percent in years two and three, respectively. Since the average unit value (AUV) of imported Chinese tires in 2008 was $38.90, a 55 percent dutywould amount to $18.58 per tire at the existing value of Chinese imports.139 Such a substantial additionalcost would appear to be difficult for Chinese producers or the marketing system to absorb. Following aninitial adjustment period, the duty may be high enough to exclude almost all Chinese tires from the U.S.market.
As a practical matter, tires already under contract may continue to enter the United States for afew months. As soon as importers can find other sources of supply – most likely from nonsubjectcountries – the inflow of tires from China may slow to a trickle. Although a 55-percent duty may lead toa slight short-term increase in U.S. tire production and higher prices for relatively lower-cost tires for aperiod of months, the major beneficiaries are likely to be producers in nonsubject countries.
As a general principle of trade policy, tariffs normally are preferable to quotas because tariffs willallow imports to enter a country when there is sufficient domestic demand. As domestic supplies becomescarce, prices can rise high enough to make it economical to import products and pay the additional duty. A quota, on the other hand, does not allow imports to enter above the quota level, regardless of how highprices rise in the domestic market.
Despite this general principle, it is possible that a 55-percent tariff would prove to be morerestrictive to imports from China than the 21-million-tire quota proposed by USW. Due to the difficultiesof establishing any system for allocating quotas among importers, it would be most feasible for the UnitedStates to operate a quota on a first-come-first-served basis. That would make it likely that 21 millionChinese tires actually would enter the U.S. market. Competitive pressures and time constraints wouldmake it difficult or impossible to capture any quota rents, so the prices of imports from China wouldlikely not be substantially affected by the quota. Thus, a 21-million-tire quota would be likely to reduceimports from China to about half their current level, while a 55-percent duty might reduce imports fromChina even further, particularly after an initial period.
Distributional effects on consumers: Imposition of any import restriction may lower the netwelfare of the society subject to it. In this case, lower-income consumers are most likely to be affected. Upward price pressure at the lower-value end of the tire market may have the effect of compressing thespread between prices of the lower-value tier 3 tires and the middle-value tier 2 tires. It does not seemlikely that higher prices for the least-expensive tires would have a significant effect on prices at thehigher-value end of the tire market. Lower-value tires appear to compete largely on the basis of price,influenced by the tire’s mileage rating. On the other hand, high-end tires are marketed under differentconditions of competition. Expensive tires compete in a market characterized by substantial advertisingand price premiums associated with prominent brands. Prices for higher-value tires easily can be twice ashigh as for lower-value tires. So an increase in prices at the lower-value end of the tire spectrum is notlikely to be passed through to higher-value end tires. In other words, the costs of any import restrictionwould likely be borne largely by lower-income people.

140 Cooper Tire & Rubber, Final Comments on Remedy, pp. 2-3. 141 CR at III-13, n.46, PR at III-11, n. 46. 142 The domestic industry had its most profitable year in 2007, a year in which subject import volume was 41.5million tires. CR/PR at Table C-1.
71
Distributional effects on producers: A tariff regime that makes it infeasible to import tires fromChina may be particularly troubling to Cooper Tire. It is clear from Cooper’s submission regardingremedy that the company hopes to be able to continue importing tires from *** in China. Cooper’s briefexpresses specific views as to how a quota might be implemented in a manner that does not undulydisadvantage the company, assuming that a quota is the chosen remedy.140 The effects of any traderestriction on Cooper are important because the company is not only *** importer of Chinese tires amongU.S. tire producers, it also is the domestic producer most dependent on production of relatively lower-value private-brand tires in the United States.
The record in this investigation does not allow us to determine conclusively that Cooper’simports from China serve to complement its domestic production and strengthen its overall offerings inthe marketplace, but that would be a logical inference. It should be noted that ***, so it would not beaffected by a restriction on imports from China.141 In fact, it will be in an advantaged position relative toother U.S. producers, especially Cooper. The highly unequal effects of any trade-restricting remedy onthe various firms that constitute the U.S. tire industry should be considered carefully when decidingwhether to impose a trade restriction.
E. Conclusion and proposed remedy
We continue to believe that the best remedy would be to provide economic adjustment assistanceto tire workers who lose their jobs, and that implementing a trade restriction would be far more likely tocause market disruption than to alleviate it. However, if it is decided to impose a trade-restrictive remedy,we propose a tariff-rate quota.
A tariff-rate quota (TRQ) could be implemented that would allow 41.5 million Chinese tires toenter at the MFN duty rate (4.0 percent for radial tires) in the first year, with that quantity filled on afirst-come-first-served basis, and increasing by 5 percent in each subsequent year.142 Additional quantitiescould enter by paying a duty of 55 percent in the first year, 45 percent in the second, and 35 percent in thethird.
A TRQ along these lines would provide more flexibility for the marketplace to adjust than eithera quota or tariff regime on its own. That flexibility would tend to lessen the negative welfare effects andto decrease the probability that a trade restriction would create more market disruption than it alleviates.


1 See the section entitled “The Subject Merchandise” in Part I of this report for a complete description of themerchandise subject to this investigation. 2 The Federal Register notice cited in the tabulation is presented in app. A.
I-1
PART I: INTRODUCTION
BACKGROUND
On April 20, 2009, a petition was filed on behalf of the United Steel, Paper and Forestry, Rubber,Manufacturing, Energy, Allied Industrial and Service Workers International Union (“USW”), Pittsburgh,PA, requesting that the U.S. International Trade Commission (“USITC” or “Commission”) institute aninvestigation under section 421(b) of the Trade Act of 1974 (19 U.S.C. § 2451(b)) (“the Act”), todetermine whether certain passenger vehicle and light truck tires (“subject tires”)1 from China are beingimported into the United States in such increased quantities or under such conditions as to cause orthreaten to cause market disruption to the domestic producers of like or directly competitive products(section 421(b)(1) of the Act (19 U.S.C. § 2451(b)(1)). The Commission instituted the investigation, No.TA-421-7, on April 24, 2009. Information relating to the background of the investigation is providedbelow.2
Effective date ActionApril 20, 2009 Petition filed with the Commission
April 24, 2009 Institution of the Commission’s investigation (74 FR 19593, April 29, 2009)
June 2, 2009 Commission’s hearing1
June 18, 2009 Date of the Commission’s vote on market disruption
June 19, 2009 Date of the Commission’s determination to the President
June 29, 2009 Date of the Commission’s vote on remedy
July 9, 2009 Commission’s report transmitted to the President and the U.S. TradeRepresentative
1 A list of witnesses appearing at the hearing is presented in app. B.
STATUTORY CRITERIA AND ORGANIZATION OF THE REPORT
Statutory Criteria
Section 421(b)(l) of the Act (19 U.S.C. § 2451(b)(1)) states that the Commission shall, upon thefiling of a petition, receipt of a request or resolution, or on its own motion, promptly conduct aninvestigation to determine whether products of the People’s Republic of China are being imported into theUnited States in such increased quantities or under such conditions as to cause or threaten to cause marketdisruption to the domestic producers of like or directly competitive products.
Section 421(c) of the Act (19 U.S.C. § 2451(c)) states that:
market disruption exists whenever imports of an article like or directlycompetitive with an article produced by a domestic industry areincreasing rapidly, either absolutely or relatively, so as to be asignificant cause of material injury, or threat of material injury, to thedomestic industry.

3 Rubber Manufacturers Association (“RMA”) Factbook 2009, February 2, 2009, p. 3.
I-2
In determining whether market disruption exists, section 421(d) (19 U.S.C. § 2451(d)) requires the Commission to consider objective factors, including:
(1) the volume of imports of the product which is the subject of theinvestigation;
(2) the effect of imports of such product on prices in the United Statesfor like or directly competitive articles; and
(3) the effect of imports of such product on the domestic industryproducing like or directly competitive articles.
Organization of the Report
Information on the subject articles, the like or directly competitive domestic articles, and the U.S.market for such articles is presented in Part I. Data pertaining to the volume of U.S. imports and thequestion of rapidly increasing imports are presented in Part II. Information relating to the question ofmaterial injury, including U.S. industry data on capacity, production, shipments, inventories,employment, and financial condition, is presented in Part III. Available information relating to thequestion of the threat of material injury, including data on capacity, production, shipments, andinventories of manufacturers in China, is presented in Part IV. The question of the causal relationshipbetween the alleged injury and imports, with information on U.S. market penetration of imports, importsrelative to consumption, and pricing and related information, is presented in Part V. Additionalinformation regarding efforts by U.S. producers to compete is presented in Part VI.
U.S. MARKET SUMMARY
Subject tires generally are mounted onto the wheels of passenger cars, sport utility vehicles, vans,and light trucks. The leading U.S. producers of subject tires, in alphabetical order, are BridgestoneAmericas Tire Operations, LLC (“Bridgestone”), Cooper Tire and Rubber Co. (“Cooper”), Goodyear Tireand Rubber Co. (“Goodyear”), and Michelin North America, Inc. (“Michelin”). Leading producers ofsubject tires in China include ***. The leading U.S. importers of subject tires from China are ***. U.S.purchasers of subject tires include both original equipment manufacturers (“OEMs”) and replacement tirefirms. In 2008, 84.7 percent of all U.S. shipments of subject tires were purchased by the replacementmarket.3
Apparent U.S. consumption of subject tires, by quantity, totaled 275.7 million tires ($16.5 billion)in 2008. Currently, 10 firms are known to produce subject tires in the United States. U.S. producers’U.S. shipments of subject tires totaled 136.8 million ($9.5 billion) in 2008, and accounted for 49.6 percentof apparent U.S. consumption by quantity and 57.9 percent by value. U.S. imports from China totaled46.0 million tires ($1.8 billion) in 2008 and accounted for 16.7 percent of apparent U.S. consumption byquantity and 10.9 percent by value. U.S. imports from nonsubject sources totaled 92.9 million tires ($5.1billion) in 2008 and accounted for 33.7 percent of apparent U.S. consumption by quantity and31.2 percent by value.
SUMMARY DATA AND DATA SOURCES
A summary of data collected in the investigation is presented in appendix C, table C-1. Except asnoted, U.S. industry data are based on questionnaire responses of 10 firms that accounted for virtually allU.S. production of subject tires during 2008. U.S. imports are based on official Commerce statistics.

4 Certain Off-the-Road Tires From China, Invs. Nos. 701-TA-448 and 731-TA-1117 (Final), USITC Publication4031, August 2008. 5 Certain Passenger Vehicle and Light Truck Tires From China, 74 FR 19593, April 29, 2009. 6 The Harmonized Commodity Description and Coding System (“HCDCS”) does not utilize the term “lighttrucks,” but includes light trucks in motor vehicles having a “gross vehicle weight rating” of less than 5 metric tons(11,023 pounds) (HCDCS, Explanatory Notes, Fourth Edition, 2007, Vol. 5, Sections XVI-XXI, Chapters 85-97,heading 87.04). The National Highway Transportation Safety Administration defines light trucks as trucks with agross vehicle weight rating of 10,000 pounds or less, including pickups, vans, truck-based station wagons, and sportutility vehicles (http://www.nhtsa.dot.gov/people/ncsa/codes/mindata/Vehicle.html andhttp://www.safercar.gov/portal/site/safercar/menuitem13dd5c887c7e1358fefe0a2f35a67789/?vgnextoid=2f7c4507fe526110VgnVCM1000002fd17898RCRD). 7 The petition requested that the scope of the investigation consist of new pneumatic tires, of rubber, of a kindused on motor cars, including station wagons, sport utility vehicles, minivans, vans or on-the-highway light trucks,the foregoing whether tube or tubeless, and including radial and other tires. Such tires have, at the time ofimportation, the symbol "DOT" on the sidewall, certifying that the tire conforms to applicable motor vehicle safetystandards. Such tires may also have the following designations that are used by the Tire and Rim Association:
Prefix letter designations:P—Identifies a tire intended primarily for service on passenger cars;LT—Identifies a tire intended primarily for service on light trucks;
Suffix letter designations:LT—Identifies light truck tires for service on trucks, buses, trailers, and multipurpose passenger vehiclesused in nominal highway service.
Specifically excluded from the scope of this investigation and from the definition of subject tires are the followingtypes of tires:
C New pneumatic tires, of rubber, of a kind used on commercial medium, large, and heavy trucks, and buses;C New pneumatic tires, of rubber, of a kind used on racing cars;C New pneumatic tires, of rubber, of a kind used on agricultural or forestry vehicles and machines and
construction or industrial handling vehicles or machines;C New pneumatic tires, of rubber, of a kind used on aircraft, bicycles, motorcycles, trailers, all-terrain
vehicles, and vehicles for turf, lawn, and garden, and golf applications;C Pneumatic tires, of rubber, that are not new, including recycled and retreaded tires;C Non-pneumatic tires, such as solid rubber tires.
I-3
PREVIOUS AND RELATED INVESTIGATIONS
Subject tires have not been the subject of any prior safeguard, antidumping duty, orcountervailing duty investigations in the United States. The Commission has, however, conductedantidumping and countervailing duty investigations on a related product, namely certain off-the-road tiresfrom China. The Commission published its affirmative final determinations in those investigations inAugust 2008.4
THE SUBJECT MERCHANDISE
Scope of the Investigation
As described in the Commission’s notice of institution,5 the imported products subject to thisinvestigation consist of new pneumatic tires, of rubber, from China, of a kind used on motor cars (exceptracing cars) and on-the-highway light trucks,6 vans, and sport utility vehicles, provided for in subheadings4011.10.10, 4011.10.50, 4011.20.10, and 4011.20.50 of the Harmonized Tariff Schedule of the UnitedStates (“HTS”).7

8 Circular Welded Non-alloy Steel Pipe From China, Inv. No. TA-421-6, USITC Publication 3807 (October2005), p. 7. 9 The description of tires and the tire manufacturing process is taken primarily from The Tire Society, “ThePneumatic Tire,” 2006. 10 Statistics regarding such tires are reported to RMA.
I-4
Tariff Treatment
Subject tires are classifiable in the Harmonized Tariff Schedule of the United States (“HTS”)under subheadings 4011.10.10, 4011.10.50, 4011.20.10, and 4011.20.50. Table I-1 presents current tariffrates for subject tires.
Table I-1Subject tires: Tariff rates, 2009
HTS provision Article descriptionGeneral1 Special2
Column23
Rates (percent ad valorem)40114011.10
4011.10.10
4011.10.50
4011.204011.20.10 (5)
4011.20.50 (6)
New pneumatic tires, of rubber:Of a kind used on motor cars (including station wagons and racing cars):
Radial.........................................................................
Other..........................................................................
Of a kind used on buses or trucks:Radial..........................................................................
Other..........................................................................
4.0
3.4
4.0
3.4
(4)
(4)
(4)
(4)
10.0
10.0
10.0
10.0
1 Normal trade relations, formerly known as the most-favored-nation duty rate, applicable to China. 2 Special rates not applicable when General rate is free. China receives no special tariff treatment. 3 Applies to imports from a small number of countries that do not enjoy normal trade relations duty status. 4 General note 3(c)(i) defines the special duty program symbols enumerated for this provision. 5 Statistical reporting number 4011.20.1005 is applicable to radial tires for on-the-highway light trucks. 6 Statistical reporting number 4011.20.5010 is applicable to other than radial tires for on-the-highway light trucks.
Source: Harmonized Tariff Schedule of the United States (2009).
LIKE OR DIRECTLY COMPETITIVE DOMESTIC ARTICLE
In making determinations of what constitutes the domestic product like or directly competitivewith the imports subject to investigation, the Commission has considered such factors as (1) the physicalproperties of the article, (2) its customs treatment, (3) its manufacturing process (i.e., where and how it ismade), (4) its uses, and (5) the marketing channels through which the product is sold.8 Tariff treatment isdescribed above, channels of distribution are described in Part V, and information regarding theremaining factors is presented below.
Physical Properties and Uses9
Pneumatic (air pressurized) rubber tires, whether passenger car or light truck, have the same basiccomponents, as well as the same basic function. Virtually all U.S. passenger car and light truck tireproduction10 is radial in design, although bias-ply tires (diagonal and belted) are still used in some

11 RMA, Factbook 2009, February 2, 2009, p. 3, and The Tire Society, “The Pneumatic Tire,” 2006, pp. 3!4. RMA reports U.S. shipments of a small quantity of imported bias-ply tires for the OEM passenger car market,accounting for about 2 percent of total passenger car tire shipments.
I-5
applications domestically, as well as in emerging markets.11 Radial tires have their body ply cords laidradially from bead to bead, perpendicular to the tread centerline. Bias-ply tires have their body ply cordslaid at angles substantially less than 90 degrees to the tread centerline, as shown in figure I-1.
Figure I-1Subject tires: Tire types
The basic components of the radial tire, as shown in figure I-2, consist of a thin innerliner for airretention; the body ply skim which encases the reinforcing cords; the body plies of cord and rubber skimthat provide the strength to contain the air pressure and also provide sidewall impact resistance; beadbundles to anchor the inflated tire to the wheel rim; the abrasion gum strip that provides a layer of rubberbetween the body plies and the wheel rim; the bead filler to fill the space between the body plies and thebody-ply ends on the outside; the tire sidewall that protects the body plies from abrasion, impact, and flexfatigue; sidewall reinforcements to improve handling or stability; the belt skim that is the rubber coatingfor the steel cords; the stabilizer plies (belts) that restrict expansion of the body ply cords; belt wedgesand shoulder inserts that are used to maintain tire integrity as the tire moves; and the tire tread, subtread,and undertread for basic traction and stabilization.
Source: The Tire Society, “The Pneumatic Tire,” 2006, p. 3.

12 49 CFR § 575.104. The UTQG rating is made up of three components: treadwear, traction, and temperature. The treadwear grade is a comparative rating based on the wear rate of the tire when tested under controlledconditions on a specified government test track. For example, a tire graded 200 would wear twice as long on thegovernment test course under specified test conditions as one graded 100. Traction grades, from highest to lowest,are AA, A, B, and C. They represent the tire’s ability to stop on wet pavement as measured under controlledconditions on specified government test surfaces of asphalt and concrete. The temperature grades, from highest tolowest, are A, B, and C. These represent the tire’s resistance to the generation of heat. For a complete overview ofthe tire rating system and a description of the coding required on the sidewalls of tires, see: http://www.safercar.gov/portal/site/safercar/menuitem.13dd5c887c7e1358fefe0a2f35a67789/?vgnextoid=8e1c4507fe526110VgnVCM1000002fd17898RCRD. 13 Tire Tech Information/General Tire Information: Uniform Tire Quality Grade (UTQG) Standards, found athttp://www.tirerack.com/tires/tiretech/techpage.jsp?techid=48, retrieved on May 7, 2009. 14 Ibid.
I-6
The National Highway Traffic Safety Administration (“NHTSA”) established the Uniform TireQuality Grade Standards (“UTQG”)12 to provide consumers with information on the treadware, traction,and temperature capabilities of most passenger car tires sold in the U.S. market. Exceptions include deeptreaded light truck tires, winter/snow tires, temporary spare tires, trailer tires, tires under 12” in diameter,and other select tires.13 The grades for any particular tire are assigned by the tire manufacturers based ontheir own test results or tests conducted by an independent lab. To ensure the integrity of the testingprocess, the NHTSA has the right to inspect the tire data and can fine the manufacturer if inconsistenciesare found.14 Also, the NHTSA has a legislative mandate under Title 49 of the United States Code,Chapter 301, Motor Vehicle Safety, to issue Federal Motor Vehicle Safety Standards and Regulations towhich manufacturers of motor vehicle and equipment items, including tires, must conform and certify
Figure I-2 Subject tires: Components of a radial tire
Source: The Tire Society, “The Pneumatic Tire,” 2006, p. 8.

15 Retrieved on June 3, 2009 from http://www.nhtsa.dot.gov/cars/rules/import/fmvss/index.html#SN119. 16 Respondents argue that there is a “huge gap between these very branded products that command a premium inthe market and have that market power to draw those customers, and the economy brand market, the private brandmarket, where you don't have that.” Moreover, there is attenuated competition between these two. Hearingtranscript, pp. 360-361 (Trossevin). 17 Stefano Brusoni and Giorgia Sgalari, “New combinations in old industries: The introduction of radicalinnovations in tire manufacturing,” Journal of Evolutionary Economics, no. 16 (2006), pp. 30-31. 18 The Tire Society, “The Pneumatic Tire,” 2006, pp. 20-26. 19 The higher demand for natural rubber compared to SBR has been seen in both the passenger car and light trucktire markets. Other larger truck and bus tires require a different composition, with more SBR and less natural rubbercontent than in the subject tires.
I-7
compliance.15 Specifically, Standard No. 119 - New Pneumatic Tires, establishes performance andmarking requirements for tires for use on multipurpose passenger vehicles, trucks, buses, trailers, andmotorcycles. Its purpose is to provide safe operational performance levels for tires used on motorvehicles other than passenger cars, and to place sufficient information on the tires to permit their properselection and use.
Respondents argue that the subject tire market in the United States is segmented into three ormore categories. The precise terminology of these categories (such as Good/Better/Best; Tier 1/Tier2/Tier 3; and Flagship/Secondary/Mass-market) varies among respondents. The petitioner contends thatthere is no clear dividing line among categories and that the categories are not well-defined.16 Additionalinformation concerning the various categories, interchangeability of subject tires between the categories,and comparisons of domestic products and subject imports is presented in Part V.
Manufacturing Processes
The traditional or conventional process by which tires are produced in most plants hasn’t changedradically since the advent of the radial tire in the 1960s.17 Each of the compounds used in the traditionalprocess and the individual component parts are produced in batch processes and the tire is then assembledfrom those parts.18
The primary material used in the tire is rubber, either natural rubber or syntheticstyrene-butadiene (SBR) rubber. The composition mix between the synthetic and the natural rubber haschanged as the demand for radial tires increased, as the performance of radial tires benefits from a higherratio of natural rubber to synthetic rubber than in non-radial tires.19
The actual assembly occurs in two stages, as shown in figure I-3. The tire carcass is assembledon a rotating collapsible drum that is slightly larger than the diameter of the tire bead. The innerliner andbody plies are applied first; then the beads and bead filter are placed and the body plies are turned overthe beads and rolled or stitched to the body ply lying flat on the drum. The completed tire body carcass isthen removed from the collapsible drum and taken to a second machine.

20 The Tire Society, “The Pneumatic Tire,” 2006, p. 24.
I-8
The second-stage equipment expands the first-stage body carcass and expands it into the largertire belts and tread, which were assembled on a separate drum. The resulting “green” tire is rotatedagainst a tread area to adhere all its components securely before it can be cured.20
As shown in figure I-4, the curing or vulcanizing process takes place in a curing “press”composed of two tire molds that sit side by side with inputs for the required curing materials, includingwater, air, vacuum, and steam. The two mold halves are attached to the curing press and the green tire isinserted between them. As the press closes, the mold closes around the green tire and forces the outsideof the tire to conform to the mold. The pressure and the increased temperature created by super-heated
Figure I-3 Subject tires: Tire assembly process
Source: The Tire Society, “The Pneumatic Tire,” 2006, p. 24.
Figure I-4 Subject tires: Tire curing process
Source: The Tire Society, “The Pneumatic Tire,” 2006, p. 25.

21 Ibid., p. 25. 22 Stefano Brusoni and Giorgia Sgalari. “New combinations in old industries: The introduction of radicalinnovations in tire manufacturing.” Journal of Evolutionary Economics, no. 16 (2006), pp. 31-33. 23 Ibid., p. 31. 24 Michelin, 2001 Fact Book: The passenger car and light truck market markets, and Tire Futures, found athttp://www.motorcyclistonline.com/howto/122_0507_tire_technology/index.html, retrieved on June 4, 2009. 25 Tire Tech Information/Marketing, Michelin’s C3M Process, found athttp://www.tirerack.com/tires/tiretech/techpage.jsp?techid=19&, retrieved on June 4, 2009. 26 Tire Futures, op. cit., and Pirelli, History of MIRS evolution, found athttp://www.pirellityre.com/web/technology/innovation/mirs/history/default.page, retrieved on June 8, 2009. 27 Tire Futures, op. cit. 28 Ibid., p. 56. 29 Goodyear, Goodyear Impact Manufacturing Technology, found athttp://www.goodyeartires.com/about/testing/impact.html, retrieved on June 10, 2009. 30 Supplier Business, The Tire Report, p. 56, and Bridgestone, “Bridgestone unveils next generation productionsystems for tires,” news release, November 26, 2002. 31 Ibid., p. 56, and hearing transcript, p. 330 (Gwinn).
I-9
steam cause a chemical reaction in which the polymers within the rubber become crosslinked, therebyincreasing the strength and elasticity of the finished product.21
Several of the domestic tire companies are now using a new production method, so that instead ofmultiple batch processes there is a continuous assembly process in which each of the component parts isproduced as they take their place in the structure of the tire.22 Each of the companies has its ownindividual versions of the process; some processes have various deposits onto the tire carcass occurring atstations, while others take place as the drum moves along a trolley system. The curing is accomplishedwithin the same system by such means as electrical heating or internal injection of steam or nitrogen,allowing for the same molding that occurs in the older conventional methods.23
Michelin’s continuous process, called C3M (Confection Monofilament Mondrian Michelin), wasfirst implemented in 1993, and produces a tire in one step, instead of the seven steps in the process usedby Michelin in its older plants using the conventional production process.24 In addition, the tire is madeon a single mold, allowing for improvements in the precession of the assembly.25 In 1998, Pirelliintroduced a similar production process called MIRS (Modular Integrated Robotized System).26 In theMIRS system, robots move around the mold and the forming tire to do all the necessary steps. Unlike inMichelin’s C3M process where all operations are performed in one specialized machine, the MIRSprocess separates the functions and creates a workstation for each within a single production cell.27 InPirelli’s MIRS process the mold on which the tire is built is itself moved from one to another of thevarious work stations for each individual part of the production process, while in the Michelin C3Mprocess different robots access the non-moving tire mold.28 In 1998, Goodyear introduced a newproduction process called IMPACT (Integrated Manufacturing Precision Assembled CellularTechnology). In the IMPACT system, component formation, pre-assembly, automated tire assembly, andcuring occur within a cellular system. Goodyear estimated that the system increased productivity by 135percent, reduced material costs by 15 percent, labor costs by 35 percent, reduced cycle times by 70percent, significantly lowered energy costs, and cut in-process inventory by half.29 In 2002, Bridgestoneintroduced a new production process, named BIRD (Bridgestone Innovative and Rational Development)that reportedly improved upon the MIRS production model used by Pirelli by including an inspection stepinto the basic manufacturing process. Bridgestone estimates that one of its BIRD units can producebetween 200,000 and 350,000 passenger car tires annually.30 Bridgestone is reported to have two or threefactories using the BIRD process, none of which are located in the United States.31 Toyo also has an
32 Toyo, “Grand opening of new tire manufacturing facility in Georgia,” news release, December 12, 2005. 33 Hearing transcript, p. 330 (Gwinn). 34 Michelin, 2001 Fact Book, op. cit., and Michelin, What news on the C3M process?, found athttp://www.michelin.com/corporate/finances/en/popup.jsp?lang=EN&newsId=3046, retrieved on June 8, 2009. 35 Toyo, “Grand opening of new tire manufacturing facility in Georgia,” news release, December 12, 2005. 36 Bridgestone, “ Bridgestone unveils next generation production systems for tires,” news release, November 26,2002. 37 Michelin, Reducing the impact on the environment, found athttp://www.michelin.com/corporate/front/templates/affich.jsp?codeRubrique=89&codePage=PAG_REDUC_IMPCT_ENV&lang=EN, retrieved on June 8, 2009, and Bridgestone, “ Bridgestone unveils next generation productionsystems for tires,” news release, November 26, 2002. 38 Bridgestone, “Bridgestone unveils next generation production systems for tires,” news release, November 26,2002. 39 Supplier Business, The Tire Report, p. 55 (exh. 18 of petitioner’s prehearing brief). 40 Supplier Business, op. cit., p. 56. 41 Petitioner’s prehearing brief, p. 6.
I-10
automated continuous production process system, A.T.O.M. (Advanced Tire Operation Module), whichwas introduced at the opening of Toyo’s production facility in White, GA in 2005.32
The reported advantage of the new technology is that it allows a producer to make shorter runs ofmore specialized product, with a quicker turn-around time, and at much less cost.33 Michelin reportedthat plant construction has been reduced from 18 to 24 months to only a few weeks, and that start-up timeis only 24 hours after delivery of a C3M module to a site.34 In addition, these systems are scalable,allowing for production capacity flexibility in response to market demand.35 The smaller footprint ofthese systems reportedly allows more compact production facilities than a conventional productionprocess. Bridgestone estimates that its BIRD system occupies between one-fourth and one-third as muchspace.36 These systems also reduce the amount of electricity used in the production process. Michelinestimates that its C3M process enables energy savings of 60 percent compared with traditionalmanufacturing processes, while Bridgestone estimates savings of 40 percent compared to its newestconventional production systems.37 These systems also reduce or eliminate the intermediate inventories. Bridgestone estimates that overall productivity is more than twice as high as the conventional productionprocess. In addition, compared with conventional production systems, continuous production systemshave also reportedly allowed for increased flexibility in accommodating new kinds of tire structure andnew and different kinds of tire materials. Along with the ability to produce a diverse range of tires, thenew systems can also produce multiple sizes of tires simultaneously.38
An industry source stated that while Michelin’s C3M process saved a great deal on the labor costassociated with the conventional tire production process, the increased capital cost, complexity, andhigher technological risk made the overall cost of tire production by the new method very close to thecost of the conventional process.39 The older process remains more economically viable, especially inolder plants that are used for longer production runs.40
LIKE OR DIRECTLY COMPETITIVE PRODUCT ISSUES
The petitioner contends that the domestically produced subject tires are like or directlycompetitive with the subject imports.41 The respondents do not make an argument with respect to thedomestic like or directly competitive product. One respondent party argues that U.S.-produced consumer

42 American Coalition for Free Trade in Tires, prehearing brief, p. 3, and hearing transcript, pp. 360-361(Trossenvin). 43 Kumho Tire Co., Inc. (“Kumho”), which currently does not have production facilities in the United States,commenced construction of a plant in Macon, GA in May 2008. The plant will have an annual production capacityof 2.1 million tires and will reportedly manufacture ultra-high-performance tires for the OEM and replacementmarket. In November 2008, Kumho suspended the construction of the plant, and pushed plans for the plant back ayear, citing the faltering U.S. auto industry as the reason for its re-evaluation of the project. Kumho, “Kumho Tiresexpands manufacturing base to U.S.,” news release, May 13, 2008, and Rubber and Plastics News, “Kumho Tiredelays U.S. plant 1 year,” February 9, 2009. 44 In addition, in December 2008, Cooper announced the pending closure of its manufacturing facility in Albany,GA. In January 2009, Bridgestone announced the pending closure of the passenger and light truck tire portion of itsLaVergne, TN facility and in April 2009, Michelin announced the pending closure of its Opelika, AL facility. Further information concerning U.S. producer plant closings is presented in Part III.
I-11
tires are like products but are not directly competitive with the subject imports.42 Respondents’ argumentsconcerning the interchangeability of subject tires between categories and the comparisons of domesticproducts and subject imports are presented in Part V.
THE U.S. MARKET
U.S. Producers
Table I-2 presents U.S. producers’ plant locations, positions on the petition, U.S. production, andshares of total reported U.S. production in 2008. Most of the producers took no position on the petition.Table I-3 presents plant openings and closings by U.S. producers during 2004-08. Table I-4 presentsinformation on the daily production capacity and unionization status of each plant. Company profiles arepresented following the tables.
Producers were asked whether they experienced any plant openings, relocations, expansions,acquisitions, consolidations, closures, prolonged shutdowns, curtailments of production, or any otherchanges in the character of their operations or organization relating to the production of subject tiresduring the period for which data were collected. *** reported the expansions of existing facilities or theinstallation of a new plant,43 *** reported plant closures,44 *** reported layoffs, *** reported reducedproduction or temporary shutdowns, *** reported prolonged shutdowns because of strikes, and ***reported raw material shortages or disruptions. Three producers reported producing other products on thesame equipment and machinery, and using the same production and related workers employed to producesubject tires; *** reported that ***, while *** reported producing ***, and *** reported producing ***. *** reported producing *** on the same equipment, but not using the same production and relatedworkers as those used in the production of subject tires.

I-12
Table I-2Subject tires: U.S. producers, their positions on the petition, plant locations, U.S. production, andshares of U.S. production, 2008
Firm Position on the
petition Plant location(s)
Subject productshare of totalestablishmentsales (percent)
Production(1,000 tires)
Share ofreported
U.S.production(percent)
Bridgestone1 *** La Vergne, TN; WilsonCity, NC; Aiken County, SC
*** *** ***
Continental2 *** Mt. Vernon, IL (3) *** ***
Cooper4 *** Findlay, OH; Texarkana,AR; Tupelo, MS; Albany,GA
*** *** ***
Denman5 *** Leavittsburg, OH *** *** ***
Goodyear6 *** Akron, OH; Fayetteville,NC; Gadsden, AL; Lawton,OK; Topeka, KS; UnionCity, TN; West Amherst,NY
*** *** ***
Michelin7 *** Ardmore, OK; Dothan, AL;Greenville, SC (AntiochChurch Rd.); Greenville,SC (Perimeter Rd.);Lexington, SC; Opelika,AL; Tuscaloosa, AL;Woodburn, IN
*** *** ***
Pirelli8 *** Rome, GA *** *** ***
Specialty Tires9 *** Indiana, PA *** *** (10)
Toyo11 *** White, GA *** *** ***
Yokohama12 *** Salem, VA *** *** ***
Total 160,310 100.0
* * * * * * *
Source: Compiled from data submitted in response to Commission questionnaires.

I-13
Table I-3Subject tires: U.S. producers’ plant closures and openings, plant locations, and capacity, 2004-08
Year Firm Plant location Capacity (tires)1
Openings
2005 Toyo White, GA ***
Closings
2006 Bridgestone Oklahoma City, OK 18.4 million
Continental Mayfield, KY 4.0 million
Continental Charlotte, NC 9.3 million
2007 Goodyear Tyler, TX 11.7 million
2009 Bridgestone LaVergne, TN (announced January 2009)
3.4 million
Cooper Albany, GA (announced December 2008)
9.6 million
Michelin Opelika, AL (announced April 2009)
9.5 million
Total, closings 65.9 million 1 Annual capacity calculations for plant closing are calculated using Modern Tire Dealer’s daily capacity at year ofclosing, assuming 365 production days per year.
Source: Compiled from data submitted in response to Commission questionnaires and various public documents.

I-14
Table I-4Subject tires: U.S. producers’ plants and capacity, 2008
Firm Union Plant location(s)
Dailycapacity
(1,000 tires)
Share of total U.S. capacity
(percent)
Bridgestone USW La Vergne, TN 9.4 1.5
None Wilson City, NC 33.1 5.2
None Aiken, SC 25.0 3.9
Continental None Mount Vernon, IL 36.0 5.7
Cooper USW Findlay, OH 22.0 3.5
USW Texarkana, AR 32.0 5.0
None Tupelo, MS 41.0 6.4
None Albany, GA 26.3 4.1
Denman USW Warren, OH 1.4 0.2
Goodyear USW Fayetteville, NC 45.0 7.1
USW Gadsden, AL 25.0 3.9
None Lawton, OK 65.0 10.2
USW Topeka, KS 1.0 0.2
USW Union City, TN 48.0 7.5
USW Buffalo, NY 9.7 1.5
Michelin None Ardmore, OK 43.0 6.8
None Dothan, AL 5.0 0.8
None Greenville, SC 28.0 4.4
None Greenville, SC (C3M) 7.0 1.1
None Lexington, SC 19.0 3.0
USW Opelika, AL 26.0 4.1
USW Tuscaloosa, AL 28.0 4.4
USW Fort Wayne, IN 28.0 4.4
Pirelli None Rome, GA 1.5 0.2
Specialty Tires None Indiana, PA 0.4 0.1
Toyo None White, GA 7.0 1.1
Yokohama USW Salem, VA 23.1 3.6
Total 635.9 100.0
Source: Modern Tire Dealer.
45 The plant commenced production in 1969. *** Bridgestone, “Bridgestone Firestone to close Oklahoma Citytire plant,” news release, July 13, 2006. 46 The plant commenced production in 1972, and in 1983 was purchased from The Firestone Tire & Rubber Co.. Bridgestone, “Bridgestone Firestone Addresses Decrease In Demand For Passenger And Light Truck Tires,” newsrelease, December 1, 2008, and Bridgestone, “Bridgestone Americas Tire Operations announcement regardingLaVergne, Tenn., tire plant,” news release, January 22, 2009. 47 *** Bridgestone, “Firestone Industrial Products’ Force Majeure Notice – Hurricane Rita,” news release,October 12, 2005. 48 The plant commenced production in 1960 and was acquired as part of General Tires in 1987. Continental,“Continental suspends tire production at Mayfield plant,” news release, June 29, 2004. 49 “Continental Tire to close Kentucky plant,” Charlotte Business Journal, August 2, 2006, found athttp://charlotte.bizjournals.com/charlotte/stories/2006/07/31/daily31.html, retrieved on May 14, 2009. 50 The plant commenced production in 1967 and was acquired as part of General Tires in 1987. “Continental Tirespeeds up layoffs; to cut 481 jobs in July,” Charlotte Business Journal, May 8, 2006, found at http://charlotte.bizjournals.com/charlotte/stories/2006/05/08/daily8.html, retrieved on May 14, 2009, and ModernTire Dealer, Plant capacities, found at www.moderntiredealer.com%2ffiles%2fstats%2fPlant-capacity-3.pdf,retrieved on May 14, 2009. 51 Continental, “CTNA to reduce production at Charlotte plant,” new release, January 9, 2006, and Continental,“CTNA announces indefinite suspension of tire production at Charlotte plant,” news release, March 10, 2006.
I-15
Bridgestone
Bridgestone, headquartered in Nashville, TN, is a *** business unit of Bridgestone Americas,Inc., whose parent company is Bridgestone Corp., Japan. Bridgestone Corp. operates 48 new tire plantsthroughout the world, including three subject tire manufacturing plants in the United States. These threesubject tire plants had a combined average production capacity of *** subject tires in 2008. Bridgestoneclosed a subject tire plant in Oklahoma City, OK in December 2006, due to *** and a shrinking ofdemand for low-end tires the plant produced, which was facing increasing “fierce competition from low-cost producing countries.”45 In January 2009, Bridgestone announced the *** closure of the passengerand light truck manufacturing portion of its LaVergne, TN tire plant. Bridgestone attributed the closureto reduced demand for subject tires due to “negative economic conditions.”46 In addition to these plantclosures, Bridgestone also experienced a shortage of raw material, specifically ***, in late 2005 due tohurricanes Katrina and Rita.47 Bridgestone also reported ***.
Continental
Continental, headquartered in Lancaster, SC, is a subsidiary of Continental AG, Hannover,Germany. Continental currently operates one subject tire manufacturing facility in Mount Vernon, IL,which has a production capacity of *** passenger and light truck tires. In June 2004, Continentalannounced the indefinite suspension of tire production at its facility in Mayfield, KY by the end of2004.48 Continental permanently closed the facility at the end of 2006, citing declining businessconditions as well as the escalating cost for energy and raw materials.49 In July 2006, Continental ceasedtire production at its Charlotte, NC facility which produced 6.5 million tires per year and had a reportedproduction capacity of 9.3 million passenger and light truck tires.50 Continental attributed the closure to“global competition putting pressure on us as our manufacturing costs are cheaper overseas,” the“skyrocketing costs of energy, raw materials, and health care,” and its inability to successfully restructureits labor agreement with the USW.51 In 2008, Continental announced a $60 million investment in its plantin Mount Vernon, IL over the next three years, more than $40 million of which will be invested in itspassenger and light truck tire operations.

52 Cooper reportedly remains one of the largest private brand tire manufacturers in the United States. Most of thecompany’s private brand products are reported to be still made in the United States, but a growing percentage ofproduction is being transferred to the firm’s low-cost plants in Asia. Modern Tire Dealer, “What does the futurehold for private brands?”, May 12, 2009. 53 Cooper, “Investor Presentation, April 2009,” and Cooper’s response to the U.S. producers’ questionnaire. 54 The plant commenced production in 1967, and was acquired in 1990. Previously, Firestone had operated theplant, but had ceased production in 1986. Cooper, “Cooper Tire announces intent to close Albany, GA facility,”news release, December 17, 2008. 55 Cooper, “Cooper Tire announces increased investment in manufacturing facilities,” news release, January 16,2004, and Cooper, “Cooper Tire increases capacity at Findlay, OH tire plant,” news release, February 18, 2004. 56 Cooper, “Cooper Tire’s Texarkana plant halts production,” news release, March 14, 2005, and Cooper,“Cooper Tire & Rubber Company announces ratification of contract with union,” news release, April 11, 2005. 57 Cooper, “Cooper Tire production affected by hurricane damage,” news release, September 28, 2005. 58 Cooper, “Cooper Tire adjusts production in challenging industry environment,” news release, June 23, 2008. 59 Modern Tire Dealer, Plant capacities, found atwww.moderntiredealer.com%2ffiles%2fstats%2fPlant-capacity-3.pdf, retrieved on May 14, 2009.
I-16
Cooper
Cooper, headquartered in Findlay, OH, with a stated strategic focus on light vehicle replacementtires52 (i.e., no OEM tires), currently operates four subject tire manufacturing facilities in the UnitedStates, with a production capacity of *** subject tires in 2008.53 In December 2008, Cooper announcedthe closure of its plant in Albany, GA by the end of 2009, mentioning “increased lower-priced importsand the softening domestic demand for {its} products.”54 In 2004, Cooper announced $33.9 million incapital equipment investments for its U.S. plants, with a reported increase in production capacity of morethan 2.9 million tires.55 Cooper reported a strike at its Texarkana plant that temporarily shut down anddisrupted production at the plant in 2005.56 In September 2005, Cooper announced that its plants inTexarkana, AR and Tupelo, MS, would temporarily operate at reduced production due to raw materialshortages caused by Hurricane Rita.57 Cooper reported another reduction in production for the secondquarter of 2008, due to decreased tire demand and projected shortages in certain raw materials.58
Denman
Denman, headquartered in Leavittsburg, OH, has a tire manufacturing facility at the samelocation, with a production capacity of *** subject tires. Denman is owned by Pensler Capital Corp.59 Denman reported that it *** plant openings, closures, expansions, or any other changes in the character ofits operations or organization relating to the production of subject tires since January 1, 2004.
Goodyear
Goodyear, headquartered in Akron, OH, operates over 30 tire manufacturing facilities throughoutthe world, including seven plants in the United States with a production capacity of *** subject tires in2008. *** of these plants are operated under the joint venture Goodyear Dunlop Tires North America,Ltd. (“Goodyear Dunlop”), which is *** owned by Goodyear. In 2007, Goodyear closed one of its plantsin Tyler, TX, which had a production capacity of approximately 9 million subject tires, reportedly due topressure from low-cost imports which competed with the plant’s small-diameter passenger car tires and to

60 The plant commenced production in 1962. Goodyear, “Goodyear announces planned closing of Tyler facility,”news release, October 30, 2006. 61 Goodyear, “Goodyear expects temporary impact from hurricane Rita,” news release October 3, 2005, andGoodyear, “Goodyear & USW reach tentative agreement on new labor contract,” December 22, 2006. 62 Rubber and Plastics News, “Goodyear Dunlop to cut 150 at N.Y. facility,” November 17, 2008. 63 Michelin, “BFGoodrich Tire Manufacturing’s Opelika Plant to Reduce Production Beginning Fourth Quarter2006,” news release, July 11, 2006. 64 The plant commenced production in 1963. Michelin, “BFGoodrich tire manufacturing plant in Opelika, Ala. toclose,” news release, April 13, 2009. 65 Pirelli, About Pirelli Tyre, found at http://www.pirellityre.com/web/company/about-pirelli-tyre/default.page,retrieved on May 14, 2009, and e-mail from ***, May 12, 2009. 66 Specialty Tire, Company information, found at http://stausaonline.com/company-information/index.html,retrieved on May 14, 2009.
I-17
its decision to exit certain segments of the private-label tire business.60 In addition to this plant closure,Goodyear reported that subject tire production was disrupted in 2005 as a result of hurricanes Katrina andRita, and in 2006 as a result of a labor strike.61 In November 2008, Goodyear Dunlop announced plans tocurtail production at its Tonawanda, NY plant, due to lower demand.62
Michelin
Michelin, headquartered in Greenville, SC, is wholly owned by Michelin Corp., Greenville, SC,which is a part of Compagnie Generale des Etablissements Michelin, France (“CGEM”). CGEM operates69 plants in 19 countries, including eight subject tire production facilities in the United States operated byMichelin with an average production capacity of *** subject tires in 2008. In 2006 Michelin reported areduction in production of 30 to 40 percent at its plant in Opelika, AL, due to “shrinking demand in themass market tire market and to intense cost pressure due to imports from competitors in lower-costcountries.”63 In April 2009, Michelin announced the October 2009 closure of its plant at Opelika, AL,due to lower demand as a result of the “continuing economic crisis, which has created significantovercapacity in the North American tire markets.”64
Pirelli
Pirelli, headquartered in Rome, GA, is wholly owned by Pirelli North America, Inc., which is asubsidiary of Pirelli Tyre S.p.A, Milan, Italy, a division of Pirelli Group, Milan, Italy. Pirelli Tyre has 23manufacturing facilities in 12 countries around the world, including one in Rome, GA which has aproduction capacity of *** subject tires. Pirelli reported that ***.65 Pirelli reported that it *** plantopenings, closures, expansions, or any other changes in the character of its operations or organizationrelating to the production of subject tires since January 1, 2004.
Specialty Tires
Specialty Tires, headquartered in Indiana, PA, is wholly owned by Polymer Enterprises, Inc.,Greensburg, PA. Specialty Tires has one manufacturing facility for subject tires in Indiana, PA, with a production capacity of *** subject tires in 2008.66 Specialty Tires reported that it *** plant openings,closures, expansions, or any other changes in the character of its operations or organization relating to theproduction of subject tires since January 1, 2004.

67 Toyo, “Grand opening of new tire manufacturing facility in Georgia,” news release, December 12, 2005. 68 Toyo, “Toyo announces tire production in the United States,” news release, February 17, 2004. 69 Toyo, “Toyo to expand North America tire production,” news release, May 15, 2007. 70 Toyo response to the U.S. producers’ questionnaire, section II-2. 71 Rubber and Plastics News, “Tire makers hit hard by declining demand,” November 7, 2008. 72 Yokohama, Global network, found at http://www.yrc.co.jp/english/profile/overseas3.html, retrieved on May 14,2009.
I-18
Toyo
Toyo, headquartered in White, GA, is a wholly owned subsidiary of Toyo Tire Holdings ofAmericas Inc., Cypress, CA, which is a wholly owned subsidiary of Toyo Tire & Rubber Co., Ltd.,Osaka, Japan. Toyo has one subject tire manufacturing facility in White, GA with capacity of *** subjecttires. The plant commenced production in December 2005 with a target annual production capacity of 2million passenger and light truck tires. Toyo invested approximately $180 million.67 Toyo reported thatit built the new plant in response to the “robust overseas demand, mainly in North America,” noting thatToyo’s existing plants in Japan had little capacity for further expansion.68 In May 2007, Toyo announceda $50 million expansion to increase capacity to about 3.3 million tires per year by 2009. Toyo stated thatthe expansion was to “help Toyo to expand North American sales of its 16-to-24 inch UHP tires, andmeet anticipated future demand from local auto manufacturers for OEM tires.”69 Toyo reported that***.70 In addition to the expansion to its production facility, Toyo also experienced the curtailment ofproduction in late 2008, due to the economic downturn and raw material shortages due to Hurricane Ike.71
Yokohama
Yokohama, headquartered in Fullerton, CA is a wholly owned subsidiary of Yokohama Corp. ofAmerica of Fullerton, CA, which is owned by The Yokohama Rubber Co., Tokyo, Japan. Yokohamaoperates one subject tire production facility in the United States located in Salem, VA with a productioncapacity of *** subject tires in 2008.72 Yokohama reported that it *** plant openings, closures,expansions, or any other changes in the character of its operations or organization relating to theproduction of subject tires since January 1, 2004.
U.S. Importers
Importer questionnaires were sent to 44 firms identified in proprietary Customs data thatrepresented at least 90 percent of total imports of subject tires from China in 2008 and during 2004-08. Thirty-five firms responded to the questionnaire, accounting for the great majority of imports of subjecttires from China in 2008. Information from the major importers regarding their U.S. imports from Chinaand shares of total imports from China during 2008 is presented in table I-5.
The top five importers of subject tires from China between 2004-08, based on proprietaryCustoms data, are ***. ***. ***. *** and *** did not report any plant or warehouse openings,relocations, expansions, acquisitions, consolidations, closures, or prolonged shutdowns.
Table I-5Subject tires: U.S. importers of subject tires from China, their locations, reported U.S. importsfrom China, and shares of total reported U.S. imports from China, by firms, 2008
* * * * * * *

73 Responses were not included for several firms that responded to the purchaser questionnaire but identifiedthemselves solely as importers or reported only suppliers in foreign countries. 74 RMA projects total tire shipments in 2009 to decline by 21 million tires to 261 million tires, but begin to turnaround in 2010, increasing to 270 million tires. RMA predicts that shipments of OEM passenger tires will declineby nearly 22 percent to 29 million tires in 2009, but rebound in 2010 by 6 million tires, and shipments of OEM lighttruck tires will decline by 900,000 tires from 2.9 million in 2008, but increase by 300,000 tires in 2010. Shipmentsof replacement passenger and light truck tires are projected to follow a similar pattern, declining in 2009 byapproximately 3.5 percent and 8 percent, respectively, before increasing in 2010 by less than 2 percent and nearly 6percent, respectively. RMA, found at http://www.rma.org/newsroom/release.cfm?ID=260, retrieved on June 12,2009.
I-19
U.S. Purchasers
Consumer tires are primarily sold to warehousing distributors, who in turn sell to consumingcontractors or end users. Questionnaires were sent to 57 firms identified as purchasers by knownimporters and producers. Approximately 31 purchasers provided useable responses to the questionnaire. Nine purchasers identified themselves as distributors, nine identified themselves as OEMs, sevenidentified themselves as replacement market resellers and distributors, four identified themselves asreplacement market resellers, one identified itself as a private brand marketer, and one identified itself aspart of a buying group.73
Apparent U.S. Consumption
As shown in table I-6 and figure I-5, the quantity of apparent U.S. consumption of subject tiresdecreased in each year during 2004-06, increased slightly in 2007, and then decreased in 2008 to a level10.3 percent below that of 2004. The value of apparent U.S. consumption increased in each year otherthan 2008. See Part V for a discussion of demand considerations during the period examined.74

I-20
Table I-6Subject tires: Apparent U.S. consumption, 2004-08
Item
Calendar year
2004 2005 2006 2007 2008
Quantity (1,000 tires)
U.S. producers’ shipments 194,731 181,756 163,814 155,675 136,825
U.S. imports from--
China 14,574 20,790 27,005 41,503 45,975
All other sources 98,179 102,424 100,601 98,913 92,902
Total U.S. imports 112,753 123,214 127,606 140,416 138,877
Apparent consumption 307,484 304,970 291,420 296,091 275,702
Value ($1,000)
U.S. producers’ shipments 9,424,164 9,490,860 9,480,330 9,964,359 9,534,664
U.S. imports1 from--
China 453,288 691,924 931,704 1,493,052 1,788,387
All other sources 3,968,366 4,625,833 4,826,687 5,045,295 5,137,015
Total U.S. imports 4,421,654 5,317,756 5,758,391 6,538,347 6,925,402
Apparent consumption 13,845,818 14,808,616 15,238,721 16,502,706 16,460,0661 Landed, duty-paid.
Source: Compiled from data submitted in response to Commission questionnaires and official Commercestatistics.

I-21
Figure I-5Subject tires: Apparent U.S. consumption, 2004-08
Source: Table I-6.

1 The Commission sent questionnaires to those firms identified in the petition, along with firms that, based on areview of data provided by U.S. Customs and Border Protection (“Customs”), may have imported at least 90 percentof total imports of subject tires from China in 2008 and between 2004-08 under HTS statistical reporting numbers4011.10.1010, 4011.10.1020, 4011.10.1030, 4011.10.1040, 4011.10.1050, 4011.10.1060, 4011.10.1070,4011.10.5000, 4011.20.1005, and 4011.20.5010. 2 HTS subheading 4011.10.10 includes tires used on racing cars, but these are believed to represent a very smallshare of tires imported under this subheading. Nine importers reported that they imported tires used on racing carsfrom nonsubject countries in 2008, which represented less than one percent of total imports by quantity. 3 U.S. import data submitted in response to Commission questionnaires followed a similar trend as data in officialCommerce statistics, with the quantity and value of U.S. imports and U.S. shipments of imports from Chinaincreasing between 2004 and 2008, and the quantity and value of U.S. imports and U.S. shipments of imports fromall other sources declining slightly and increasing, respectively. Similarly, the unit values of imports fromquestionnaire data increased over the period for which data were collected, although the actual values were ***,increasing, between 2004 and 2008, from $27.33 to $37.83 for imports from China. The unit values of U.S.shipments of imports from China from questionnaire data were $33.66 in 2004 and $42.86 in 2008. 4 Respondents argued that this was as a result of the imports from China filling the void created by the U.S.producers exiting the lower end of the subject tire market in the United States, as well as the increased investmentsmade by the Chinese producers to be able to produce the necessary products. Hearing transcript, pp. 317-318(DeIorio and Mayfield). 5 Staff telephone interview with ***, May 14, 2009. 6 E-mail from ***, May 15, 2009. 7 E-mail from ***, May 12, 2009.
II-1
PART II: THE QUESTION OF RAPIDLY INCREASING U.S. IMPORTS
U.S. IMPORTS
Importer questionnaires were sent to 44 firms believed to be U.S. importers of subject tires, aswell as to all U.S. producers of subject tires.1 Usable questionnaire responses were received from 35companies, representing the great majority of total U.S. imports from China in 2008 and during 2004-08under the relevant statistical reporting numbers of HTS subheadings 4011.10.10, 4011.10.50, 4011.20.10,and 4011.20.50.2 For complete data coverage, U.S. imports of subject tires in this report are based onofficial Commerce statistics. Table II-1 presents data for U.S. imports of subject tires from China and allother sources.
U.S. imports from China increased in each year during 2004-08, by both quantity and value.3 U.S. imports from all other sources decreased in quantity in each year other than 2005, but increased invalue in each year. Total U.S. imports increased in both quantity and value in each year, except for asmall decrease in quantity in 2008. Five of the top 15 importing firms in 2008 began importing during2004-08.4 ***, reported that it started importing in 2004. ***, another of the top five importers, statedthat while it only became the importer of record in 2006, the company was previously purchasing subjecttires from China from other importers in the United States.5
U.S. producer *** was the seventh-largest importer of subject tires from China in 2004 anddropped to number 32 in 2008. In 2007, *** discontinued a brand of Chinese-manufactured tires in orderto free up the capacity in its Chinese facilities to produce and sell more *** branded tires to the localChinese market.6 U.S. producer *** reported that it *** importing *** subject tires from China in 2008as a result of a ***7. U.S. producer *** reported that it formed a joint venture with *** of China in 2004,as well as a ***-percent acquisition of *** in 2006.
Table II-1

II-2
Subject tires: U.S. imports, by sources, 2004-08
Source
Calendar year
2004 2005 2006 2007 2008
Quantity (1,000 tires)
China 14,574 20,790 27,005 41,503 45,975
Canada 28,028 29,287 26,426 21,209 19,196
Japan 18,285 21,206 20,228 17,976 16,212
Korea 14,790 13,385 14,711 14,509 14,020
Indonesia 2,027 2,497 4,344 5,976 5,957
Brazil 4,485 4,425 3,903 5,888 5,725
Mexico 4,559 4,471 4,122 4,720 5,170
All other 26,005 27,153 26,867 28,634 26,622
Subtotal, nonsubject countries 98,179 102,424 100,601 98,913 92,902
Total 112,753 123,214 127,606 140,416 138,877
Value (1,000 dollars)1
China 453,288 691,924 931,704 1,493,052 1,788,387
Canada 1,109,264 1,270,348 1,292,469 1,201,284 1,133,467
Japan 971,404 1,198,060 1,218,246 1,055,432 1,023,383
Korea 575,994 615,659 714,601 765,013 786,615
Indonesia 47,821 65,145 113,897 173,212 191,208
Brazil 114,667 127,141 139,171 247,534 280,128
Mexico 157,713 204,383 194,379 248,834 290,897
All other 991,501 1,145,097 1,153,925 1,353,986 1,431,317
Subtotal, nonsubject countries 3,968,366 4,625,833 4,826,687 5,045,295 5,137,015
Total 4,421,654 5,317,756 5,758,391 6,538,347 6,925,402
Table continued on next page.

II-3
Table II-1--ContinuedSubject tires: U.S. imports, by sources, 2004-08
Source
Calendar year
2004 2005 2006 2007 2008
Unit value (per tire)1
China $31.10 $33.28 $34.50 $35.97 $38.90
Canada 39.58 43.38 48.91 56.64 59.05
Japan 53.12 56.50 60.23 58.71 63.13
Korea 38.95 46.00 48.58 52.73 56.11
Indonesia 23.59 26.09 26.22 28.98 32.10
Brazil 25.57 28.73 35.66 42.04 48.93
Mexico 34.60 45.71 47.16 52.72 56.26
All other 38.13 42.17 42.95 47.29 53.76
Average, nonsubject countries 40.42 45.16 47.98 51.01 55.29
Average 39.22 43.16 45.13 46.56 49.87
Share of quantity (percent)
China 12.9 16.9 21.2 29.6 33.1
Canada 24.9 23.8 20.7 15.1 13.8
Japan 16.2 17.2 15.9 12.8 11.7
Korea 13.1 10.9 11.5 10.3 10.1
Indonesia 1.8 2.0 3.4 4.3 4.3
Brazil 4.0 3.6 3.1 4.2 4.1
Mexico 4.0 3.6 3.2 3.4 3.7
All other 23.1 22.0 21.1 20.4 19.2
Subtotal, nonsubject countries 87.1 83.1 78.8 70.4 66.9
Total 100.0 100.0 100.0 100.0 100.0
Table continued on next page.

II-4
Table II-1--ContinuedSubject tires: U.S. imports, by sources, 2004-08
Source
Calendar year
2004 2005 2006 2007 2008
Share of value (percent)
China 10.3 13.0 16.2 22.8 25.8
Canada 25.1 23.9 22.4 18.4 16.4
Japan 22.0 22.5 21.2 16.1 14.8
Korea 13.0 11.6 12.4 11.7 11.4
Indonesia 1.1 1.2 2.0 2.6 2.8
Brazil 2.6 2.4 2.4 3.8 4.0
Mexico 3.6 3.8 3.4 3.8 4.2
All other 22.4 21.5 20.0 20.7 20.7
Subtotal, nonsubject countries 89.7 87.0 83.8 77.2 74.2
Total 100.0 100.0 100.0 100.0 100.01 Landed, U.S. port of entry, duty-paid.
Source: Compiled from official Commerce statistics, HTS subheadings and statistical reporting numbers4011.10.10, 4011.10.50, 4011.20.1005, and 4011.20.5010.
U.S. IMPORTS RELATIVE TO PRODUCTION
Information concerning the ratios of imports to U.S. production of subject tires is presented intable II-2 and figure II-1. The ratios of imports from China, all other sources, and all sources to U.S.production each increased in each year during 2004-08. Table II-3 presents information concerning theimports by U.S. producers and other importers. Information regarding import market shares is presentedin Part V of this report.

II-5
Table II-2Subject tires: U.S. production, U.S. imports, and ratios of imports to U.S. production, 2004-08
Item
Calendar year
2004 2005 2006 2007 2008
Quantity (1,000 tires)
U.S. production 218,363 207,780 184,843 180,334 160,310
Imports from:
China 14,574 20,790 27,005 41,503 45,975
All other sources 98,179 102,424 100,601 98,913 92,902
Total imports 112,753 123,214 127,606 140,416 138,877
Ratio of U.S. imports to production (percent)
Imports from:
China 6.7 10.0 14.6 23.0 28.7
All other sources 45.0 49.3 54.4 54.8 58.0
Total imports 51.6 59.3 69.0 77.9 86.6
Note.–Because of rounding, figures may not add to the totals shown.
Source: Compiled from data submitted in response to Commission questionnaires and from official Commercestatistics, HTS subheadings and statistical reporting numbers 4011.10.10, 4011.10.50, 4011.20.1005, and4011.20.5010.
Figure II-1Subject tires: U.S. production, and U.S. imports from China and all other sources, 2004-08
Source: Table II-2.

II-6
Table II-3Subject tires: U.S. imports, by sources, 2004-08
Item
Calendar year
2004 2005 2006 2007 2008
Quantity (1,000 tires)
Imports from China:
U.S. producers 3,041 4,525 5,785 5,996 8,009
All other 11,533 16,265 21,220 35,507 37,966
Total imports 14,574 20,790 27,005 41,503 45,975
Imports from all other sources:
U.S. producers 71,528 76,652 75,450 72,260 67,145
All other 26,651 25,772 25,151 26,653 25,757
Total imports 98,179 102,424 100,601 98,913 92,902
Unit value (per tire)1
Imports from China:
U.S. producers $26.25 $28.31 $33.36 $35.67 $39.45
All other 32.38 34.66 34.81 36.03 38.78
Total imports 31.10 33.28 34.50 35.97 38.90
Imports from all other sources:
U.S. producers 39.39 42.76 46.64 51.33 55.18
All other 43.19 52.32 51.98 50.12 55.61
Total imports 40.42 45.16 47.98 51.01 55.29
Share of quantity (percent)
Imports from China:
U.S. producers 20.9 21.8 21.4 14.4 17.4
All other 79.1 78.2 78.6 85.6 82.6
Total imports 100.0 100.0 100.0 100.0 100.0
Imports from all other sources:
U.S. producers 72.9 74.8 75.0 73.1 72.3
All other 27.1 25.2 25.0 26.9 27.7
Total imports 100.0 100.0 100.0 100.0 100.0
1Landed, U.S. port of entry, duty-paid.
Note.–Because of rounding, figures may not add to the totals shown.
Source: Compiled from data submitted in response to Commission questionnaires and from official Commercestatistics, HTS subheadings and statistical reporting numbers 4011.10.10, 4011.10.50, 4011.20.1005, and4011.20.5010.
8 *** reported that it imports from China as its U.S. manufacturing facility has limited capacity and is insufficientto fulfill total market demand. In addition, it produces a different product mix, serving a different market segment,in the United States than it imports from China. Specifically, *** reported that the U.S.-produced subject tires aredirected to the ***, while its imports of subject tires from China are directed to the ***. *** reported that it ***importing subject tires from China in *** due to ***. (E-mail from ***, May 12, 2009.) 9 The amounts of *** purchases (in 1,000 tires) are *** in 2004; *** in 2005; *** in 2006; *** in 2007; and ***in 2008.
II-7
U.S. PRODUCERS’ IMPORTS AND PURCHASES
U.S. producers’ imports and purchases of subject tires are presented in table II-4. Six U.S.producers ***8 and *** imported subject tires from China in one or more years during 2004-08, and ***purchased Chinese tires from another importer. *** indicated that ***. 9 *** did not import or purchasesubject tires from China from 2004-08.
U.S. producers’ imports and purchases of subject tires from China accounted for 20.9 percent ofthe quantity of total subject tires imported from China in 2004, 21.8 percent in 2005, 26.1 percent in2006, 26.4 percent in 2007, and 23.5 percent in 2008.
Table II-4Subject tires: U.S. producers’ imports and purchases, 2004-08
* * * * * * *

1 Staff notes that reported U.S. producers’ capacity is lower than that reported by Modern Tire Dealer, presentedin Part I, and in the petition. As noted in the footnotes to table III-1, this difference can be partially explained by themultitude of factors that must be taken into account in order to calculate capacity for the different plants.
III-1
PART III: THE QUESTION OF MATERIAL INJURY
The Information in this section of the report was compiled from responses to the Commission’squestionnaires. Ten firms, accounting for virtually all U.S. production of subject tires during the periodfor which data were collected, supplied information on such operations.
U.S. CAPACITY, PRODUCTION, AND CAPACITY UTILIZATION
U.S. producers’ capacity, production, and capacity utilization data for subject tires are presentedin table III-1 and figure III-1.1 U.S. production capacity declined by 17.8 percent from 2004 and 2008,while production fell by 26.6 percent. Capacity utilization declined from 96.3 percent in 2004 to 86.0percent in 2008. U.S. production capacity was well below the apparent U.S. consumption of subject tiresin each of the years 2004-08.
Seven U.S. producers reported constraints that set the limit on their production capacity andability to shift production capacity between products. U.S. producers generally reported that productioncapacity is limited by the combination of equipment and product mix. Examples included equipmentconstraints such as for tire building machines, for the curing process, and for tire molds which are usuallylimited to specific sizes, and cycle times which are generally longer for larger tires and/or more complextires. As described in Part I, four U.S. producers reported producing other products on the sameequipment and machinery, and three U.S. producers reported using the same production and relatedworkers employed to produce subject tires.
Six U.S. producers (***) reported a decline in production and capacity due to plant closures,supply disruptions, or strikes. Toyo *** reported an increase in production due to the addition of asubject tire manufacturing facility.

III-2
Table III-1Subject tires: U.S. capacity, production, and capacity utilization, 2004-08
Firm
Calendar year
2004 2005 2006 2007 2008
Capacity (1,000 tires)
Bridgestone1 *** *** *** *** ***
Continental *** *** *** *** ***
Cooper2 *** *** *** *** ***
Denman *** *** *** *** ***
Goodyear3 *** *** *** *** ***
Michelin4 *** *** *** *** ***
Pirelli5 *** *** *** *** ***
Specialty Tires of America6 *** *** *** *** ***
Toyo7 *** *** *** *** ***
Yokohama8 *** *** *** *** ***
Total 226,849 222,895 215,172 196,292 186,395
Production (1,000 tires)
Bridgestone *** *** *** *** ***
Continental *** *** *** *** ***
Cooper *** *** *** *** ***
Denman *** *** *** *** ***
Goodyear *** *** *** *** ***
Michelin *** *** *** *** ***
Pirelli *** *** *** *** ***
Specialty Tires of America *** *** *** *** ***
Toyo *** *** *** *** ***
Yokohama *** *** *** *** ***
Total 218,363 207,780 184,843 180,334 160,310
Table continued on next page.

III-3
Table III-1--ContinuedSubject tires: U.S. capacity, production, and capacity utilization, 2004-08
Firm
Calendar year
2004 2005 2006 2007 2008
Capacity utilization (percent)
Bridgestone *** *** *** *** ***
Continental *** *** *** *** ***
Cooper *** *** *** *** ***
Denman *** *** *** *** ***
Goodyear *** *** *** *** ***
Michelin *** *** *** *** ***
Pirelli *** *** *** *** ***
Specialty Tires of America *** *** *** *** ***
Toyo (9) (9) *** *** ***
Yokohama *** *** *** *** ***
Average 96.3 93.2 85.9 91.9 86.0
1 ***.2 ***. ***.3 ***.4 ***.5 ***.6 ***.7 ***. 8 ***.9 Not applicable.
Source: Compiled from data submitted in response to Commission questionnaires.

2 Modern Tire Dealer, “Plant capacities,” found atwww.moderntiredealer.com%2ffiles%2fstats%2fPlant-capacity-3.pdf, retrieved on May 14, 2009. 3 Ibid.
III-4
Figure III-1Subject tires: U.S. producers’ capacity, production, and capacity utilization, 2004-08
Source: Table III-1.
Bridgestone closed a subject tire plant in Oklahoma City, OK, in December 2006, which had aproduction capacity of approximately 18.4 million subject tires.2 In January 2009, Bridgestoneannounced the *** closure of the passenger and light truck manufacturing portion of the LaVergne, TNtire plant, with a capacity of approximately 3.4 million subject tires.3 Bridgestone also reported ***.

4 Continental, “Continental suspends tire production at Mayfield plant,” news release, June 29, 2004, and ModernTire Dealer, “Plant capacities,” found atwww.moderntiredealer.com%2ffiles%2fstats%2fnorth_american_plant_capability.pdf, retrieved on May 14, 2009. 5 “Continental Tire to close Kentucky plant,” Charlotte Business Journal, August 2, 2006, found athttp://charlotte.bizjournals.com/charlotte/stories/2006/07/31/daily31.html, retrieved on May 14, 2009. 6 “Continental Tire speeds up layoffs; to cut 481 jobs in July,” Charlotte Business Journal, May 8, 2006, found at http://charlotte.bizjournals.com/charlotte/stories/2006/05/08/daily8.html, retrieved on May 14, 2009, and ModernTire Dealer, “Plant capacities,” found at www.moderntiredealer.com%2ffiles%2fstats%2fPlant-capacity-3.pdf,retrieved on May 14, 2009. 7 “Continental Tire to invest $60M in Illinois plant,” Charlotte Business Journal, July 16, 2008, found athttp://www.bizjournals.com/charlotte/stories/2008/07/14/daily34.html, retrieved on May 14, 2009. 8 Cooper, “Cooper Tire announces increased investment in manufacture facilities,” news release, January 16,2004. 9 Cooper, “Cooper Tire increases capacity at Findlay, OH tire plant,” news release, February 19, 2004. 10 Cooper, “Cooper Tire production affected by hurricane damage,” news release, September 28, 2005. 11 Cooper, “Cooper Tire adjusts production in challenging industry environment,” news release, June 23, 2008. 12 Cooper, “Cooper Tire announces intent to close Albany, GA facility,” news release, December 17, 2008, andModern Tire Dealer, “Plant capacities,” found atwww.moderntiredealer.com%2ffiles%2fstats%2fPlant-capacity-3.pdf, retrieved on May 14, 2009. 13 Goodyear, “Goodyear announces planned closing of Tyler facility,” news release, October 30, 2006. 14 Goodyear, “Goodyear expects temporary impact from hurricane Rita,” news release October 3, 2005, andGoodyear’s response to U.S. producers’ questionnaire, section II-2.
III-5
In June 2004, Continental announced the indefinite suspension by the end of 2004 of tireproduction at its facility in Mayfield, KY, with a production capacity of 4 million tires.4 Continentalpermanently closed the facility at the end of 2006.5 In July 2006, Continental ceased tire production at itsCharlotte, NC facility which produced 6.5 million tires per year and had a reported production capacity of9.3 million passenger and light truck tires.6 In 2008, Continental announced a $60 million investment inits plant in Mount Vernon, IL over the next three years, more than $40 million of which will be investedin its passenger and light truck tire operations, increasing the plant’s production capacity by 2 milliontires.7
In January 2004, Cooper announced additional investments in three of its four plants, adding anadditional passenger and light truck tires production capacity of 1.4 million at its Albany, NY plant,560,000 at its Texarkana, AR facility, and 511,000 at its Tupelo, MS plant.8 In February 2004, Cooperannounced plans to add an additional passenger and light truck tires production capacity of 500,000 tiresat its Findlay, OH plant.9 In September 2005, Cooper announced that its plants in Texarkana, AR andTupelo, MS, would temporarily operate at a reduced production of about 30,000 tires per day, due to rawmaterial shortages caused by Hurricane Rita.10 Cooper reported another reduction in production for thesecond quarter of 2008.11 In December 2008, Cooper announced the closure by the end of 2009 of itsplant in Albany, GA, with an estimated production capacity of 9.6 million passenger and light trucktires.12
In 2007, Goodyear closed one of its plants in Tyler, TX, which had a production capacity ofapproximately 9 million subject tires, reportedly due to pressure from low-cost imports which competedwith the plant’s small-diameter passenger car tires.13 In addition to this plant closure, Goodyear’s subjecttire production was disrupted in 2005 as a result of hurricanes Katrina and Rita, resulting in a productionreduction of approximately 30 percent or *** subject tires.14 Production was also disrupted in 2006 as a

15 Goodyear, “Goodyear & USW reach tentative agreement on new labor contract,” December 22, 2006, andGoodyear’s response to U.S. producers’ questionnaire, section II. 16 Rubber and Plastics News, “Goodyear Dunlop to cut 150 at N.Y. facility,” November 17, 2008. 17 Michelin, “BFGoodrich Tire Manufacturing’s Opelika Plant to Reduce Production Beginning Fourth Quarter2006,” news release, July 11, 2006, and Modern Tire Dealer, “Plant capacities,” found atwww.moderntiredealer.com%2ffiles%2fstats%2fPlant-capacity-3.pdf, retrieved on May 14, 2009. 18 E-mail from ***, May 14, 2009. 19 Toyo’s response to the U.S. producers’ questionnaire, section II-2. 20 Rubber and Plastics News, “Tire makers hit hard by declining demand,” November 7, 2008, and Toyo’sresponse to the U.S. producers’ questionnaire, section II-2. 21 E-mail from ***, May 12, 2009.
III-6
result of a labor strike, resulting in a production loss of *** subject tires.15 In November 2008, GoodyearDunlop announced plans to curtail production at its Tonawanda, NY plant, due to lower demand.16
In 2006 Michelin reported a reduction in production of 30 to 40 percent at its plant in Opelika,AL, and in April 2009 Michelin announced the October 2009 closure of the plant, with its productioncapacity of 9.5 million subject tires.17 Michelin also reported that its U.S. production and shipments***.18
Toyo’s subject tire manufacturing facility in White, GA commenced production in December2005. In May 2007, Toyo announced a $50 million expansion to increase capacity to about 3.3 milliontires per year by 2009. Toyo reported that ***.19 In addition to the expansion to its production facility,Toyo also experienced the curtailment of production in late 2008, *** due to the economic downturn and*** due to raw material shortages resulting from Hurricane Ike.20
Yokohama reported that its production ***.21
U.S. PRODUCERS’ U.S. SHIPMENTS, COMPANY TRANSFERS, AND EXPORT SHIPMENTS
Data on U.S. producers’ shipments of subject tires are presented in table III-2. U.S. shipmentsbetween 2004 and 2008 declined by 29.7 percent, in terms of quantity, and increased by 1.2 percent interms of value. As described above, several U.S. producers reported changes in U.S. shipments as a resultof plant closures or openings, supply disruptions, and strikes. *** of the U.S. producers reported internalconsumption for use in the production of subject tires during 2004-08. Exports ranged from 12.3 to 14.1percent of total shipments between 2004 and 2008. Canada and Mexico were reported as the mostfrequent export destinations, with four of the six U.S. producers reporting exports to both countries and*** reporting exports to Canada.
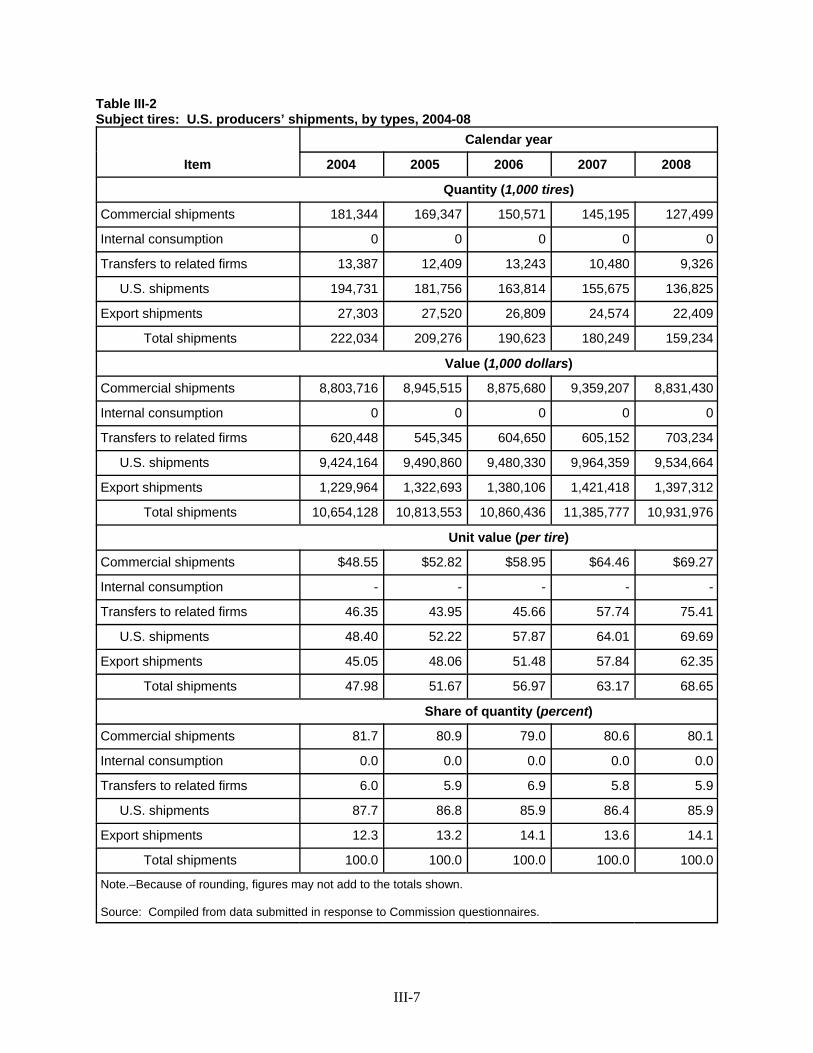
III-7
Table III-2Subject tires: U.S. producers’ shipments, by types, 2004-08
Item
Calendar year
2004 2005 2006 2007 2008
Quantity (1,000 tires)
Commercial shipments 181,344 169,347 150,571 145,195 127,499
Internal consumption 0 0 0 0 0
Transfers to related firms 13,387 12,409 13,243 10,480 9,326
U.S. shipments 194,731 181,756 163,814 155,675 136,825
Export shipments 27,303 27,520 26,809 24,574 22,409
Total shipments 222,034 209,276 190,623 180,249 159,234
Value (1,000 dollars)
Commercial shipments 8,803,716 8,945,515 8,875,680 9,359,207 8,831,430
Internal consumption 0 0 0 0 0
Transfers to related firms 620,448 545,345 604,650 605,152 703,234
U.S. shipments 9,424,164 9,490,860 9,480,330 9,964,359 9,534,664
Export shipments 1,229,964 1,322,693 1,380,106 1,421,418 1,397,312
Total shipments 10,654,128 10,813,553 10,860,436 11,385,777 10,931,976
Unit value (per tire)
Commercial shipments $48.55 $52.82 $58.95 $64.46 $69.27
Internal consumption - - - - -
Transfers to related firms 46.35 43.95 45.66 57.74 75.41
U.S. shipments 48.40 52.22 57.87 64.01 69.69
Export shipments 45.05 48.06 51.48 57.84 62.35
Total shipments 47.98 51.67 56.97 63.17 68.65
Share of quantity (percent)
Commercial shipments 81.7 80.9 79.0 80.6 80.1
Internal consumption 0.0 0.0 0.0 0.0 0.0
Transfers to related firms 6.0 5.9 6.9 5.8 5.9
U.S. shipments 87.7 86.8 85.9 86.4 85.9
Export shipments 12.3 13.2 14.1 13.6 14.1
Total shipments 100.0 100.0 100.0 100.0 100.0
Note.–Because of rounding, figures may not add to the totals shown.
Source: Compiled from data submitted in response to Commission questionnaires.

22 *** reported that its inventory data did not reconcile since ***, tracking of inventory and shipments by sourcelocation did not exist. 23 Bridgestone, “Bridgestone Firestone to close Oklahoma City tire plant,” news release, July 13, 2006. 24 Bridgestone, “Bridgestone Firestone addresses decrease in demand for passenger and light truck tires,” newsrelease, December 1, 2008. 25 Bridgestone, “Bridgestone Americas Tire Operations announcement regarding LaVergne, Tenn., tire plant,”news release, January 22, 2009.
III-8
U.S. PRODUCERS’ INVENTORIES
Table III-3, which presents end-of-period inventories for subject tires, shows that inventories interms of quantity decreased by 1.6 percent between 2004 and 2008.22 The ratio of inventories toproduction as well as to total shipments increased between 2004 and 2008 by 3.4 and 3.7 percentagepoints, respectively.
Table III-3Subject tires: U.S. producers’ end-of-period inventories, 2004-08
ItemCalendar year
2004 2005 2006 2007 2008
Inventories (1,000 tires) 22,030 22,784 19,023 20,548 21,685
Ratio to production (percent) 10.1 11.0 10.3 11.4 13.5
Ratio to U.S. shipments (percent) 11.3 12.5 11.6 13.2 15.8
Ratio to total shipments (percent) 9.9 10.9 10.0 11.4 13.6
Source: Compiled from data submitted in response to Commission questionnaires.
U.S. EMPLOYMENT, WAGES, AND PRODUCTIVITY
The U.S. producers’ aggregate employment data for subject tires are presented in table III-4. Thenumber of production and related workers (“PRWs”) decreased by 5,168 between 2004 and 2008. Anumber of U.S. producers reported a reduction in employees due to plant closures and to other reasons.
Bridgestone reported that it closed a subject tire plant in Oklahoma City, OK in December 2006. This plant employed about 1,400 workers.23 In December 2008, Bridgestone announced that it would layoff 158 employees at its LaVergne, TN tire plant.24 Then, in January 2009, Bridgestone announced the*** closure of the passenger and light truck manufacturing portion of the LaVergne, TN tire plant,resulting in the permanent reduction of an additional 385 workers.25

26 Continental, “Continental suspends tire production at Mayfield plant,” news release, June 29, 2004. 27 “Continental closing tire plant in Kentucky,” New York Times, September 30, 2004. 28 Continental, “CTNA to reduce production at Charlotte plant,” news release, January 9, 2006. 29 “Continental Tire speeds up layoffs; to cut 481 jobs in July,” Charlotte Business Journal, May 8, 2006, found at http://charlotte.bizjournals.com/charlotte/stories/2006/05/08/daily8.html, retrieved on May 14, 2009. 30 Continental, “ CTNA announces plant to secure, strengthen Mt. Vernon tire plant,” news release, January 12,2006. 31 “Continental Tire to invest $60M in Illinois plant,” Charlotte Business Journal, July 16, 2008, found athttp://www.bizjournals.com/charlotte/stories/2008/07/14/daily34.htm, retrieved on May 14, 2009. 32 Cooper, “Cooper Tire announces increased investment in manufacturing facilities,” news release, January 16,2004. 33 Cooper, “Cooper Tire increases capacity at Findlay, OH tire plant,” news release, February 19, 2004. 34 Cooper, “Cooper Tire production affected by hurricane damage,” news release, September 28, 2005.
III-9
Table III-4Subject tires: U.S. producers’ employment-related data, 2004-08
ItemCalendar year
2004 2005 2006 2007 2008
Production and related workers (PRWs) 36,410 35,594 34,037 31,842 31,242
Hours worked by PRWs (1,000 hours) 75,989 73,599 69,726 67,163 63,050
Hours worked per PRW 2,087 2,068 2,049 2,109 2,018
Wages paid to PRWs (1,000 dollars) 1,794,378 1,780,661 1,763,715 1,653,152 1,570,858
Hourly wages $23.61 $24.19 $25.29 $24.61 $24.91
Productivity (tires produced per hour) 2.9 2.8 2.6 2.7 2.5
Unit labor costs (per tire) $8.23 $8.58 $9.55 $9.18 $9.81
Source: Compiled from data submitted in response to Commission questionnaires.
In June 2004, Continental announced the indefinite suspension of tire production at its facility inMayfield, KY by the end of 2004, affecting 827 employees.26 Continental permanently closed the facilityat the end of 2006, eliminating a total of 985 employees.27 In January 2006, Continental announced theplanned layoff at its Charlotte, NC plant of 241 employees on March 15, 2006 and 272 employees onJune 30, 2006.28 In July 2006, Continental ceased tire production at its Charlotte, NC facility, resulting inthe layoff of 481 employees.29 In addition, in January 2006 Continental also announced a 10-percentreduction in wages for its Mount Vernon, IL plant employees.30 Continental announced, in July 2008, anadditional investment in its Mount Vernon, IL plant over the next 3 years, including an additional 75 jobs.31
Cooper announced in January 2004 an additional investment in three of its four plants, resultingin the addition of at least 90 employees.32 In February 2004, Cooper announced plans to invest in itsFindlay, OH plant, adding at least 30 additional jobs.33 In September 2005, Cooper announced that itsplants in Texarkana, TX and Tupelo, MS, would temporarily operate at reduced production due to rawmaterial shortages caused by Hurricane Rita.34 Cooper reported another reduction in production for the
35 Cooper, “Cooper Tire adjusts production in challenging industry environment,” news release, June 23, 2008. 36 Cooper, “Cooper Tire announces intent to close Albany, GA facility,” news release, December 17, 2008. 37 Goodyear, “Goodyear announces planned closing of Tyler facility,” news release, October 30, 2006. 38 Rubber and Plastics News, “Goodyear Dunlop to cut 150 at N.Y. facility,” November 17, 2008. 39 Michelin, “BFGoodrich Tire Manufacturing’s Opelika Plant to Reduce Production Beginning Fourth Quarter2006,” news release, July 11, 2006, and e-mail from ***, May 12, 2009. 40 Michelin, “BFGoodrich tire manufacturing’s Opelika plant to close,” news release, April 13, 2009. 41 Toyo’s response to the U.S. producers’ questionnaire, section II-2. 42 Rubber and Plastics News, “Tire makers hit hard by declining demand,” November 7, 2008. 43 *** stated that there has been a significant increase in imports of subject tires from China. *** response to theU.S. producers’ questionnaire, section II-14. 44 *** reported that imported tires comprised an increasing share of the U.S. market for subject tires. It noted thatwhile imports of tires from China have increased during 2004-08, in 2008, China still only accounted forapproximately one-third of the imports, with the other two-thirds coming from other countries. Moreover, *** statedthat although these impacts are not inconsequential or unimportant, it is not possible to isolate the impact of importsbetween China and non-China sources, nor is it possible to isolate the impact of Chinese imports or non-Chineseimports on the domestic industry. Given this, *** stated that it is not possible to quantify the specific incrementalimpact of imports from China on the overall domestic industry or specifically on ***. *** response to the U.S.producers’ questionnaire, section II-14. 45 *** reported that ***. “As evidenced by the information submitted by ***, and by the information in theUSW’s petition, the U.S. original equipment and replacement tire markets have experienced unprecedented declinesduring the last five years, which has resulted in a corresponding erosion of its domestic industrial base. This erosionhas manifested itself in many forms and no domestic tire manufacturer is immune to the industrial challenges
(continued...)
III-10
second quarter of 2008.35 In December 2008, Cooper announced the closure of one of its plants located inAlbany, GA by the end of 2009, affecting the approximately 1,400 employees at the plant.36
In 2007, Goodyear closed one of its plants in Tyler, TX, resulting in the elimination of about1,100 employees.37 In addition to this plant closure, in November 2008, Goodyear Dunlop announcedplans to curtail production at its Tonawanda, NY plant, eliminating around 150 jobs.38
In 2006 Michelin reported a reduction in production of 30 to 40 percent at its plant in Opelika,AL, resulting in the layoff of 30 to 40 percent of the plant’s employees, with an actual reduction of ***employees.39 In April 2009 Michelin announced the October 2009 closure of the Opelika plant, whichemploys approximately 1,000 employees.40
Toyo’s subject tire manufacturing facility in White, GA commenced production in December2005, with *** PRWs. In 2007, Toyo announced a $50 million expansion to increase capacity, andreported an additional *** employees. Toyo reported that ***.41 In addition to the expansion to itsproduction facility, Toyo also experienced the curtailment of production in late 2008, but that did notresult in any layoffs.42
U.S. PRODUCERS’ AND IMPORTERS’ COMMENTS REGARDING WHETHER IMPORTS OF SUBJECT TIRES FROM CHINA HAVE BEEN A CAUSE OF
MATERIAL INJURY TO THE DOMESTIC INDUSTRY
U.S. producers and importers were asked if any increase in imports of subject tires from China,either actual or relative to domestic production, has been a cause of material injury to the domesticindustry. Four U.S. producers (***) reported “No,” four U.S. producers (***) responded that they werenot in a position to answer,43 ***,44 ***.45

45 (...continued)presented by current market declines and related production overcapacity, which have fed the deterioration of thedomestic tire market against the backdrop of a marked increase in tire import levels. The localized impact of risingimport levels, and any market disruptions caused thereby, is ripe for review.” *** response to the U.S. producers’questionnaire, section II-14. 46 *** reported that the U.S. replacement market for subject tires is characterized by three tiers. The top tier("Tier 1") is occupied by flag brands like Michelin, Bridgestone, or Goodyear. The middle tier ("Tier 2") isoccupied by secondary brands that either used to be flag brands in the past in the United States (e.g., Firestone, BFGoodrich, Uniroyal, General) or foreign brands which are flag brands in their country of origin, but have not becomeflag brands in the United States yet (e.g., Continental, Pirelli, Yokohama, Toyo). The lowest tier ("Tier 3") isoccupied by brands which have lower brand equity and mainly address the needs of the mass market segment; thatis, consumers who are very price-conscious. The main difference between each tier, besides the brand equity, isprice and profit margin. The prices and profits on Tier 1 tires are greater than the prices and profits on Tier 2 tires,which in turn, are higher than the prices and profits on Tier 3 tires. All subject tires under investigation are beingsold in Tier 3 and don’t compete directly with Tier 1 and Tier 2 tires. At some point in the late 1990s and early2000s, the U.S. tire industry decided to abandon the production of Tier 3 tires in the United States and, instead, toconcentrate on the production of Tier 1 and Tier 2 tires in the United States. In many cases, these same companiesstarted importing Tier 3 tires into the United States and selling them under their own brands and labels or asexclusive brands. For example, ***. ***. These tires are manufactured in ***. ***. In short, many of the subjecttires under investigation in this proceeding are being “pulled” into the United States by the domestic industry itselfand the rest are filling a void created by the domestic industry. Finally, to the extent the domestic industry issuffering material injury, that harm is being caused primarily by the slowdown in the U.S. auto industry, not importsof subject tires. People are simply driving less due to, inter alia, the recession and the price of gasoline. An exampleof this can be seen in the closure of Michelin’s plant in Opelika, Alabama. An April 13, 2009 article reporting onthe closure, attached to the petition at exh. 13, quotes Michelin, including its Chairman, Dick Wilkerson. Michelindescribes the reason for the closure as a “drop in demand -- attributed to consumers’ driving fewer miles, purchasingfewer vehicles and delaying tire replacement purchases.” *** response to the U.S. importers’ questionnaire, sectionII-7. 47 *** reported that its preference has been to source tires from domestic production. Domestic producersreportedly made decisions to not offer tires to it. Their reasoning for not offering *** tires was that the domesticproducers did not have available capacity. This forced it to source tires from foreign producers. *** response to theU.S. importers’ questionnaire, section II-7. 48 *** reported that it is not aware of any material injury to domestic production. In its experience, the relativeroles of imports (from China and other countries) and the domestic trends in serving the U.S. market over the pastseveral years reflect a combination of factors, including increased aftermarket demand, technological advances thatresulted in longer-lasting vehicles and higher demand for replacement tires, and a proliferation of sizing,applications, and OEM sizes. As domestic production focused on capturing certain high-margin segments of those emerging markets, opportunities in commodity and other market segments opened up for foreign production frommany countries, including China. *** response to the U.S. importers’ questionnaire, section II-7.
III-11
Twenty seven importers responded “No.”46 47 48 Six importers responded that they were not in a positionto answer, while one importer (***) took no position.

49 ***. Auditor prehearing notes. 50 *** specified that the basis of their reported financial results was International Financial Reporting Standards(IFRS). 51 Segment reporting for public financial purposes indicates that most multinational producers manage theirworldwide tire operations on the basis of regional segments (Bridgestone, Cooper, Goodyear). In contrast, theprimary segments of Continental and Michelin are organized on a product-line basis. With respect to larger-volumeU.S. producers reporting public financial results, the financial results reported to the Commission fall under/withinthe following segments: the Americas (Bridgestone); Passenger and Light Truck Tires (a primary Continentalproduct line segment) and NAFTA region (a secondary Continental geographic segment); North American TireOperations (Cooper); North American Tire (Goodyear); Passenger and Light Truck Tires and related distributionactivities (a primary Michelin product line segment) and North America (a secondary Michelin geographic segment). While the segment financial results and accompanying narrative are useful for comparison purposes, it should benoted that they do not directly correspond to the information reported to the Commission. 52 The four largest U.S. producers account for the following shares of total sales on a cumulative basis: ***. 53 ***. Auditor prehearing notes. While the industry’s financial results specific to the OEM market and thereplacement market are not presented, anecdotal information indicates that OEM sales are less profitable in generalthan replacement market sales. The objective of establishing a tire in the OEM market in order to enhancesubsequent sales in the replacement market appears to be the primary justification for accepting lower relativeprofitability on OEM sales. Hearing transcript, p. 185 (Stewart), pp. 186-187 (Conway). Continental Tire’s Failurein North America, USW, April 2007, p. 1. Auditor prehearing notes. 54 ***. ***.
III-12
FINANCIAL EXPERIENCE OF U.S. PRODUCERS
Background
The financial results of the subject tires operations of the following *** U.S. producers arepresented in this section of the report: ***. With the exception of ***, all U.S. producers reflected in thissection of the report had operations throughout the period.49 U.S. producers reported their financialresults on a calendar-year basis using generally accepted accounting principles (“GAAP”).50
U.S. producers range from large multinational companies with global production/sales andvarying levels of vertical integration to smaller-volume producers with only domestic operations.51 While the reported financial results reflect *** U.S. producers, the following four U.S. producers accountfor *** percent of cumulative sales: Bridgestone, Cooper, Goodyear, and Michelin.52 These producers,with the exception of Cooper, sell into both the OEM market and the replacement market. In contrast andalong with most of the smaller-volume producers in general, Cooper sells only into the replacementmarket.53
Commercial sales, which represent the majority of the sales activity reported to the Commission,generally represent sales to OEM customers or unrelated distributors. Transfers reflect sales to relateddistributors.54
Operations on Subject Tires
Income-and-loss data for U.S. producers are presented in table III-5 and on an average-per-tirebasis in table III-6. Table III-7 presents selected company-specific data as referenced in this section ofthe report. Given changes in product mix during the period, as discussed below, a variance analysis of theoverall financial results is not presented.

III-13
Table III-5Subject tires: Results of U.S. producers’ operations, calendar years 2004-08
Item
Calendar year
2004 2005 2006 2007 2008
Quantity (1,000 tires)
Commercial sales 203,053 191,298 172,431 165,388 147,147
Transfers 18,763 17,792 18,032 14,683 11,927
Total net sales 221,816 209,090 190,463 180,071 159,074
Value ($1,000)
Commercial sales 9,759,576 9,985,192 9,977,412 10,516,957 10,029,314
Transfers 864,692 803,996 861,853 845,659 882,140
Total net sales 10,624,268 10,789,188 10,839,265 11,362,616 10,911,454
Raw material 4,314,767 4,636,646 4,909,695 4,871,304 5,308,444
Direct labor 2,203,319 2,247,191 2,272,165 2,201,788 2,047,740
Other factory costs 2,479,776 2,499,065 2,526,932 2,500,391 2,474,781
Total cost of goods sold 8,997,862 9,382,902 9,708,792 9,573,483 9,830,965
Gross profit 1,626,406 1,406,286 1,130,473 1,789,133 1,080,489
Selling expenses 495,322 472,149 446,468 433,325 390,695
General and administrative expenses 874,852 768,590 798,554 848,567 952,628
Total SG&A expenses 1,370,174 1,240,739 1,245,022 1,281,892 1,343,323
Operating income or (loss) 256,232 165,547 (114,549) 507,241 (262,834)
Interest expense 95,550 116,989 136,872 138,928 124,672
Other expenses 395,205 241,361 267,825 291,022 291,969
Other income items 209,319 227,998 158,404 79,140 51,321
Net income or (loss) (25,204) 35,195 (360,842) 156,431 (628,154)
Depr. and amortization (incl. above) 525,516 560,158 545,681 550,188 591,996
Est. cash flow from operations 500,312 595,353 184,839 706,619 (36,158)
Ratio to net sales (percent)
Raw material 40.6 43.0 45.3 42.9 48.7
Direct labor 20.7 20.8 21.0 19.4 18.8
Other factory costs 23.3 23.2 23.3 22.0 22.7
Total cost of goods sold 84.7 87.0 89.6 84.3 90.1
Gross profit 15.3 13.0 10.4 15.7 9.9
Total SG&A expenses 12.9 11.5 11.5 11.3 12.3
Operating income or (loss) 2.4 1.5 (1.1) 4.5 (2.4)
Net income or (loss) (0.2) 0.3 (3.3) 1.4 (5.8)
Number of firms reporting
Data *** *** *** *** ***
Operating losses 4 5 7 3 6
Source: Compiled from data submitted in response to Commission questionnaires.

55 Bridgestone 2004 annual report, p. 14. Bridgestone 2005 annual report, p. 41. Bridgestone 2006 annual report,p. 16. Bridgestone 2007 annual report, p. 20. Bridgestone 2008 annual report, p. 12. Continental 2005 annualreport, p. 52. Continental annual report, p. 65. Continental 2007 annual report, p. 87. Continental 2008 annualreport, p. 81. Cooper 2004 10-K, p. 13. Cooper 2005 10-K, p. 17. Cooper 2006 10-K, p. 22. Cooper 2007 10-K, p.23. Cooper 2008 10-K, p. 24. Goodyear 2004 10-K, p. 45. Goodyear 2005 10-K, p. 44. Goodyear 2006 10-K, p.47. Goodyear 2007 10-K, p. 42. Goodyear 2008 10-K, p. 42. Michelin 2004 annual report, p. 7. Michelin 2005annual report, p. 46. Michelin 2006 annual report, p. 42. Michelin 2007 annual report, p. 38. Michelin 2008 annualreport, p. 46. 56 With respect to the larger-volume producers, ***. 57 For example, at the beginning of the period Bridgestone noted that the effort to improve the profitability ofNorth American tire operations “. . . has included a reduced emphasis on market share and a sharpened focus on highvalue-added products.” Bridgestone 2004 annual report, p. 14. The company’s subsequent decision in 2006 toeliminate its Oklahoma City, OK plant is consistent with this strategy. According to Bridgestone, “{d}uring the year{2006} a decision was made to close the Oklahoma City tire plant, which produces tires in the low-end segment ofthe market where demand is shrinking and fierce competition from low-cost producing countries is increasing.”
(continued...)
III-14
Table III-6Subject tires: Results of U.S. producers’ operations (per tire), calendar years 2004-08
Item
Calendar year
2004 2005 2006 2007 2008
Unit value (per tire)
Commercial sales $48.06 $52.20 $57.86 $63.59 $68.16
Transfers 46.09 45.19 47.80 57.59 73.96
Total net sales 47.90 51.60 56.91 63.10 68.59
Raw material 19.45 22.18 25.78 27.05 33.37
Direct labor 9.93 10.75 11.93 12.23 12.87
Other factory costs 11.18 11.95 13.27 13.89 15.56
Total cost of goods sold 40.56 44.88 50.97 53.17 61.80
Gross profit 7.33 6.73 5.94 9.94 6.79
SG&A expenses 6.18 5.93 6.54 7.12 8.44
Operating income or (loss) 1.16 0.79 (0.60) 2.82 (1.65)Source: Compiled from data submitted in response to Commission questionnaires.
Sales volume
As shown in table III-5, absolute sales volume declined throughout the period, while table III-7shows that the company-specific changes in sales volume varied. Narrative information accompanyingpublic financial statements generally indicates that company-specific changes in sales volume during theperiod were due to a variety of factors such as changes in brand focus, countervailing demand withinspecific product categories, demand patterns within OEM and replacement channels, strike-relateddisruptions, and declines in overall tire demand.55 56 The elimination and/or reconfiguration of passengerand light truck tire production capacity in the United States, as described earlier in this report, is alsopresumably reflected directly or indirectly in underlying changes in sales volume.57

57 (...continued)Bridgestone 2006 annual report, p. 16. ***. Auditor prehearing notes. Similarly, Cooper indicated that one of its goals during the period was to produce more high performance andultra-high-performance premium tires. To achieve this goal, the company stated that part of its strategy would be tofree up capacity in the United States by outsourcing the production of opening-price-point and economy-type tires tomanufacturers in Asia and Mexico. Cooper 2008 10-K, p. 3. 58 Auditor prehearing notes. Bridgestone 2004 annual report, pp. 14, 16. Bridgestone 2005 annual report, p. 18. Bridgestone 2006 annual report, pp. 16, 17. Bridgestone 2007 annual report, p. 20. Cooper 2004 10-K, p. 13. Cooper 2005 10-K, p. 17. Cooper 2006 10-K, p. 22. Cooper 2007 10-K, p. 23. Cooper 2008 10-K, p. 24. Goodyear 2004 10-K, p. 45. Goodyear 2005 10-K, p. 44. Goodyear 2006 10-K, p. 47. Goodyear 2007 10-K, p. 42. Goodyear 2008 10-K, p. 42. Michelin 2004 annual report, p. 45. Michelin 2005 annual report, pp. 4, 11. Michelin2006 annual report, p. 8. Michelin 2007 annual report, p. 40. Michelin 2008 annual report, p. 63. 59 Goodyear 2006 10-K, p. 47. Goodyear 2007 10-K, p. 42. Goodyear 2008 10-K, pp. 33, 34. In 2004, Michelinnoted that “{i}n North America, Michelin and BFGoodrich’s sales in the Sports and Leisure (SUV, Recreational),4x4 and High Performance segments rose considerably in an overall market marked by weak 1.6 percent growth, atthe expense of certain private brands as Michelin took a selective approach in close consultation with the Group’sretail sales partners.” Michelin 2004 annual report, p. 25. ***. Auditor prehearing notes. 60 During the period examined and with respect to the larger-volume producers, Michelin generally reported ***sales values. In its 2006 annual report, Michelin stated that it generally commands a 10-percent to 15-percentpremium above market sales prices for its passenger and light truck tires which it attributed to “product and servicequality and performance, powerful brands and capacity for innovation.” Michelin 2006 annual report, p. 32. Among the larger-volume producers, Cooper, which only sells in the replacement market, generally reported ***sales values. While describing other factors, narrative information accompanying Cooper’s public financialstatements emphasized the importance of price in order to be successful in its channel. Cooper 2008 10-K, p. 3. 61 ***. Auditor prehearing notes. Auditor posthearing notes.
III-15
Table III-7Subject tires: Selected financial information on U.S. producers’ operations, calendar years 2004-08
* * * * * * *
Sales value
Notwithstanding consistent declines in sales volume, total sales revenue increased throughout theperiod until 2008. The higher average sales values which explain this pattern were generally attributed toprice increases to cover higher raw material costs, as well as to changes in underlying product mix and thereorientation of brand focus.58 While changes in brand emphasis presumably took different formsdepending on the producer, several companies indicated that private label tires were de-emphasized infavor of premium house brand tires.59 While table III-7 shows that the majority of U.S. producers reportedhigher average sales values during the period, company-specific differences in average sales value generallyappear to reflect factors such as product mix, channels of distribution, and the extent to which specificbrands have been positioned to command a premium.60 61

62 Bridgestone: The 2006 announced closure of Bridgestone’s Oklahoma City, OK plant was reportedly related toboth the plant’s product mix (low-end segment of the market) and intense competition from lower-cost sources –low-cost Korean and Chinese-made tires specifically cited. According to a Bridgestone company official, even withsubstantial new investment it was unlikely that the Oklahoma City, OK plant could ever be cost competitive.Petitioner’s prehearing brief, exhibit 7. Continental: The 2004 decision to close Continental’s Mayfield, KY tire plant was reportedly made after thecompany failed to secure cost reductions from the union. In general, Continental’s overall strategy has been toreduce costs by relocating production to lower-wage countries. Petitioner’s prehearing brief, exhibit 7. Testimonyduring the Commission’s hearing also described Continental’s Mayfield, KY plant as consistently having thecompany’s highest costs. Hearing transcript, p. 233 (Mayfield). In 2006, Continental announced the closure of itsCharlotte, NC plant referencing its higher costs relative to overseas plants. Petitioner’s prehearing brief, exhibit 7. Cooper: In late 2008 Cooper announced the closure of its Albany, GA plant, reportedly to match capacity andprojected demand. Some of the Albany, GA plant’s production was to be transferred to Cooper’s remainingfacilities. In conjunction with capacity rationalization and along with other projects, Cooper indicated that itexpected the cost competitiveness of its North American Tire Operations segment to improve. Cooper 2008 10-K, p.26. Goodyear: The 2006 announced closure of Goodyear’s Tyler, TX plant was reportedly made in order to reducecosts, as well as to improve the company’s competitive position. Like Bridgestone’s Oklahoma City, OK plant,Goodyear’s Tyler, TX plant produced passenger tires in the small-size range that was reportedly experiencing“considerable pressure from low-cost imports.” Petitioner’s prehearing brief, exhibit 7. Factors also justifying theplant’s closure were identified as rising costs, Goodyear’s announced decision in June 2006 to exit the wholesaleprivate label market, and reduced demand for the types of tires produced at the Tyler, TX plant. Ibid. 63 Goodyear 2004 10-K, p. 12. Although described in different levels of detail, narrative informationaccompanying the annual public financial information of Bridgestone, Cooper, and Michelin reported the same basicraw materials. Bridgestone 2004 annual report, p. 6. Cooper 2008 10-K, p. 4. Michelin 2008 annual report, p. 7. 64 With the exception of Cooper, the larger-volume producers are to varying degrees vertically integrated withrespect to at least some key inputs. Bridgestone 2005 annual report, p. 15. Michelin 2008 annual report, p. 7. Goodyear 2008 10-K, p. 7. During the period examined the extent of the vertical integration of Goodyear andMichelin was reduced somewhat; e.g., in 2005 Goodyear sold its natural rubber plantation in Indonesia and Michelinoutsourced its U.S. steel cord operations. Goodyear 2005 10-K, p. 31. Michelin 2005 annual report, p. 19. ***. While Cooper does not appear to be vertically integrated in a traditional sense, narrative informationaccompanying the company’s public financial statements describes a procurement consortium to which it belongsand that has reportedly reduced the company’s costs for certain materials and services. Cooper 2008 10-K, p. 4.
III-16
Cost of goods sold
As noted in a previous section of this report, the closures of five U.S. tire plants either took place orwere announced during the period for which data were collected. Directly or indirectly, changing/alteringcost structure was a common theme related to all of these closings.62
On a cumulative basis, raw material costs represented the largest component of total cost of goodssold (“COGS”) at 50.6 percent and are presumed by definition to be entirely variable. As described in moredetail in a previous section, while natural and synthetic rubber are the principal raw materials used for tireproduction, other raw materials also include nylon and polyester yarns, steel wire, carbon black, pigments,chemicals, and bead wire.63 Consistent with the pattern shown in table III-6, narrative informationaccompanying public financial statements indicates that raw material costs increased throughout the period. As with average sales value, the differences in company-specific average raw material costs presented intable III-7 are presumed primarily to reflect differences in product mix, as well as process-specific factorsrelated to manufacturing. It is also reasonable to conclude that average raw material costs reflectdifferences in company-specific procurement activities and the level of vertical integration for key inputs.64

65 The decline in demand at the end of the period resulted in unused capacity and fixed costs which could not beabsorbed by production or eliminated in the short run. According to Goodyear, “{o}ur 2008 results were impactedunfavorably by the recessionary economic conditions, particularly in the fourth quarter, resulting in lower sales thatprompted us to reduce our global production. For the year we reduced global production capacity by 30 millionunits, of which 17 million units were reduced in the fourth quarter. As a result, we incurred significant under-absorbed fixed overhead costs in the fourth quarter.” Goodyear 2008 10-K, p. 28. 66 Bridgestone’s annual reports generally indicate that “the Americas” segment was underperforming at thebeginning of the period. As the period progressed and until 2008, the financial results of this segment generallyimproved. Auditor posthearing notes. 67 Continental 2004 annual report, p. 49. Continental 2005 annual report, pp. 6, 10. Continental 2006 annualreport, p. 10. ***. Fax from ***, May 18, 2009. ***. The previously cited USW study asserts that financial lossesexperienced by Continental’s North American operations were in large part due to issues such as the company’sfocus on the less profitable OEM market and a poor relationship with distributors. Continental Tire’s Failure inNorth America, USW, April 2007, pp. 1-2. 68 Goodyear’s North American Tire segment reported a $233 million operating loss in 2006 compared tooperating income of $167 million in 2005. With regard to this pattern, Goodyear’s 2006 10-K states that 2006 was“. . . unfavorably impacted by increased raw material costs of approximately $373 million, increased costs ofapproximately $313 as a result of the USW strike, increased conversion costs of approximately $135 million,primarily driven by lower volume and higher energy costs, lower volume of approximately $45 million andapproximately $34 million of income related to divested businesses. Partially offsetting these were favorable priceand product mix of approximately $367 million, and lower SAG costs of approximately $55 million, which includeslower wages and benefits of approximately $20 million, approximately $17 million of lower advertising expenses,and approximately $9 million of savings from rationalization plans, partially offset by $15 million in increasedgeneral and product liability expenses. In addition, approximately $21 million of favorable settlements with certainraw material suppliers, increased operating income in chemical and other tire related businesses of approximately$22 million, and approximately $15 million of lower depreciation expense as a result of the increased estimateduseful lives of our tire mold equipment favorably impacted operating income.” Goodyear 2006 10-K, p. 47.
III-17
The second-largest component of COGS is other factory costs, which represented 26.3 percent ofthe total. In aggregate and based on estimates provided by U.S. producers for 2008, 31.7 percent of totalother factory costs are variable, while 68.3 percent are fixed. Notwithstanding differences in company-specific plant operations/plant configurations, lower fixed cost absorption, notably at the end of the period,affected the level of average other factory costs reported by U.S. producers. As shown in table III-6,average other factory costs, like average raw material costs, reached their highest level in 2008.65
Direct labor was the smallest component of COGS, representing 23.1 percent on a cumulative basis. Variable costs represented the majority of total 2008 direct labor costs at 68.0 percent, while fixed costsrepresented 32.0 percent. In addition to regional differences and union and non-union variations incompany-specific wage rates, average company-specific direct labor costs, as shown in table III-7, alsolikely reflect differences in both product mix and levels of automation and corresponding labor intensity.
Financial Results
Notwithstanding the positive impact of higher revenue due to favorable changes in product mix andprice increases to pass through higher raw material costs, profitability declined throughout much of theperiod, with 2007 being the notable exception. As shown in table III-7, the pattern of change in company-specific gross profit was not uniform. Among the four largest producers, ***. As noted below, however,*** selling, general and administrative (“SG&A”) expense ratios which in turn resulted in ***.66 Althoughcorresponding public segment financial results were not reported, *** appear to be generally consistent withnarrative information accompanying the company’s public financial statements.67 ***. As shown in tableIII-7, *** reported its ***.68
Based on estimates provided by U.S. producers for 2008, the majority of SG&A expenses are fixedat 84.8 percent, while 15.2 percent are variable. Despite notable variations in company-specific SG&A

69 ***. Auditor posthearing notes. ***. 70 Absolute gross profit and corresponding gross profit margin increased in 2007 due to a larger relative increasein average sales value compared to the corresponding increase in average COGS. Michelin, which as shown in tableIII-7 reported *** in 2007, noted that 2007 was “. . . marked by generally favorable market conditions and adeceleration of raw material prices . . .”. Michelin 2007 annual report, p. 10. In addition to the positive impact of alower relative increase in raw material costs in 2007 compared to 2006, the relative improvement in 2007 financialresults compared to 2006, as shown in table III-7, can also be attributed in part to the reduced impact in 2007 of ***. 71 ***. Based on the information reported by companies regarding non-recurring charges included in COGS andSG&A, staff estimates that the U.S. industry’s pro forma operating income (loss) margins would be as follows if allnon-recurring charges were eliminated from COGS and SG&A expense:
2004 2005 2006 2007 2008
Ratio to net sales (percent)
Pro forma operating income (loss) margin . . . . . . . *** *** *** *** ***
Operating income (loss) margin as reported . . . . . . 2.4 1.5 (1.1) 4.5 (2.4)Auditor posthearing notes. 72 E-mail from Covington & Burling on behalf of Goodyear, May 21, 2009. ***. Based on this information, staffestimates that the U.S. industry’s pro forma net income (loss) margins would be as follows had ***:
2004 2005 2006 2007 2008
Ratio to net sales (percent)
Pro forma net income (loss) margin . . . . . . . . . . . . . . *** *** *** *** ***
Net income (loss) margin as reported in table III-5. . . (0.2) 0.3 (3.3) 1.4 (5.8)Auditor posthearing notes. 73 ***. E-mail with attachment from ***, May 14, 2009.
III-18
expense ratios during the period, overall SG&A expense ratios moved within a relatively narrow range.69 The combination of contracting gross profit margins and relatively static SG&A expense ratios throughoutmost of the period resulted in declining operating income in 2005 and operating losses in 2006 and 2008, asshown in table III-5. 2007, as noted above, was a notable exception to the general pattern of decliningprofitability during the period.70
Operating results reflect the impact of various non-recurring charges included in the COGS andSG&A expenses reported by ***.71 In contrast, the non-recurring charges reported by ***. ***.72 73
Research and Development Expenses, Capital Expenditures, Assets, and Return on Investment
The responding producers’ data on research and development (R&D) expenses, capitalexpenditures, total assets, and return on investment are shown in table III-8.
The majority of U.S. producers, as shown in table III-8, reported R&D expenses, and all reportedcapital expenditures. As with their share of total sales, the four largest U.S. producers in terms of sales
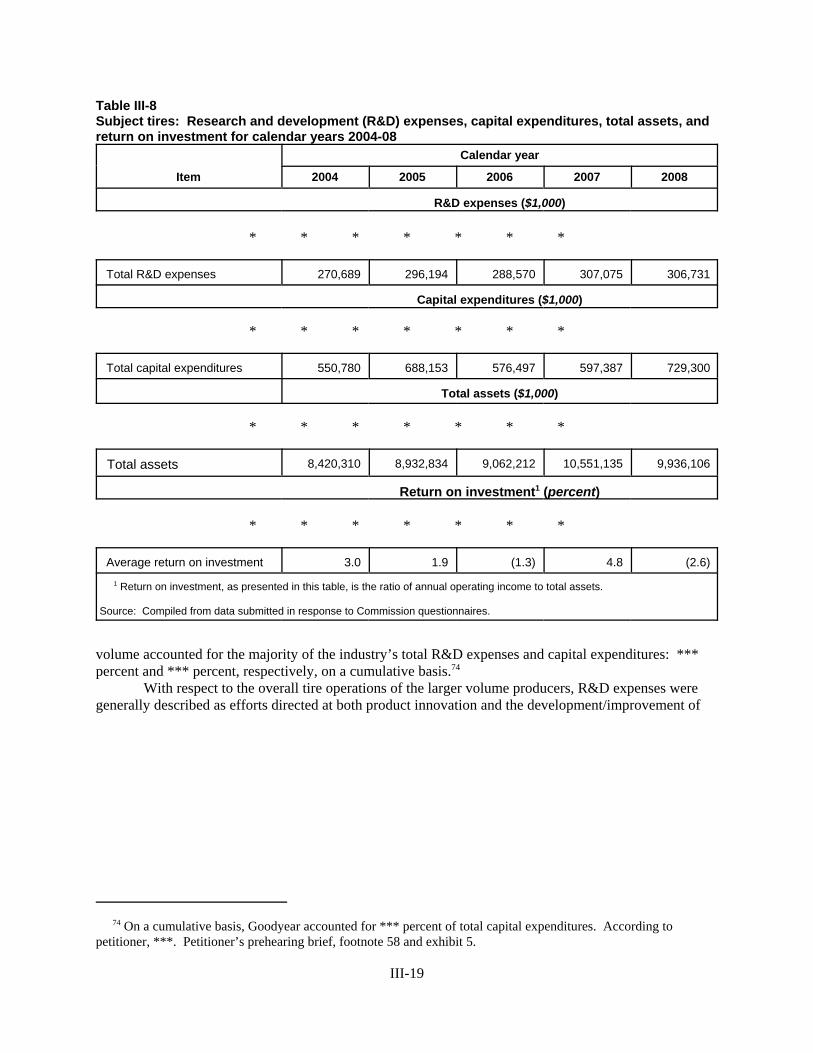
74 On a cumulative basis, Goodyear accounted for *** percent of total capital expenditures. According topetitioner, ***. Petitioner’s prehearing brief, footnote 58 and exhibit 5.
III-19
Table III-8Subject tires: Research and development (R&D) expenses, capital expenditures, total assets, andreturn on investment for calendar years 2004-08
Item
Calendar year
2004 2005 2006 2007 2008
R&D expenses ($1,000)
* * * * * * *
Total R&D expenses 270,689 296,194 288,570 307,075 306,731
Capital expenditures ($1,000)
* * * * * * *
Total capital expenditures 550,780 688,153 576,497 597,387 729,300
Total assets ($1,000)
* * * * * * *
Total assets 8,420,310 8,932,834 9,062,212 10,551,135 9,936,106
Return on investment1 (percent)
* * * * * * *
Average return on investment 3.0 1.9 (1.3) 4.8 (2.6) 1 Return on investment, as presented in this table, is the ratio of annual operating income to total assets.
Source: Compiled from data submitted in response to Commission questionnaires.
volume accounted for the majority of the industry’s total R&D expenses and capital expenditures: ***percent and *** percent, respectively, on a cumulative basis.74
With respect to the overall tire operations of the larger volume producers, R&D expenses weregenerally described as efforts directed at both product innovation and the development/improvement of

75 Bridgestone 2008 annual report, p. 36. Cooper 2008 10-K, p. 5. Goodyear 2008 10-K, p. 8. Michelin 2008annual report, p. 5. 76 ***. Petitioner’s prehearing brief, footnote 58. 77 ***. Auditor prehearing notes.
III-20
manufacturing processes/efficiencies.75 With the exception of ***, U.S. producers with R&D expensesreported higher levels at the end of the period compared to the beginning.
As shown in table III-8, capital expenditures increased during the period and were consistentlyhigher compared to corresponding total depreciation expense, ranging from 104.8 percent to 123.2percent of annual depreciation.76 Unlike the pattern noted above with respect to R&D expenses, one ofthe smaller-volume U.S. producers, Toyo, accounted for a relatively large share of cumulative capitalexpenditures as the result of its establishment and subsequent expansion of a greenfield manufacturingfacility.77
Actual or Anticipated Negative Effects on U.S. Producers of Imports of Subject Tires from China
The Commission requested U.S. producers to describe any actual or anticipated negative effectsdue to imports of subject tires from China on their growth, investment, and ability to raise capital ordevelopment and production efforts (including efforts to develop a derivative or more advanced versionof the product), or the scale of capital investments. The following responses were received (the companynames are not in alphabetical order so that their answers, which are being made public, cannot be matchedto any specific company).
Actual Negative Effects
*** Responded that the company has experienced the following negative effects:reduction in the size of capital investments and lowering of credit rating.
*** Responded that the company has not experienced negative effects.*** Did not respond to this question, stating that it takes no position.*** Responded that the company has not experienced negative effects.*** Responded that the company has not experienced negative effects.*** Responded that the company has experienced the following negative effect:
“{r}eduction in U.S. production of certain tire models.”*** Responded that the company has not experienced negative effects.*** Responded that the company has not experienced negative effects.*** Responded that the company has experienced the following negative effects:
cancellation, postponement, or rejection of expansion projects; denial or rejectionof investment proposal; and reduction in the size of capital investments. Thecompany also stated that “***, on its own, like other domestic manufacturers hasexperienced some of the negative effects outlined above, but it is difficult todetermine whether these effects are directly related to the imports of subject tiresfrom China. As evidenced by the information submitted by *** herein, and bythe information in the USW’s petition, the U.S. original equipment andreplacement tire markets have experienced unprecedented declines during the lastfive years, which has resulted in a corresponding erosion of ***’s domesticindustrial base. No domestic tire manufacturer is immune to the industrialchallenges by current market declines and related production overcapacity, whichhave fed the deterioration of the domestic tire market against the backdrop of a

III-21
marked increase in tire import levels. The localized impact of rising importlevels, and any market disruptions caused thereby, is ripe for review.”
*** Responded that the company has not experienced negative effects.
Anticipated Negative Effects
*** Responded that the company does not anticipate negative effects.*** Responded that the company does not anticipate negative effects. *** The company did not respond to this question, stating that “*** cannot make a
determination about future negative effects resulting from the imports of subjecttires from China.”
*** The company did not respond to this question, stating that it takes no position.*** Responded that the company does not anticipate negative effects. *** The company did not respond to this question, stating that “{n}ot enough market
intelligence on this particular product line to comment.”*** Responded that the company anticipates the following negative effects: “{a}s
sales of certain tire models are undercut in price by cheaper competitors fromChina, we may need to further reduce production of those tires.”
*** Responded that the company does not anticipate negative effects. *** Responded that the company anticipates the following negative effects: “{t}he
tire industry is a highly competitive, global industry. Some of the Company’scompetitors are large overseas companies with greater financial resources. Thecompany also competes against low-cost producers in Asia and South America. Increased competitive activity in the replacement tire industry has caused, andwill continue to cause, pricing pressures on the Company’s business.”
*** Responded that the company does not anticipate negative effects.

1 Data compiled from statistics published in Rubber News, http://www.rubbernews.com, retrieved on May 13,2009. 2 Ibid. The opening dates of the remaining plants were unknown. 3 Ibid. 4 Information retrieved from GITI (China)’s corporate website, http://www.gititire.com/english/milestones.asp,retrieved on May 11, 2009. 5 Shangdon Linglong owns Zhaoyuan Leo Rubber. *** and found at http://www.szkl.net/ebusiness/companye/210/00528.htm, retrieved on June 12, 2009. 6 Rubber News, op. cit. 7 Retrieved on May 13, 2009 from http://www.rubbernews.com/subscriber/rankings/lgstchinesetire08.html.
IV-1
PART IV: THE QUESTION OF THREAT OF MATERIAL INJURY
THE CHINESE INDUSTRY AND MARKET
Foreign producers’ questionnaires were sent to 75 firms identified in proprietary Customs dataand by a review of publicly available sources that represent at least 85 percent of total exports to theUnited States of subject tires from China in 2008 and between 2004 and 2008. Thirty-six firmsresponded to the questionnaire; information regarding their production and exports to the United Statesduring 2008 is presented in table IV-1.
Producers in China
There are 97 companies identified as operating tire production facilities in China as of September2008. Of these firms, there are 70 companies operating plants producing subject tires.1 Of these facilitiesproducing subject tires, 19 began operating before 1990, 27 began operating between 1990 and 1999,7 began operating between 2000 and 2003, and 8 plants have begun operating since 2004.2 Sixteen tiremanufacturing firms based in China rank within the top 75 tire-producing firms in the world. GITI(China), headquartered in Shanghai, China, is reportedly the largest tire manufacturer in China,accounting for approximately 15 percent of total tire production in 2007. GITI (China) reportedly hasseven plants with a total capacity of 44 million tires per year. GITI (China)’s sales were valued at $1.8billion in 2007, an increase of more than 25 percent over its sales in 2006.3 In 2007, GITI (China) soldroughly 17 million tires in China and exported another 17 million tires to over 100 countries, includingthe United States. In 2005 GITI (China) had established sales and marketing subsidiaries in the UnitedStates (Rancho Cucamonga, CA) and in Europe (the Netherlands) with the reported intent to expandexport sales. In 2007, GITI (China) established a manufacturing facility in Anhui, China to furtherexpand its production capacity.4
GITI (China), along with Triangle Tyre (tire production capacity of 28 million tires per year),Hangzhou Zhongce (capacity of 26 million tires per year), Shangdon Linglong5 (capacity of 17 milliontires per year), and Double Coin (capacity of 9 million tires per year), all of which reported tire sales ofover $1 billion in 2007, together account for over 50 percent of China’s tire sales in 2007. All five ofthese tire companies are ranked in the top 20 producing companies worldwide.6 The following tabulationlists the plants of the nine largest Chinese tire producers that produce subject tires and when those plantsbecame operational.7

8 Annual calculations are assuming 365 production days per year.
IV-2
FirmNumber of subject
tire plantsYears plants
opened
GITI Tire Investment Co., Ltd. 41988, 1993, 2000, 2007
Triangle Group Co., Ltd. 2 1993
Hangzhou Zhongce Rubber Co., Ltd. 1 1958
Shandong Linglong Rubber Co., Ltd. 1 2001
Double Coin Holdings Co., Ltd. 51927, 1928, 1961,
1991, 2005
Aeolus Tyre Co., Ltd. 1 1999
Qingdao Doublestar Industrial Co., Ltd. 1 1995
Qingdao Yellow Sea Rubber Co., Ltd. 1 1986
Guangzhou Pearl River Rubber Tyre Ltd. 1 1970
Table IV-1Subject tires: Reporting Chinese manufacturers/exporters, their production in China, and exportsto the United States, by firms, 2008
* * * * * * *
Ten foreign producers reported plans to add, expand, curtail, or shut down production capacityand/or production of subject tires in China. *** reported that it will add capacity of *** tires per day(approximately *** tires per year)8 at its *** plant to meet the increasing demand of the Chinese domesticmarket. *** plans to *** for new products in the United States, European, Australian, South African, andMiddle Eastern markets. The new equipment will reportedly increase capacity to *** in 2009. *** plansto expand the production capacity by investing in production equipment as well as “de-bottlenecking” toenhance production efficiency. The increased capacity is estimated to be *** percent, and will supplyboth domestic and export markets. *** plans to increase capacity from *** tires per day (*** tires peryear) to *** tires per day (*** tires per year) in 2011, and up to *** tires per day (*** tires per year) in2012 in order to meet rising demand in China and to be more competitive in the Asian Pacific market ingeneral. *** reported that it plans to shut down its ***, with a total capacity of *** tires, at the end of2009. *** plans to increase its current annual production capacity from *** tires to *** tires in 2009, and*** tires in 2010. *** plans to add *** tires to its production capacity, citing the need to meet marketrequirements in China (*** percent), Europe (*** percent), United States (*** percent), and othercountries (*** percent). *** plans to expand its production capacity in China by 2010. *** will addcapacity in the future, and will export to the United States, Australia, and Europe. *** plans to expand itsproduction by *** tires each year, totaling *** tires in 2010.
Although there is still growth seen in demand for tires in China, there are reported problemsfacing producers in China. For example, according to Ju Hongzhen, chairman of the China RubberIndustrial Association, the rapid increase in tire output has led to the potential for shortages of necessaryraw materials. Other problems include the rapid blind investment leading to excess capacity, increasing
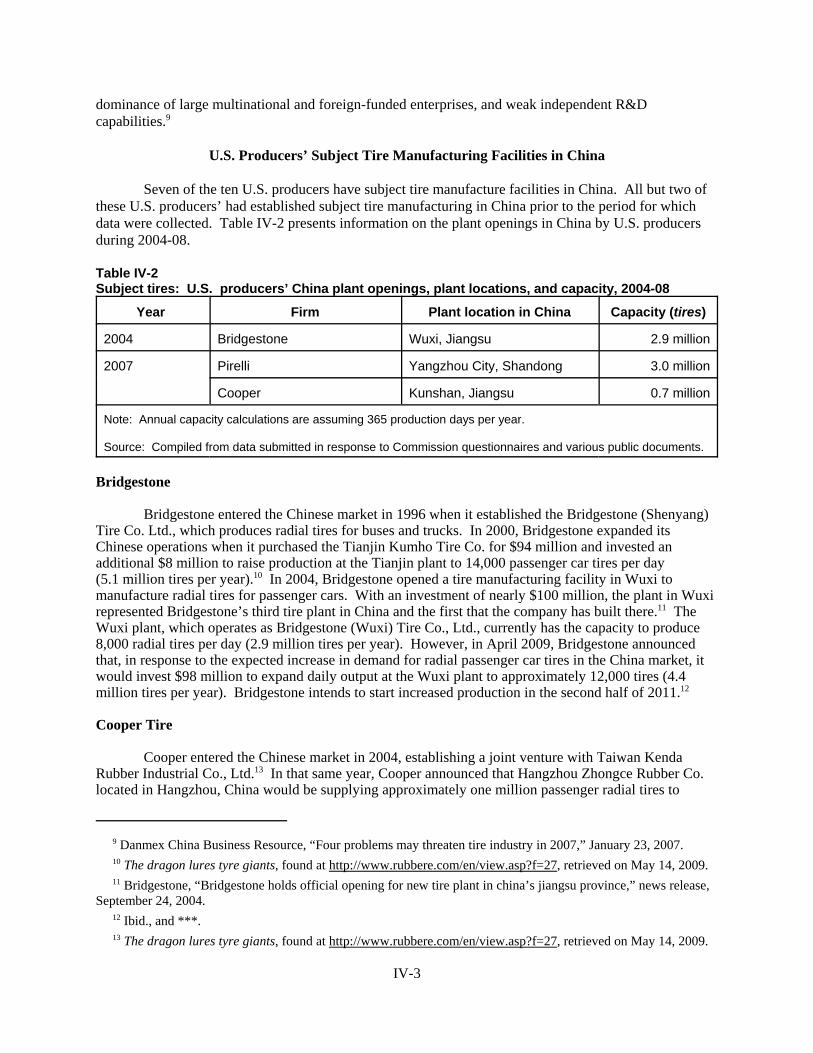
9 Danmex China Business Resource, “Four problems may threaten tire industry in 2007,” January 23, 2007. 10 The dragon lures tyre giants, found at http://www.rubbere.com/en/view.asp?f=27, retrieved on May 14, 2009. 11 Bridgestone, “Bridgestone holds official opening for new tire plant in china’s jiangsu province,” news release,September 24, 2004. 12 Ibid., and ***. 13 The dragon lures tyre giants, found at http://www.rubbere.com/en/view.asp?f=27, retrieved on May 14, 2009.
IV-3
dominance of large multinational and foreign-funded enterprises, and weak independent R&Dcapabilities.9
U.S. Producers’ Subject Tire Manufacturing Facilities in China
Seven of the ten U.S. producers have subject tire manufacture facilities in China. All but two ofthese U.S. producers’ had established subject tire manufacturing in China prior to the period for whichdata were collected. Table IV-2 presents information on the plant openings in China by U.S. producersduring 2004-08.
Table IV-2Subject tires: U.S. producers’ China plant openings, plant locations, and capacity, 2004-08
Year Firm Plant location in China Capacity (tires)
2004 Bridgestone Wuxi, Jiangsu 2.9 million
2007 Pirelli Yangzhou City, Shandong 3.0 million
Cooper Kunshan, Jiangsu 0.7 million
Note: Annual capacity calculations are assuming 365 production days per year.
Source: Compiled from data submitted in response to Commission questionnaires and various public documents.
Bridgestone
Bridgestone entered the Chinese market in 1996 when it established the Bridgestone (Shenyang)Tire Co. Ltd., which produces radial tires for buses and trucks. In 2000, Bridgestone expanded itsChinese operations when it purchased the Tianjin Kumho Tire Co. for $94 million and invested anadditional $8 million to raise production at the Tianjin plant to 14,000 passenger car tires per day(5.1 million tires per year).10 In 2004, Bridgestone opened a tire manufacturing facility in Wuxi tomanufacture radial tires for passenger cars. With an investment of nearly $100 million, the plant in Wuxirepresented Bridgestone’s third tire plant in China and the first that the company has built there.11 TheWuxi plant, which operates as Bridgestone (Wuxi) Tire Co., Ltd., currently has the capacity to produce8,000 radial tires per day (2.9 million tires per year). However, in April 2009, Bridgestone announcedthat, in response to the expected increase in demand for radial passenger car tires in the China market, itwould invest $98 million to expand daily output at the Wuxi plant to approximately 12,000 tires (4.4million tires per year). Bridgestone intends to start increased production in the second half of 2011.12
Cooper Tire
Cooper entered the Chinese market in 2004, establishing a joint venture with Taiwan KendaRubber Industrial Co., Ltd.13 In that same year, Cooper announced that Hangzhou Zhongce Rubber Co.located in Hangzhou, China would be supplying approximately one million passenger radial tires to
14 Cooper, “Cooper Tire announces outsourcing agreement with Hangzhou,” news release, February 24, 2004. 15 Kenda USA, “History of Kenda,” found at http://www.kendausa.com/aboutkenda/history.html, retrieved onJune 4, 2009. 16 Cooper reported that the eventual first phase capacity of the plant will be 6.5 million tires. Cooper April 5,2007 8-K, p. 29. 17 Cooper, “Cooper Tire races into China,” news release, March 31, 2006. 18 Cooper, “Won’t tire of growth strategy, market avenue,” found athttp://www.marketavenue.cn/upload/news/NEWS_38872.htm, retrieved on May 14, 2009. Cooper Chengshan Tirein its response to the foreign producers’ questionnaire reported that ***. 19 Goodyear, History by Year, found at http://www.goodyear.com/corporate/history/history_byyear.html,retrieved on May 14, 2009. 20 Rubber and Plastics News, found at http://rubberandplastics.texterity.com/rubberandplastics/20090126/?pg=12,retrieved on May 14, 2009. 21 Goodyear, “Goodyear announces growth strategies, investment plans,” news release, June 26, 2008, andGoodyear Dalian response to the foreign producers’ questionnaire, section II-1. 22 Goodyear Dalian reported that ***. Goodyear Dalian response to the foreign producers’ questionnaire, sectionII-1.
IV-4
Cooper for sale in the U.S. market.14 In 2005, construction was started on a new plant in Kushan, Jiangsuprovince to produce radial passenger and light truck tires under Cooper Kenda (Kushan) Co., Ltd., withthe first tire produced in February 2008.15 Cooper noted that all the tires by this joint venture produced inthe first five years will be available to Cooper, and “will most likely be exported to North America andEurope to improve our margins on entry-level tires.”16 In 2006, Cooper finalized a deal in which itinvested $70 million to obtain a 51-percent ownership of China’s third-largest domestic producer,Shandong Chengshan Tire Co., to produce Cooper-branded tires for the Chinese market.17 According toreports, Cooper has over 200 distributors and 2,000 retailers in China for its truck tire business, and 50distributors and 1,000 retailers for its passenger car tire business. In addition, Cooper aims to spendaround $200 million in China in the next three to five years in manufacturing, product development, andsales channels expansion.18
Goodyear
U.S. producer Goodyear currently has a manufacturing facility in Dalian, China whichcommenced production in 1995, and was later expanded in 2001.19 The facility produces both consumerand light truck tires, and has a reported annual production capacity of 17,000 tires per day (6.2 milliontires per year).20 In 2008, Goodyear announced a further investment of up to $500 million for relocationand expansion to facilitate increased production, from its current production of *** tires per day, to ***21. The new facility is scheduled to be completed in ***. Goodyear Dalian reported that ***.22
Michelin
Michelin established its manufacturing presence in China when it partnered with Shenyang TireFactory in 1995. By 2001, the four tire production plants operating within the joint venture andproducing mainly radial tires for sedans and trucks were merged into one company, Shenyang MichelinTire Co., Ltd. In that same year, Michelin moved its headquarters from Beijing to Shanghai andpartnered with the Shanghai Tire and Rubber Co., Ltd. The $200 million joint venture, known asShanghai Michelin Warrior Tire Co., Ltd., focused on the manufacture and sale of radial passenger cartires. In the transaction, Michelin acquired 70 percent control of the shares, the first time foreign control

23 Michelin expands market with new environmental protection technology, Entrepreneur, found athttp://www.entrepreneur.com/tradejournals/article/95908106.html, retrieved on May 14, 2009. 24 Michelin to build world's largest tire base in China, found athttp://www.expansionmanagement.com/cmd/articledetail/articleid/19178/default.asp, retrieved on May 12, 2009,and Michelin plans to expand capacity at two China plants, found athttp://www.aftermarketnews.com/Item/34503/michelin_plans_to_expand_capacity_at_two_china_plants.aspx,retrieved on May 14, 2009. 25 Pirelli’s new China plant to start production, Tire Business, found at http://www.tirebusiness.com/subscriber/international2.phtml?cat=7&id=1196197975, retrieved on May 14, 2009. 26 Pirelli begins production at new China plant, found at http://www.manufacturing.net/Pirelli-Starts-Chinese-Production.aspx?menuid=766, retrieved on May 14, 2009. 27 Tire demand slows in China, but optimism reigns, Rubber and Plastics News, found at http://rubberandplastics.texterity.com/rubberandplastics/20090126/?pg=12, retrieved on May 14, 2009. 28 Japan’s Yokohama Rubber to produce tires in China, People’s Daily, November 2, 2001, found athttp://english.peopledaily.com.cn/english/200111/02/eng20011102_83766.html, retrieved on May 14, 2009. 29 Yokohama, “Suzhou Yokohama Tire holds groundbreaking ceremony for its plant in China,” news release,August 24, 2006.
IV-5
went beyond the Chinese official policy limit on foreign ownership.23 In 2004, Michelin announced a$300 million expansion of its tire facility in Shenyang, to boost output at that plant from two to threemillion units a year. There have also been reports that Michelin aims to expand its capacity of ShanghaiMichelin Warrior Tire Co. to 14 million units.24
Pirelli
In 2005, Pirelli established a joint venture with Shandong Roadone Tyre, to create Pirelli TyreLtd. (China), with Pirelli possessing a 60-percent stake. According to reports, the factory in YangzhouCity is capable of producing 1.2 million radial truck tires a year for the local market.25 In 2007, Pirellibegan producing passenger car tires destined for the domestic Chinese market and the main markets in theAsia-Pacific area. According to reports, Pirelli invested nearly $100 million in the factory, which islocated in the same Shandong Province industrial park where it produces truck tires. The new plantfocused on producing high-performance car tires and is said to have a manufacturing capacity of 3 milliontires per year.26 In 2008, Pirelli announced its plans to double capacity in China. By 2011, Pirelli willreportedly have the ability to make 11 million tires annually.27
Yokohama
Yokohama established its manufacturing presence in China when it established a joint venturewith the Chinese tire maker, Hangzhou Rubber (Group) Co., creating the Hangzhou Yokohama Tire Co.,Ltd. in 2001. The plant, which is located in Hangzhou City in Zhejiang Province, began producing radialtires for passenger cars in May 2003.28 In 2006, Yokohama announced the establishment of its secondplant in China. Suzhou Yokohama Tire Co., Ltd., an affiliate located in Suzhou City, began operations in2007 producing steel radial tires for trucks and buses. Prior to the establishment of the plant, Yokohamaexported its trucks and buses-use steel radial tires from Japan for use in the China market.29
Toyo
In 1993, Taiwan’s Cheng Shin Rubber set up a subsidiary in China’s Jiangsu province, which itcalled Cheng Shin Tire Co., Ltd.. Three years later, Toyo Tires, the Japanese tire maker, acquired a 30-percent stake in the subsidiary. Production began at the plant located in the Kun Shan Economic and

30 Joint venture established for production of passenger car radials in China, found at http://www.toyocanada.com/abouttoyo/china_plant_EN.asp, retrieved on May 14, 2009. 31 Toyo company information, found at http://www.toyo-rubber.co.jp/english/company/enkaku.html, retrieved onMay 15, 2009.
IV-6
Technical Development Zone in 1997.30 In 2003, Toyo established a joint venture in Shanghai calledToyo Tire (Shanghai) Co., Ltd.31
Operations in China
Aggregate data with respect to subject tires operations of the 35 responding firms in China arepresented in table IV-3. Capacity to produce and production of the subject product in China increased byapproximately 152.5 percent and 133.6 percent, respectively, during 2004-08. During the period forwhich data were collected, internal consumption, home market shipments, exports to the United States,and exports to other third-country markets also increased. The largest increase in absolute terms between2004 and 2008 was exports to all other markets (40.6 million tires); exports to the U.S. market andshipments to the home market also increased by 33.8 million and 37.4 million tires, respectively.
Five Chinese producers reported producing other products on the same equipment and machineryused to produce subject tires; *** reported producing ***, *** reported producing ***, *** reportedproducing ***, *** reported producing ***, and *** reported producing other nonsubject tires ***.

IV-7
Table IV-3Subject tires: Reported Chinese production capacity, production, shipments, and inventories,2004-08, and projections for 2009 and 2010
Item
Calendar years Projections
2004 2005 2006 2007 2008 2009 2010
Quantity (1,000 units)
Capacity 93,153 118,062 147,990 201,825 235,172 258,445 272,622
Production 83,734 106,911 133,963 182,018 195,643 217,826 236,552
End-of-period inventories 9,081 11,528 12,281 14,660 17,191 17,743 17,813
Shipments:
Internal consumption 785 1,191 2,580 5,151 3,261 2,687 2,739
Home market 39,677 45,983 55,750 71,646 77,114 93,582 104,736
Exports to--
The United States1 14,117 19,417 29,105 46,371 47,916 52,356 55,888
All other markets 29,768 42,013 51,099 63,564 70,396 75,319 81,887
Total exports 43,885 61,430 80,203 109,935 118,312 127,675 137,775
Total shipments 84,348 108,605 138,533 186,731 198,687 223,944 245,250
Ratios and shares (percent)
Capacity utilization 87.5 88.1 87.7 87.7 83.2 84.3 86.8
Inventories to production 10.8 10.8 9.2 8.1 8.8 8.1 7.5
Inventories to total shipments 10.8 10.6 8.9 7.9 8.7 7.9 7.3
Share of total quantity of shipments:
Internal consumption 0.9 1.1 1.9 2.8 1.6 1.2 1.1
Home market 47.0 42.3 40.2 38.4 38.8 41.8 42.7
Exports to--
The United States 16.7 17.9 21.0 24.8 24.1 23.4 22.8
All other markets 35.3 38.7 36.9 34.0 35.4 33.6 33.4
Total exports 52.0 56.6 57.9 58.9 59.5 57.0 56.21 Staff notes that reported Chinese exports to the United States are larger than U.S. imports as reported in official Commerce
statistics, presented in Part II.Note.–*** provided projections for capacity and exports to the United States in 2010, *** only provided projections for capacity, ***did not provide projections for any data in 2010, and *** did not provide projections for ending inventories in 2009 and 2010. Inthis table, the data not provided were assumed to remain the same as those of the last year provided.
Source: Compiled from data submitted in response to Commission questionnaires.

32 HTS subheading 4011.10 is a broader tariff classification that includes other products that are not subject to thisinvestigation. Specifically, new pneumatic tires, of rubber, used on racing cars, covered under HTS subheading4011.10, as well as tires used on buses and trucks that are not light trucks, reported under HTS subheading 4011.20,are not subject to this investigation. 33 “MOF releases details about VAT rebate,” China Internet Information Center, found athttp://www.china.org.cn/video/2008-11/18/content_16784101.htm, retrieved on May 14, 2009.
IV-8
China’s Export Markets
Information regarding China’s export markets for motor car, truck, and bus tires under HTSsix-digit subheadings 4011.10 and 4011.20 are presented in table IV-4 and figure IV-1.32 The data arebased on import records of China’s trading partners.
The United States was the principal destination for China’s exports of motor car, truck, and bustires during the period of investigation. The share of China’s exports of such tires where the UnitedStates was the ultimate destination was 33.5 percent in 2004 and 37.4 percent in 2008. Other large exportmarkets during 2008 were the United Kingdom (6.0 percent of total exports), the United Arab Emirates(3.9 percent), South Korea (3.1 percent), and Australia (2.9 percent). Average unit values of exports tothe United States were generally higher than those of exports to Europe (specifically Belgium, Germanyand the United Kingdom) and South Korea.
China increased the value added tax (“VAT”) rebate on tire exports from five percent to ninepercent, effective December 1, 2008.33

IV-9
Table IV-4Motor car, truck, and bus tires:1 China’s exports to major trading partners, 2004-08
DestinationCalendar year
2004 2005 2006 2007 2008
Quantity (1,000 tires)
United States2 23,061 32,163 41,461 54,956 56,067
United Kingdom 3,930 4,352 6,095 8,728 8,951
United Arab Emirates 3,319 3,633 3,918 5,119 5,906
South Korea 771 1,996 3,264 3,974 4,693
Australia 1,530 2,143 2,811 3,907 4,395
Belgium 2,105 2,564 3,391 4,927 4,076
Germany 1,862 2,804 3,824 4,301 3,825
Brazil 337 1,012 1,891 2,582 3,625
All other 31,832 41,123 44,453 55,702 58,267
Total 68,748 91,792 111,108 144,195 149,805
Value ($1,000)
United States2 $692,551 $1,168,699 $1,643,405 $2,082,853 $2,185,209
United Kingdom 80,031 101,193 162,884 256,924 269,094
United Arab Emirates 98,209 131,796 176,445 224,501 313,724
South Korea 37,513 50,714 71,389 90,888 121,535
Australia 68,291 99,372 133,569 193,771 233,492
Belgium 50,383 64,090 91,016 135,543 122,328
Germany 35,302 62,243 91,156 125,024 128,009
Brazil 11,224 38,820 61,745 102,816 182,470
All other 1,048,380 1,565,961 1,923,122 2,748,015 3,344,375
Total 2,121,882 3,282,889 4,354,732 5,960,336 6,900,234
Table continued on next page.

IV-10
Table IV-4--ContinuedMotor car, truck, and bus tires:1 China’s exports to major trading partners, 2004-08
DestinationCalendar year
2004 2005 2006 2007 2008
Unit value (per tire)
United States2 $30.03 $36.34 $39.64 $37.90 $38.98
United Kingdom 20.36 23.25 26.72 29.44 30.06
United Arab Emirates 29.59 36.28 45.03 43.86 53.12
South Korea 48.64 25.41 21.87 22.87 25.89
Australia 44.63 46.36 47.52 49.59 53.13
Belgium 23.94 24.99 26.84 27.51 30.01
Germany 18.95 22.20 23.84 29.07 33.47
Brazil 33.31 38.35 32.65 39.83 50.34
All other 32.93 38.08 43.26 49.33 57.40
Average 30.86 35.76 39.19 41.34 46.06
Shares of quantity (percent)
United States2 33.5 35.0 37.3 38.1 37.4
United Kingdom 5.7 4.7 5.5 6.1 6.0
United Arab Emirates 4.8 4.0 3.5 3.6 3.9
South Korea 1.1 2.2 2.9 2.8 3.1
Australia 2.2 2.3 2.5 2.7 2.9
Belgium 3.1 2.8 3.1 3.4 2.7
Germany 2.7 3.1 3.4 3.0 2.6
Brazil 0.5 1.1 1.7 1.8 2.4
All other 46.3 44.8 40.0 38.6 38.9
Total 100.0 100.0 100.0 100.0 100.01 Includes an undetermined number of tires that are not subject to this investigation. HTS subheading 4011.10 is a broader
tariff classification that includes other products that are not subject to this investigation. Specifically, new pneumatic tires, ofrubber, used on racing cars are covered under HTS subheading 4011.10. In addition, tires used on buses and trucks that are notlight trucks, reported under HTS subheading 4011.20, are not subject to this investigation.
2 Includes Puerto Rico.
Source: Global Trade Atlas, importer records (HTS subheadings 4011.10 and 4011.20).

IV-11
Figure IV-1Motor car, truck, and bus tires: China’s exports to major trading partners, 2004-08
Source: Table IV-4.
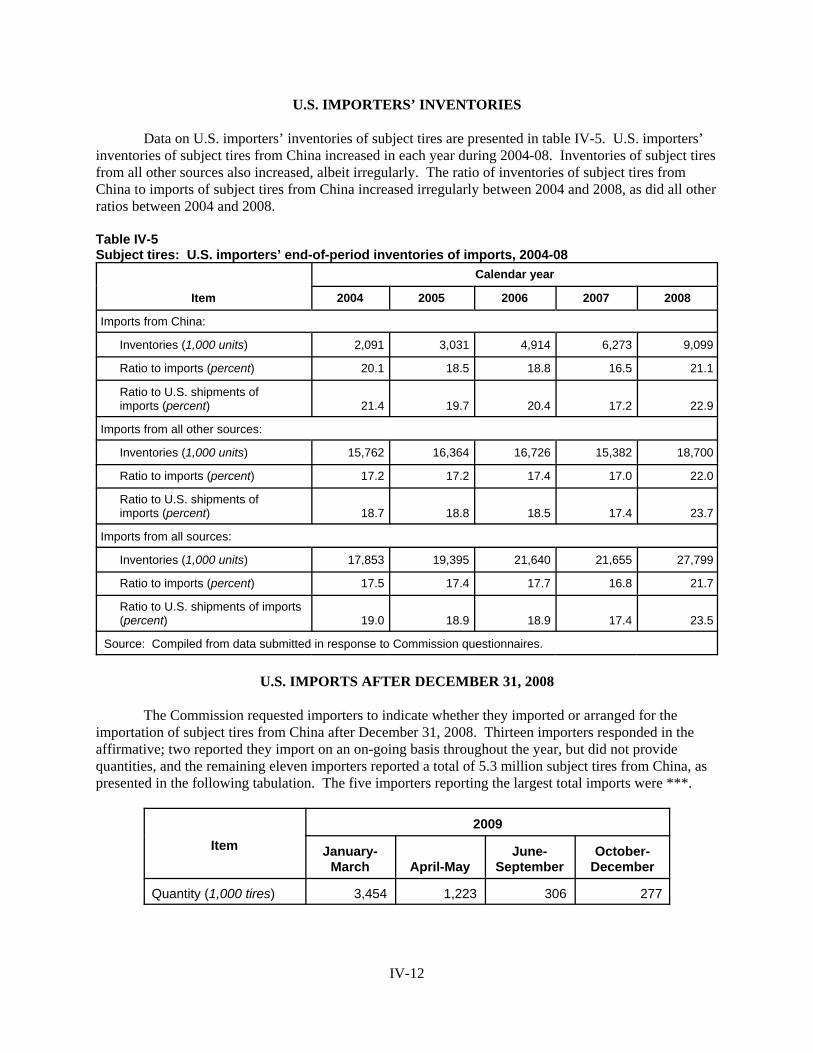
IV-12
U.S. IMPORTERS’ INVENTORIES
Data on U.S. importers’ inventories of subject tires are presented in table IV-5. U.S. importers’inventories of subject tires from China increased in each year during 2004-08. Inventories of subject tiresfrom all other sources also increased, albeit irregularly. The ratio of inventories of subject tires fromChina to imports of subject tires from China increased irregularly between 2004 and 2008, as did all otherratios between 2004 and 2008.
Table IV-5Subject tires: U.S. importers’ end-of-period inventories of imports, 2004-08
Item
Calendar year
2004 2005 2006 2007 2008
Imports from China:
Inventories (1,000 units) 2,091 3,031 4,914 6,273 9,099
Ratio to imports (percent) 20.1 18.5 18.8 16.5 21.1
Ratio to U.S. shipments of imports (percent) 21.4 19.7 20.4 17.2 22.9
Imports from all other sources:
Inventories (1,000 units) 15,762 16,364 16,726 15,382 18,700
Ratio to imports (percent) 17.2 17.2 17.4 17.0 22.0
Ratio to U.S. shipments ofimports (percent) 18.7 18.8 18.5 17.4 23.7
Imports from all sources:
Inventories (1,000 units) 17,853 19,395 21,640 21,655 27,799
Ratio to imports (percent) 17.5 17.4 17.7 16.8 21.7
Ratio to U.S. shipments of imports(percent) 19.0 18.9 18.9 17.4 23.5
Source: Compiled from data submitted in response to Commission questionnaires.
U.S. IMPORTS AFTER DECEMBER 31, 2008
The Commission requested importers to indicate whether they imported or arranged for theimportation of subject tires from China after December 31, 2008. Thirteen importers responded in theaffirmative; two reported they import on an on-going basis throughout the year, but did not providequantities, and the remaining eleven importers reported a total of 5.3 million subject tires from China, aspresented in the following tabulation. The five importers reporting the largest total imports were ***.
Item2009
January-March April-May
June-September
October-December
Quantity (1,000 tires) 3,454 1,223 306 277

34 Petition, p. 19. 35 *** noted that “***.” *** reported that ***. *** and *** responses to the U.S. importers’ questionnaire,section II-6. 36 Michelin, Factbook 2009, retrieved on June 1, 2009 fromhttp://www.michelin.com/corporate/front/templates/affich.jsp?codeRubrique=20050310113052&lang=EN. 37 Ibid.
IV-13
IMPORT RESTRICTIONS OR REMEDIES IN OTHER COUNTRIES
Subject tires from China have not been subject to any import relief investigations in the UnitedStates, but are subject to antidumping measures in Brazil and Egypt.34
U.S. producers and importers were asked if the U.S. market for subject tires has been the focalpoint for diversion of exports of subject tires, by reason of restraints on exports to or imports intothird-country markets of subject tires. Seven U.S. producers (***) responded “No”, while three U.S.producers (***) reported that they were either unable to determine or not in a position to answer. Thirty-one importers reported “No,”35 while two importers (***) responded that they were not in aposition to respond, and one importer (***) reported that it was unknown.
THE GLOBAL TIRE INDUSTRY
The global tire industry is made up of large multinational producers that are active throughout theworld, with plants located in both the developed and developing nations. The most recent production andsales data, by company and country, available from any one data source are presented in table IV-6 andtable IV-7, respectively. Regionally, the European passenger car and light truck tire market remains thelargest world market, by volume, accounting for an estimated 32 percent of global sales in 2008.36 TheNorth American market accounted for an estimated 29 percent of world sales, while the Asian marketaccounts for approximately 28 percent.37
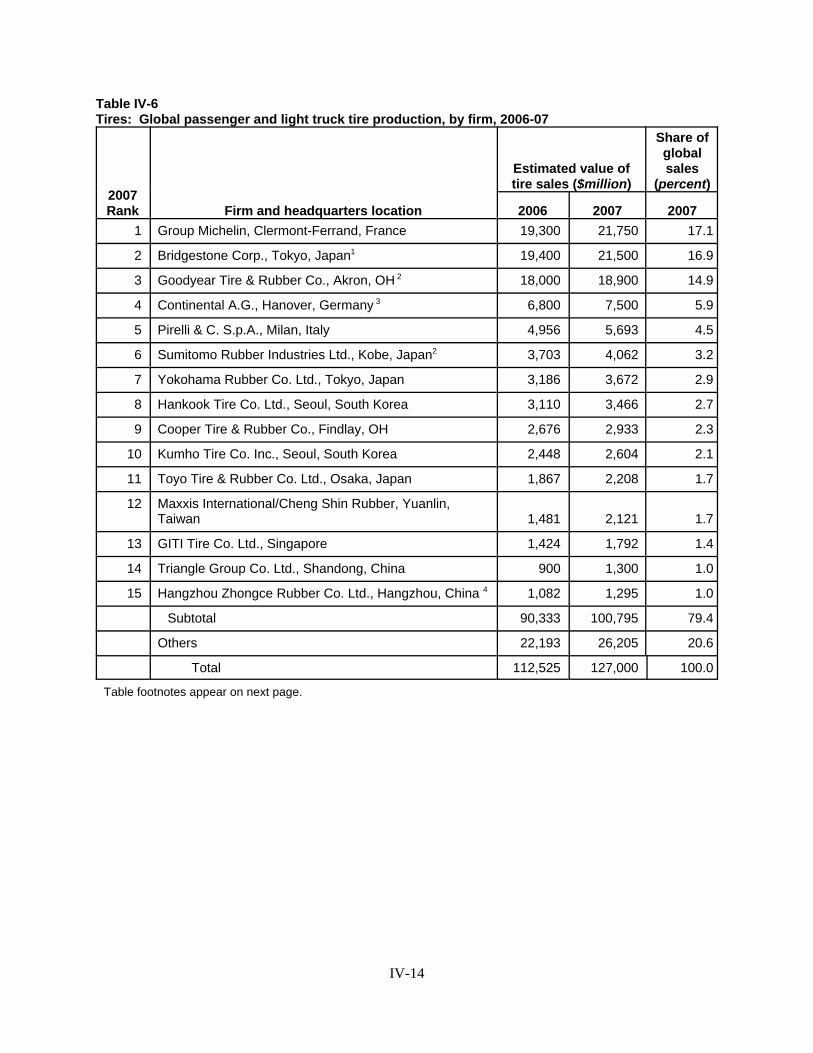
IV-14
Table IV-6Tires: Global passenger and light truck tire production, by firm, 2006-07
2007Rank Firm and headquarters location
Estimated value oftire sales ($million)
Share ofglobalsales
(percent)
2006 2007 20071 Group Michelin, Clermont-Ferrand, France 19,300 21,750 17.1
2 Bridgestone Corp., Tokyo, Japan1 19,400 21,500 16.9
3 Goodyear Tire & Rubber Co., Akron, OH 2 18,000 18,900 14.9
4 Continental A.G., Hanover, Germany 3 6,800 7,500 5.9
5 Pirelli & C. S.p.A., Milan, Italy 4,956 5,693 4.5
6 Sumitomo Rubber Industries Ltd., Kobe, Japan2 3,703 4,062 3.2
7 Yokohama Rubber Co. Ltd., Tokyo, Japan 3,186 3,672 2.9
8 Hankook Tire Co. Ltd., Seoul, South Korea 3,110 3,466 2.7
9 Cooper Tire & Rubber Co., Findlay, OH 2,676 2,933 2.3
10 Kumho Tire Co. Inc., Seoul, South Korea 2,448 2,604 2.1
11 Toyo Tire & Rubber Co. Ltd., Osaka, Japan 1,867 2,208 1.7
12 Maxxis International/Cheng Shin Rubber, Yuanlin,Taiwan 1,481 2,121 1.7
13 GITI Tire Co. Ltd., Singapore 1,424 1,792 1.4
14 Triangle Group Co. Ltd., Shandong, China 900 1,300 1.0
15 Hangzhou Zhongce Rubber Co. Ltd., Hangzhou, China 4 1,082 1,295 1.0
Subtotal 90,333 100,795 79.4
Others 22,193 26,205 20.6
Total 112,525 127,000 100.0
Table footnotes appear on next page.

IV-15
Table IV-6--ContinuedTires: Global passenger and light truck tire production, by firm, 2006-07
1 Bridgestone also owns 19 percent of Finland’s Nokian Tyres P.L.C. (number 16 on 2008 ranking) and 44percent of Turkey’s BRISA/Bridgestone-Sabanci Tire Mfg. (number 30). 2 Goodyear and Sumitomo operate 75/25 joint ventures in North America and western Europe, incorporatingSumitomo’s Dunlop tire activities in those regions. 3 Continental acquired a 51-percent ownership of Slovak Republic’s Matadador A.S. ($385 million tire-relatedsales) during the second quarter of 2007. 4 This company formerly was part of China Enterprises Ltd.
Note: Where possible, non-tire revenue from company-owned retail operations is excluded.
Source: Rubber News.
Table IV-7 Tires:1 Passenger and light truck tire production by country, 2005-06
Country 2005 2006 Change 2005-06
Quantity (1,000 tires) (percent)
China 154,500 205,500 33.0
United States 158,729 176,500 11.2
Japan 134,802 134,594 -0.2
South Korea 65,655 65,231 -0.6
Germany 67,575 63,900 -5.4
France 52,800 54,000 2.3
Brazil 29,622 29,212 -1.4
All other 270,831 263,834 -2.6
Total 934,514 992,771 6.2 1 Data for some countries, including China, are estimated and include truck & bus tires.
Source: Rubber News (International Rubber Study Group; Rubber Manufacturers Association; Japan AutomobileTire Manufacturers Association; Korea Tire Manufacturers Association; Rubber Association of Canada; NationalTire Industry Association-Brazil; Consorcio Nacional de Industriales del Caucho-Spain; Automobile TyreManufacturers Association-India).

38 A tire’s speed rating represents the maximum recommended serviceable speed that a specific tire should bedriven. The speed rating is determined by manufacturer testing to meet the minimum standards as specified by theU.S. Department of Transportation (DOT) for reaching and sustaining a specific speed level. The rating codesdescribed in the tabulation are: ST - Special trailer tires that are rated for speeds up to 65 mph, H - Passenger cartires that are rated for speeds up to 130 mph, VZ - Passenger car tires that are rated for speeds up to and greater than186 mph. Recreational tires are specifically designed for SUV, 4-WD and Crossover vehicles, Winter tires aredesigned for traction in winter weather, and Commercial tires are those tires designed for use on light trucks. 39 Michelin, Factbook 2009, op. cit. 40 Rubber News, Michelin: N.A., European tire demand fell in January, February 26, 2009, found at http://www.globaltirenews.com/headlines2.html?id=1235680558, retrieved on May 18, 2009. 41 Rubber News, Pirelli to shift production, cut jobs in Europe, February 12, 2009, found at http://www.globaltirenews.com/headlines2.html?id=1234448982, retrieved on May 18, 2009.
IV-16
The shares of the 2008 world market, by tire size and speed rating,38 are shown in the followingtabulation.39
ItemShare of 2008 world
market (percent)
Rim Diameter:
Less than or equal to 13" 15
14" 18
15" 26
16" 26
Greater than or equal to 17" 15
Speed Rating:
Recreational 16
Commercial 10
Winter 10
VZ 15
H 18
ST 31
Although the demand for the subject tires is declining in most world markets, particularly inNorth America and Europe, the decline is reported to be less pronounced in China and South America. InChina, demand for replacement tires was reported to have increased in late 2008 and early 2009.40 As aresult of the declining demand in certain markets, production is being shifted by multinationals to servethe markets in which demand is expected to grow. For example, Pirelli is planning on cutting 1,500 jobsin Europe and moving production to lower cost plants; Pirelli is reported to be weathering the demandslump for tires better than other firms owing to its strong presence in South America and China.41

42 Rubber News, Tire makers still bullish on spending, September 8, 2008, found at http://www.rubbernews.com/subscriber/features2.html?cat=10&id=1220885450, retrieved on May 18, 2009. 43 Ibid.
IV-17
Overall, the global tire producers are expected to commit to spending nearly $10 billion oncapital projects, including new plants, expanded capacity, and plant modernizations.42 More than half ofthe planned capital expenditures are expected from two companies, Michelin and Goodyear. The largestportion of the total planned expenditures is targeted for Europe, followed by projects in Asia and thenNorth America.43


V-1
PART V: THE QUESTION OF THE CAUSAL RELATIONSHIP BETWEENTHE ALLEGED INJURY AND IMPORTS
U.S. MARKET PENETRATION OF IMPORTS
Data concerning apparent U.S. consumption and U.S. market shares of subject tires during 2004-08 are shown in table V-1 and figure V-1. U.S. producers’ market share based on quantity decreased ineach year during 2004-08, for an overall decrease of 13.7 percentage points. The market share of importsfrom China based on quantity increased in each year, for an overall increase of 11.9 percentage points(based on unrounded data); the market share of imports from all other sources increased in each yearother than 2007, for an overall increase of 1.8 percentage points.
Table V-1Subject tires: U.S. consumption and market shares, 2004-08
Item
Calendar year
2004 2005 2006 2007 2008
Quantity (1,000 tires)
Apparent U.S. consumption 307,484 304,970 291,420 296,091 275,702
Value (1,000 dollars)
Apparent U.S. consumption 13,845,818 14,808,616 15,238,721 16,502,706 16,460,066
Share of quantity (percent)
U.S. producers’ U.S. shipments 63.3 59.6 56.2 52.6 49.6
U.S. imports from--
China 4.7 6.8 9.3 14.0 16.7
All other sources 31.9 33.6 34.5 33.4 33.7
All countries 36.7 40.4 43.8 47.4 50.4
Share of value (percent)
U.S. producers’ U.S. shipments 68.1 64.1 62.2 60.4 57.9
U.S. imports from--
China 3.3 4.7 6.1 9.0 10.9
All other sources 28.7 31.2 31.7 30.6 31.2
All countries 31.9 35.9 37.8 39.6 42.1
Note.–Because of rounding, figures may not add to the totals shown.
Source: Compiled from data submitted in response to Commission questionnaires and from official Commercestatistics.

V-2
Figure V-1Subject tires: Apparent U.S. consumption, by sources, 2004-08
Source: Table I-6.
Information concerning the ratio of imports to U.S. production of subject tires is presented in PartII of this report.

1 RMA factbook 2009, p. 3. (See petition, p. 21 and exh. 5.)
V-3
PRICES AND RELATED INFORMATION
Channels of Distribution
Subject tires are primarily sold to the replacement market. According to data from the RubberManufacturers Association, about 85 percent of all U.S. shipments in 2008 of subject tires went to thereplacement market.1 As shown in table V-2, in each period, over three-fourths of shipments of U.S.product and imports from countries other than China were to the replacement market and almost all of theremaining shipments were made to OEMs. Also, in each period, 92 percent or more of U.S shipments ofimports from China were to the replacement market and the remaining shipments were made to OEMs.Table V-3 shows the channels of distribution for U.S. producers’ and U.S. importers’ U.S. shipments. Shipments for U.S. importers were constructed from the shares of quantity to each channel of distributionbased on importer questionnaire responses and official U.S. import statistics.
Table V-2Subject tires: U.S. producers’ and U.S. importers’ U.S. shipments, by channels of distribution,2004-08
Item
Calendar year
2004 2005 2006 2007 2008
Shares of U.S. shipments (percent)
U.S. producers:
Original equipment manufacturers 23.3 22.0 20.8 20.0 17.7
Replacement market 76.7 78.0 79.2 80.0 82.3
Other 0.0 0.0 0.0 0.0 0.0
Imports from China:
Original equipment manufacturers 0.8 3.6 7.3 4.9 5.0
Replacement market 99.2 96.4 92.7 95.1 95.0
Other 0.0 0.0 0.0 0.0 0.0
Imports from other countries:
Original equipment manufacturers 20.0 21.4 22.0 23.2 21.9
Replacement market 78.9 77.8 77.3 75.7 77.3
Other 1.0 0.9 0.7 1.1 0.7
Source: Compiled from data submitted in response to Commission questionnaires.

2 CCCMC respondents’ brief, p. 6. 3 Ibid.
V-4
Table V-3Subject tires: U.S. producers’ U.S. shipments and U.S. importers’ constructed U.S. shipments, bychannels of distribution, 2004-08
Item
Calendar year
2004 2005 2006 2007 2008
Quantity (1,000 tires)
U.S. producers:
Original equipment manufacturers 45,351 40,075 34,090 31,090 24,211
Replacement market 149,380 141,680 129,724 124,585 112,614
Other 0 0 0 0 0
Imports from China:
Original equipment manufacturers 121 751 1,961 2,029 2,281
Replacement market 14,453 20,040 25,045 39,474 43,694
Other 0 0 0 0 0
Imports from other countries:
Original equipment manufacturers 19,660 21,875 22,115 22,992 20,387
Replacement market 77,499 79,672 77,799 74,870 71,854
Other 1,021 877 687 1,051 661
Source: Compiled from data submitted in response to Commission questionnaires.
Market Segmentation
Both petitioner and respondents agree that the subject tire market is segmented between the OEMand replacement markets. However, respondents argue that the replacement market is further segmentedinto specific categories that command different prices. Respondents indicate that the market cangenerally be categorized into the premier and economy segments, although the labeling for marketsegments vary among producers and importers.2 They state that the premier market consists of two partsor tiers, with Tier 1 as a market segment with flagship brands such as Bridgestone, Goodyear, andMichelin and Tier 2 as a market segment with secondary or former Tier 1 brand tires such as BFGoodrich, Uniroyal, and General, or foreign brands, such as Pirelli, that are flag brands in their owncountry but do not yet have the brand equity in the United States to be Tier 1 brands.3 Respondentscharacterize a Tier 3 market segment with economy or mass-market tires that consist of private brands

4 Ibid. 5 Hearing transcript, p. 362 (Keeler), GITI posthearing brief, p. 6. 6 Riad A. Ajami, Karel Cook, G. Jason Goddard, and Dara Khambata, International Business: Theory andPractice, (2nd ed.; published by M.E. Sharpe, 2006), “Case Study 1: The Global Tire Industry and Michelin in 2004,”p. 407. 7 Ibid. 8 Ibid. 9 Hearing transcript, p. 281 (Berra) and p. 272 (Mayfield). 10 Hearing transcript, pp. 275-276, 281 (Berra) and pp. 272-273 (Mayfield), hearing transcript, pp. 360-61(Trossevin). 11 Petitioner’s prehearing brief, p. 7, and posthearing brief, p. 1. 12 Hearing transcript, p. 188 (Stewart). 13 The petitioner cites exhibit 24 of its petition in which two flagship brand products, the Goodyear Eagle LS andGoodyear Integrity with the same size of 225/60R16 and same service description of 97S, are sold at different prices. Hearing transcript, pp. 98-99 (Stewart). 14 Petitioner’s posthearing brief, p. 1 and p. 41, Modern Tire Dealer, “Brands of confusion,” May 1, 2008.
V-5
and lower level “associate” brands owned by major producers.4 While respondents categorize mostprivate brand tires as Tier 3 tires, they stated that there is some private label production in Tier 2.5
A case study on the global tire industry in 2004 indicated that U.S. producers sold tires undergood/better/best brand names in the U.S. market.6 For Michelin the good/better/best brands were itsUniroyal, BF Goodrich, and Michelin brands respectively, and for Bridgestone these brands were itsFirestone, Dayton, Bridgestone brands respectively.7 The study indicated that Goodyear lacked a middle-market brand but would soon have Sumitomo’s Dunlop brand.8
Respondents indicate that the main reasons that tires in the Tier 3 market segment are lessexpensive is that no money is spent to build brand recognition and because the tires tend to be purchasedfor older vehicles.9 Respondents also indicate that there are also some differences between the varioustiers in raw material inputs and the degree of technological development, including differences in tractioncapabilities, higher UTQG system gradings, and mileage warranties, but that all segments of the subjecttire market meet the same U.S. safety and quality standards and there are no “bright lines” betweenmarket segments.10
The petitioner claims that there is no clear definition of market segments in the replacementmarket for subject tires and that there is competition among all brands.11 It states that there is acontinuum of prices within premium and so-called associate brands12 and that differences exist within thesame flagship brand, signifying a good/better/best segmentation even among brands.13 The petitioner alsoindicates that private brand tires often are confused with associate brands and low-cost imports, andsometimes even major brands by tire dealerships.14
A supplemental questionnaire was sent to all U.S. producers of subject tires and the largest 26importers of subject tires from China to gather additional information about market segmentation,category descriptions used at each firm, and, if such segments/categories do exist, whether the U.S.market for subject tires has shifted between the three categories between 2004 and 2008. Supplementalquestionnaire responses were received from all U.S. producers and 25 of the largest importers. Responsesare presented in appendix D. The supplemental questionnaire data indicate that most of the respondingfirms believe that the subject tire market is generally segmented into three categories; however, theresponses illustrate that there is no consensus on terminology used to define those segments. Five of theresponding importers reported that the U.S. subject tire market cannot be segmented. Fifteen importers

15 Modern Tire Dealer, “No smoke or mirrors,” January 2009. 16 CCCMC respondents’ prehearing brief, p. 18; Modern Tire Dealer, “No smoke or mirrors,” January 2009, p.24. 17 Modern Tire Dealer, “No smoke or mirrors,” January 2009, p. 22.
V-6
reported that the market is indeed segmented, generally on brands, with all 15 reporting major, flagship,or premium brands as category 1; 14 describing category 2 as secondary, associate, or foreign producerbrands; and 13 describing category 3 as private label, mass-market, lesser known brands, or nonbranded. Most of these importers agreed on what type of brand was in category 1, although there was lessagreement as to what was included in category 2 and category 3. For example, three importers placed“associate brands” in category 2, while three placed them in category 3. There was a wide range ofestimated shares represented by each category.
Of the four largest U.S. producers, two, ***, reported that the U.S. subject tire market issegmented along brands with 65-70 percent in category 1, approximately 10 percent in category 2, andaround 25 percent in category 3. *** reported that there was no consensus in the marketplace on how todivide the U.S. market and *** reported that the U.S. market is segmented based using price.
Modern Tire Dealer reports that between 2006 and 2008, the share of tires sold under a majorbrand name decreased from 73.0 percent to 72.6 percent and the share of tires sold under a private brandlabel fell from 17.0 percent to 14.1 percent.15
Eighteen firms, including all but two U.S. producers, ***, reported that there was a shift in theU.S. market for subject tires among the three categories, with a shift towards value tires in category 3being the most common occurrence cited (by five firms). Six firms noted that the U.S. producers hadshifted away from production of category 3 tires, while several of these firms noted that imports fromChina had increased in category 3. Five firms reported that there had been no shift in the U.S. market forsubject tires.
Six U.S. producers reported that there was a shift in their firm’s U.S. production of subject tires,three reporting an increase in category 1, three reporting a decline in category 3, and two noting that theyproduce according to market demand. Four U.S. producers, ***, reported that there was no shift in theirfirm’s U.S. production of subject tires.
Two firms, ***, reported that their firm’s U.S. imports of subject tires from China had shiftedamong the three categories between 2004 and 2008. *** noted that it had *** while *** reported that itsimports of subject tires from China had ***. Twenty-one firms reported that their firm’s imports ofsubject tires from China had not changed between 2004 and 2008.
Six firms, including ***, reported that their firm’s U.S. imports of subject tires from all othersources had shifted among the three categories between 2004 and 2008. Three firms noted a decline inthe imports of category 3 during 2004-08. Seventeen firms reported that their firm’s imports of subjecttires from all other sources had not changed between 2004 and 2008.
Respondents cite a Modern Tire Dealer article that states that most flagship brands held theirmarket share in 2008 because they don’t compete against low-cost radials. Associate and private brandslost market share, but some companies with production bases in China still benefitted.16 The same articlestates that U.S. producers have put more emphasis on their ultra-high performance, touring, and wintertire offerings during the last few years and that by focusing on the production of higher-value tires, andleaving low-cost radial production to overseas manufacturers, they can increase sales and improveprofitability.17 Michelin indicates that there have been some dramatic shifts in the past in Tier 2 and 3brands—involving lower-profile brands, such as BF Goodrich and Yokohama, and emerging brands from

18 Tire Business, “Michelin brand strong despite the recession, executives say,” May 11, 2009. 19 Modern Tire Dealer, “Private brand Q&A: ACCC’s Lewin discusses the private brand ‘squeeze’,” May 14,2009. 20 Goodyear 2008 10-K, p. 33 and p. 43.
V-7
China and elsewhere—but it does not see private and associate brands growing significantly.18 LenLewin, President of American Car Care Centers, a large U.S. private brand tire marketer, also stated thatthere has been a significant shift away from private brands by a number of major tire manufacturers in thepast few years and that he expects the trend to continue.19 Goodyear also states in its 2008 10-K Reportthat it made the decision to exit certain segments of the private label tire business in June 2006.20
Supply Considerations
Domestic Production
Based on available information, U.S. producers have the ability to respond to changes in demandwith moderate changes in the quantity of shipments of U.S.-produced subject tires supplied to the U.S.market. The main factors contributing to the moderate degree of responsiveness of supply are theavailability of some unused capacity and some ability to produce alternate products; supplyresponsiveness is constrained by a limited ability to divert shipments from alternate markets and asomewhat limited ability to use inventories to increase shipments to the U.S. market.
Industry capacity
Capacity utilization for U.S. producers decreased from 96.3 percent in 2004 to 86.0 percent in2008. This level of capacity utilization indicates that the U.S. producers have some unused capacity withwhich they could increase production of subject tires in the event of a price change.
Alternative markets
Exports by U.S. producers, as a share of total shipments, increased from 12.3 percent in 2004 to14.1 percent in 2008. These data indicate that U.S. producers have a somewhat limited ability to divertshipments to or from alternative markets in response to changes in the price of subject tires.
Inventory levels
The ratio of U.S. producers’ end-of-period inventories to their total shipments increased from 9.9percent in 2004 to 13.6 percent in 2008. These data indicate that U.S. producers have a somewhat limitedability to use inventories as a means of increasing shipments of subject tires to the U.S. market.
Production alternatives
Four of nine responding producers indicated that they produce other products on the sameequipment and machinery used in the production of subject tires. *** indicated that it producescommercial tires, off-the-road tires, and motorcycle tires with about *** percent of the same machineryused to produce subject tires, and *** indicated that it uses *** percent of the same machinery used to

V-8
produce subject tires to produce nonsubject tires. Therefore, U.S. producers have some ability to producealternative products.
Subject Imports
Based on available information, Chinese producers have the ability to respond to changes indemand with moderate changes in the quantity of shipments of subject tires to the U.S. market. The mainfactors contributing to the moderate degree of responsiveness of supply for Chinese producers are theability to divert shipments from alternate markets, the availability of some unused capacity, and someability to produce alternate products; responsiveness is constrained by a limited ability to use inventoriesto increase shipments to the U.S. market.
Industry capacity
During the period for which data were collected, the capacity utilization rate for Chineseproducers of subject tires decreased irregularly from 87.5 percent in 2004 to 83.2 percent in 2008. Theselevels of capacity utilization indicate that Chinese producers have some unused capacity with which theycould increase production of subject tires in the event of a price change.
Alternative markets
Shipments of subject tires from China to markets other than the United States (both exports toalternative markets and shipments to their home market) decreased from approximately 82.3 percent oftotal shipments in 2004 to 74.2 percent in 2008. Thus, available data indicate that subject producers inChina have the ability to divert shipments to or from their home market and alternative markets inresponse to changes in the price of subject tires.
Inventory levels
Chinese producers’ inventories, as a share of their total shipments, decreased from 10.8 percent in2004 to 8.7 percent in 2008. These data indicate that Chinese producers have a somewhat limited abilityto use inventories as a means of increasing shipments of subject tires to the U.S. market.
Production alternatives
Five of 36 responding subject Chinese producers indicated that they produce other products onthe same equipment and machinery used in the production of subject tires. Three Chinese producers(***) reported they also produce products such as spare tires, trailer tires, off-the-road tires, and forklifttires with up to 30 percent of the same machinery used to produce subject tires. One Chinese producer(***) reported that it also produces other products on about *** percent of the same machinery used toproduce subject tires. One Chinese producer (***) reported that it also produces light truck bias-ply tireson an unspecified percent of the same machinery used to produce subject tires. Therefore, Chineseproducers are believed to have a limited ability to produce alternative products.

21 RMA press release, March 16, 2009. 22 Ibid. 23 RMA notes that its projection does not account for any changes to the auto industry as a result of federalintervention and/or bankruptcy. Ibid.
V-9
Nonsubject Imports
Subject tires were imported from a large number of nonsubject countries during the period forwhich data were collected. Imports of the subject product from nonsubject countries as a share of thequantity of apparent U.S. consumption increased from 31.9 percent in 2004 to 33.7 percent in 2008.
Demand Considerations
Based on available information, it is likely that changes in the price of subject tires will result in asmall change in the quantity of subject tires demanded. The main factors contributing to the small degreeof responsiveness of demand to changes in the price of subject tires are the limited substitutability ofother products for subject tires and the low cost share of subject tires in the total cost of passengervehicles and light trucks.
Demand Characteristics
Demand for subject tires depends on changes in the numbers of new passenger vehicles and lighttrucks produced in the United States and changes in the number of existing passenger vehicles and lighttruck that need replacement tires. The RMA reported that a decrease in miles traveled, consumers tryingto get more miles out of their current passenger car tires, and the weak economy contributed to a decreasein demand for replacement market subject tires during 2008.21 It also reported that decreases in domesticpassenger car production decreased the demand for OEM tires for passenger cars in 2008, and theincreased demand for vehicles with high fuel economy, a shift to P-metric passenger car tires, andincreased market share of imported light trucks led to a decrease in demand for OEM tires for light trucksin 2008.22 RMA reported that it expects demand for replacement and OEM market passenger vehicle andlight truck tires to decrease in 2009, but to increase in 2010 due to expected fluctuations in the economy.23
Figure V-2 shows that passenger vehicles and light trucks in use in the U.S. market haveincreased by about 7 percent between 2004 and 2007, with a 2-percent increase for passenger vehiclesand a 14-percent increase for light trucks. Figure V-3 shows that the median age of passenger carsincreased by 6 percent and that the average age of light trucks increased by 17 percent between 2004 and2008. Figure V-4 shows that U.S. production of passenger vehicles and light trucks has decreased by 27percent, with about an 11-percent decrease for passenger vehicles and a 37-percent decrease for lighttrucks between 2004 and 2008.
Seven of eight responding U.S. producers and three of 26 responding importers indicated thatdemand for subject tires in the U.S. market has decreased since 2004. Reasons cited for the decrease indemand included the downturn in the economy, lower vehicle production, fewer miles being driven, over-stretched tire life, and more radial tire use. However, 21 of 26 responding importers and the remainingresponding producer indicated that demand in the U.S. market has increased since 2004. Reasons citedfor the increase included economic growth (particularly until 2008), an increased use in performancewheels, and the continued popularity of SUVs, light trucks, and crossover vehicles. Three of fourresponding producers and 16 of 20 responding importers indicated that demand for subject tires outside

V-10
Figure V-2U.S. passenger vehicle and light trucks in use, 1998-2007
Source: R.L. Polk & Co. in Supplement to Automotive News, May 26, 2008. Reproduced with permission of R.L.Polk & Co. Reproduction in whole or in part is prohibited without written permission of R.L. Polk & Co.
Figure V-3Median age of U.S. passenger vehicles and light trucks, 1999-2008
Source: R.L. Polk & Co., press release, March 9, 2009.

24 For example, see http://www.retread.org/Government/index.cfm/ID/13.htm. 25 CCCMC respondents’ prehearing brief, p. 21.
V-11
Figure V-4U.S. passenger vehicle and light truck production, 2004-08
Source: Ward’s AutoInfoBank.
the U.S. market has increased since 2004. Reasons cited for the increase in demand include the globaleconomy, population growth, and vehicle production growth.
Substitute Products
All responding producers and all but one responding importer indicated that there are nosubstitutes for subject tires. However, the Tire Retread Information Bureau indicates that with propermaintenance, retreaded tires can be just as safe to use as new tires.24 CCCMC respondents indicate thatthe real substitute for subject tires is deferring the purchase of new tires and that the low cost share ofsubject tires in the total cost of passenger vehicles and light trucks has a minor effect on demand sinceover 80 percent of sales subject tires are to the replacement market.25
Cost Share
Tires generally make up a small share of the final cost of passenger vehicles and light trucks. One importer (***) indicated that subject tires make up 4 percent of the final cost of a light truck and lessthan 1 percent of the cost of a passenger vehicle. Another importer (***) indicated that subject tires makeup about one percent of the total cost of a light truck.

26 Eleven firms indicated that they were purchasers of subject tires, but listed foreign producers as suppliers orotherwise indicated that they were direct importers of subject tires and not purchasers. These eleven firms are ***. Also, one firm (***) indicated that it only purchases a limited number of tires for vehicles in its corporate fleet. Staff interview with ***, May 21, 2009. These 12 firms’ responses to the purchaser questionnaire were not includedin this report.
V-12
Substitutability Issues
The degree of substitution between domestic and imported subject tires depends upon suchfactors as relative prices, quality (e.g., grade standards, reliability of supply, defect rates, etc.), andconditions of sale (e.g., price discounts/rebates, lead times between order and delivery dates, paymentterms, product services, etc.). Based on available data, staff believes that there is a high degree ofsubstitutability between domestically produced subject tires and subject tires imported from China.
Factors Affecting Purchasing Decisions
Purchasers26 report that they consider a variety of factors to be important when selecting amongcompeting subject tires suppliers, including availability, price, and quality. As indicated in table V-4,quality was named by 18 of 30 responding purchasers as the number one factor generally considered indeciding from whom to purchase subject tires and the number two factor by six purchasers. Also, asindicated in table V-5, 30 of 31 responding purchasers indicated that quality meeting industry standardswas a “very important” factor in their purchase decisions for subject tires and 18 of 31 respondingpurchasers indicated that quality exceeds industry standards is a “very important” factor in their purchasedecisions. Quality characteristics that purchasers consider when determining the quality of subject tiresinclude balance, uniformity of materials, durability, ride handling, braking ability, and tire noise. Severalpurchasers indicated that they consider whether tires meet U.S. DOT requirements; purchasers noted thatto ensure quality, they rely on their own and third party tests of subject tires, references from otherpurchasers and suppliers, industry ratings, warranties provided, and historical returns for the tire and thesupplier overall. When qualifying a new supplier, purchasers indicated that they consider factors such asquality, price, and availability. Purchasers estimate that it can take from one month to four years toqualify a new supplier.
Price was named by three of 30 responding purchasers as the number one factor generallyconsidered in deciding from whom to purchase subject tires, as the number two factor by 10 respondingpurchasers, and as the number three factor by eight other responding purchasers. Also, as indicated intable V-5, 25 of 31 responding purchasers indicated that price was a “very important” factor in theirpurchasing decisions for subject tires. Twenty of 30 responding purchasers indicated that the lowest-priced subject tires “sometimes” will win a sale, six reported “usually,” four reported “never,” and nopurchaser reported “always.”

V-13
Table V-4Subject tires: Ranking of factors used in purchasing decisions, as reported by unrelated U.S.purchasers
Factor
Number of firms reporting
Number one factor Number two factor Number three factor
Availability 1 6 4
Brand 2 0 1
Delivery time 1 0 0
Performance 2 0 0
Price 3 10 8
Product consistency 0 3 1
Product range 0 1 4
Production capabilities 0 0 2
Quality 18 6 0
Reliability of supply 1 3 2
Support/service 0 0 3
Technology 0 0 2
Traditional supplier 1 0 0
Other1 2 1 3
1 Other factors include “specifications match that of an OEM tire,” “warranty,” ”ability to expand product range,”“delivery,” and “automatic replenishment order cycle.”
Source: Compiled from data submitted in response to Commission questionnaires.
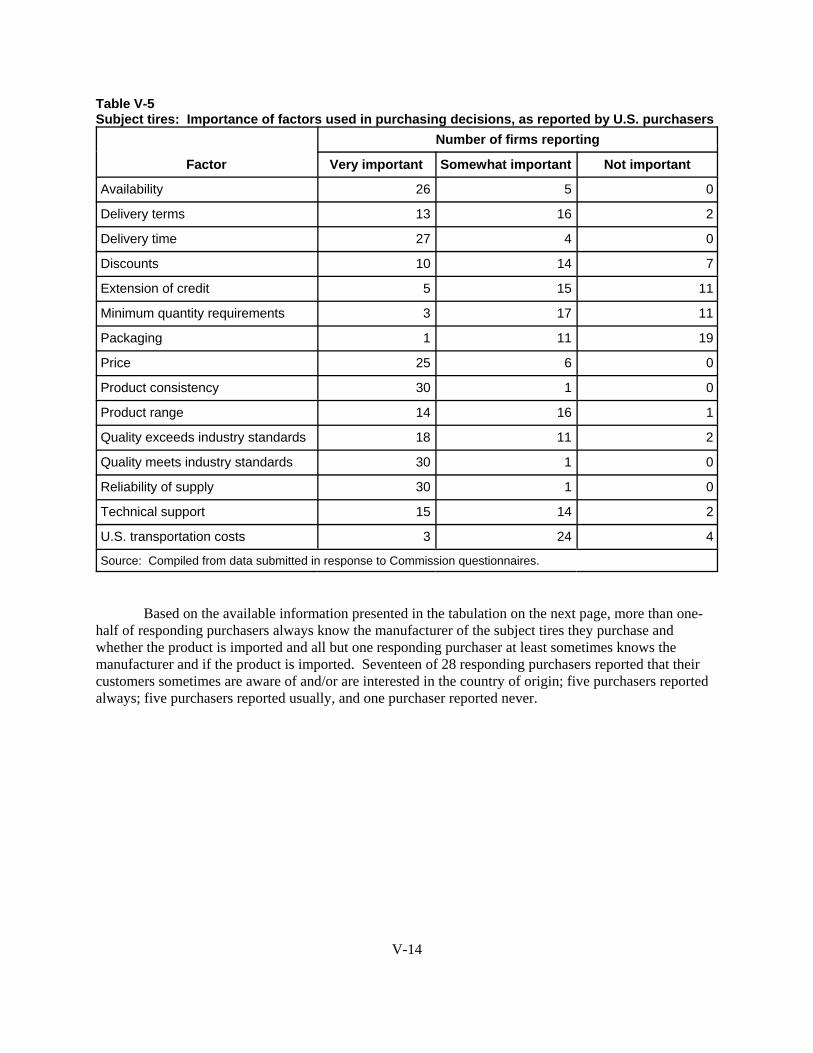
V-14
Table V-5Subject tires: Importance of factors used in purchasing decisions, as reported by U.S. purchasers
Factor
Number of firms reporting
Very important Somewhat important Not important
Availability 26 5 0
Delivery terms 13 16 2
Delivery time 27 4 0
Discounts 10 14 7
Extension of credit 5 15 11
Minimum quantity requirements 3 17 11
Packaging 1 11 19
Price 25 6 0
Product consistency 30 1 0
Product range 14 16 1
Quality exceeds industry standards 18 11 2
Quality meets industry standards 30 1 0
Reliability of supply 30 1 0
Technical support 15 14 2
U.S. transportation costs 3 24 4
Source: Compiled from data submitted in response to Commission questionnaires.
Based on the available information presented in the tabulation on the next page, more than one-half of responding purchasers always know the manufacturer of the subject tires they purchase andwhether the product is imported and all but one responding purchaser at least sometimes knows themanufacturer and if the product is imported. Seventeen of 28 responding purchasers reported that theircustomers sometimes are aware of and/or are interested in the country of origin; five purchasers reportedalways; five purchasers reported usually, and one purchaser reported never.
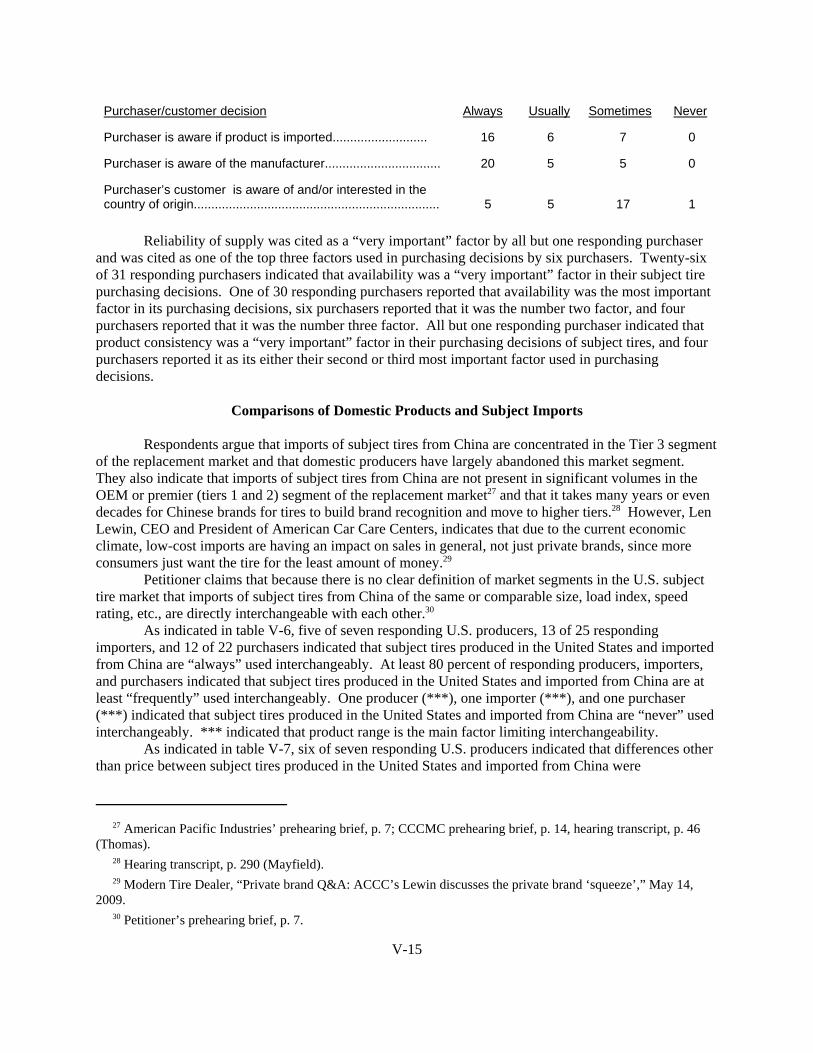
27 American Pacific Industries’ prehearing brief, p. 7; CCCMC prehearing brief, p. 14, hearing transcript, p. 46(Thomas). 28 Hearing transcript, p. 290 (Mayfield). 29 Modern Tire Dealer, “Private brand Q&A: ACCC’s Lewin discusses the private brand ‘squeeze’,” May 14,2009. 30 Petitioner’s prehearing brief, p. 7.
V-15
Purchaser/customer decision Always Usually Sometimes Never
Purchaser is aware if product is imported........................... 16 6 7 0
Purchaser is aware of the manufacturer................................. 20 5 5 0
Purchaser’s customer is aware of and/or interested in thecountry of origin...................................................................... 5 5 17 1
Reliability of supply was cited as a “very important” factor by all but one responding purchaserand was cited as one of the top three factors used in purchasing decisions by six purchasers. Twenty-sixof 31 responding purchasers indicated that availability was a “very important” factor in their subject tirepurchasing decisions. One of 30 responding purchasers reported that availability was the most importantfactor in its purchasing decisions, six purchasers reported that it was the number two factor, and fourpurchasers reported that it was the number three factor. All but one responding purchaser indicated thatproduct consistency was a “very important” factor in their purchasing decisions of subject tires, and fourpurchasers reported it as its either their second or third most important factor used in purchasingdecisions.
Comparisons of Domestic Products and Subject Imports
Respondents argue that imports of subject tires from China are concentrated in the Tier 3 segmentof the replacement market and that domestic producers have largely abandoned this market segment. They also indicate that imports of subject tires from China are not present in significant volumes in theOEM or premier (tiers 1 and 2) segment of the replacement market27 and that it takes many years or evendecades for Chinese brands for tires to build brand recognition and move to higher tiers.28 However, LenLewin, CEO and President of American Car Care Centers, indicates that due to the current economicclimate, low-cost imports are having an impact on sales in general, not just private brands, since moreconsumers just want the tire for the least amount of money.29
Petitioner claims that because there is no clear definition of market segments in the U.S. subjecttire market that imports of subject tires from China of the same or comparable size, load index, speedrating, etc., are directly interchangeable with each other.30
As indicated in table V-6, five of seven responding U.S. producers, 13 of 25 respondingimporters, and 12 of 22 purchasers indicated that subject tires produced in the United States and importedfrom China are “always” used interchangeably. At least 80 percent of responding producers, importers,and purchasers indicated that subject tires produced in the United States and imported from China are atleast “frequently” used interchangeably. One producer (***), one importer (***), and one purchaser(***) indicated that subject tires produced in the United States and imported from China are “never” usedinterchangeably. *** indicated that product range is the main factor limiting interchangeability.
As indicated in table V-7, six of seven responding U.S. producers indicated that differences otherthan price between subject tires produced in the United States and imported from China were

V-16
Table V-6Subject tires: Perceived degree of interchangeability of product produced in the United States andin other countries1
Country comparison
Number of U.S.producersreporting
Number of U.S.importersreporting
Number of U.S.purchasersreporting
A F S N A F S N A F S N
U.S. vs. China 5 1 0 1 13 8 3 1 12 6 3 1
U.S. vs. other countries 6 2 0 1 13 6 3 1 11 6 6 1
China vs. other countries 4 1 0 1 13 6 3 0 11 3 3 1
1 Producers, importers, and purchasers were asked if subject tires produced in the United States and in othercountries are used interchangeably.
Note.--“A” = Always, “F” = Frequently, “S” = Sometimes, “N” = Never.
Source: Compiled from data submitted in response to Commission questionnaires.
Table V-7Subject tires: Differences other than price between products from different sources1
Country comparisonNumber of U.S. producers
reportingNumber of U.S. importers
reporting
A F S N A F S N
U.S. vs. China 1 0 6 0 8 8 6 2
U.S. vs. other countries 1 1 6 1 7 6 4 5
China vs. other countries 1 0 4 0 7 6 5 2 1 Producers and importers were asked if differences other than price between subject tires produced in theUnited States and in other countries are a significant factor in their firms’ sales of subject tires.
Note.--“A” = Always, “F” = Frequently, “S” = Sometimes, “N” = Never.
Source: Compiled from data submitted in response to Commission questionnaires.
“sometimes” a significant factor in their sales of the products. All but two responding importers indicatedthat differences other than price between subject tires produced in the United States and imported fromChina were at least “sometimes” a significant factor in their firm’s sales of the products.
As indicated in table V-8, the U.S. product was ranked comparable with imports of subject tiresfrom China by at least half of responding purchasers for delivery terms, discounts offered, extension ofcredit, lower transport costs, minimum quantity requirements, packaging, product consistency, bothquality exceeding and meeting industry standards, and reliability of supply. The U.S. product was rankedsuperior to imports of subject tires from China by at least half of responding purchasers for availability,delivery time, minimum quantity required, product range, reliability of supply, and technical support. The U.S. product was ranked inferior to imports of subject tires from China by three-quarters ofresponding purchasers for lower price.

V-17
Table V-8Subject tires: Purchasers’ comparisons of domestic and subject products
FactorU.S. vs. China
S C I
Availability 7 6 1
Delivery terms 6 8 0
Delivery time 11 3 0
Discounts offered 0 12 2
Extension of credit 6 8 0
Lower price1 0 4 10
Lower transport costs 3 11 0
Minimum quantity requirements 7 7 0
Packaging 2 12 0
Product consistency 4 10 0
Product range 8 5 1
Quality exceeds industry standards 2 12 0
Quality meets industry standards 0 13 1
Reliability of supply 7 7 0
Technical support 9 5 0
1 A rating of “S” indicates that the U.S. product generally has a lower price while a rating of “I” indicates that theChinese product generally has a lower price.
Note.–S = domestic product superior, C = domestic product comparable, I = domestic product inferior.
Source: Compiled from data submitted in response to Commission questionnaires.
Comparisons of Domestic Products and Nonsubject Imports
As indicated in table V-6, six of nine responding U.S. producers, 13 of 23 responding importers,and 11 of 24 purchasers indicated that subject tires produced in the United States and imported fromnonsubject countries are “always” used interchangeably. At least 70 percent of responding producers,importers, and purchasers indicated that subject tires produced in the United States and imported fromnonsubject countries are at least “frequently” used interchangeably.
As indicated in table V-7, six of nine responding U.S. producers indicated that differences otherthan price between subject tires produced in the United States and imported from nonsubject countrieswere “sometimes” a significant factor in their sales of the products. Seventeen of 22 respondingimporters indicated that differences other than price between subject tires produced in the United Statesand imported from nonsubject countries were at least “sometimes” a significant factor in their firm’s salesof the products.

31 Prehearing report, p. V-17 and hearing transcript, p. 385 (Okun). 32 A supply function is not defined in the case of a non-competitive market. 33 Petitioner’s prehearing brief, p. 53. 34 Ibid., pp. 52-53. 35 CCCMC respondents’ posthearing brief, exh. 1, p. 14.
V-18
Comparisons of Imports from China and Nonsubject Imports
As indicated in table V-6, four of six responding U.S. producers, 13 of 22 responding importersand 11 of 18 purchasers indicated that subject tires imported from China and from nonsubject countriesare “always” used interchangeably. At least 75 percent of responding producers, importers, andpurchasers indicated that subject tires imported from China and from nonsubject countries are at least“frequently” used interchangeably.
As indicated in table V-7, four of five responding U.S. producers indicated that differences otherthan price between subject tires imported from China and from nonsubject countries were “sometimes” asignificant factor in their sales of the products. All but two responding importers indicated thatdifferences other than price between subject tires imported from China and from nonsubject countrieswere at least “sometimes” a significant factor in their firm’s sales of the products.
Elasticity Estimates
This section discusses elasticity estimates; parties were encouraged to comment on theseestimates in their prehearing and posthearing briefs.31
U.S. Supply Elasticity32
The domestic supply elasticity for subject tires measures the sensitivity of the quantity suppliedby U.S. producers to changes in the U.S. market price of subject tires. The elasticity of domestic supplydepends on several factors including the level of excess capacity, the ease with which producers can altercapacity, producers’ ability to shift to production of other products, the existence of inventories, and theavailability of alternate markets for U.S.-produced subject tires.
Petitioner estimates the domestic supply elasticity to be in the range of 5 to 7.33 It indicates thatalthough U.S. producers report moderately high levels of capacity utilization, *** and that three of theU.S. plants scheduled for closure in 2009 could be kept open to provide additional capacity.34 CCCMCrespondents indicate that the domestic supply elasticity “with respect to subject imports” should be nearzero since an adoption of protection will not cause an increase in domestic production of Tier 3 tires.35 No other parties commented on the domestic supply elasticity.
While the industry may be able to *** and keeping plants scheduled to be closed open, it is morelikely that it would take more than just a temporary change in price for this to occur. Also, the attenuatedcompetition claimed by CCCMC respondents would not affect the supply response of domestic industryto price changes since it is a supply elasticity for all subject tires produced by U.S. producers. Based onthe available information and party comments, the U.S. industry is likely to be able to somewhat increaseor decrease shipments to the U.S. market; an estimate in the range of 2 to 4 is still suggested.
36 Ibid., p. 53. 37 Ibid. 38 Petitioner’s posthearing brief, exh. 42, p. 21. 39 CCCMC respondents’ prehearing brief, p. 21.
V-19
Chinese Supply Elasticity
The elasticity of Chinese supply depends on several factors including the level of excess capacity,the ease with which producers can alter capacity, producers’ ability to shift to production of otherproducts, the existence of inventories, and the availability of alternate markets for Chinese-producedsubject tires. Petitioner estimates the elasticity of Chinese supply to be in the range of 5 to 10.36 Itindicates that the Chinese producers have demonstrated their ability to increase shipments rapidly to theU.S. market by the increasing of both imports to the United States and production capacity between 2004and 2008, as well as the level of Chinese producers’ shipments to other markets and the U.S. market in2008.37 No other parties commented on the Chinese supply elasticity.
While both imports into the United States and Chinese production capacity have increasedrecently, it is less likely that these changes can be sustained over time. Based on the availableinformation and party comments, the Chinese industry is likely to be able to somewhat increase ordecrease shipments to the U.S. market; an estimate in the range of 2 to 4 is still suggested.
Nonsubject-Country Supply Elasticity
The elasticity of nonsubject supply depends on several factors including the level of excesscapacity, the ease with which producers can alter capacity, producers’ ability to shift to production ofother products, the existence of inventories, and the availability of alternate markets for subject tiresproduced in nonsubject countries.38 Petitioner assumes a nonsubject supply elasticity of 0.1. Petitionerindicates that nonsubject suppliers have maintained a relatively stable market share in the U.S. market byadjusting their shipment volumes to changes in consumption and assumes that nonsubject suppliers wouldcontinue to do this in the future. No other parties commented on the nonsubject supply elasticity.
While the U.S. market share of nonsubject imports has been stable since 2004, this elasticitymeasures the responsiveness of volumes of shipments, not market shares to changes in price. The factthat the volume of nonsubject imports has adjusted to market conditions indicates that nonsubject importswill respond to changes in price. Analysis of these factors earlier and comments by parties indicate thatthe industries in nonsubject countries are likely to be able to somewhat increase or decrease shipments tothe U.S. market; an estimate in the range of 2 to 4 is suggested.
U.S. Demand Elasticity
The U.S. demand elasticity for subject tires measures the sensitivity of the overall quantitydemanded to a change in the U.S. market price of subject tires. This estimate depends on factorsdiscussed earlier such as the existence, availability, and commercial viability of substitute products, aswell as the component share of the subject tires in the production of any downstream products. CCCMCrespondents indicate that the demand elasticity provided in the prehearing staff report should be revisedupward, although they do not indicate how much higher the demand elasticity should be.39 They indicatethat the real substitute for subject tires is deferring the purchase of new tires and that the low cost share of

40 Ibid. 41 For vehicle components which make up a larger share of the final cost of their vehicle (such as an engine),consumers will often chose to replace their vehicles rather than replace or repair the component. 42 The substitution elasticity measures the responsiveness of the relative U.S. consumption levels of the subjectimports and the domestic like products to changes in their relative prices. This reflects how easily purchasers switchfrom the U.S. product to the subject products (or vice versa) when prices change. 43 CCCMC respondents’ prehearing brief, pp. 28-29, fn. 95 and CCCMC respondents’ posthearing brief, exh. 1,p. 15. 44 However, petitioner justifies using a substitution of elasticity of 7 in its remedy analysis because it is analyzingsubgroups that have a smaller range of differentiated products. Petitioner’s posthearing brief, exh. 43, pp. 2-21. 45 Modern Tire Dealer, “Private brand Q&A: ACCC’s Lewin discusses the private brand ‘squeeze’,” May 14,2009. 46 Ibid.
V-20
subject tires in the total cost of passenger vehicles and light trucks has a minor effect on demand sinceover 80 percent of sales of subject tires are to the replacement market.40
Although not explicitly identified as a substitute product, the fact that some consumers may try toget more miles out of subject tires as prices for tires increase was accounted for in the estimate of theaggregate demand elasticity for the prehearing staff report. The low cost share of subject tires in the totalcost of passenger vehicles and light trucks is important in the replacement market since it essentiallyensures that all consumers will choose to replace their tires rather than replace their vehicles.41 Based onthe available information and party comments, the aggregate demand for subject is still likely to beinelastic; a range of -0.25 to -0.50 is suggested.
Substitution Elasticity
The elasticity of substitution depends upon the extent of product differentiation between thedomestic and imported products.42 Product differentiation, in turn, depends upon such factors as quality(e.g., chemistry, appearance, etc.) and conditions of sale (availability, sales terms/discounts/promotions,etc.). CCCMC respondents indicate that the demand elasticity provided in the prehearing staff reportshould be revised downward, and suggest a substitution elasticity range of 0.5 to 2.0.43 They claim thatthe estimate in the prehearing report failed to address the effect of market segmentation from tire brandtiering and that retail consumers do not base their purchases on actual quality as much as they do on theirperception of quality of the brand. No other parties commented on the substitution elasticity.44
Responses to the purchaser questionnaire indicate that quality is a very important factor foralmost all purchasers, irregardless of whether retail purchasers explicitly take quality into account. American Car Care Centers CEO and president Len Lewin believes that the vast majority of sales arecontrolled by the salesperson at the counter, not the consumer.45 Mr. Lewin also indicates that due to thecurrent economic climate, low-cost imports are having an “impact” on sales in general, not just privatebrands, since more consumers just want the tire for the least amount of money.46 Based on availableinformation and party comments, the elasticity of substitution between U.S.-produced subject tires andimported subject tires is still likely to be in the range of 4 to 6.

47 http://www.rma.org/scrap_tires/scrap_tire_markets/scrap_tire_characteristics/, retrieved on May 18, 2009. 48 In addition, one producer (***) and two importers (***) reported transportation costs of 100 percent.
V-21
Factors Affecting PricingRaw Material Costs
Raw material costs accounted for approximately 50.5 percent of the total cost of goods sold forU.S. producers during 2004 to 2008. Natural rubber and synthetic rubber are the primary components ofraw material costs. According to the RMA, a typical passenger car tire is made up of almost twice asmuch synthetic rubber as compared to natural rubber, while a typical truck tire is made up of almost twiceas much natural rubber as synthetic rubber.47 The quarterly average prices of natural rubber and syntheticrubber increased by 29 percent and 114 percent, respectively, between the first quarter of 2004 and thefourth quarter of 2008 (see figure V-5). Also, the quarterly average prices of natural rubber and syntheticrubber decreased by 17 percent and 28 percent, respectively, between the fourth quarter of 2008 and thefirst quarter of 2009. In some instances the price of synthetic rubber was higher relative to the price ofnatural rubber and in other instances it had a lower relative price.
Transportation Costs to the U.S. Market
Transportation costs for subject tires from China to the United States (excluding U.S. inlandcosts) are estimated to be approximately 11 percent of the total cost for subject tires. These estimates arederived from official import data and represent the transportation and other charges on imports valued ona c.i.f. basis, as compared with customs value.
U.S. Inland Transportation Costs
Transportation costs for U.S. inland shipments of subject tires generally account for a small-to-moderate share of the delivered price of these products. U.S. producers reported that the costs rangedfrom 3.5 to 15.0 percent of the delivered price for subject tires, while U.S. importers that reported thecosts ranged from less than one to 28 percent of the delivered price for subject tires.48
Exchange Rates
Quarterly data reported by the International Monetary Fund indicate that the nominal value of theChinese currency appreciated by 21.1 percent relative to the U.S. dollar from January-March 2004 toJanuary-March 2009 (figure V-6).
Pricing PracticesPricing Methods
Most producers and importers reported that the prices that they charge for their sales of subjecttires are determined using price lists, although a few reported using transaction-by-transactionnegotiations. Over one-half of reporting producers and importers reported making all of their sales ofsubject tires on some type of delivered basis. The remaining responding producers and importers maketheir sales on only an f.o.b. basis or both f.o.b. and delivered bases. Eight of nine producers and 17 of 30importers reported that at least 70 percent of their sales of subject tires were from inventory. Twelve of30 responding importers reported that at least 80 percent of their sales are made to order.

V-22
Figure V-5Rubber prices: Natural rubber (TSR 20) and synthetic rubber (U.S. unit export values for SBR), byquarters, January 2004 to March 2009
Source: International Rubber Study Group.
Figure V-6Exchange rates: Index of the nominal exchange rate between the Chinese currency and the U.S.dollar, by quarters, January 2004-March 2009
Source: International Monetary Fund, International Financial Statistics, May 11, 2009.

49 In addition, one producer and importer *** reported that it had a ***-day lead time from inventory for its directoverseas deliveries.
V-23
Six of eight responding producers and 14 of 22 responding importers reported making at least 80percent of their sales on a spot market basis. One producer (***) and four of 19 responding importersreported making at least 75 percent of their sales on a short-term contract basis, with contracts lastingfrom two months to one year. Five importers reported making at least 76 percent of their sales on a long-term contract basis.
Lead Times
U.S. producers reported lead times from inventory ranging from two days to 30 days and leadtimes for sales to order of up to six months.49 Lead times for delivery for all but one responding U.S.importer ranged from one day to 14 days on sales from inventory and up to six months on sales producedto order. All responding producers and importers reported that they generally arrange for thetransportation to their customers’ locations. All seven responding U.S. producers and 13 of 27 importersreported making between 50 percent and 89 percent of their sales within 101 to 1,000 miles of theirstorage or production facilities. Eight of 27 responding importers reported making at least 70 percent oftheir sales over 1,000 miles from their storage or production facilities. All responding producers and allbut three responding importers reported that they sell subject tires nationally. Importers *** and ***reported selling only to the Midwest, Southeast, and Southeast regions and importer *** reported sellingto all regions except the Northwest.
Sales Terms and Discounts
Five of six responding producers and 21 of 29 responding importers indicated that they havediscount policies for their sales of subject tires. Many of these producers and importers reported the useof quantity discounts and annual volume discounts.
Price Data
The Commission requested U.S. producers and importers of subject tires to provide quarterlydata, f.o.b. U.S. point of shipment, for the total quantity and value of subject tires shipped to unrelatedOEM and replacement customers in the U.S. market. Data were requested for the period January 2004-December 2008. The products for which pricing data were requested are as follows:
Product 1.--Subject tires, tire size P225/60R16, 97-98 load index, speed ratings S or T, all-season grand touring/standard touring/passenger
Product 2.--Subject tires, tire size P235/75R15, 105-108 load index, speed ratings S or T, all-season grand touring/standard touring/passenger
Product 3.--Subject tires, tire size P205/65R15, 92-94 load index, speed ratings S, T, or H,all-season grand touring/standard touring/passenger
Product 4.--Subject tires, tire size P215/70R15, 97-98 load index, speed ratings S or T, all-season grand touring/standard touring/passenger

50 Hearing transcript, p. 304 (Berra).
V-24
Product 5.--Subject tires, tire size LT245/75R16, 111-116 load index, speed ratings R or S,on/off-road all terrain
Product 6.--Subject tires, tire size LT265/75R16, 112-116 load index, speed ratings R, S, orT, on/off-road all terrain
Six U.S. producers and 26 importers provided usable pricing data for sales of the requestedproducts, although not all firms reported pricing for all products for all quarters. All of these firmsprovided data for sales to the replacement market and three of the six U.S. producers also reported datafor sales to OEMs; no sales of subject Chinese tires to the OEM market were reported. Pricing datareported by these firms accounted for approximately 14 percent of U.S. producers’ shipments of subjecttires and 36 percent of U.S. shipments of subject imports from China in 2008.
Price Trends
Weighted-average prices of subject tires are presented in tables V-9 through V-15 and figure V-7. Weighted-average sales prices for U.S.-produced tires sold to the replacement market increased by 27.2percent to 43.6 percent, while weighted-average sales prices for products imported from China and sold tothe replacement market increased by 5.0 percent to 22.7 percent (table V-16). Weighted-average salesprices for U.S.-produced products sold to the OEM market increased for all but one product for the periodfor which price data were available.50

V-25
Table V-9Subject tires: Weighted-average f.o.b. prices and quantities of domestic and imported product 11
and margins of underselling/(overselling) for sales to the replacement market, by quarters, January2004-December 2008
Period
United States China
Price(per tire)
Quantity(1,000 tires)
Price(per tire)
Quantity(1,000 tires)
Margin(percent)
2004: Jan.-Mar. $48.31 1,118 $*** *** ***
Apr.-June 49.09 1,182 *** *** ***
July-Sept. 50.12 1,397 43.54 74 13.1
Oct.-Dec. 50.22 1,525 44.35 77 11.7
2005: Jan.-Mar. 49.80 1,407 45.03 88 9.6
Apr.-June 50.03 1,334 44.38 93 11.3
July-Sept. 52.88 1,440 43.71 89 17.4
Oct.-Dec. 52.59 1,472 44.47 97 15.4
2006: Jan.-Mar. 52.83 1,382 44.00 122 16.7
Apr.-June 52.09 1,306 45.24 111 13.1
July-Sept. 54.39 1,366 43.43 140 20.2
Oct.-Dec. 54.79 1,397 44.80 163 18.2
2007: Jan.-Mar. 57.41 1,318 42.53 315 25.9
Apr.-June 57.27 1,370 41.48 344 27.6
July-Sept. 57.52 1,361 41.40 297 28.0
Oct.-Dec. 59.70 1,395 42.63 401 28.6
2008: Jan.-Mar. 59.70 1,186 46.09 450 22.8
Apr.-June 60.54 1,276 45.53 672 24.8
July-Sept. 63.06 1,234 45.70 1,148 27.5
Oct.-Dec. 64.74 1,077 46.31 855 28.5
1 Subject tires, tire size P225/60R16, 97-98 load index, speed ratings S or T, all-season grand touring/standardtouring/passenger.
Source: Compiled from data submitted in response to Commission questionnaires.

V-26
Table V-10Subject tires: Weighted-average f.o.b. prices and quantities of domestic and imported product 21
and margins of underselling/(overselling) for sales to the replacement market, by quarters, January2004-December 2008
Period
United States China
Price(per tire)
Quantity(1,000 tires)
Price(per tire)
Quantity(1,000 tires)
Margin(percent)
2004: Jan.-Mar. $40.77 1,549 $43.95 66 (7.8)
Apr.-June 39.85 1,569 39.70 73 0.4
July-Sept. 40.85 1,805 39.27 71 3.9
Oct.-Dec. 41.83 1,596 39.10 86 6.5
2005: Jan.-Mar. 41.00 1,461 36.18 125 11.7
Apr.-June 41.61 1,358 34.60 108 16.8
July-Sept. 41.29 1,420 39.58 118 4.2
Oct.-Dec. 43.52 1,341 37.42 133 14.0
2006: Jan.-Mar. 43.02 1,090 37.62 172 12.6
Apr.-June 44.20 1,070 36.70 188 17.0
July-Sept. 45.23 1,128 38.89 184 14.0
Oct.-Dec. 49.71 1,070 37.50 278 24.6
2007: Jan.-Mar. 48.71 910 38.54 261 20.9
Apr.-June 48.15 930 39.15 374 18.7
July-Sept. 49.48 978 42.08 356 15.0
Oct.-Dec. 51.12 831 43.21 382 15.5
2008: Jan.-Mar. 51.90 720 42.89 399 17.4
Apr.-June 53.03 669 43.67 405 17.7
July-Sept. 54.90 575 46.77 446 14.8
Oct.-Dec. 57.20 454 46.16 1,299 19.3
1 Subject tires, tire size P235/75R15, 105-108 load index, speed ratings S or T, all-season grand touring/standardtouring/passenger.
Source: Compiled from data submitted in response to Commission questionnaires.
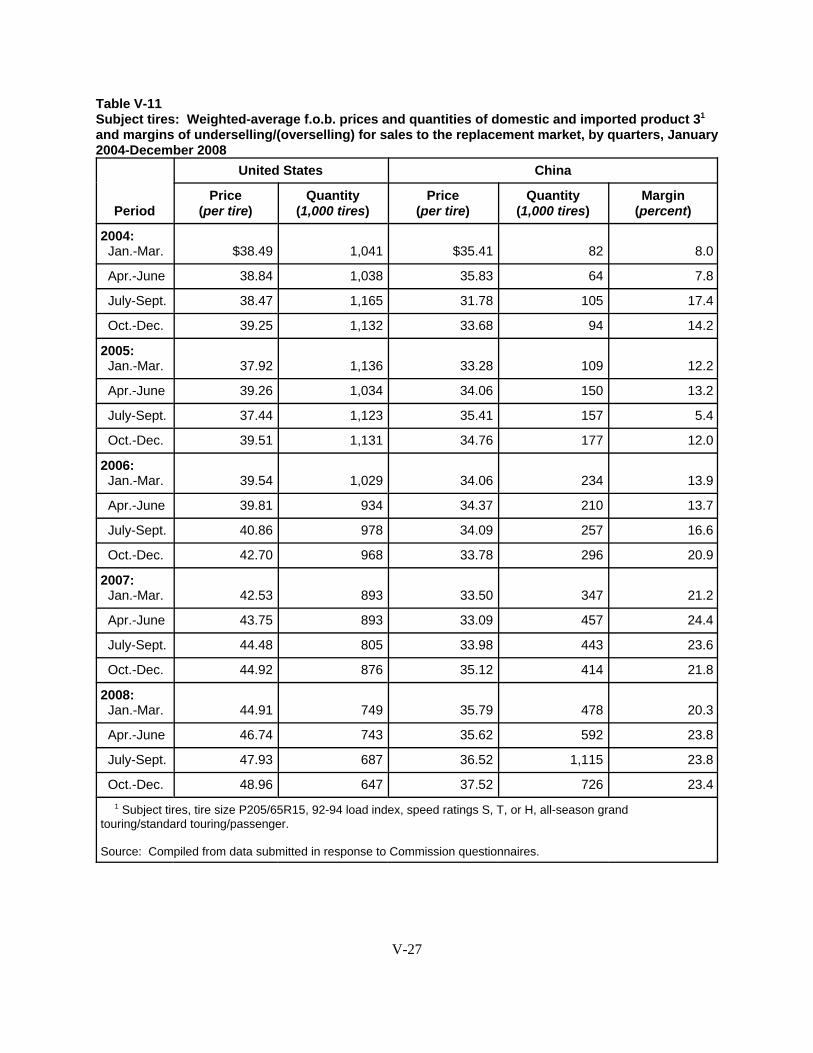
V-27
Table V-11Subject tires: Weighted-average f.o.b. prices and quantities of domestic and imported product 31
and margins of underselling/(overselling) for sales to the replacement market, by quarters, January2004-December 2008
Period
United States China
Price(per tire)
Quantity(1,000 tires)
Price(per tire)
Quantity(1,000 tires)
Margin(percent)
2004: Jan.-Mar. $38.49 1,041 $35.41 82 8.0
Apr.-June 38.84 1,038 35.83 64 7.8
July-Sept. 38.47 1,165 31.78 105 17.4
Oct.-Dec. 39.25 1,132 33.68 94 14.2
2005: Jan.-Mar. 37.92 1,136 33.28 109 12.2
Apr.-June 39.26 1,034 34.06 150 13.2
July-Sept. 37.44 1,123 35.41 157 5.4
Oct.-Dec. 39.51 1,131 34.76 177 12.0
2006: Jan.-Mar. 39.54 1,029 34.06 234 13.9
Apr.-June 39.81 934 34.37 210 13.7
July-Sept. 40.86 978 34.09 257 16.6
Oct.-Dec. 42.70 968 33.78 296 20.9
2007: Jan.-Mar. 42.53 893 33.50 347 21.2
Apr.-June 43.75 893 33.09 457 24.4
July-Sept. 44.48 805 33.98 443 23.6
Oct.-Dec. 44.92 876 35.12 414 21.8
2008: Jan.-Mar. 44.91 749 35.79 478 20.3
Apr.-June 46.74 743 35.62 592 23.8
July-Sept. 47.93 687 36.52 1,115 23.8
Oct.-Dec. 48.96 647 37.52 726 23.4
1 Subject tires, tire size P205/65R15, 92-94 load index, speed ratings S, T, or H, all-season grandtouring/standard touring/passenger.
Source: Compiled from data submitted in response to Commission questionnaires.

V-28
Table V-12Subject tires: Weighted-average f.o.b. prices and quantities of domestic and imported product 41
and margins of underselling/(overselling) for sales to the replacement market, by quarters, January2004-December 2008
Period
United States China
Price(per tire)
Quantity(1,000 tires)
Price(per tire)
Quantity(1,000 tires)
Margin(percent)
2004: Jan.-Mar. $36.97 1,136 $*** *** ***
Apr.-June 36.82 1,197 *** *** ***
July-Sept. 37.78 1,357 *** *** ***
Oct.-Dec. 38.13 1,321 *** *** ***
2005: Jan.-Mar. 38.67 978 29.48 63 23.8
Apr.-June 39.06 909 29.90 72 23.4
July-Sept. 40.29 1,089 31.31 71 22.3
Oct.-Dec. 40.47 1,179 32.02 88 20.9
2006: Jan.-Mar. 40.12 1,020 32.26 123 19.6
Apr.-June 40.37 942 33.44 122 17.2
July-Sept. 41.86 1,075 32.96 131 21.3
Oct.-Dec. 43.46 927 31.74 194 27.0
2007: Jan.-Mar. 43.60 880 33.86 255 22.3
Apr.-June 43.92 1,015 33.11 258 24.6
July-Sept. 45.20 931 35.48 259 21.5
Oct.-Dec. 46.62 956 36.55 302 21.6
2008: Jan.-Mar. 47.57 770 37.35 383 21.5
Apr.-June 48.30 800 38.24 522 20.8
July-Sept. 50.15 808 39.79 853 20.7
Oct.-Dec. 53.08 648 *** *** ***
1 Subject tires, tire size P215/70R15, 97-98 load index, speed ratings S or T, all-season grand touring/standardtouring/passenger.
Source: Compiled from data submitted in response to Commission questionnaires.

V-29
Table V-13Subject tires: Weighted-average f.o.b. prices and quantities of domestic and imported product 51
and margins of underselling/(overselling) for sales to the replacement market, by quarters, January2004-December 2008
Period
United States China
Price(per tire)
Quantity(1,000 tires)
Price(per tire)
Quantity(1,000 tires)
Margin(percent)
2004: Jan.-Mar. $72.73 633 $59.09 32 18.7
Apr.-June 72.97 634 60.87 30 16.6
July-Sept. 73.71 763 61.51 41 16.5
Oct.-Dec. 74.03 780 63.16 34 14.7
2005: Jan.-Mar. 73.30 699 57.58 59 21.4
Apr.-June 74.60 644 58.47 43 21.6
July-Sept. 80.74 770 63.09 53 21.9
Oct.-Dec. 78.45 755 60.14 58 23.3
2006: Jan.-Mar. 78.69 651 57.24 99 27.3
Apr.-June 79.59 614 58.21 84 26.9
July-Sept. 80.63 770 60.60 87 24.8
Oct.-Dec. 76.96 727 *** *** ***
2007: Jan.-Mar. 83.64 620 58.15 293 30.5
Apr.-June 84.79 641 *** *** ***
July-Sept. 85.88 713 *** *** ***
Oct.-Dec. 87.96 829 *** *** ***
2008: Jan.-Mar. 88.12 604 *** *** ***
Apr.-June 89.70 673 *** *** ***
July-Sept. 92.57 692 *** *** ***
Oct.-Dec. 94.29 690 *** *** ***
1 Subject tires, tire size LT245/75R16, 111-116 load index, speed ratings R or S, on/off-road all terrain.
Source: Compiled from data submitted in response to Commission questionnaires.

V-30
Table V-14Subject tires: Weighted-average f.o.b. prices and quantities of domestic and imported product 61
and margins of underselling/(overselling) for sales to the replacement market, by quarters, January2004-December 2008
Period
United States China
Price(per tire)
Quantity(1,000 tires)
Price(per tire)
Quantity(1,000 tires)
Margin(percent)
2004: Jan.-Mar. $72.89 655 $69.95 65 4.0
Apr.-June 74.23 695 71.50 54 3.7
July-Sept. 76.39 811 70.59 70 7.6
Oct.-Dec. 77.00 898 70.31 67 8.7
2005: Jan.-Mar. 77.26 775 69.29 85 10.3
Apr.-June 78.62 659 73.90 61 6.0
July-Sept. 83.89 799 77.59 66 7.5
Oct.-Dec. 83.69 820 76.40 72 8.7
2006: Jan.-Mar. 82.67 707 74.08 80 10.4
Apr.-June 84.98 653 76.39 72 10.1
July-Sept. 86.22 785 73.61 101 14.6
Oct.-Dec. 84.00 811 *** *** ***
2007: Jan.-Mar. 88.06 700 66.04 342 25.0
Apr.-June 89.86 703 65.80 445 26.8
July-Sept. 91.13 749 68.03 307 25.3
Oct.-Dec. 94.11 820 *** *** ***
2008: Jan.-Mar. 91.88 639 *** *** ***
Apr.-June 95.62 667 *** *** ***
July-Sept. 98.82 629 75.40 249 23.7
Oct.-Dec. 103.64 607 79.41 165 23.4
1 Subject tires, tire size LT265/75R16, 112-116 load index, speed ratings R, S, or T, on/off-road all terrain.
Source: Compiled from data submitted in response to Commission questionnaires.

V-31
Table V-15Subject tires: Weighted-average f.o.b. prices and quantities of domestic products 1, 3, 4, 5, and 6sold to OEMs, by quarters, January 2004-December 2008
Period
Product 1 Product 3 Product 4
Price(per tire)
Quantity(1,000 tires)
Price(per tire)
Quantity(1,000 tires)
Price(per tire)
Quantity(1,000 tires)
2004: Jan.-Mar. $31.56 65 $29.91 790 $*** ***
Apr.-June 31.97 43 29.84 840 *** ***
July-Sept. *** *** 29.82 665 *** ***
Oct.-Dec. *** *** 29.72 646 *** ***
2005: Jan.-Mar. *** *** 29.87 823 *** ***
Apr.-June *** *** 29.75 678 *** ***
July-Sept. *** *** 30.55 401 *** ***
Oct.-Dec. *** *** 30.74 418 *** ***
2006: Jan.-Mar. *** *** 30.23 268 *** ***
Apr.-June *** *** *** *** *** ***
July-Sept. *** *** *** *** *** ***
Oct.-Dec. *** *** *** *** *** ***
2007: Jan.-Mar. *** *** *** *** *** ***
Apr.-June *** *** *** *** *** ***
July-Sept. *** *** *** *** *** ***
Oct.-Dec. *** *** - - *** ***
2008: Jan.-Mar. *** *** - - *** ***
Apr.-June *** *** - - *** ***
July-Sept. *** *** - - *** ***
Oct.-Dec. - - - - *** ***
1 Less than 1,000 tires.
Table continued on the following page.

V-32
Table V-15–ContinuedSubject tires: Weighted-average f.o.b. prices and quantities of domestic products 1, 3, 4, 5, and 6sold to OEMs, by quarters, January 2004-December 2008
* * * * * * *Figure V-7Subject tires: Weighted-average f.o.b. prices of products 1-6 sold to the replacement market,2004-08
Product 1
* * * * * * *
Figure continued on the following page.

V-33
Figure V-7--ContinuedSubject tires: Weighted-average f.o.b. prices of products 1-6 sold to the replacement market,2004-08
Product 4
* * * * * * *
Product 5
* * * * * * *
Product 6
* * * * * * *
Source: Tables V-9 to V-14.

V-34
Table V-16Subject tires: Summary of weighted-average f.o.b. prices for products 1-6, by country and bymarket, 2004 to 2008
Product/countryNumber ofquarters
Lowest price(per pound)
Highest price(per pound)
Change in price:1
(percent)
Sales to replacement market
Product 1 U.S. 20 $48.31 $64.74 34.0
China 20 *** *** ***
Product 2 U.S. 20 39.85 57.20 40.3
China 20 34.60 46.77 5.0
Product 3 U.S. 20 37.44 48.96 27.2
China 20 31.78 37.52 5.9
Product 4 U.S. 20 36.82 53.08 43.6
China 20 *** *** ***
Product 5 U.S. 20 72.73 94.29 29.7
China 20 *** *** ***
Product 6 U.S. 20 72.89 103.64 42.2
China 20 *** *** 13.5
Sales to OEM market (U.S. producers only)
Product 1 19 *** *** ***
Product 3 15 *** *** ***
Product 4 20 *** *** ***
Product 5 18 *** *** ***
Product 6 6 *** *** ***
1 Percentage change from the first quarter in which price data were available to the last quarter in which pricedata were available, based on unrounded data.
Source: Compiled from data submitted in response to Commission questionnaires.

51 CCCMC respondents’ posthearing brief, p. 28. 52 Ibid. 53 Correspondence from CCCMC respondents, May 19, 2009, p. 2. 54 Ibid., p. 4. 55 GITI’s prehearing brief, p. 21. 56 Hearing transcript, p. 304 (Berra). 57 Ibid.
V-35
Price Comparisons
Overall, there were 120 instances where prices for domestic subject tires and imports from Chinaof subject tires could be compared. Of these 120 comparisons, there were 119 instances (99 percent)where the subject imported product was priced below the domestic product (table V-17). Margins ofunderselling averaged 18.9 percent, ranging from 0.4 percent to 44.9 percent. In one instance, the subjectimported product was priced above the comparable domestic product. The margin of overselling was 7.8percent. In 69 of 78 quarters, the prices of U.S. produced tires sold to the OEM market were lower thanthe prices of comparable U.S.-produced tires sold to the replacement market.
CCCMC respondents indicate that the fact that prices of subject imports were almost alwaysbelow the prices of U.S.-produced subject tires does not indicate underselling, but reflects normal pricerelationships in a tiered market.51 They indicate the persistent difference in prices and the fact that pricesof U.S.-produced products increased by more than those of subject imports between the first quarter of2004 and the fourth quarter of 2008 are both evidence of tiering of the market.52
CCCMC respondents also indicated that the pricing data have differences in product mix sincethe products for which data were requested have various speed ratings.53 They indicated that theconsequence of combining tires with different speed ratings is that the data will represent an aggregationof selling prices of tires of different levels of performance which have different price points.54 GITIrespondents also indicate that model-specific price comparisons proposed by petitioner are alsomisleading because they fail to reflect differences in speed ratings and load indices.55 However, PhilipBerra, President of Community Wholesale Tire, indicated that product 3 (which is the only passengervehicle tire price product with three speed ratings) is a commodity tire size and that there is little difference in the S, T, and H speed ratings in that particular size.56 He also indicate that the tires with anS speed rating have “pretty much gone away,” T is a standard passenger rating, a touring rating, and theH speed rating is not really a high performance rating.57
Table V-17Subject tires: Instances of underselling/overselling and the range and average of margins forproducts 1-6, January 2004 to December 2008
Country
Underselling Overselling
Number ofinstances
Range(percent)
Averagemargin
(percent)Number ofinstances
Range(percent)
Averagemargin
(percent)
China 119 0.4 to 44.9 18.9 1 7.8 7.8
Source: Compiled from data submitted in response to Commission questionnaires.

58 Petition, p. 28. 59 Ibid.
V-36
Lost Sales and Lost Revenues
The Commission requested U.S. producers of subject tires to report any instances of lost sales orrevenues they experienced due to competition from imports of subject tires from China during 2004-08. Of the 10 responding U.S. producers, three producers (***) reported that they had to either reduce pricesor roll back announced price increases to avoid losing sales to competitors selling subject tires fromChina. None of these three producers reported specific allegations of lost revenues. One of theseproducers (***) reported that it does not conduct business on a transactional basis that would allow for itto reported specific lost revenue allegations. Two of eight responding U.S. producers (***) reported thatthey lost sales of subject tires to imports of subject tires from China. One producer (***) that did notrespond to the question, reported that it cannot say with certainty that any lost sales can be directlyattributed to imports from China.
In addition, one producer (***) reported that it “took no position” with regard to having to reduceprices to avoid losing sales to competitors selling subject tires from China or having lost sales of subjecttires to imports of subject tires from China. This producer indicated that although the impact of theincrease in imports of subject tires from China is not inconsequential or unimportant, it is not possible to quantify the specific incremental impact of imports of subject tires from China on the overalldomestic industry or on its firm.
The petitioner indicated that it does not have access to information concerning specific instancesof lost sales and lost revenue since it does not represent any individual domestic producers of subjecttires.58 However the petitioner indicates that the large decline in the market share held by U.S. producersof subject tires and the concurrent large increase in imports of subject tires from China is a strongindicator that domestic companies have lost sales and revenue.59

1 Twenty-one million tires is the amount (rounded) of U.S. imports of subject tires from China in 2005. 2 Petition, p. 23. 3 Petitioner’s prehearing brief, p. 43.
VI-1
PART VI: U.S. PRODUCERS’ EFFORTS TO COMPETE AND REQUESTEDRELIEF
EFFORTS BY U.S. PRODUCERS TO COMPETE
U.S. firms were requested in the Commission’s producer questionnaire to provide information ontheir competitive efforts since January 2004 and the adjustments they would make in their subject tireoperations if import relief were granted. Their verbatim responses are presented in tables VI-1 and VI-2,respectively. Most firms reported either capital expenditures as well as cost reduction initiatives. ***reported that they did not undertake any efforts to compete more effectively during 2004-08.
Table VI-1Subject tires: Responses regarding efforts undertaken to compete since January 1, 2004, by firm
* * * * * * *
*** said they have no plans to make adjustments if import relief is granted. *** responded thatthey cannot predict what adjustments they would make.
Table VI-2Subject tires: Responses regarding adjustments to operations if import relief were provided, byfirm
* * * * * * *
REQUESTED IMPORT RELIEF
The petitioner requested that the Commission recommend to the President that he impose a quotaon imports of subject tires from China at a level of 21 million subject tires1 annually for a period of threeyears, with the quota increasing by 5 percent per annum.2 The petitioner further proposed that the quotabe administered at the 10-digit level of the HTS.3 The Commission’s producer questionnaire requestedthat in the event that the Commission should find market disruption to the U.S. industry producing subjecttires, firms were to provide information on what form of import relief they would support (ranked in orderof preference). *** did not respond to this question. The following responses were received (thecompany names are not in alphabetical order so that their answers, which are being made public, cannotbe matched to any specific company).

VI-2
****** takes no position on this matter.***No restrictions***Quota level: The USW’s petition recommends imposing a quota on the imports of subject tires fromChina. We trust the information contained in the USW petition represents a thorough and independentreview of market data related to tire imports and accordingly we support the remedy suggested in thepetition. However, we believe it is fair that the ITC consider not recommending any remedy/relief thatwould incentivize the Chinese to aggressively pursue more complex therefore higher value products --which could exacerbate market disruption.Other: *** lacks sufficient information to make a preference decision regarding other possible traderemedies.***No restrictions***Quota levelIncreased tariff rateTariff rate quota levelOrderly marketing arrangements***No restrictionsQuota levelIncreased tariff rateTariff rate quota levelOrderly marketing arrangements***Other: “Strict adherence to the Tread {Transportation Recall Enhancement, Accountability andDocumentation} Act”***Increased tariff rate: Based upon substantiated price advantageQuota level: Year 2000 levelsTariff rate quota level: As the two combined aboveOrderly marketing arrangementsOther: Total ban

A-1
APPENDIX A
FEDERAL REGISTER NOTICES


19593 Federal Register / Vol. 74, No. 81 / Wednesday, April 29, 2009 / Notices
1 The HTS subheadings are provided for convenience and customs purposes; the written description of the product under investigation is dispositive.
Filing Procedures, http://www.usitc.gov/ secretary/fed_reg_notices/rules/ documents/ handbook_on_electronic_filing.pdf). Persons with questions regarding electronic filing should contact the Secretary (202–205–2000). Any submissions that contain confidential business information must also conform to the requirements of section 201.6 of the Commission’s Rules of Practice and Procedure (19 CFR 201.6). Section 201.6 of the rules requires that the cover of the document and the individual pages be clearly marked as to whether they are the ‘‘confidential’’ or ‘‘non-confidential’’ version, and that the confidential business information is clearly identified by means of brackets. All written submissions, except for confidential business information, will be made available for inspection by interested parties.
The Commission anticipates that the reports it sends to the committees in this investigation will be made available to the public in their entirety. Consequently, the reports that the Commission sends to the committees will not contain any confidential business information. Any confidential business information received by the Commission in this investigation and used in preparing its report will not be published in a manner that would reveal the operations of the firm supplying the information.
By order of the Commission. Issued: April 23, 2009.
Marilyn R. Abbott, Secretary to the Commission. William R. Bishop, Acting Secretary to the Commission. [FR Doc. E9–9705 Filed 4–28–09; 8:45 am] BILLING CODE P
INTERNATIONAL TRADE COMMISSION
[Investigation No. TA–421–7]
Certain Passenger Vehicle and Light Truck Tires From China
AGENCY: United States International Trade Commission. ACTION: Institution and scheduling of a hearing.
SUMMARY: Following receipt of a petition filed on April 20, 2009, on behalf of the United Steel, Paper and Forestry, Rubber, Manufacturing, Energy, Allied Industrial and Service Workers International Union, the Commission instituted investigation No. TA–421–7 under section 421(b) of the Trade Act of 1974 (19 U.S.C. 2451(b)) to determine
whether new pneumatic tires, of rubber, from China, of a kind used on motor cars (except racing cars) and on-the- highway light trucks, vans, and sport utility vehicles, provided for in subheadings 4011.10.10, 4011.10.50, 4011.20.10, and 4011.20.50 of the Harmonized Tariff Schedule of the United States (HTS), are being imported into the United States in such increased quantities or under such conditions as to cause or threaten to cause market disruption to the domestic producers of like or directly competitive products.1 DATES: Not later than seven days following the publication of this notice in the Federal Register: Deadline for filing entries of appearance.
May 26, 2009: Deadline for filing request to appear at the public hearing.
May 28, 2009: Deadline for filing prehearing briefs.
June 2–3, 2009: Public hearing. June 8, 2009: Deadline for filing
posthearing briefs. June 16, 2009: Deadline for submitting
final comments on market disruption. June 19, 2009: Transmittal of
Commission determination on market disruption to the President and the U.S. Trade Representative.
June 24, 2009: Deadline for submitting final comments on remedy.
July 9, 2009: Transmittal of Commission report to the President and the U.S. Trade Representative. ADDRESSES: All Commission offices, including the Commission’s hearing rooms, are located in the United States International Trade Commission Building, 500 E Street, SW., Washington, DC. All written submissions should be addressed to the Secretary, United States International Trade Commission, 500 E Street, SW., Washington, DC 20436. The public record for this investigation may be viewed on the Commission’s electronic docket (EDIS) at http://www.usitc.gov/ secretary/edis.htm. FOR FURTHER INFORMATION CONTACT: Nathanael Comly (202–205–3174), or Amy Sherman (202–205–3289), Office of Investigations, U.S. International Trade Commission, 500 E Street, SW., Washington, DC 20436. Hearing- impaired persons can obtain information on this matter by contacting the Commission’s TDD terminal on 202– 205–1810. Persons with mobility impairments who will need special assistance in gaining access to the Commission should contact the Office of the Secretary at 202–205–2000.
General information concerning the Commission may also be obtained by accessing its Internet server (http:// www.usitc.gov).
SUPPLEMENTARY INFORMATION: Participation in the investigation and service list.—Persons wishing to participate in the investigation as parties must file an entry of appearance with the Secretary to the Commission, as provided in section 201.11 of the Commission’s rules, not later than seven days after publication of this notice in the Federal Register. The Secretary will prepare a service list containing the names and addresses of all persons, or their representatives, who are parties to this investigation upon the expiration of the period for filing entries of appearance.
Confidential business information (CBI).—Any submissions that contain confidential business information must also conform with the requirements of sections 201.6 and 206.8 of the Commission’s Rules of Practice and Procedure (19 CFR 201.6 and 206.8). Section 201.6 of the rules requires that the cover of the document and the individual pages be clearly marked as to whether they are the ‘‘confidential’’ or ‘‘non-confidential’’ version, and that the confidential business information be clearly identified by means of brackets. All written submissions, except for confidential business information and except as provided for below, will be made available for inspection by interested parties.
Limited disclosure of CBI.—Pursuant to section 206.47 of the Commission’s rules, the Secretary will make CBI gathered in this investigation available to authorized applicants under an Administrative Protective Order (APO) issued in the investigation, provided that the application is made not later than seven days after the publication of this notice in the Federal Register. A separate service list will be maintained by the Secretary for those parties authorized to receive CBI under the APO. In addition, the Commission may include CBI in the report it sends to the President and to the U.S. Trade Representative.
Hearing.—The Commission has scheduled a hearing in connection with this investigation beginning at 9:30 a.m. on June 2, 2009, at the U.S. International Trade Commission Building. Subjects related to both market disruption or threat thereof and remedy may be addressed at the hearing. Requests to appear at the hearing should be filed in writing with the Secretary on or before May 26, 2009. All persons desiring to appear at the hearing and make oral
VerDate Nov<24>2008 17:48 Apr 28, 2009 Jkt 217001 PO 00000 Frm 00109 Fmt 4703 Sfmt 4703 E:\FR\FM\29APN1.SGM 29APN1pwal
ker
on P
RO
D1P
C71
with
NO
TIC
ES
19594 Federal Register / Vol. 74, No. 81 / Wednesday, April 29, 2009 / Notices
presentations should attend a prehearing conference to be held at 9:30 a.m. on May 28, 2009 at the U.S. International Trade Commission Building. Oral testimony and written materials to be submitted at the hearing are governed by sections 201.6(b)(2) and 201.13(f) of the Commission’s rules.
Written submissions.—Each party is encouraged to submit a prehearing brief to the Commission. The deadline for filing prehearing briefs is May 28, 2009. Parties may also file posthearing briefs. The deadline for filing posthearing briefs is June 8, 2009. In addition, any person who has not entered an appearance as a party to the investigation may submit a written statement of information pertinent to the consideration of market disruption or threat thereof and/or remedy on or before June 8, 2009. Parties may submit final comments on market disruption on or before June 16, 2009 and on remedy on or before June 24, 2009. Final comments shall contain no more than ten (10) double-spaced and single-sided pages of textual material. All written submissions must conform with the provisions of section 201.8 of the Commission’s rules; any submissions that contain confidential business information must also conform with the requirements of section 201.6 of the Commission’s rules. The Commission’s rules authorize filing submissions with the Secretary by facsimile or electronic means only to the extent permitted by section 201.8 of the rules (see Handbook for Electronic Filing Procedures, http:// www.usitc.gov/secretary/ fed_reg_notices/rules/documents/ handbook_on_electronic_filing.pdf). Persons with questions regarding electronic filing should contact the Secretary (202–205–2000).
In accordance with section 201.16(c) of the Commission’s rules, each document filed by a party to the investigation must be served on all other parties to the investigation (as identified by the service list), and a certificate of service must be timely filed. The Secretary will not accept a document for filing without a certificate of service.
Remedy.—No separate hearing on the issue of remedy will be held. Those parties wishing to present arguments on the issue of remedy may do so orally at the hearing or in their prehearing or posthearing briefs or other written submissions.
Authority: This investigation is being conducted under the authority of section 421 of the Trade Act of 1974; this notice is published pursuant to section 206.3 of the Commission’s rules.
By order of the Commission. Marilyn R. Abbott, Secretary to the Commission.
Issued: April 24, 2009. William R. Bishop, Acting Secretary to the Commission. [FR Doc. E9–9760 Filed 4–28–09; 8:45 am] BILLING CODE P
DEPARTMENT OF JUSTICE
Drug Enforcement Administration
Importer of Controlled Substances; Notice of Application
This is notice that on March 10, 2009, Penick Corporation, 33 Industrial Park Road, Pennsville, New Jersey 08070, made application by renewal to the Drug Enforcement Administration (DEA) for registration as an importer of the basic classes of controlled substances listed in schedule II.
Drug Schedule
Coca Leaves (9040) ..................... II Raw Opium (9600) ....................... II Poppy Straw (9650) ...................... II Concentrate of Poppy Straw
(9670) ........................................ II
The company plans to import the listed controlled substances to manufacture bulk controlled substance intermediates for sale to its customers.
As noted in a previous notice published in the Federal Register on September 23, 1975 (40 FR 43745), all applicants for registration to import a basic class of any controlled substances in schedule I or II are, and will continue to be, required to demonstrate to the Deputy Assistant Administrator, Office of Diversion Control, Drug Enforcement Administration, that the requirements for such registration pursuant to 21 U.S.C. 958(a); 21 U.S.C. 823(a); and 21 CFR 1301.34(b), (c), (d), (e), and (f) are satisfied.
Dated: April 17, 2009. Joseph T. Rannazzisi, Deputy Assistant Administrator, Office of Diversion Control, Drug Enforcement Administration. [FR Doc. E9–9778 Filed 4–28–09; 8:45 am] BILLING CODE 4410–09–P
DEPARTMENT OF JUSTICE
Drug Enforcement Administration
Importer of Controlled Substances; Notice of Application
Pursuant to 21 U.S.C. 958(i), the Attorney General shall, prior to issuing
a registration under this Section to a bulk manufacturer of a controlled substance in schedule I or II, and prior to issuing a regulation under 21 U.S.C. 952(a)(2) authorizing the importation of such a substance, provide manufacturers holding registrations for the bulk manufacture of the substance an opportunity for a hearing.
Therefore, in accordance with Title 21 Code of Federal Regulations § 1301.34(a), this is notice that on February 20, 2009, Meridian Medical Technologies, 2555 Hermelin Drive, St. Louis, Missouri 63144, made application by renewal to the Drug Enforcement Administration (DEA) to be registered as an importer of Morphine (9300), a basic class of controlled substance listed in schedule II.
The company plans to import products for research experimentation or clinical use and analytical testing.
Any bulk manufacturer who is presently, or is applying to be, registered with DEA to manufacture such basic class of controlled substance may file comments or objections to the issuance of the proposed registration and may, at the same time, file a written request for a hearing on such application pursuant to 21 CFR 1301.43 and in such form as prescribed by 21 CFR 1316.47.
Any such comments or objections being sent via regular mail should be addressed, in quintuplicate, to the Drug Enforcement Administration, Office of Diversion Control, Federal Register Representative (ODL), 8701 Morrissette Drive, Springfield, Virginia 22152; and must be filed no later than May 29, 2009.
This procedure is to be conducted simultaneously with, and independent of, the procedures described in 21 CFR 1301.34(b), (c), (d), (e), and (f). As noted in a previous notice published in the Federal Register on September 23, 1975 (40 FR 43745–46), all applicants for registration to import a basic class of any controlled substance listed in schedule I or II are, and will continue to be, required to demonstrate to the Deputy Assistant Administrator, Office of Diversion Control, Drug Enforcement Administration, that the requirements for such registration pursuant to 21 U.S.C. 958(a), 21 USC § 823(a), and 21 CFR 1301.34(b), (c), (d), (e), and (f) are satisfied.
VerDate Nov<24>2008 17:48 Apr 28, 2009 Jkt 217001 PO 00000 Frm 00110 Fmt 4703 Sfmt 4703 E:\FR\FM\29APN1.SGM 29APN1pwal
ker
on P
RO
D1P
C71
with
NO
TIC
ES

30321 Federal Register / Vol. 74, No. 121 / Thursday, June 25, 2009 / Notices
1 19 U.S.C. 2451(b)(1). 2 For purposes of this investigation, certain
passenger vehicle and light truck tires are defined as new pneumatic tires, of rubber, from China, of a kind used on motor cars (except racing cars) and on-the-highway light trucks, vans, and sport utility vehicles, provided for in subheadings 4011.10.10, 4011.10.50, 4011.20.10, and 4011.20.50 of the
Harmonized Tariff Schedule of the United States (‘‘HTS’’). The HTS subheadings are provided for convenience and customs purposes; the written description of the product under investigation is dispositive.
3 Vice Chairman Daniel R. Pearson and Commissioner Deanna Tanner Okun made a negative determination.
written submissions must be filed no later than close of business on July 3, 2009. Reply submissions must be filed no later than the close of business on July 13, 2009. No further submissions on these issues will be permitted unless otherwise ordered by the Commission.
Persons filing written submissions must file the original document and 12 true copies thereof on or before the deadlines stated above with the Office of the Secretary. Any person desiring to submit a document (or portion thereof) to the Commission in confidence must request confidential treatment unless the information has already been granted such treatment during the proceedings. All such requests should be directed to the Secretary of the Commission and must include a full statement of the reasons why the Commission should grant such treatment. See section 201.6 of the Commission’s Rules of Practice and Procedure, 19 CFR 201.6. Documents for which confidential treatment by the Commission is sought will be treated accordingly. All nonconfidential written submissions will be available for public inspection at the Office of the Secretary.
The authority for the Commission’s determination is contained in section 337 of the Tariff Act of 1930, as amended (19 U.S.C. 1337), and sections 210.16 and 210.75 of the Commission’s Rules of Practice and Procedure (19 CFR 210.16 and 210.75).
By order of the Commission. Issued: June 19, 2009.
Marilyn R. Abbott, Secretary to the Commission. [FR Doc. E9–14941 Filed 6–24–09; 8:45 am] BILLING CODE 7020–02–P
INTERNATIONAL TRADE COMMISSION
[Investigation No. TA–421–7]
Certain Passenger Vehicle and Light Truck Tires From the People’s Republic of China; Determination
On the basis of information developed in the subject investigation, the United States International Trade Commission (Commission) determines, pursuant to section 421(b)(1) of the Trade Act of 1974,1 that certain passenger vehicle and light truck tires 2 from the People’s
Republic of China are being imported into the United States in such increased quantities or under such conditions as to cause or threaten to cause market disruption to the domestic producers of like or directly competitive products.3
Background The Commission instituted this
investigation following receipt, on April 20, 2009, of a petition filed by the United Steel, Paper and Forestry, Rubber, Manufacturing, Energy, Allied Industrial and Service Workers International Union. Notice of the institution of the Commission’s investigation and of the scheduling of a public hearing to be held in connection therewith was given by posting a copy of the notice on the Commission’s Web site (http://www.usitc.gov) and by publishing the notice in the Federal Register of April 29, 2009 (74 FR 19593). The hearing was held on June 2, 2009 in Washington, DC; all persons who requested the opportunity were permitted to appear in person or by counsel.
By order of the Commission. Issued: June 19, 2009.
Marilyn R. Abbott, Secretary to the Commission. [FR Doc. E9–14943 Filed 6–24–09; 8:45 am] BILLING CODE 7020–02–P
INTERNATIONAL TRADE COMMISSION
[Investigation No. 337–TA–667 and Investigation No. 337–TA–673]
In the Matter of Certain Electronic Devices, Including Handheld Wireless Communications Devices; Notice of Commission Determination Not To Review an Initial Determination Granting Motion To Amend the Notice of Investigation
AGENCY: U.S. International Trade Commission. ACTION: Notice.
SUMMARY: Notice is hereby given that the U.S. International Trade Commission has determined not to review the presiding administrative law judge’s (‘‘ALJ’’) initial determination (‘‘ID’’) (Order No. 14C) in consolidated Inv. Nos. 337–TA–667 and 337–TA– 673, Certain Electronic Devices
Including Handheld Wireless Communications Devices, granting a motion to amend the notice of investigation. FOR FURTHER INFORMATION CONTACT: Megan M. Valentine, Office of the General Counsel, U.S. International Trade Commission, 500 E Street, SW., Washington, DC 20436, telephone (202) 708–2301. Copies of non-confidential documents filed in connection with this investigation are or will be available for inspection during official business hours (8:45 a.m. to 5:15 p.m.) in the Office of the Secretary, U.S. International Trade Commission, 500 E Street, SW., Washington, DC 20436, telephone (202) 205–2000. General information concerning the Commission may also be obtained by accessing its Internet server at http://www.usitc.gov. The public record for this investigation may be viewed on the Commission’s electronic docket (EDIS) at http:// edis.usitc.gov. Hearing-impaired persons are advised that information on this matter can be obtained by contacting the Commission’s TDD terminal on (202) 205–1810. SUPPLEMENTARY INFORMATION: The Commission instituted Inv. No. 337– TA–667 (‘‘the 667 Investigation’’) on January 23, 2009, based on a complaint filed by Saxon Innovation, LLC of Tyler, Texas (‘‘Saxon’’). 74 FR 4231. The complaint, as amended and supplemented, alleges violations of section 337 of the Tariff Act of 1930, as amended, 19 U.S.C. 1337, in the importation into the United States, the sale for importation, and the sale within the United States after importation of certain electronic devices, including handheld wireless communications devices, by reason of infringement of certain claims of U.S. Patent Nos. 5,235,635 (‘‘the ‘635 patent’’); 5,530,597 (‘‘the ‘597 patent’’); and 5,608,873 (‘‘the ‘873 patent’’). The complaint further alleges the existence of a domestic industry related to each patent. The Commission’s notice of investigation named various respondents, including High Tech Computer Corp. of Taoyuan, Taiwan and HTC America, Inc. of Bellevue, Washington (collectively ‘‘HTC’’). On April 28, 2009, the Commission determined not to review an ID granting under Commission Rule 210.21(b) a joint motion filed by Saxon and HTC to terminate the investigation as to respondent HTC.
The Commission instituted Inv. No. 337–TA–673 (‘‘the 673 Investigation’’) on March 31, 2009, based on a complaint filed by Saxon. 74 FR 14578– 9. The complaint, as amended and supplemented, alleges violations of
VerDate Nov<24>2008 16:25 Jun 24, 2009 Jkt 217001 PO 00000 Frm 00058 Fmt 4703 Sfmt 4703 E:\FR\FM\25JNN1.SGM 25JNN1srob
erts
on
PR
OD
1PC
70 w
ith N
OT
ICE
S


APPENDIX B
HEARING WITNESSES


B-3
CALENDAR OF PUBLIC HEARING
Those listed below appeared as witnesses at the United States International TradeCommission’s hearing:
Subject: Certain Passenger Vehicle and Light Truck Tires from China
Inv. No: TA-421-7
Date and Time: June 2, 2009 - 9:30 a.m.
Sessions were held in connection with this investigation in the Main Hearing Room (Room101), 500 E Street, SW, Washington, DC.
CONGRESSIONAL APPEARANCES:
The Honorable Arlen Specter, United States Senator, Pennsylvania
The Honorable Blanche Lambert Lincoln, United States Senator, Arkansas
The Honorable Evan Bayh, United States Senator, Indiana
The Honorable Sherrod C. Brown, United States Senator, Ohio
The Honorable Robert P. Casey, Jr., United States Senator, Pennsylvania
The Honorable Louise M. Slaughter, U.S. Congresswoman, 28th District, New York
The Honorable Robert B. Aderholt, U.S. Congressman, 4th District, Alabama
The Honorable Carolyn C. Kilpatrick, U.S. Congresswoman, 13th District, Michigan
The Honorable Tom Cole, U.S. Congressman, 4th District, Oklahoma
The Honorable Timothy J. Ryan, U.S. Congressman, 17th District, Ohio
OPENING REMARKS:
In Support of Relief (Terence P. Stewart, Stewart and Stewart)In Opposition to Relief (Ritchie Thomas, Squire, Sanders & Dempsey LLP )

B-4
In Support of Relief:
Stewart and StewartWashington, DCon behalf of
United Steel, Paper and Forestry, Rubber, Manufacturing,Energy, Allied Industrial and Service WorkersInternational Union (“USW”)
Leo W. Gerard, International President, USW
Thomas R. Conway, International Vice President, USW
Stan Johnson, Secretary-Treasurer, USW
Ron Hoover, Executive Vice President, Rubber andPlastics Industry Conference, USW
Les Wilson, Time Study Chairman, USW Local 715
Jim A. Wansley, Former President, USW Local 746L
Chad Apaliski, Technician Corporate Research,Industry Analysis and Pattern BargainingDepartment, USW
Dr. Kenneth R. Button, Senior Vice President, Economic Consulting Services
Jennifer Lutz, Senior Economist, EconomicConsulting Services
Kathryn Kobe, Director of Price, Wage, and ProductivityAnalysis, Economic Consulting Services
Carl R. Moyer, Senior Trade Analyst, Stewart and Stewart
Terence P. Stewart )Eric P. Salonen ) – OF COUNSELElizabeth J. Drake )

B-5
In Opposition to Relief:
Greenberg Traurig LLPWashington, DCon behalf of
American Pacific Industries Inc. (“API”)Fullrun Tire Co., Ltd.
Thomas Burkhardt, Secretary and GeneralManager, API
Philippe M. Bruno )) – OF COUNSEL
Robert D. Stang )
Jochum Shore & Trossevin, PCWashington, DCon behalf of
American Coalition for Free Trade in Tires
Phillip Berra, President, Community WholesaleTire, Inc.
James Mayfield, President, Del-Nat Tire Corporation
Marguerite Trossevin ) – OF COUNSEL
Perkins Coie LLPWashington, D.C.on behalf of
Les Schwab Warehouse Center, Inc.
Dick Borgman, Chairman and Chief ExecutiveOfficer, Les Schwab Tire Centers
Michael P. House ) – OF COUNSEL

B-6
In Opposition to Relief (continued):
Mayer Brown LLPWashington, DCon behalf of
GITI Tire (China) Investment Co., Ltd. (“GITI Tire”)GITI Tire (USA) Ltd. (“GITI Tire USA”)
Ross W. Kogel, Jr., President, Tire WholesalersCompany, Inc.
Vic DeIorio, Executive Vice President, Sales and Business Development, GITI Tire USA
Edward Gwinn, Senior Advisor, DE GlobalLimited
Timothy Keeler ) – OF COUNSEL
Squire, Sanders & Dempsey LLPWashington, DCon behalf of
Subcommittee of Tire Producersof the China Chamber of Commerceof Metals, Minerals & ChemicalImporters & Exporters (“CCCMC”) andthe China Rubber Industry Association
John G. Reilly, Economist, Nathan Associates, Inc.
Ritchie Thomas ) – OF COUNSEL

B-7
In Opposition to Relief (continued):
Hinshaw & Culbertson LLPMinneapolis, MNon behalf of
Shandong Yongtai Chemical Group Co. Ltd.Durum Tire International, Inc.
Thomas G. Wallrich ) – OF COUNSEL
REBUTTAL/CLOSING REMARKS:
In Support of Relief (Terence P. Stewart, Stewart and Stewart)In Opposition to Relief (Marguerite Trossevin, Jochum Shore & Trossevin, PC)


C-1
APPENDIX C
SUMMARY DATA


Table C-1Passenger tires: Summary data concerning the U.S. market, 2004-08
(Quantity=1,000 tires, value=1,000 dollars, unit values, unit labor costs, and unit expenses are per tire; period changes=percent, except where noted)Reported data Period changes
Item 2004 2005 2006 2007 2008 2004-08 2004-05 2005-06 2006-07 2007-08
U.S. consumption quantity: Amount . . . . . . . . . . . . . . . . . . . . 307,484 304,970 291,420 296,091 275,702 -10.3 -0.8 -4.4 1.6 -6.9 Producers' share (1) . . . . . . . . . . 63.3 59.6 56.2 52.6 49.6 -13.7 -3.7 -3.4 -3.6 -2.9 Importers' share (1): China . . . . . . . . . . . . . . . . . . . . 4.7 6.8 9.3 14.0 16.7 11.9 2.1 2.4 4.8 2.7 Other sources . . . . . . . . . . . . . . 31.9 33.6 34.5 33.4 33.7 1.8 1.7 0.9 -1.1 0.3 Total imports . . . . . . . . . . . . . . 36.7 40.4 43.8 47.4 50.4 13.7 3.7 3.4 3.6 2.9
U.S. consumption value: Amount . . . . . . . . . . . . . . . . . . . . 13,845,818 14,808,616 15,238,721 16,502,706 16,460,066 18.9 7.0 2.9 8.3 -0.3 Producers' share (1) . . . . . . . . . . 68.1 64.1 62.2 60.4 57.9 -10.1 -4.0 -1.9 -1.8 -2.5 Importers' share (1): China . . . . . . . . . . . . . . . . . . . . 3.3 4.7 6.1 9.0 10.9 7.6 1.4 1.4 2.9 1.8 Other sources . . . . . . . . . . . . . . 28.7 31.2 31.7 30.6 31.2 2.5 2.6 0.4 -1.1 0.6 Total imports . . . . . . . . . . . . . . 31.9 35.9 37.8 39.6 42.1 10.1 4.0 1.9 1.8 2.5
U.S. imports from: China: Quantity . . . . . . . . . . . . . . . . . . 14,574 20,790 27,005 41,503 45,975 215.5 42.7 29.9 53.7 10.8 Value . . . . . . . . . . . . . . . . . . . . . 453,288 691,924 931,704 1,493,052 1,788,387 294.5 52.6 34.7 60.2 19.8 Unit value . . . . . . . . . . . . . . . . . $31.10 $33.28 $34.50 $35.97 $38.90 25.1 7.0 3.7 4.3 8.1 Ending inventory quantity . . . . . 2,091 3,031 4,914 6,273 9,099 335.2 45.0 62.1 27.7 45.1 All other sources: Quantity . . . . . . . . . . . . . . . . . . 98,179 102,424 100,601 98,913 92,902 -5.4 4.3 -1.8 -1.7 -6.1 Value . . . . . . . . . . . . . . . . . . . . . 3,968,366 4,625,833 4,826,687 5,045,295 5,137,015 29.4 16.6 4.3 4.5 1.8 Unit value . . . . . . . . . . . . . . . . . $40.42 $45.16 $47.98 $51.01 $55.29 36.8 11.7 6.2 6.3 8.4 Ending inventory quantity . . . . . 15,762 16,364 16,726 15,382 18,700 18.6 3.8 2.2 -8.0 21.6 All sources: Quantity . . . . . . . . . . . . . . . . . . 112,753 123,214 127,606 140,416 138,877 23.2 9.3 3.6 10.0 -1.1 Value . . . . . . . . . . . . . . . . . . . . . 4,421,654 5,317,756 5,758,391 6,538,347 6,925,402 56.6 20.3 8.3 13.5 5.9 Unit value . . . . . . . . . . . . . . . . . $39.22 $43.16 $45.13 $46.56 $49.87 27.2 10.1 4.6 3.2 7.1 Ending inventory quantity . . . . . 17,853 19,395 21,640 21,655 27,799 55.7 8.6 11.6 0.1 28.4
Table continued on next page.
C-3

Table C-1--ContinuedPassenger tires: Summary data concerning the U.S. market, 2004-08
(Quantity=1,000 tires, value=1,000 dollars, unit values, unit labor costs, and unit expenses are per tire; period changes=percent, except where noted)Reported data Period changes
Item 2004 2005 2006 2007 2008 2004-08 2004-05 2005-06 2006-07 2007-08
U.S. producers': Average capacity quantity . . . . . . 226,849 222,895 215,172 196,292 186,395 -17.8 -1.7 -3.5 -8.8 -5.0 Production quantity . . . . . . . . . . . 218,363 207,780 184,843 180,334 160,310 -26.6 -4.8 -11.0 -2.4 -11.1 Capacity utilization (1) . . . . . . . . 96.3 93.2 85.9 91.9 86.0 -10.3 -3.0 -7.3 6.0 -5.9 U.S. shipments: Quantity . . . . . . . . . . . . . . . . . . 194,731 181,756 163,814 155,675 136,825 -29.7 -6.7 -9.9 -5.0 -12.1 Value . . . . . . . . . . . . . . . . . . . . . 9,424,164 9,490,860 9,480,330 9,964,359 9,534,664 1.2 0.7 -0.1 5.1 -4.3 Unit value . . . . . . . . . . . . . . . . . $48.40 $52.22 $57.87 $64.01 $69.69 44.0 7.9 10.8 10.6 8.9 Export shipments: Quantity . . . . . . . . . . . . . . . . . . 27,303 27,520 26,809 24,574 22,409 -17.9 0.8 -2.6 -8.3 -8.8 Value . . . . . . . . . . . . . . . . . . . . . 1,229,965 1,322,693 1,380,106 1,421,418 1,397,312 13.6 7.5 4.3 3.0 -1.7 Unit value . . . . . . . . . . . . . . . . . $45.05 $48.06 $51.48 $57.84 $62.35 38.4 6.7 7.1 12.4 7.8 Ending inventory quantity . . . . . . 22,030 22,784 19,023 20,548 21,685 -1.6 3.4 -16.5 8.0 5.5 Inventories/total shipments (1) . . 9.9 10.9 10.0 11.4 13.6 3.7 1.0 -0.9 1.4 2.2 Production workers . . . . . . . . . . . 36,411 35,595 34,037 31,842 31,243 -14.2 -2.2 -4.4 -6.4 -1.9 Hours worked (1,000s) . . . . . . . . 75,989 73,599 69,726 67,163 63,050 -17.0 -3.1 -5.3 -3.7 -6.1 Wages paid ($1,000s) . . . . . . . . . 1,794,378 1,780,661 1,763,715 1,653,152 1,570,858 -12.5 -0.8 -1.0 -6.3 -5.0 Hourly wages . . . . . . . . . . . . . . . $23.61 $24.19 $25.29 $24.61 $24.91 5.5 2.5 4.6 -2.7 1.2 Productivity (tires per hour) . . . . . 2.9 2.8 2.6 2.7 2.5 -11.5 -1.7 -6.1 1.3 -5.3 Unit labor costs . . . . . . . . . . . . . . $8.23 $8.58 $9.55 $9.18 $9.81 19.2 4.3 11.3 -3.9 6.9 Net sales: Quantity . . . . . . . . . . . . . . . . . . 221,816 209,090 190,463 180,071 159,074 -28.3 -5.7 -8.9 -5.5 -11.7 Value . . . . . . . . . . . . . . . . . . . . . 10,624,268 10,789,188 10,839,265 11,362,616 10,911,454 2.7 1.6 0.5 4.8 -4.0 Unit value . . . . . . . . . . . . . . . . . $47.90 $51.60 $56.91 $63.10 $68.59 43.2 7.7 10.3 10.9 8.7 Cost of goods sold (COGS) . . . . 8,997,862 9,382,902 9,708,792 9,573,483 9,830,965 9.3 4.3 3.5 -1.4 2.7 Gross profit or (loss) . . . . . . . . . . 1,626,406 1,406,286 1,130,473 1,789,133 1,080,489 -33.6 -13.5 -19.6 58.3 -39.6 SG&A expenses . . . . . . . . . . . . . 1,370,174 1,240,739 1,245,022 1,281,892 1,343,323 -2.0 -9.4 0.3 3.0 4.8 Operating income or (loss) . . . . . 256,232 165,547 (114,549) 507,241 (262,834) (2) -35.4 (2) (2) (2) Capital expenditures . . . . . . . . . . 550,780 688,153 576,497 597,387 729,300 32.4 24.9 -16.2 3.6 22.1 Unit COGS . . . . . . . . . . . . . . . . . $40.56 $44.88 $50.97 $53.16 $61.80 52.4 10.6 13.6 4.3 16.2 Unit SG&A expenses . . . . . . . . . $6.18 $5.93 $6.54 $7.12 $8.44 36.7 -3.9 10.2 8.9 18.6 Unit operating income or (loss) . . $1.16 $0.79 ($0.60) $2.82 ($1.65) (2) -31.5 (2) (2) (2) COGS/sales (1) . . . . . . . . . . . . . 84.7 87.0 89.6 84.3 90.1 5.4 2.3 2.6 -5.3 5.8 Operating income or (loss)/ sales (1) . . . . . . . . . . . . . . . . . . 2.4 1.5 (1.1) 4.5 (2.4) -4.8 -0.9 -2.6 5.5 -6.9
(1) "Reported data" are in percent and "period changes" are in percentage points. (2) Undefined.
Note.--Financial data are reported on a fiscal year basis and may not necessarily be comparable to data reported on a calendar year basis.Because of rounding, figures may not add to the totals shown. Unit values and shares are calculated from the unrounded figures.
Source: Compiled from data submitted in response to Commission questionnaires and from official Commerce statistics.
C-4
D-1
APPENDIX D
SUPPLEMENTAL QUESTIONNAIRE RESPONSES ON MARKET SEGMENTATION


D-3
The Commission asked all U.S. producers and top U.S. importers to respond to the followingquestions:
1. Information developed so far in the investigation of subject tires from China has indicated thatthere may be several categories of subject tires in the United States (e.g., Good/Better/Best; Tier1/Tier 2/Tier 3; Flagship/Secondary/Mass-market). Do you agree that the U.S. subject tire marketcan be divided into three categories? If no, please provide a description of how, if at all, the U.S.market for subject tires can be categorized. If yes, please describe each category.
2. Approximately what share of the total U.S. market for subject tires, based on quantity, did each ofthese categories represent in 2008?
3. Approximately what share of your firm’s U.S. sales of subject tires in 2008, based on quantity,were to each category? Please provide this for your firm’s U.S. sales of U.S.-produced subjecttires, subject tires imported from China, and subject tires imported from all other sources.
4. Between 2004 and 2008, has the U.S. market for subject tires shifted between the threecategories?
5. U.S. producers only: Between 2004 and 2008, has your firm’s U.S. production of subject tiresshifted between the three categories?
6. U.S. importers only: Between 2004 and 2008, have your firm’s U.S. imports of subject tires fromChina shifted between the three categories?
7. U.S. importers only: Between 2004 and 2008, have your firm’s U.S. imports of subject tires fromall other sources shifted between the three categories?
The responses to questions 1-4 are reported in tables D-1-6 below. The responses are discussedfurther in Part V.

D-4
Table D-1Subject tires: U.S. producers’ and top importers’ responses to segmentation of the U.S. market forsubject tires
* * * * * * *
Table D-2Subject tires: Estimated shares, based on quantity, of the total U.S. market for subject tires, 2008
* * * * * * *
Table D-3Subject tires: Estimated shares, based on quantity, of each firm’s U.S. sales of U.S. producedsubject tires, 2008
* * * * * * *
Table D-4Subject tires: Estimated shares, based on quantity, of each U.S. importer’s U.S. sales of subjecttires from China, 2008
* * * * * * *
Table D-5Subject tires: Estimated shares, based on quantity, of each U.S. importer’s U.S. sales of subjecttires from all other sources, 2008
* * * * * * *
Table D-6Subject tires: U.S. producers’ and top importers’ responses to shift in the U.S. market for subjecttires among the three segments
* * * * * * *
![[SPARE PARTS] PASSENGER CARfoxtradekorea.com/catalog_pas_bus_trk.pdf · [spare parts] passenger car renault samsung bus & truck tata daewoo truck daewoo bus hyundai bus & truck grandbird](https://img.pdfslide.us/doc/110x75/608294885e7220483c1ce307/spare-parts-passenger-spare-parts-passenger-car-renault-samsung-bus-truck.jpg)