Embed Size (px)
Citation preview

CERIAS Tech Report 2006-75Vulnerabilities and Risk Management of Open Source Software: An Empirical Study
by J Rees, K Altinkemer, S Sridhar Center for Education and ResearchInformation Assurance and Security
Purdue University, West Lafayette, IN 47907-2086

Vulnerabilities and Risk Management of Open Source Software: An
Empirical Study
Kemal Altinkemer, Jackie Rees, and Sanjay Sridhar
Krannert Graduate School of Management
And
The Center for Education and Research in Information Assurance and Security (CERIAS)
Purdue University
West Lafayette, IN 47907-2056
{kemal, jrees, ssridhar}@purdue.edu
1
Vulnerabilities and Risk Management of Open Source Software: An Empirical Study
Abstract
Software selection is an important consideration in risk management for information security. Additionally,
the underlying robustness and security of a technology under consideration has become increasingly
important in total cost of ownership and other calculations of business value. Open source software is often
touted as being robust to many of the problems that seem to plague proprietary software. This study seeks
to empirically investigate, from an information security perspective specific security characteristics of open
source software compared to those of proprietary software. Software vulnerability data spanning several
years are collected and analyzed to determine if significant differences exist in terms of inter-arrival times
of published vulnerabilities, median time to release ‘fixes’ (commonly referred to as patches), type of
vulnerability reported and the respective severity of the vulnerabilities. It appears that both open source and
proprietary software are each likely to report similar vulnerabilities and that open source software is only
marginally quicker in releasing patches for problems identified in their software. The arguments favoring
the inherent security of open source software do not appear to hold up to scrutiny. These findings provide
evidence to security managers to focus more on holistic software security management, irrespective of the
proprietary-nature of the underlying software.
Keywords: open source software, information security, risk management
Working Paper
2/24/2005
Do Not Quote Without Permission of the Authors
2

Vulnerabilities and Risk Management of Open Source Software: An Empirical Study
1. Introduction
Software selection is an important risk management consideration for information
security. Utilizing software packages with strong security features can reduce the information
security risk exposure of an organization. Additionally, the underlying quality and security of a
technology under consideration has become increasingly important in total cost of ownership
(TCO) and other calculations of business value (Pescatore, 2004). Open source software (OSS)
has been cited as a possible solution to the information security problems and vulnerabilities often
reported in propriety software. Open source software is software that by license provides
unlimited access to the source code, so that the source code can be examined and modified
according to the user’s wishes. There are also prescriptions for the distribution of the software and
subsequent modifications (Open Source Initiative, 2005). According to a recent Wall Street
Journal article, supporters of open source software, particularly Linux, a pc-based operating
system, viewed such software as less vulnerable to viruses and worms, making OSS a favorable
choice over other operating systems, such as Windows XP (Bulkeley, 2004). Open source software
is often developed and maintained by large numbers of volunteers. One of the oft promoted
features of open source software is that the wide availability of source code, and hence the large
number of critical eyes examining the source code, results in more robust and therefore more
secure software and applications (Open Source Initiative, 2005). Many critics also suggest the
3

push to market pressures among proprietary software vendors result in more problematic end
products, including an increased number of software bugs and vulnerabilities. In light of these
commonly-held beliefs, there is a growing perception that open source software, for example the
various instantiations of the Linux operating system and various software applications, is
inherently more secure, due to the freely available source code and greater levels of critical
scrutiny.
Information security activities, in theory, are driven by risk management principles.
Anti-virus software, firewalls, access control, and intrusion detection systems are certainly
important in managing the risk exposure of the organization. Increasingly, organizations are
looking to the information technology infrastructure itself, to ensure that components are utilized
that provide the most functional and secure platform possible while minimizing the total cost of
ownership (Silver and Pescatore, 2004). Given the general low acquisition costs and perceived
higher levels of security, OSS such as Linux, Apache, and MySQL has received significant
attention from the popular press. However, it remains unclear whether or not the deployment of
OSS results in greater levels of security and therefore lower levels of risk to the organization. The
question of reduced TCO remains for future research.
The objective of this research is to empirically determine if there is any validity to the
claim of OSS proponents that OSS is more secure, using vulnerability and patch data available for
both open source and proprietary software. While well-designed and secure software is much
more than the collection of vulnerability and patch release data, these metrics provide at least a
4

preliminary look into potential problems with specific technologies. In this research we focus on
operating systems software, such as Linux, Microsoft XP and Apple OS. Data have been collected
for a number of years, including the most recent available. We investigate and address the
counter-criticism that the reason open source software appears to be less vulnerable is that it
simply is less of a target, both in terms of market share and length of time in the market.
The rest of the paper is organized as follows: Section 2 examines the background
of the open source versus proprietary software debate. We look at the context used to examine the
data, including the software reliability literature. We also examine previous work in this area and
differentiate the current research from this work. The research questions and framework are
presented in Section 3. The methodology and information about the data is discussed in Section 4.
Section 5 provides the results and discussion while Section 6 concludes the study and presents
ideas for future research.
2. Related Background
Open source software is defined as software whose source code is publicly
available for free or a nominal charge. Depending on the specific license agreement, the source
code may be modified and redistributed. Software whose source code is not openly published,
usually are commercial software, which we refer to as proprietary software. As the executable
code may be free or of nominal charge for either propriety or open source software, we limit the
distinction to the source code. The software development and maintenance work carried out for
5

open source software, is often voluntary and performed by any number of hobbyists and/or other
interested parties. The incentives and motivation for volunteering time and effort to open source
projects has been studied by Lerner and Tirole (2002) and Hann, Roberts, and Slaughter (2004). In
general, career concerns and peer recognition are motivating factors for those involved in open
source projects. Open source software was modeled using the theory of public goods by Johnson
(2001) who reported inefficiencies in open source development and distribution as compared to
proprietary software.
Any bug or error in a user-application or a network application that can be exploited
to compromise a system, or cause a security breach, is termed a vulnerability. Vulnerabilities can
be classified according to the types of problems or breaches it can cause, or the potential damage it
may inflict. The problems or threats created by vulnerabilities are qualified based on the nature of
possible security attacks and the level of severity of the attacks. Typically, developers working on
software take preventive measures to counter these threats due to known vulnerabilities by
releasing what is known as a fix or a patch to eliminate the vulnerability.
There are numerous issues with patching vulnerabilities. First of all, the vulnerability
must be discovered and reported. There are different mechanisms by which vulnerabilities can be
reported. For example, CERT (http://www.cert.org) is a partnership between the federal
government and public and private companies, and acts as an infomediary between those who
identify vulnerabilities and software users. The ICAT Metabase is a database maintained by the
National Institute of Standards and Technology (NIST) (http://icat.nist.gov/icat.cfm) that stores
6

and maintains vulnerability and patch information, collected from various other security advisories
maintained by the Center for Education and Research in Information Assurance and Security
(CERIAS), Security Focus, Bugtraq, etc. There also exist market-based infomediaries such as
iDefense (http://www.iDefense.com), providing incentives like monetary rewards for vulnerability
identifiers. Arora, Telang and Xu (2004) examine a number of scenarios to study optimal
vulnerability disclosure policy and find that the social welfare is maximized by the use of a neutral
intermediary. However, there is a contingent of users who believe in immediate and full disclosure
(http://lists.netsys.com/mailman/listinfo/full-disclosure). The chief concern is that if a particular
vulnerability is known, an attack can be executed before affected systems are somehow patched or
secured.
Next, a patch must be created, delivered or made accessible to all relevant users of the
affected systems. The current system of patch delivery depends on the particular source or vendor
of the technology. Some might be automatically located and applied via the Internet, whereas
others might require far more work and expertise to locate. Third, the patch must be applied once
it is obtained. While some patches and updates are simple to download and install, others have
been known to cause further problems and system instability, for example Microsoft’s Service
Pack 2 (SP2) (Sliwa, 2004). It has been conjectured that such patches might introduce further
vulnerabilities as they are sometimes quickly put together without sufficient development and
testing procedures.
7

The proliferation of patches in itself has resulted in a new area of practice and research,
namely patch management. Certainly, keeping up with the volume of patches for various systems
is no easy task for organizations. Intuitively, well-developed software that was engineered for
both functionality and security should result in fewer bugs, and therefore, fewer vulnerabilities and
subsequent patches. From a TCO perspective, patching is quite expensive. Much effort is
required to determine which patches should be downloaded and applied at what times, to which
systems and follow-up must be performed to ensure adequate systems operations and stability
(Silver and Pescatore, 2004). From a risk management perspective, the application of large
numbers of patches implies that further problems, complexities and instability could be introduced
to a system, therefore increasing the likelihood of more problems or failure. Both TCO and risk
management dictate that fewer patches as a result of fewer vulnerabilities in software is desirous.
Open source software advocates claim that OSS is much less prone to attacks from
viruses and other information security problems as there are fewer vulnerabilities to exploit.
Others have proposed that the issue is more of simply being an interesting target to attack. For
example, as Microsoft is the dominant player in the personal computer operating system market,
(Hamm, 2005) they are the most interesting target for attackers and others with malevolent
agendas. As Linux makes further inroads into the PC operating system market space, will the
various instantiations of Linux become popular targets for virus writers and other attackers as
well? The next section sets forth several research questions, along with the research framework in
8
which we attempt to address the research questions. The vulnerabilities and patching behaviors are
then examined using these questions, in Section 4.
3. Research Questions
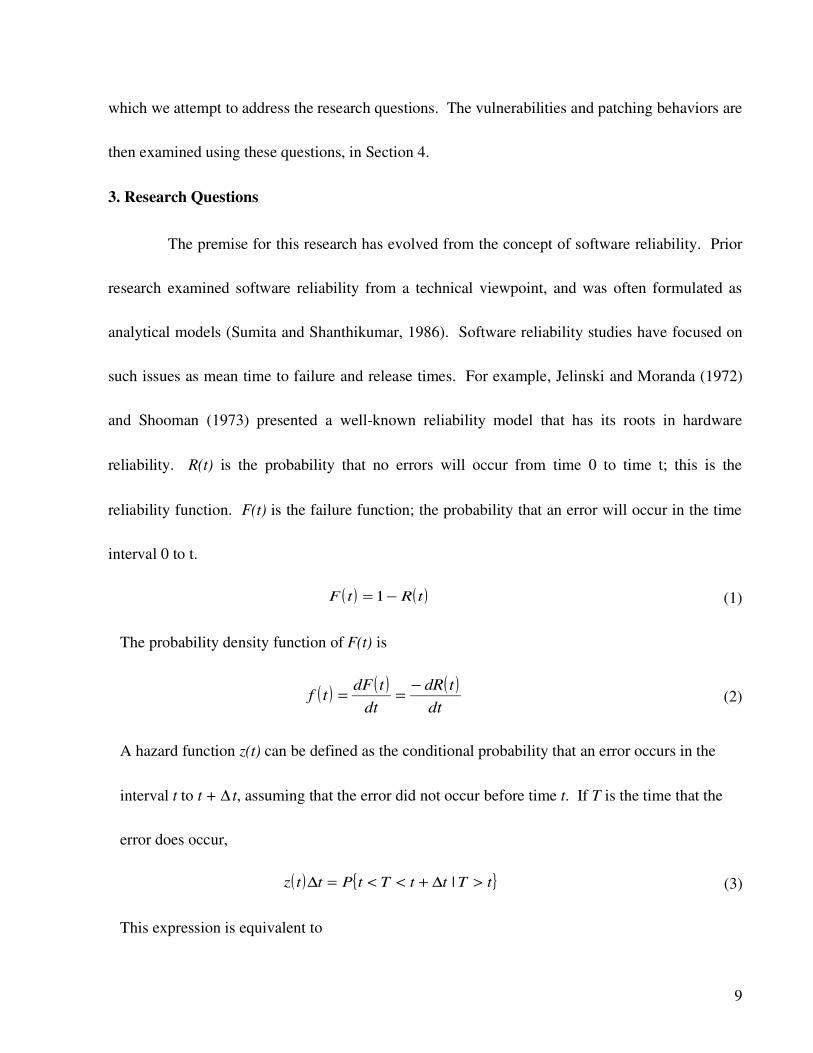
The premise for this research has evolved from the concept of software reliability. Prior
research examined software reliability from a technical viewpoint, and was often formulated as
analytical models (Sumita and Shanthikumar, 1986). Software reliability studies have focused on
such issues as mean time to failure and release times. For example, Jelinski and Moranda (1972)
and Shooman (1973) presented a well-known reliability model that has its roots in hardware
reliability. R(t) is the probability that no errors will occur from time 0 to time t; this is the
reliability function. F(t) is the failure function; the probability that an error will occur in the time
interval 0 to t.
( ) ( )tRtF −= 1 (1)
The probability density function of F(t) is
( ) ( ) ( )dt
tdR
dt
tdFtf
−== (2)
A hazard function z(t) can be defined as the conditional probability that an error occurs in the
interval t to t + ∆ t, assuming that the error did not occur before time t. If T is the time that the
error does occur,
( ) { }tTttTtPttz >∆+<<=∆ | (3)
This expression is equivalent to
9

( ) { }{ }
( ) ( )( )tR
tFttF
tTP
ttTtPttz
−∆+=
>∆+<<
=∆ (4)
Dividing both sides by t and taking the limit as t approaches zero,∆ ∆
( ) ( ) ( ) ( )[ ] ( )tRdttdRtRtftz /// −== (5)
Solving for R(t) by setting R(0) = 1,
( ) ( )
−= ∫
t
dxxztR0
exp (6)
and mean-time-to-failure (MTTF) is
( )∫∞
=0
dttRMTTF (7)
Numerous extensions exist to this original model. Additionally, other models have been
developed using different assumptions, such as error seeding models and complexity models
(Myers, 1976). Banker, Datar, Kemerer, and Zweig (2002) point out that a major limitation of
these models is that they offer little explanatory power. They proposed a conceptual model
which attempts to better understand why errors occur or are introduced and determined that
factors such as programmer experience, system volatility and complexity and frequency of minor
modifications to the system impacted the error rates.
We are interested in software reliability from an information security viewpoint.
Therefore, we consider the errors found in software to represent a superset of vulnerabilities that
could lead to exploits and other security threats. We don’t know the exact size of the vulnerability
set relative to the set of all errors, however given the advances in software engineering practices
and automation, we assume that security vulnerabilities represent the large majority of errors
10

discovered in software post-release. Therefore, the discovery of software errors or bugs and
vulnerabilities and the subsequent release of patches appear as ideal starting points for examining
the security and reliability of various types of software. Arora, Nandkumar, Krishnan, and Telang
(2004) looked at vulnerabilities and frequency of attacks, focusing on vulnerability disclosure
policies. From a decision-making perspective, two papers (Cavusoglu and Raghunathan, 2004;
Beattie, Arnold, Cowan, Wagle, Wright and Shostack, 2002) examined the optimal time to apply a
software patch. In this research, we take an additional look at vulnerabilities and their fixes, in an
attempt to compare open source and proprietary software, along the lines of software quality and
reliability and gain insights into the development process of open source software. How well
operating system vendors deal with security problems is bigger than just quick patch release and
how easily the vendor enables administrators to apply those patches.
“…the key questions in judging operating systems are: how quickly does an operating
system vendor fix public security vulnerabilities; how severe are those problems, compared with
other vendors…..” (MIZI Research, 2004, p. 1)
Given that OSS source code is much more widely available, it is commonly believed that
more critical eyes are examining open source software in its development and debugging (Diffie,
2003). If more individuals are involved in the development and maintenance of open source
software, repairs or patches for problem in the software should be issued in less time than for
proprietary software products. Based on this belief, we expect open source to be faster in its
response to fixing bugs. Formally, we state Hypothesis 1 as follows:
11

Hypothesis 1: Open source software developers issue patches faster than proprietary software
vendors.
If patches are issued in closer time units to the discovery of the vulnerability, we can state
that open source software is more secure from a patching perspective.
From a reliability/queuing perspective, the discovery of a vulnerability can be viewed as
an arrival event. So, the inter-arrival times of vulnerabilities indicate the frequency of
vulnerabilities that are discovered in unit time. Building on our initial belief about the inherent
security of open source, we posit that the mean inter-arrival time of vulnerabilities will be greater
for open source software. In other words, we expect to see fewer bugs being discovered in open-
source systems, in unit time, reflecting their robustness. This leads to our second hypothesis,
Hypothesis 2: In unit time, there are fewer vulnerabilities in open source software compared to
proprietary software.
The motivational profiles of open source and proprietary software developers have been widely
studied based on theories of volunteerism and labor economics (Hann, Roberts and Slaughter,
2004; Lerner and Tirole, 2000). Open source software developers have been found to be more
motivated to contribute and respond to the development process of open source software due to the
apparent visibility of their contribution. This visibility provides an incentive to participate and
consequentially brings in the desired recognition. Thus, we believe that high-severity
12

vulnerabilities will be responded to faster by the open source community than the proprietary
software developers. Hypothesis 3 follows:
Hypothesis 3: Open source software patches high-severity vulnerability faster than proprietary
software.
Borrowing from the motivational profiles of open source software developers, we hypothesize that
open source developers will respond faster to confidentiality, integrity, availability and security-
protection type of vulnerabilities. This research question was then split into the following four
sub-hypotheses.
Hypothesis 4a: Open source software developers patch confidentiality-type vulnerabilities faster
than proprietary software developers.
Hypothesis 4b: Open source software developers patch integrity-type vulnerabilities faster than
proprietary software developers.
Hypothesis 4c: Open source software developers patch availability-type vulnerabilities faster than
proprietary software developers.
Hypothesis 4d: Open source software developers patch security protection-type vulnerabilities
faster than proprietary software developers.
Hypothesis 5 is based on the exploit range of the vulnerabilities. High-severity vulnerabilities are
usually remote-exploits by nature. So, following on hypothesis 3, we have,
13

Hypothesis 5: Remote exploit-vulnerabilities are patched faster by open source developers than
their proprietary counterparts.
4. Data & Methodology
Data for our analysis has been obtained from the ICAT database (ICAT, 2004)
maintained by the security division of National Institute of Standards and Technology (NIST) and
the Common Vulnerabilities and Exposures (CVE) list maintained by the Mitre Corporation
(MITRE, 2004). The data set contains vulnerabilities/bugs discovered and patched/fixed between
the period of January 2001 and May 2004. The data is classified according to vulnerability type,
severity of potential damage, and their exploited range. These classifications are made by the
originators of the data sources, rather than by the researchers of this study.
As mentioned earlier, the focus of our study is on operating system software. Hence the
dataset is classified as open source and proprietary, based on the underlying operating system
software where the vulnerability has been discovered. The dates of discovery of the vulnerabilities
and the dates when these bugs were fixed are recorded to obtain the response times of vendors to
release a patch.
Depending on the perceived consequence of a security breach due to a prevailing
vulnerability, borrowing from the well-known Confidentiality, Integrity and Availability (CIA)
framework (CERT 2004), the data is classified into confidentiality, integrity or availability bugs. A
14

fourth classification, namely security protection (S) is also used to qualify a more general
consequence of a security breach. Thus, a vulnerability that has been discovered could be
classified into multiple types (C, I, A, and/or S) depending upon the possible consequences of the
same. The potential damage caused by the vulnerability is categorized into three types depending
on their severity: High, Medium, and Low (H, M, and L). These classifications are contained
within the database. Additionally, the exploit range of these bugs is defined to be either remote or
local.
Approximately 700 vulnerabilities were identified and listed in the CVE during the
2001-2004 time period. For several of the vulnerabilities, we were unable to get information on
the exact date of discovery of the vulnerability. Additionally, some of the vulnerabilities affected
both open source as well as proprietary software, in which case, it was difficult to determine the
date of discovery or the date when the vulnerability was fixed, for both. Also, there were some
vulnerabilities that did not have information on the nature of the vulnerability, their type and/or
their exploit range. We removed such data points and ended up with a list of 454 vulnerabilities. A
bootstrap procedure was performed, explained in the following section, to impute those missing
values where we only needed to estimate the date of discovery of the vulnerability. There were 170
such data points. The resulting data set contains 624 vulnerabilities. Sources for the information
on dates of vulnerability discovery and patch application typically included the CERIAS website
(http://www.cerias.purdue.edu), ISS X-Force, Security Focus, CERT, Microsoft Security Bulletins,
Bugtraq, KDE, Neohapsis, etc. The dates of discovery of the vulnerabilities are as reported by
15

these sources when the vendor is notified. For information on the dates of vendor response, we
have taken them to be the dates when the security advisories were made public by the vendor,
unless when the actual dates of vendor response were available.
Given the difficulty in obtaining such confidential details related to information security,
and the resources available to us, getting exact dates of occurrence of these events was not an easy
task. However, we have been consistent in this regard, during our entire data collection process
and hence still believe that our preliminary findings would be validated. Next, we describe the
procedure that was used to impute the missing data points.
Estimating Missing values
As mentioned earlier, a large number of vulnerabilities had missing values related to the
date of discovery of the vulnerability. If these data points were deleted, our analysis would be
possibly biased. In order to eliminate this bias, we estimated the missing values using a simple
bootstrap procedure (Greene and Greene, 2002).
For simplicity, we initially built our full data set by drawing discovery dates randomly
from our existing data set, with replacement. This inherently assumes that our full data set of
patch times and inter-arrival times had a similar distribution to our existing data set. Then this
random drawing was performed for 1000 iterations to obtain mean estimates. The overall patch
times and inter-arrival times of vulnerabilities did not show much deviation from our original
result. Our data sources contained information on the vulnerability type, the date it was patched
16

and also when the CVE was assigned to these vulnerabilities. Now, to impute the patch times and
inter-arrival times, we incorporated the following constraints:
1) We drew the values randomly from an exponential distribution where the mean
was equal to the mean values obtained from our existing data set.
2) An upper limit and lower limit for each value randomly drawn was determined
as an additional constraint, from the information contained in our data sources.
We, therefore present the results from our preliminary analysis for our final data set.
5. Results and Discussion
Year
Open Source Software Proprietary Software
NMean
(days)
Std.
Dev.N
Mean
(days)
Std.
Dev.
T-stat/p-
value for
difference
of Means
2000 37 57.76 57.52 17 35.19 23.00 2.06(0.03)
2001 94 30.64 41.77 83 37.59 47.96 -1.02(0.16)
2002 81 34.12 37.78 105 42.56 47.49 -1.35(0.09)
2003 77 29.68 48.26 84 41.12 54.99 -1.41(0.08)
2004 16 24.73 14.75 27 24.41 18.50 0.06(0.48)
All 305 34.30 43.81 317 38.90 47.08 -1.26(0.10)
Table 1. Mean time to patch for open-source and proprietary operating system software.
Table 1 shows the mean time to patch for open-source and proprietary software, across
different time periods. Goodness-of-fit tests were performed for the Normal, Lognormal, and
Weibull distributions. Different parameter values of the Gamma distribution were tested and the
17

exponential distribution was found to have the best fit. Note that we do not have adequate data
points for years 2000 and 2004. Hence we can only make limited inferences here. However, if we
look at years 2001-2003, we clearly see a smaller mean time to patch in the case of open-source
systems. We compute the t-statistic to determine the statistical significance of the difference
between the means in open-source and proprietary software (Greene and Greene, 2002). The last
column in Table 1 shows the t-values for comparing the means. The results that are significant at
10% level for one-tailed p-values are indicated in bold. We see that Hypothesis 1 is supported
only in some cases. We provide market share data (CNET, 2004) for both open source and
proprietary operating system software in client applications, in Table 2, for comparison purposes.
The data shown does not reflect any major trend reversals. Contrary to popular belief, proprietary
operating system software market share only seems to grow larger. Do note that our dataset is
restricted only to vulnerabilities in client applications (and not server applications).
YearMarket Share for OSS
(in percentage)
Market Share for PS
(in percentage)
2000 <1 94
2001 1 95
2002 2.4 95
2003 2.8 97
2004 (Estimates) 1 98
Table 2. Market share data for open source and proprietary operating system
software
(CNET, 2004).
18

Figure 1 illustrates the exponential distribution of the counts of the patch-times for the
two software-types. The overall mean time to patch for open-source software was 34.30 days,
clearly about 14% less than the mean times in proprietary software (38.90 days).
Fig. 1. Overall mean time to patch for open-source and proprietary operating system
software.
19

Fig. 2. Fit of the exponential distribution for vulnerability patch-times.
20

Fig. 3. Inter-arrival times of vulnerabilities for open-source and proprietary operating
system software.
Fig. 4. Fit of the exponential distribution for inter-arrival times of vulnerabilities.
Type of OS affected
Inter-arrival times of vulnerabilities
(T-stat of Difference of means = -0.20)
N Mean (days) Std. Deviation
O 305 4.64 7.14
P 317 4.82 15.08
Table 3. Mean inter-arrival times of vulnerabilities for open-source and proprietary
operating system software.
The numbers in Table 3 show the difference in the mean inter-arrival times of
vulnerabilities for the two software-types. There is not much difference in the mean inter-arrival
times and though proprietary software exhibits a lot more variation, the difference in the means is
21

not statistically significant (t-value = 1.10) at the 10% level. Hence, at this point, we cannot
conclude that open-source software exhibit greater robustness. We, therefore, reject Hypothesis 2.
Type of
Severity
Open Source Software Proprietary Software
NMean
(Days)
Std.
DeviationN
Mean
(Days)
Std.
Deviation
T-stat/p-
value for
difference of
means
High 148 34.30 51.30 171 41.99 51.98 -1.33(0.09)
Medium 146 33.64 39.53 131 36.11 41.90 -0.50(0.31)
Low 11 42.91 27.64 15 28.07 31.51 1.27(0.12)
Table 4. Severity of the vulnerability. The 1-tailed p-values at the 10% significance are
shown in bold.
Table 4 shows the relative performance of the two software systems based on the type of
severity. As we had hypothesized earlier, we find a significant difference in the performance for
high-severity vulnerabilities. Hypothesis 3 is supported. The medium and low-severity
vulnerability meanwhile do not show differences that are statistically significant.
The classification based on the type of the vulnerability (C, I, A or S) is shown below in
Table 5. We do see a significant difference in the patch times of confidentiality-type
vulnerabilities, but the difference is in favor of proprietary software systems. Integrity and
Availability-type vulnerabilities do not show any significant difference. Thus, hypotheses 4a, 4b
and 4c are not supported. A more general type of vulnerability, namely the Security protection,
22

meanwhile, also does not show a significant difference in the patch times. Hypothesis 4d is not
supported. Also, looking at the means, it is difficult to ascertain if one type of software is better
than the other.
Type of
Vulnerability
Open Source Software Proprietary Software
NMean
(Days)
Std.
DeviationN
Mean
(Days)
Std.
Deviation
T-stat/p-value
for difference
of means
Confidentiality 41 46.80 38.79 36 35.99 25.44 1.46(0.07)
Integrity 58 32.83 22.24 42 30.46 27.26 0.46(0.32)
Availability 85 45.23 37.06 87 45.43 38.04 -0.04(0.49)
Security
Protection
18
247.72 28.75
21
150.38 39.80 0.77(0.22)
Table 5. Type of vulnerability. The 1-tailed p-values at the 10% significance are shown in
bold.
Consistent with hypothesis 5, we find that open source software developers patch faster
than the proprietary software developers in the case of Remote-exploit vulnerabilities, but the
difference is not statistically significant. Hypothesis 5 is not supported. The corresponding
results are presented in Table 6.
Exploit
Range
Open Source Software Proprietary Software
NMean
(Days)
Std.
DeviationN
Mean
(Days)
Std.
Deviation
T-stat/p-
value for
difference of
means
Remote 125 35.50 39.80 168 39.94 43.64 -0.91(0.18)
Local 192 34.02 48.16 155 36.41 48.74 -0.46(0.32)
23

Table 6. Exploit range. The 1-tailed p-values at the 10% significance are shown in bold.
compares the exploit range for open source and proprietary software systems.
Fig. 5 shows the moving averages for the patch times and the vulnerability-interarrival
times. Adequate smoothening has been done, considering 120 event-intervals to show the
trajectory of the two curves. Since the two parameters were found to be exponentially distributed,
an exponential moving average was also computed and Fig. 6 shows the relative convergence of
the two curves for the patch times and inter-arrival times. As expected, the exponential moving
averages yield a smoother convergence.
24

Fig. 5. Simple Moving Average for patch-times and vulnerability inter-arrival times for
120-events interval.
Fig. 6. Exponential Moving Average for patch-times and vulnerability inter-arrival times
for 120-events interval.
Summarizing, the results provide some perspective into the ongoing debate of security
between open source and proprietary software systems. The paper makes a contribution to this
growing literature on software security in two ways. First, the analysis reveals yet again that the
security issue is still open. Critics who argue in favor of the “more critical eyes” theory may do
well to look at the observations again. Though time to patch or vendor-responsiveness, is not the
only measure of software quality, in the minds of the user, it is definitely one of the proxies for
software security. The faster the patch is available, the more confident users feel towards the
25

software’s security. Again, research (Rescorla, 2002) does show that securing a system does not
end with making a patch available. Most users are found to be less responsive (call it user-
responsiveness) to apply the patch that is available to them. Yet, restricting our study to purely
technical concerns, and to just the vulnerabilities found in operating system applications, the
results are not conclusive.
As mentioned earlier, given the limited data available to us, we do not differentiate our
data sources based on the different disclosure policies they follow. Incorporating them would
ensure a more complete framework is in place. Going back to the argument of proprietary software
being more targeted (due to their wide market share) and hence less secure, our results show that
this is not the case. Both kinds of software contain almost the same number of vulnerabilities and
further, the yearly data reveals no trends indicating any one holding a clear advantage over the
other, from a security standpoint.
6. Conclusion and Future Research
Our study contributes to the literature on software security. The key motivation remains
to carry the software reliability model forward. Quite a few data points had to be imputed, since
the information was incomplete. We seek to further examine this data through an analytical
framework from the perspective of security as reliability. The insights available from the software
reliability literature will be applied accordingly. Another issue worth pursuing is that of staffing
questions for software development. Some critics state that open source software has too many
26

developers than is efficient, and thus wastes resources. Others purport that perhaps open source
software has naturally evolved to rely on the relatively large numbers of programmers used to
manage the software. We hope to eventually shed light on this issue as well.
Our analysis serves as a good starting point to compare open source and proprietary
software systems from a security perspective. However, the study is not complete. We hope to
obtain similar data on server applications as well. Finally, incorporating the information on vendor
disclosure policies for our different data sources and also the user patterns in applying a patch once
it is available, will help us build on the framework we are trying to establish through this study.
How good a patch is, or whether frequent patching is cost-effective are still questions open to
research. An interesting extension of our analysis would be to analyze the quality of a patch, in
terms of the number of new vulnerabilities it introduces into the system. Though data might be
difficult to obtain, an analytical birth-and-death model could capture the mechanics of the
vulnerability-patch lifecycle adequately.
References
Arora, A., Telang, R., and Xu, H. “Optimal Policy for Software Vulnerability Disclosure,” 2004,
Working paper, Carnegie Mellon University.
Arora, A., Nandkumar, A., Krishnan, R. and Telang, R. “Impact of Patches and Software
Vulnerability Information on Frequency of Security Attacks – An Empirical Analysis,”
2004, Working paper, Carnegie Mellon University.
27

Banker, R. D., Datar, S. M., Kemerer, C. F. and Zweig, D. “Software Errors and Software
Maintenance Management,” Information Technology and Management. 3, 1-2, 25-41.
Beattie, S., Arnold, S., Cowan, C., Wagle, P., Wright, C., and Shostack, A. “Timing the
Application of Security Patches for Optimal Uptime,” Proceedings of LISA Sixteenth
Systems Administration Conference, 2002, pp. 101-110.
Bulkeley, W. M. “Can Linux Take Over the Desktop?” Wall Street Journal, May 24, 2004.
Cavusoglu, H. and Raghunathan, S. “Optimal Timing Decisions for Application of Security
Patches,” 2004, Working paper, Tulane University.
CERT. “Securing Network Servers,” Prepared by CERT, Retrieved August 8, 2004, from
http://www.cert.org/security-improvement/modules/m07.html
CNET News, Prepared by CNET, Retrieved December, 2004, from http://www.news.com.com
Diffie, W. “Is Open-Source Software Better for Security Than Proprietary Software?” ZDNet,
January 16, 2003, Retrieved February 19, 2005 from
http://news.zdnet.com/2100-9595_22-980938.html.
Greene, W. H. and Greene, W. H. “Econometric Analysis,” 5th edition, Prentice Hall, Upper
Saddle River, NJ, 2002.
Hamm, S. “Linuxinc.” BusinessWeek, Jan. 31, 2005, 60-68.
Hann, I., Roberts, J. and Slaughter, S. “Why Developers Participate in Open Source Software
Projects?” 2004, Working Paper, University of Southern California.
28

Jelinski, Z. and Moranda, P. B. “Software Reliability Research,” in W. Freiberger, Ed. Statistical
Computer Performance Evaluation. Academic Press, New York, 1972, 465-484.
Johnson, J. P. “Economics of Open Source Software,” Working paper, 2001.
ICAT Metabase, 2004, http://icat.nist.gov /icat.cfm
MITRE “Common Vulnerabilities and Exposure,” 2004, http://www.cve.mitre.org
MIZI Research, “Linux Vs Windows: Which is more secure?” 2004, last accessed at
http://www.mizi.com/en/index/news-app/story.32
Lerner, J. and Tirole, J. “The open source movement: Key research questions,” European
Economic Review, 2001, 45, 819-826.
Lerner, J. and Tirole, J. “Some Simple Economics of Open Source,” The Journal of Industrial
Economics, 2002, 50, 2, 197-234.
Myers, G. Software Reliability: Principles and Practices. John Wiley and Sons, New York, NY,
1976.
The Open Source Definition, Open Source Initiative, last accessed February 14, 2005 at
http://www.opensource.org/docs/definition.php
Pescatore, J. “Management Update: Mount a Solid Defense Against Worms and Viruses,” Gartner
intraWeb Report ID Number: G00123950, 2004, last accessed at
http://www.itap.purdue.edu/itresources/gartner/index.html
29

Rescorla, E. “Security holes... who cares?” 2002, last accessed at
http://www.rtfm.com/upgrade.pdf
Shooman, M. “Operational Testing and Software Reliability Estimation During Program
Development,” Record of the 1973 IEEE Symposium on Computer Software Reliability.
IEEE, New York, 1973, 51-57.
Silver, M. and Pescatore, J. “Security Holes Increase Windows Client TCO,” Gartner intraWeb
Report ID Number: G00123511, 2004, last accessed at
http://www.itap.purdue.edu/itresources/gartner/index.html
Sliwa, C. “App Tests for Win XPSP2 Burden Users: Most Delay Installing XP Security Update,”
Computerworld, August 20, 2004.
Sumita, U. and Shantikumar, G. “A Software Reliability Model with Multiple-Error Introduction
& Removal,” IEEE Transactions on Reliability, 35, 4, 1986, 459-462.
30