Embed Size (px)
Citation preview
Geophysical Research Letters
Ceres’s obliquity history and its implicationsfor the permanently shadowed regions
A. I. Ermakov1,2 , E. Mazarico3 , S. E. Schröder4 , U. Carsenty4 , N. Schorghofer5 ,
F. Preusker4 , C.A. Raymond2 , C. T. Russell6 , and M. T. Zuber1
1Department of Earth, Atmospheric and Planetary Sciences, Massachusetts Institute of Technology, Cambridge,Massachusetts, USA, 2Jet Propulsion Laboratory, California Institute of Technology, Pasadena, California, USA, 3NASAGoddard Space Flight Center, Greenbelt, Maryland, USA, 4Institute of Planetary Research, German Aerospace Center,Berlin, Germany, 5Institute for Astronomy, University of Hawai’i at Manoa, Honolulu, Hawaii, USA, 6IGPP/EPSS, Universityof California, Los Angeles, California, USA
Abstract Due to the small current obliquity of Ceres (𝜖 ≈ 4∘), permanently shadowed regions (PSRs)exist on the dwarf planet’s surface. Since the existence and persistence of the PSRs depend on the obliquity,we compute the obliquity history over the last 3 Myr and find that it undergoes large oscillations with aperiod of 24.5 kyr and a maximum of 𝜖max ≈19.6∘. During periods of large obliquity, most of the present-dayPSRs receive direct sunlight. Some craters in Ceres’s polar regions possess bright crater floor deposits(BCFDs). We find an apparent correlation between BCFDs and the most persistent PSRs. In the north,only two PSRs remain at 𝜖max and they both contain BCFDs. In the south, one of the two only craters thatremain in shadow at 𝜖max contains a BCFD. The location of BCFDs within persistent PSRs strongly suggeststhat BCFDs consist of volatiles accumulated in PSR cold traps: either water molecules trapped from theexosphere or exposed ground ice.
1. Introduction1.1. What Did We Know Before Dawn?The shape of dwarf planet (1) Ceres and orientation of its spin pole (and, therefore, obliquity) had been con-strained in several studies prior to the Dawn mission [Thomas et al., 2005; Drummond and Christou, 2008; Carryet al., 2008; Drummond et al., 2014]. The uncertainties of these determinations were typically on the order of5∘. Skoglöv et al. [1996] conducted a study of obliquity variations of 10 large asteroids including Ceres usingthe then available spin vectors and ellipsoidal shape models and concluded that orbital evolution character-istic frequencies are typically higher than precession frequencies. No indication of chaos in 2 Myr integrationswas found. Bills and Nimmo [2011] predicted that Ceres has a tidally damped obliquity, which, if true, presentsan additional constraint on the internal structure, as it would depend on the moments of inertia. However,Rambaux et al. [2011] argued that the damping period is on the order of 1017 years—much longer than theage of the solar system—and, therefore, it is highly unlikely that the present-day obliquity is damped. Hayneand Aharonson [2015] studied water ice stability on the surface of Ceres using statistical, artificial topographyand concluded that ice becomes stable at latitudes higher than ≈60∘ within persistent shadows on steepslopes and within permanently shadowed regions (PSRs).
1.2. MotivationImages from the Dawn spacecraft’s Framing Camera (FC) and radio tracking of the spacecraft from ground-based stations have allowed the precise determination of the Ceres’s rotational pole [Park et al., 2016] and,therefore, of the dwarf planet’s obliquity (𝜖). Presently, Ceres’s obliquity is about 4∘ [Russell et al., 2016]. Dueto this low obliquity, permanently shadowed regions have been detected on Ceres’s surface using the DawnFraming camera images and shape-based illumination modeling [Schorghofer et al., 2016; Platz et al., 2017].This makes Ceres only the third body in the solar system after the Moon [Zuber and Smith, 1997; Mazaricoet al., 2011] and Mercury [Chabot et al., 2012; Neumann et al., 2013] with identified PSRs. The existence of PSRsdepends critically on the body’s obliquity.
Some craters in Ceres’s polar regions possess bright crater floor deposits or BCFDs. These crater floors aretypically in shadow, but they receive light scattered from the surrounding sunlit crater walls and therefore
RESEARCH LETTER10.1002/2016GL072250
Key Points:• Currently, Ceres obliquity is only
4∘ ; we have calculated Ceres obliquityhistory and found that it undergoeslarge periodic oscillations
• At higher obliquities, only few PSRsremain; we find a correlation betweenpersistent PSRs and bright crater floordeposits
• Bright deposits in PSR craters are likelyvolatiles accumulated in cold traps:water molecules from the exosphereor exposed ground ice
Supporting Information:• Data Set S1• Data Set S2• Data Set S3• Text S1• Figure S1• Figure S2
Correspondence to:A. I. Ermakov,[email protected]
Citation:Ermakov, A. I., E. Mazarico,S. E. Schröder, U. carsenty,N. Schorghofer, F. Preusker,C. A. Raymond, C. T. Russell, andM. T. Zuber (2017), Ceres’s obliquityhistory and its implications forthe permanently shadowedregions, Geophys. Res. Lett., 44,doi:10.1002/2016GL072250.
Received 9 DEC 2016
Accepted 14 FEB 2017
©2017. American Geophysical Union.All Rights Reserved.
ERMAKOV ET AL. CERES OBLIQUITY AND PSRS 1
Geophysical Research Letters 10.1002/2016GL072250
can be seen by the FC. Temperatures inside PSRs can be so cold that the sublimation rate of surface waterice becomes negligible. Therefore, any ice delivered by an exosphere or exposed by impacts may remainindefinitely. We hypothesize that BCFDs are volatile deposits accumulated in PSR cold traps analogous to theMoon and Mercury [Watson et al., 1961; Arnold, 1979; Slade et al., 1992; Feldman et al., 1998; Paige et al., 2010;Sanin et al., 2012; Moores, 2016]. The boundaries of Ceres’s cold traps are determined by the PSRs at 𝜖 = 𝜖max.
The analysis of the Gamma Ray and Neutron Detector (GRaND) data shows that Ceres’s regolith is rich inhydrogen [Prettyman et al., 2016]. Neutron and gamma ray count data reveal a strong latitude variation withsuppressed counts at high latitudes. The lower bound of H concentration near the poles exceeds that foundin carbonaceous chondrites, which are thought to be the best meteoritic analogues of Ceres. Therefore, theGRaND observations indicate that water ice and/or other volatile species may be concentrated in the polarregions on or very near (≈1 m) the surface. Nevertheless, water ice is rarely found exposed on the sunlit surface[Combe et al., 2016].
The observation of BCFDs on Ceres is similar to the observations within Mercury’s PSRs by the MErcury Surface,Space ENvironment, GEochemistry, and Ranging (MESSENGER) spacecraft. The MESSENGER images showregions with higher reflectance inside some PSRs, with the boundary of the higher-reflectance units closelymatching the PSR boundaries [Neumann et al., 2013; Chabot et al., 2014; Deutsch et al., 2016]. One importantdifference between the PSR inventory from the MESSENGER and Dawn data is that the heights of Mercury’stopography were derived from laser altimetry [Cavanaugh et al., 2007; Zuber et al., 2012], which is inde-pendent of the illumination conditions, whereas Ceres’s elevations are derived from stereo analysis of theFC images.
Orbital and obliquity histories have been shown to be important factors for volatile transport on the Moon,Mercury, and Mars. Siegler et al. [2013] concluded that due to Mercury’s low obliquity, variations in orbitaleccentricity are likely to have been the dominant cause of changes in polar temperatures on this planet. Siegleret al. [2015] found that cold traps are likely to have been stable for nearly 4 Gyr on Mercury. The Moon hasundergone a major spin axis reorientation in the past [Ward, 1975]. Siegler et al. [2011] conclude that lunarobliquity history has dramatically altered the lunar polar thermal environment. In the following work, Siegleret al. [2015] found that when the Moon was at approximately half of its current semimajor axis (3 ± 1 Gyr),lunar obliquity may have reached as high as 77∘. At that time, lunar polar temperatures were much higher andcold traps could not exist. Later, lunar obliquity has decreased creating environments favorable for water icestability. More recently, Siegler et al. [2016] provided an example of a possible feedback between knowledgeof volatile distribution and body orientation history. Additionally, it has been predicted that the obliquityforcing is one of the main drivers of the volatile transport on Mars [Jakosky and Phillips, 2001; Laskar et al.,2004; Jakosky et al., 2005].
Thus, in the case of Ceres, understanding temporal obliquity variations in the past sheds light on the historyof PSRs and can help constrain the timescales for water ice deposition and loss and ultimately might constrainthe amount of water delivered to Ceres from exogenic sources.
1.3. OutlineWe start by describing the orbit and rotation integrator and the illumination model in section 2. We thensummarize the available shape and orientation data as well as the observations of Ceres’s BCFDs in section 3.The results on Ceres’s obliquity, PSR history, and their relation to BCFDs are presented in section 4. We discussthe implications of our results in section 5 and summarize our findings in section 6.
2. Methods2.1. IntegratorWe used a symplectic integrator to backward integrate the orbital and rigid body motion of Ceres. The sym-plectic mapping for the N-planet problem was developed by Wisdom and Holman [1991]. It has been provento be an efficient algorithm for long-term integrations of planetary systems. Later, similar ideas led to thedevelopment of a symplectic mapping for the rigid body dynamics [Touma and Wisdom, 1994]. We use a sym-plectic leapfrog algorithm, in which an accuracy of (h2) is achieved by shifting the phase of the Dirac deltafunctions by a half of the integration time step h. General leapfrog mapping can be written in the form
K (h∕2)∘NI(h)∘K , (1)
ERMAKOV ET AL. CERES OBLIQUITY AND PSRS 2
Geophysical Research Letters 10.1002/2016GL072250
where, for the case of the N-planet problem, K is the mapping according to the Keplerian Hamiltonian andNI is the mapping according to the interactions Hamiltonian. The complete mapping for spin-orbit dynamicscan be written as the rigid body leapfrog mapping nested into the N-planets leapfrog mapping as follows:
K (h∕2)∘2(h∕4)∘3(h∕2)∘2(h∕4)∘NI(h)∘RI(h)∘K (h∕2)∘2(h∕4)∘3(h∕2)∘2(h∕4), (2)
where 2 is the axisymmetric rigid body motion, 3 is the perturbation in the rigid body motion due tothe body’s triaxiality, RI is the rotational interactions between Ceres and other bodies, i.e., the Sun and theplanets. In our case, the spin-orbit coupling term acts in RI. The choice of time step h is crucial for the accu-racy of the mapping. We choose a value of 1/20 of the fastest periodic motion considered. We performedintegrations both with biaxial and triaxial Ceres. For the case of triaxial Ceres, the shortest period is the rota-tional period (9.07 h). Therefore, for these integrations we set h = 1620 s. For the case of a biaxial Ceres, theshortest period is the orbital period of Mercury (≈88 days); accordingly, we can use h = 4.4 days. A detaileddescription of the integrator is available in the supporting information.
2.2. Illumination Modeling Using Digital Terrain ModelIn order to assess the illumination conditions at Ceres over a range of past obliquities, we performed numeri-cal illumination modeling using a shape model of Ceres. This approach has been used in the past for the Moonand Mercury, using a shape model derived from laser altimetry data [Mazarico et al., 2011; Neumann et al.,2013]. We follow the approach described in Schorghofer et al. [2016] using ray tracing over multilevel, multires-olution triangulated meshes. The extended nature of the Sun as a light source is handled by discretizing its discinto 500 point sources. For the present-day orientation of Ceres, we use the current best estimates consistentwith the adopted shape model [Preusker et al., 2015, 2016]. While Schorghofer et al. [2016] resampled the HighAltitude Mapping Orbit (HAMO)-derived Digital Terrain Model (DTM) onto a grid of points uniformly spaced innorth polar stereographic projection, we took advantage of the full resolution of the DTM high-level productsby implementing the Lambert-Azimuthal Equal Area projection [Snyder, 1982] and performing the simula-tions in that projection at a resolution of 135 m/pixel down to ≈53.5∘ latitude. For computational reasonsand because of Ceres’s rapid spin (rotational period ≈9.07 h) and long orbital period (4.6 years), we restrictedour simulations to a full rotation at each pole’s respective solstice, which is the geometry that provides thestrongest constraint regarding the presence of long-lived shadows.
3. Data3.1. Ceres ShapeThe shape model of Ceres was produced using a stereophotogrammetry (SPG) technique applied by theGerman Aerospace Center (DLR) [Preusker et al., 2016]. The SPG method is purely geometrical and does notrely on simultaneously solving for surface heights and albedo. The global shape model used here was com-puted from images acquired during Dawn’s HAMO phase (High Altitude Mapping Orbit: 6 weeks at ≈1500 kmaltitude), at a resolution of ≈135 m/pixel. Thanks to the high sensitivity of the Dawn’s Framing Camera [Sierkset al., 2011; Schröder et al., 2013], it is possible to utilize features seen in scattered light to constrain the shapeof the floors of shadowed polar craters, despite larger ray intersection errors and the need for interpolationnear those locations. The comparison of the area in permanent shadow derived from numerical illuminationsimulations performed with a shape model [Schorghofer et al., 2016] and that obtained from a survey of min-imum shadows observed by FC near northern solstice [Platz et al., 2017] shows an agreement to ≈2%, whichbrings confidence in the modeling methodology and DTM quality for illumination modeling. However, wefind that the HAMO DTM resolution and accuracy are typically not sufficient to model the conditions withinsmall craters (<4 km). We also used the shape reconstructed for the southern hemisphere. Despite the unfa-vorable lighting conditions, as Dawn visited Ceres during southern winter, the HAMO DTM allows illuminationmodeling outside of the immediate polar region (85∘–90∘S), which was in seasonal darkness. Additionally,we conducted a sensitivity test by perturbing the crater depths by 100 m, which is a conservative estimate ofthe height error, and recomputing the PSR boundaries. We concluded that the DTM errors do not significantlyaffect our results in the larger craters.
3.2. Ceres Rotational PoleThe arrival of the Dawn spacecraft at Ceres made it possible to substantially improve the accuracy of Ceres’spole position and rotation rate. The present-day obliquity of Ceres is≈4.02∘. For the present study, we used thespin pole location and rotation rate derived from the Dawn measurements. Specifically, the PCK SPICE kernel
ERMAKOV ET AL. CERES OBLIQUITY AND PSRS 3
Geophysical Research Letters 10.1002/2016GL072250
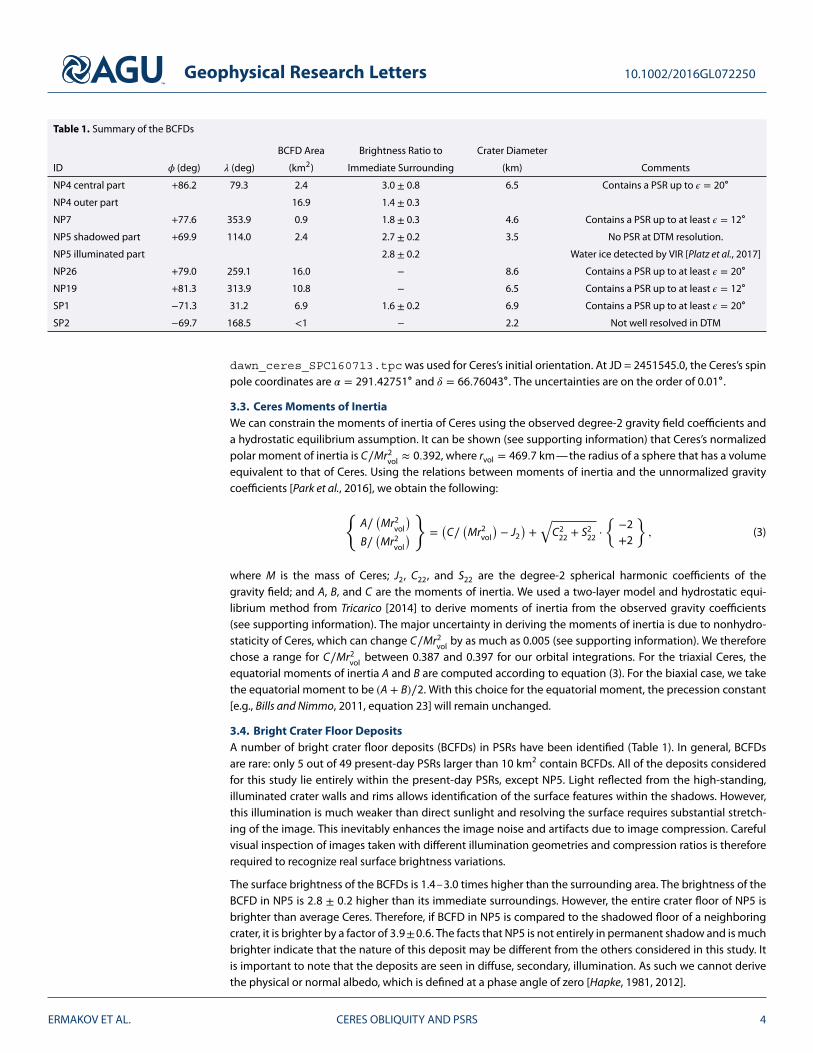
Table 1. Summary of the BCFDs
BCFD Area Brightness Ratio to Crater Diameter
ID 𝜙 (deg) 𝜆 (deg) (km2) Immediate Surrounding (km) Comments
NP4 central part +86.2 79.3 2.4 3.0 ± 0.8 6.5 Contains a PSR up to 𝜖 = 20∘
NP4 outer part 16.9 1.4 ± 0.3
NP7 +77.6 353.9 0.9 1.8 ± 0.3 4.6 Contains a PSR up to at least 𝜖 = 12∘
NP5 shadowed part +69.9 114.0 2.4 2.7 ± 0.2 3.5 No PSR at DTM resolution.
NP5 illuminated part 2.8 ± 0.2 Water ice detected by VIR [Platz et al., 2017]
NP26 +79.0 259.1 16.0 − 8.6 Contains a PSR up to at least 𝜖 = 20∘
NP19 +81.3 313.9 10.8 − 6.5 Contains a PSR up to at least 𝜖 = 12∘
SP1 −71.3 31.2 6.9 1.6 ± 0.2 6.9 Contains a PSR up to at least 𝜖 = 20∘
SP2 −69.7 168.5 <1 − 2.2 Not well resolved in DTM
dawn_ceres_SPC160713.tpcwas used for Ceres’s initial orientation. At JD = 2451545.0, the Ceres’s spinpole coordinates are 𝛼 = 291.42751∘ and 𝛿 = 66.76043∘. The uncertainties are on the order of 0.01∘.
3.3. Ceres Moments of InertiaWe can constrain the moments of inertia of Ceres using the observed degree-2 gravity field coefficients anda hydrostatic equilibrium assumption. It can be shown (see supporting information) that Ceres’s normalizedpolar moment of inertia is C∕Mr2
vol ≈ 0.392, where rvol = 469.7 km—the radius of a sphere that has a volumeequivalent to that of Ceres. Using the relations between moments of inertia and the unnormalized gravitycoefficients [Park et al., 2016], we obtain the following:
{A∕
(Mr2
vol
)B∕
(Mr2
vol
)}
=(
C∕(
Mr2vol
)− J2
)+√
C222 + S2
22 ⋅{
−2+2
}, (3)
where M is the mass of Ceres; J2, C22, and S22 are the degree-2 spherical harmonic coefficients of thegravity field; and A, B, and C are the moments of inertia. We used a two-layer model and hydrostatic equi-librium method from Tricarico [2014] to derive moments of inertia from the observed gravity coefficients(see supporting information). The major uncertainty in deriving the moments of inertia is due to nonhydro-staticity of Ceres, which can change C∕Mr2
vol by as much as 0.005 (see supporting information). We thereforechose a range for C∕Mr2
vol between 0.387 and 0.397 for our orbital integrations. For the triaxial Ceres, theequatorial moments of inertia A and B are computed according to equation (3). For the biaxial case, we takethe equatorial moment to be (A + B)∕2. With this choice for the equatorial moment, the precession constant[e.g., Bills and Nimmo, 2011, equation 23] will remain unchanged.
3.4. Bright Crater Floor DepositsA number of bright crater floor deposits (BCFDs) in PSRs have been identified (Table 1). In general, BCFDsare rare: only 5 out of 49 present-day PSRs larger than 10 km2 contain BCFDs. All of the deposits consideredfor this study lie entirely within the present-day PSRs, except NP5. Light reflected from the high-standing,illuminated crater walls and rims allows identification of the surface features within the shadows. However,this illumination is much weaker than direct sunlight and resolving the surface requires substantial stretch-ing of the image. This inevitably enhances the image noise and artifacts due to image compression. Carefulvisual inspection of images taken with different illumination geometries and compression ratios is thereforerequired to recognize real surface brightness variations.
The surface brightness of the BCFDs is 1.4–3.0 times higher than the surrounding area. The brightness of theBCFD in NP5 is 2.8 ± 0.2 higher than its immediate surroundings. However, the entire crater floor of NP5 isbrighter than average Ceres. Therefore, if BCFD in NP5 is compared to the shadowed floor of a neighboringcrater, it is brighter by a factor of 3.9±0.6. The facts that NP5 is not entirely in permanent shadow and is muchbrighter indicate that the nature of this deposit may be different from the others considered in this study. Itis important to note that the deposits are seen in diffuse, secondary, illumination. As such we cannot derivethe physical or normal albedo, which is defined at a phase angle of zero [Hapke, 1981, 2012].
ERMAKOV ET AL. CERES OBLIQUITY AND PSRS 4
Geophysical Research Letters 10.1002/2016GL072250
4. Results4.1. Obliquity HistoryWe performed a number of orbital integrations with triaxial and biaxial Ceres with different numbers of per-turbing planets. Secular dynamics of Ceres is dominated by Jupiter and Saturn modes. As long as Jupiter andSaturn are included and interact with Ceres, we obtain essentially the same obliquity history. The initial posi-tions and velocities of planets were taken from the DE430 ephemeris [Folkner et al., 2014] using the SPICEancillary information system [Acton, 1996]. We find that the obliquity history is not sensitive to the triaxiality ofCeres. This allows us to use much longer integration time steps since there is no need to resolve Ceres’s rota-tion period, and the triaxial step 3(h) can be skipped. The results are also not sensitive to relativistic effects,which we modeled as an additional velocity kick.
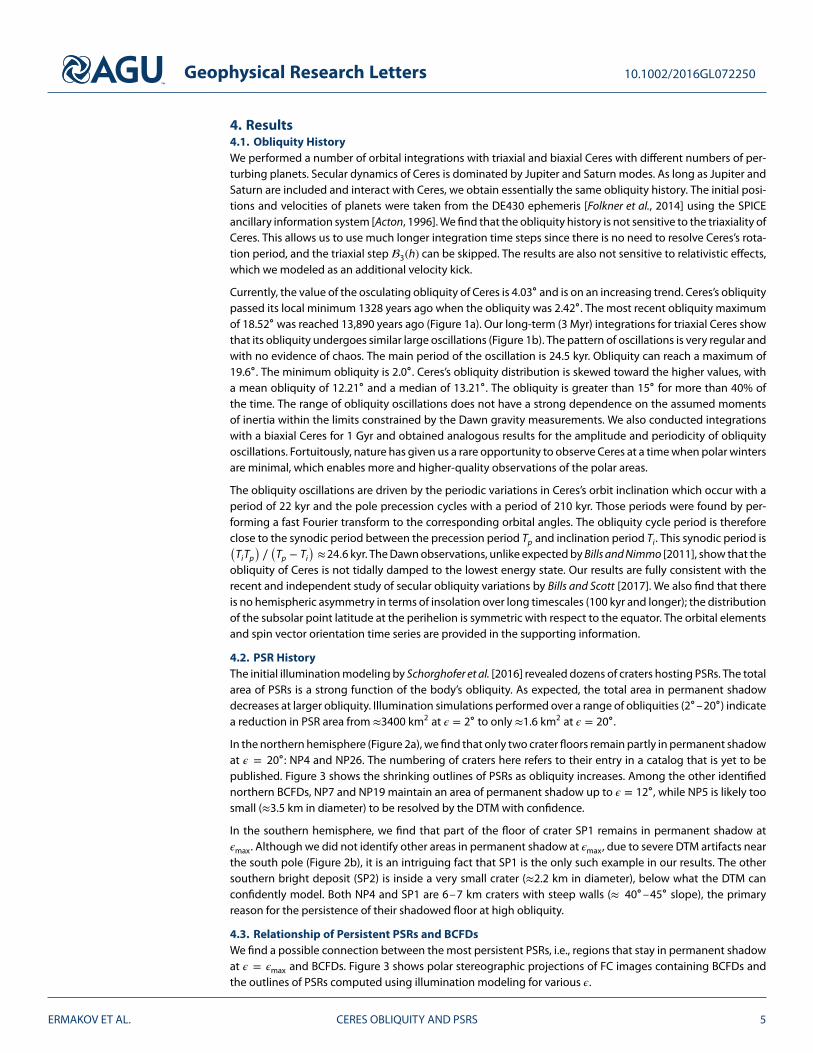
Currently, the value of the osculating obliquity of Ceres is 4.03∘ and is on an increasing trend. Ceres’s obliquitypassed its local minimum 1328 years ago when the obliquity was 2.42∘. The most recent obliquity maximumof 18.52∘ was reached 13,890 years ago (Figure 1a). Our long-term (3 Myr) integrations for triaxial Ceres showthat its obliquity undergoes similar large oscillations (Figure 1b). The pattern of oscillations is very regular andwith no evidence of chaos. The main period of the oscillation is 24.5 kyr. Obliquity can reach a maximum of19.6∘. The minimum obliquity is 2.0∘. Ceres’s obliquity distribution is skewed toward the higher values, witha mean obliquity of 12.21∘ and a median of 13.21∘. The obliquity is greater than 15∘ for more than 40% ofthe time. The range of obliquity oscillations does not have a strong dependence on the assumed momentsof inertia within the limits constrained by the Dawn gravity measurements. We also conducted integrationswith a biaxial Ceres for 1 Gyr and obtained analogous results for the amplitude and periodicity of obliquityoscillations. Fortuitously, nature has given us a rare opportunity to observe Ceres at a time when polar wintersare minimal, which enables more and higher-quality observations of the polar areas.
The obliquity oscillations are driven by the periodic variations in Ceres’s orbit inclination which occur with aperiod of 22 kyr and the pole precession cycles with a period of 210 kyr. Those periods were found by per-forming a fast Fourier transform to the corresponding orbital angles. The obliquity cycle period is thereforeclose to the synodic period between the precession period Tp and inclination period Ti . This synodic period is(
TiTp
)∕(
Tp − Ti
)≈24.6 kyr. The Dawn observations, unlike expected by Bills and Nimmo [2011], show that the
obliquity of Ceres is not tidally damped to the lowest energy state. Our results are fully consistent with therecent and independent study of secular obliquity variations by Bills and Scott [2017]. We also find that thereis no hemispheric asymmetry in terms of insolation over long timescales (100 kyr and longer); the distributionof the subsolar point latitude at the perihelion is symmetric with respect to the equator. The orbital elementsand spin vector orientation time series are provided in the supporting information.
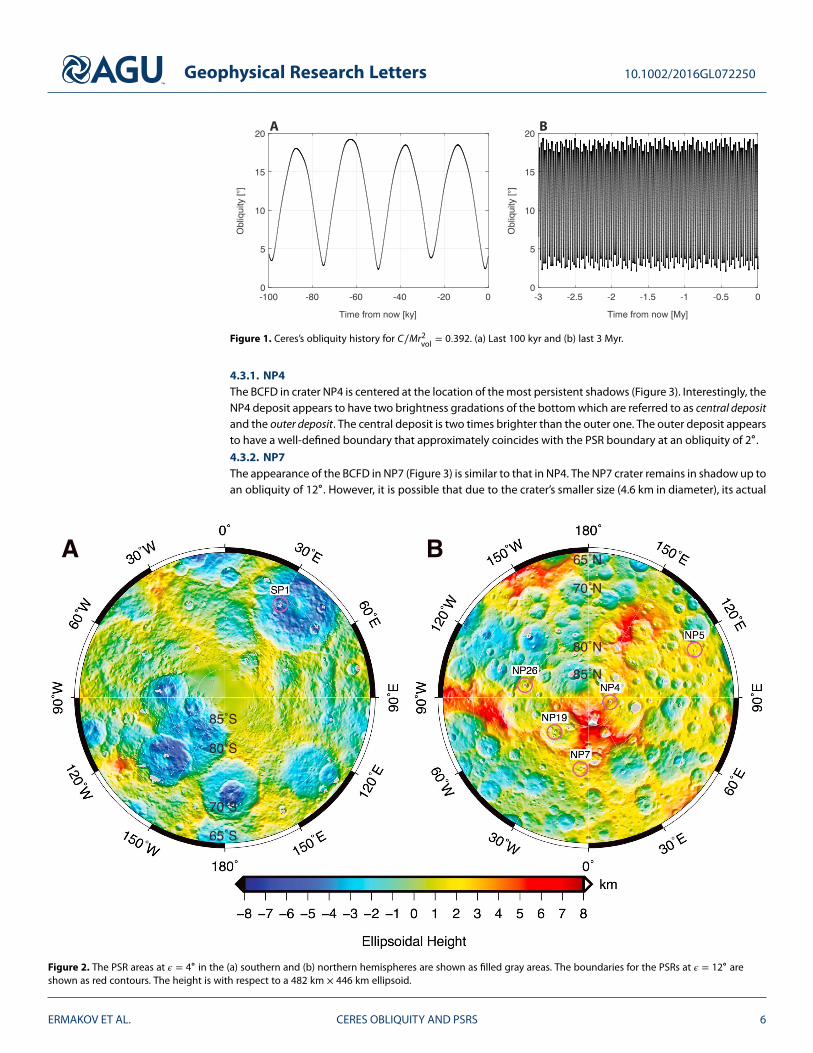
4.2. PSR HistoryThe initial illumination modeling by Schorghofer et al. [2016] revealed dozens of craters hosting PSRs. The totalarea of PSRs is a strong function of the body’s obliquity. As expected, the total area in permanent shadowdecreases at larger obliquity. Illumination simulations performed over a range of obliquities (2∘–20∘) indicatea reduction in PSR area from ≈3400 km2 at 𝜖 = 2∘ to only ≈1.6 km2 at 𝜖 = 20∘.
In the northern hemisphere (Figure 2a), we find that only two crater floors remain partly in permanent shadowat 𝜖 = 20∘: NP4 and NP26. The numbering of craters here refers to their entry in a catalog that is yet to bepublished. Figure 3 shows the shrinking outlines of PSRs as obliquity increases. Among the other identifiednorthern BCFDs, NP7 and NP19 maintain an area of permanent shadow up to 𝜖 = 12∘, while NP5 is likely toosmall (≈3.5 km in diameter) to be resolved by the DTM with confidence.
In the southern hemisphere, we find that part of the floor of crater SP1 remains in permanent shadow at𝜖max. Although we did not identify other areas in permanent shadow at 𝜖max, due to severe DTM artifacts nearthe south pole (Figure 2b), it is an intriguing fact that SP1 is the only such example in our results. The othersouthern bright deposit (SP2) is inside a very small crater (≈2.2 km in diameter), below what the DTM canconfidently model. Both NP4 and SP1 are 6–7 km craters with steep walls (≈ 40∘–45∘ slope), the primaryreason for the persistence of their shadowed floor at high obliquity.
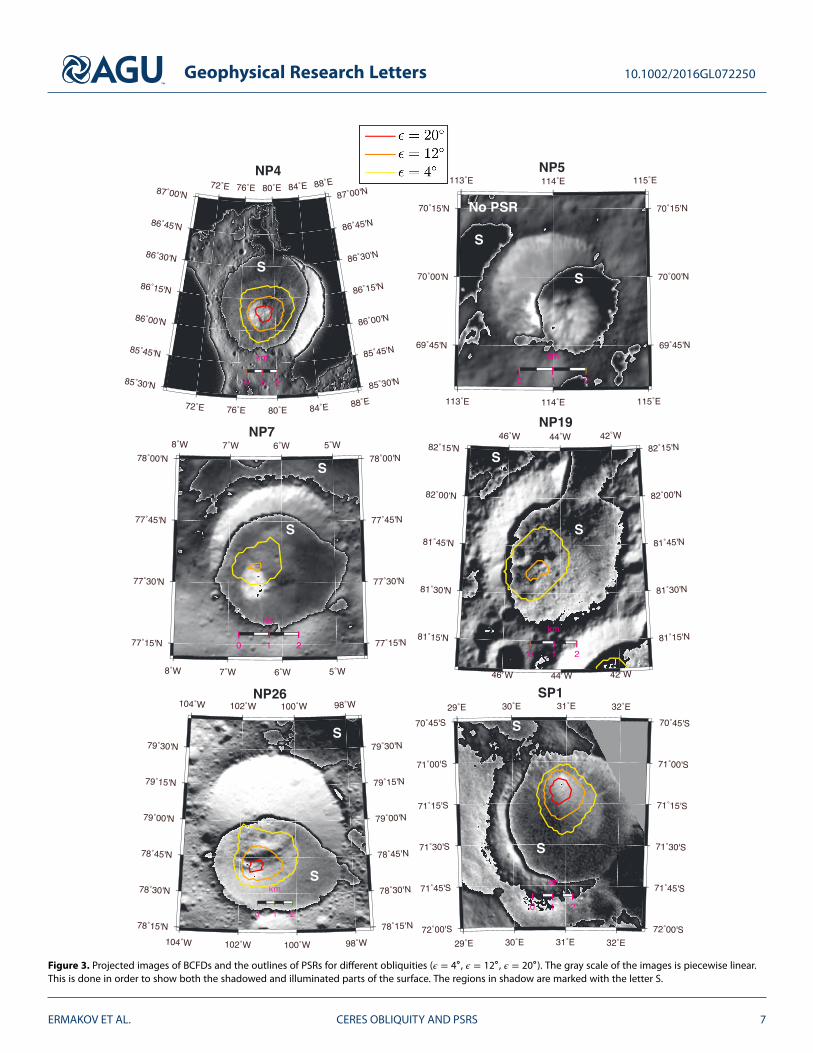
4.3. Relationship of Persistent PSRs and BCFDsWe find a possible connection between the most persistent PSRs, i.e., regions that stay in permanent shadowat 𝜖 = 𝜖max and BCFDs. Figure 3 shows polar stereographic projections of FC images containing BCFDs andthe outlines of PSRs computed using illumination modeling for various 𝜖.
ERMAKOV ET AL. CERES OBLIQUITY AND PSRS 5
Geophysical Research Letters 10.1002/2016GL072250
Figure 1. Ceres’s obliquity history for C∕Mr2vol
= 0.392. (a) Last 100 kyr and (b) last 3 Myr.
4.3.1. NP4The BCFD in crater NP4 is centered at the location of the most persistent shadows (Figure 3). Interestingly, theNP4 deposit appears to have two brightness gradations of the bottom which are referred to as central depositand the outer deposit. The central deposit is two times brighter than the outer one. The outer deposit appearsto have a well-defined boundary that approximately coincides with the PSR boundary at an obliquity of 2∘.
4.3.2. NP7The appearance of the BCFD in NP7 (Figure 3) is similar to that in NP4. The NP7 crater remains in shadow up toan obliquity of 12∘. However, it is possible that due to the crater’s smaller size (4.6 km in diameter), its actual
Figure 2. The PSR areas at 𝜖 = 4∘ in the (a) southern and (b) northern hemispheres are shown as filled gray areas. The boundaries for the PSRs at 𝜖 = 12∘ areshown as red contours. The height is with respect to a 482 km × 446 km ellipsoid.
ERMAKOV ET AL. CERES OBLIQUITY AND PSRS 6
Geophysical Research Letters 10.1002/2016GL072250
Figure 3. Projected images of BCFDs and the outlines of PSRs for different obliquities (𝜖 = 4∘, 𝜖 = 12∘ , 𝜖 = 20∘). The gray scale of the images is piecewise linear.This is done in order to show both the shadowed and illuminated parts of the surface. The regions in shadow are marked with the letter S.
ERMAKOV ET AL. CERES OBLIQUITY AND PSRS 7
Geophysical Research Letters 10.1002/2016GL072250
depth is greater than the depth derived from the HAMO DTM, and thus, it is possible that permanent shadowremains at higher obliquity.4.3.3. NP5The NP5 crater is not permanently shadowed at the resolution of the HAMO DTM, but the shadow-stackingmethod reveals a small PSR [Platz et al., 2017]. The brightness of the BCFD in NP5 is substantially largerthan those of the other BCFDs in this study. Part of the BCFD in NP5 extends out of the shadow on FCimages (Figure 3) and may be water ice from the measurements of the Visible and Infrared Spectrometer (VIR)instrument [Platz et al., 2017].
A standard one-dimensional thermal model is used to estimate the sublimation rate of an ice deposit at70∘ latitude [Schorghofer, 2008]. Assuming a Bond albedo of 0.2 and thermal properties appropriate for bulkice, the sublimation rate of ice exposed on the surface is ≈10−3 kg m−2 yr−1 (equivalent to 1 m/kyr). In thiscase the peak temperature is ≈135 K and the mean temperature ≈130 K. For lower thermal inertia, appro-priate if the ice is not in bulk form, the peak temperature would be higher and the sublimation loss faster.This calculation demonstrates that a sunlit macroscopic ice deposit at this latitude must be geologicallyyoung.4.3.4. NP19The NP19 crater remains in shadow at an obliquity of 12∘ (Figure 3). Its bright deposit is qualitatively similar tothe one of NP26 and the outer deposit of NP4. We note that the BCFD inside NP19 has the weakest brightnesscontrast with respect to the surrounding terrain among the deposits considered in this study.4.3.5. NP26The NP26 crater remains in shadow up to the maximum obliquity of 20∘. Its floor deposit is offset from thecrater center and lies partially on the crater wall. The deposit has a sharp and round boundary. There appearsto be no morphological difference in the region covered by the bright deposit compared to the surroundingterrain indicating a small thickness of the deposit. The apparent brightness contrast of the deposit in craterNP26 with respect to the surrounding area is lower than for features NP7, NP5, and the central deposit of NP4.Qualitatively, it is similar to the outer deposit in crater NP4 or to the deposit in NP19.4.3.6. SP1The SP1 crater is one of the two regions in the southern hemisphere that remains in shadow at an obliquityof 20∘. The brightest part of the BCFD corresponds well to the location of the PSR at 𝜖 = 20∘. Further iden-tification of PSRs and BCFDs in the southern polar region will critically depend on the subsequent observingcampaign as the subsolar point moves southward.
5. Discussion
Unlike the Moon or Mercury, Ceres’s obliquity undergoes rapid and large periodic oscillations. The unique setof bright crater floor deposits in Ceres is correlated with the most persistent of PSRs, i.e., the area that remainsin shadow even at the highest obliquity (𝜖max = 19.6∘). In the northern hemisphere, at an obliquity of 20∘, onlytwo PSRs remain, both of which host bright deposits. In the southern hemisphere, despite poorer data fromDawn at the time of writing, there remain two PSRs at an obliquity of 20∘ and one of them has a definite brightdeposit. The second most prominent BCFD in the southern hemisphere is located in a 2 km crater that is notwell resolved in the HAMO shape model.
Craters NP4, NP19, NP26, and SP1 also possess weaker brightness contrast deposits. Interestingly, the bound-aries of those areas approximately correspond to the PSR boundary at the present-day obliquity of 4∘. Wesuggest that this could be due to events of mass wasting that might expose the ground ice. Once the PSRboundary shrinks due to increasing obliquity, these weak deposits are likely to sublimate due to an increasedsolar incidence flux.
A Monte Carlo model of thermal ballistic hops is used to estimate the fraction of water molecules that willultimately fall into cold traps. For present-day Ceres this fraction is 0.14% [Schorghofer et al., 2016]. We carriedout the same type of Monte Carlo calculation for an obliquity of 10∘ and a corresponding PSR area of 167 km2.We find that the fraction trapped is proportional to the PSR area. Hence, the ratio of fraction trapped to thecumulative PSR area, also known as trapping efficiency, is independent of obliquity. This suggests that perma-nent shadow over the entire obliquity history is a necessary condition for the formation of the BCFDs, whichare likely composed of volatiles deposited via the cold trapping mechanism.
ERMAKOV ET AL. CERES OBLIQUITY AND PSRS 8
Geophysical Research Letters 10.1002/2016GL072250
6. Conclusions
We have integrated the obliquity of Ceres over the last 3 Myr for a range of moments of inertia constrainedby the Dawn gravity observations. We found that obliquity undergoes large oscillations with a period of24.5 kyr. Within the range of the Dawn-constrained moments of inertia, our integrations show that obliquityrises to values as high as ≈20∘. At such high obliquity, most of the present-day PSRs receive direct sunlight.However, PSRs still exist at an obliquity of 20∘. We find a correlation between BCFDs and the most persistentPSRs. In the northern hemisphere, we find that only two PSRs remain at 𝜖max; these two PSRs contain BCFDs.In the southern hemisphere, we also find that only one crater with a BCFD remains in shadow at 𝜖max. Theobliquity excursions offer a simple explanation why most of the present-day PSRs lack BCFDs. The location ofBCFDs within persistent PSRs strongly suggests that they consist of volatiles, either water molecules from theexosphere or exposed ground ice.
ReferencesActon, C. H. (1996), Ancillary data services of NASA’s navigation and ancillary information facility, Planet. Space Sci., 44(1), 65–70.Arnold, J. R. (1979), Ice in the lunar polar regions, J. Geophys. Res., 84(B10), 5659–5668.Bills, B. G., and F. Nimmo (2011), Forced obliquities and moments of inertia of Ceres and Vesta, Icarus, 213, 496–509.Bills, B. G., and B. R. Scott (2017), Secular obliquity variations of Ceres and Pallas, Icarus, 284, 59–69.Carry, B., C. Dumas, M. Fulchignoni, W. J. Merline, W. J. Merline, J. Berthier, D. Hestroffer, T. Fusco, and P. Tamblyn (2008), Near-infrared
mapping and physical properties of the dwarf-planet Ceres, Astron. Astrophys., 478, 235–244.Cavanaugh, J. F., et al. (2007), The Mercury Laser Altimeter instrument for the MESSENGER mission, Space Sci. Rev., 131, 451–479.Chabot, N. L., C. M. Ernst, B. W. Denevi, J. K. Harmon, S. L. Murchie, D. T. Blewett, S. C. Solomon, and E. D. Zhong (2012), Areas of
permanent shadow in Mercury’s south polar region ascertained by MESSENGER orbital imaging, Geophys. Res. Lett., 39(9), 1944–8007,doi:10.1029/2012GL051526.
Chabot, N. L., et al. (2014), Images of surface volatiles in Mercury’s polar craters acquired by the MESSENGER spacecraft, Geology, 42(12),1051–1054.
Combe, J.-P., et al. (2016), Detection of local H2O exposed at the surface of Ceres, Science, 353(6303), AAF3010.Deutsch, A. N., N. L. Chabot, E. Mazarico, C. M. Ernst, J. W. Head, G. A. Neumann, and S. C. Solomon (2016), Comparison of areas in shadow
from imaging and altimetry in the north polar region of Mercury and implications for polar ice deposits, In Lunar Planet. Sci. Conf., 47,1134.
Drummond, J., and J. Christou (2008) Triaxial ellipsoid dimensions and rotational poles of seven asteroids from Lick observatory adaptiveoptics images, and of Ceres, Icarus, 197(2), 480–496.
Drummond, J. D., B. Carry, W. J. Merline, C. Dumas, H. Hammel, S. Erard, A. Conrad, P. Tamblyn, and C. R. Chapman (2014), Dwarf planet Ceres:Ellipsoid dimensions and rotational pole from Keck and VLT adaptive optics images, Icarus, 236, 28–37.
Feldman, W. C., S. Maurice, A. B. Binder, B. L. Barraclough, R. C. Elphic, and D. J. Lawrence (1998), Fluxes of fast and epithermal neutrons fromLunar Prospector: Evidence for water ice at the lunar poles, Science, 281(5382), 1496–1500.
Folkner, W. M., J. G. Williams, D. H. Boggs, R. S. Park, and P. Kuchynka (2014), The planetary and lunar ephemerides DE430 and DE431,Interplanet. Netw. Prog. Rep., 196, 1–81.
Hapke, B. (1981), Bidirectional reflectance spectroscopy: 1. Theory, J. Geophys. Res., 86(B4), 3039–3054.Hapke B. (2012), Theory of Reflectance and Emittance Spectroscopy, 472 pp., Cambridge Univ. Press, Cambridge, New York.Hayne, P. O., and O. Aharonson (2015), Thermal stability of ice on Ceres with rough topography, J. Geophys. Res. Planets, 120(9), 1567–1584.Jakosky, B. M., and R. J. Phillips (2001), Mars’ volatile and climate history, Nature, 412(6843), 237–244.Jakosky, B. M., R. M. Haberle, and R. E. Arvidson (2005), The changing picture of volatiles and climate on Mars, Science, 310(5753),
1439–1440.Laskar, J., A. C. M. Correia, M. Gastineau, F. Joutel, B. Levrard, and P. Robutel (2004), Long term evolution and chaotic diffusion of the
insolation quantities of Mars, Icarus, 170(2), 343–364.Mazarico, E., G. A. Neumann, D. E. Smith, M. T. Zuber, and M. H. Torrence (2011), Illumination conditions of the lunar polar regions using
LOLA topography, Icarus, 211(2), 1066–1081.Moores, J. E. (2016), Lunar water migration in the interval between large impacts: Heterogeneous delivery to permanently shadowed
regions, fractionation, and diffusive barriers, J. Geophys. Res. Planets, 121(1), 46–60.Neumann, G. A., et al. (2013), Bright and dark polar deposits on Mercury: Evidence for surface volatiles, Science, 339(6117), 296–300.Paige, D. A., et al. (2010), Diviner lunar radiometer observations of cold traps in the Moon’s south polar region, Science, 330(6003), 479–482.Park, R. S. et al. (2016), A partially differentiated interior for (1) Ceres deduced from its gravity field and shape, Nature, 537, 515–517.Platz, T. et al. (2017), Into darkness: Ice deposits in Ceres’ northern permanent shadows, Nat. Astron., 1, 0007.Prettyman, T. H., et al. (2016), Extensive water ice within Ceres’ aqueously altered regolith: Evidence from nuclear spectroscopy, Science,
doi:10.1126/science.aah6765.Preusker, F., F. Scholten, K.-D. Matz, T. Roatsch, S. Elgner, R. Jaumann, S. P. Joy, C. A. Polanskey, C. A. Raymond, and C. T. Russell (2015), Shape
Model and Rotational State of Dwarf Planet Ceres From Dawn FC Stereo Images, European Planetary Science Congress, Nantes, France.Preusker, F., F. Scholten, K.-D. Matz, S. Elgner, R. Jaumann, T. Roatsch, S. P. Joy, C. A. Polanskey, C. A. Raymond, and C. T. Russell (2016), Dawn
at Ceres—Shape model and rotational state, in Proceedings of the 47th Lunar Planetary Science Conference, vol. 47, pp. 1954, USRA,Houston, Tex.
Rambaux, N., J. Castillo-Rogez, V. Dehant, and P. Kuchynka (2011), Constraining Ceres’ interior from its rotational motion, Astron. Astrophys.,535, A43.
Russell, C. T., et al. (2016), Dawn arrives at Ceres: Exploration of a small, volatile-rich world, Science, 353(6303), 1008–1010,doi:10.1126/science.aaf4219.
Sanin, A. B., et al. (2012), Testing lunar permanently shadowed regions for water ice: LEND results from LRO, J. Geophys. Res., 117, E00H26,doi:10.1029/2011JE003971.
Schorghofer, N. (2008), The lifetime of ice on main belt asteroids, Astrophys. J., 682(1), 697–705.
AcknowledgmentsWe thank Jack Wisdom for veryinstructive discussions on symplec-tic integrators, Javier Roa for helpingwith implementing relativity, and MattSiegler and an anonymous reviewerfor constructive reviews that helpedto improve the manuscript. Part ofthis research was carried out at theJet Propulsion Laboratory, CaliforniaInstitute of Technology, under a con-tract with the National Aeronauticsand Space Administration.
ERMAKOV ET AL. CERES OBLIQUITY AND PSRS 9
Geophysical Research Letters 10.1002/2016GL072250
Schorghofer, N., E. Mazarico, T. Platz, F. Preusker, S. E. Schroder, C. A. Raymond, and C. T. Russell (2016), The permanently shadowed regionsof dwarf planet Ceres, Geophys. Res. Lett., 43, 6783–6789, doi:10.1002/2016GL069368.
Schröder, S. E., T. Maue, P. Gutiérrez Marqués, S. Mottola, K. M. Aye, H. Sierks, H. U. Keller, and A. Nathues (2013), In-flight calibration of theDawn Framing Camera, Icarus, 226(2), 1304–1317.
Siegler, M. A., B. G. Bills, and D. A. Paige (2011), Effects of orbital evolution on lunar ice stability, J. Geophys. Res., 116, E03010,doi:10.1029/2010JE003652.
Siegler, M. A., B. G. Bills, and D. A. Paige (2013), Orbital eccentricity driven temperature variation at Mercury’s poles, J. Geophys. Res. Planets,118(5), 930–937, doi:10.1002/jgre.20070.
Siegler, M. A., D. A. Paige, J.-P. Williams, and B. G. Bills (2015), Evolution of lunar polar ice stability, Icarus, 255, 78–87.Siegler, M. A., R. S. Miller, J. T. Keane, M. Laneuville, D. A. Paige, I. Matsuyama, D. J. Lawrence, A. Crotts, and M. J. Poston (2016), Lunar true
polar wander inferred from polar hydrogen, Nature, 531(7595), 480–484.Sierks, H., et al. (2011), The Dawn framing camera, Space Sci. Rev., 163(1–4), 263–327.Skoglöv, E., P. Magnusson, and M. Dahlgren (1996), Evolution of the obliquities for ten asteroids, Planet. Space Sci., 44(10), 1177–1183.Slade, M. A., B. J. Butler, and D. O. Muhleman (1992), Mercury radar imaging: Evidence for polar ice, Science, 258, 635–635.Snyder, J. R. (1982), Map projections used by the US Geological Survey, Tech. Rep., U.S. Gov. Print. Off.Thomas, P. C., J. W. Parker, L. A. McFadden, C. T. Russell, S. A. Stern, M. V. Sykes, and E. F Young (2005), Differentiation of the asteroid Ceres as
revealed by its shape, Nature, 437, 224–226.Touma, J., and J. Wisdom (1994), Lie-Poisson integrators for rigid body dynamics in the solar system, Astron. J., 107, 1189–1202.Tricarico, P. (2014), Multi-layer hydrostatic equilibrium of planets and synchronous moons: Theory and application to Ceres and to solar
system moons, Astrophys. J., 782(2), 99.Ward, W. R. (1975), Past orientation of the lunar spin axis, Science, 189(4200), 377–379.Watson, K., B. C. Murray, and H. Brown (1961), The behavior of volatiles on the lunar surface, J. Geophys. Res., 66(9), 3033–3045.Wisdom, J., and M. Holman (1991), Symplectic maps for the n-body problem, Astron. J., 102, 1528–1538.Zuber, M. T., and D. E. Smith (1997), Topography of the lunar south polar region: Implications for the size and location of permanently
shaded areas, Geophys. Res. Lett., 24(17), 2183–2186.Zuber, M. T., et al. (2012), Topography of the Northern Hemisphere of Mercury from MESSENGER laser altimetry, Science, 336(6078),
217–220.
ERMAKOV ET AL. CERES OBLIQUITY AND PSRS 10