Embed Size (px)
Citation preview
Warwick Economics Research Papers
ISSN 2059-4283 (online)
ISSN 0083-7350 (print)
Cereals, Appropriability and Hierarchy
Joram Mayshar, Omer Moavz, Zvika Neeman
& Luigi Pascali
October 2016 No: 1130
Cereals, Appropriability and Hierarchy�
Joram Mayshary Omer Moavz Zvika Neemanx Luigi Pascali{
August 23, 2016
Abstract
We propose that the development of social hierarchy following the Neolithic Revolution was
due to the ability of the emergent elite to appropriate crops from farmers, rather than a result
of increased productivity, as usually maintained. Since cereals are easier to appropriate than
roots and tubers, we argue that regional variations in the suitability of land for the cultivation of
these di¤erent crop types can account for di¤erences in the formation of hierarchies and states.
Our empirical investigation supports a causal e¤ect of the cultivation of cereals on hierarchy,
and the lack of a similar e¤ect of land productivity.
Keywords: Geography, Hierarchy, Institutions, State Capacity
JEL Classification Numbers: D02, D82, H10, O43
�We would like to thank Daron Acemoglu, Alberto Alesina, Yakov Amihud, Josh Angrist, Quamrul Ashraf, DavidAtkin, Simcha Barkai, Sascha Becker, Davide Cantoni, Ernesto Dal Bo, Carl-Johan Dalgaard, James Fenske, RaquelFernandez, Oded Galor, Eric Ginder, Paola Giuliano, Stephen Haber, Naomi Hausman, Victor Lavy, Andrea Ma-tranga, Stelios Michalopoulos, Suresh Naidu, Nathan Nunn, Omer Ozak, Joel Slemrod, Fabio Schiantarelli, UweSunde, Jim Robinson, Yona Rubinstein, Felipe Valencia, Tom Vogl, Joachim Voth, John Wallis and David Weil foruseful comments. We are also grateful for comments from participants in seminars: Berkeley-Haas, Berlin SFB-seminar, Birmingham, Boston University, Columbia, Harvard, Hebrew University, IDC, Manchester, Pompeu FabraUniversity, Stanford, Tilburg, University College of London/London School of Economics, and Yale; and conferences:INET mini-conference, Cambridge, June 2014, CEPR Public Economics Annual Symposium, Warwick, December2014, Deep-rooted Factors in Comparative Economic Development, Brown University, May 2015, Summer Work-shop in Economic Growth, Warwick, July 2015, BREAD/NBER conference, Cambridge MA, September 2015, XIIannual conference of the Colombian Central Bank�s journal, Bogota, October 2015, CEPR-Development Workshop,Barcelona, October 2015, Institutions Culture and Long-run Development, LMU Munich, November 2015, NBER Po-litical Economy, April 2016, NBER Income Distribution and Macroeconomics, July 2016, Warwick Economic HistoryWorkshop, July 2016, and 20th Anniversary Conference - Economics at Royal Holloway, July 2016.
yDepartment of Economics, Hebrew University of Jerusalem. Email: [email protected] of Economics University of Warwick, School of Economics Interdisciplinary Center (IDC) Herzliya,
CAGE and CEPR. Email: [email protected]; Moav�s research is supported by the Israel Science Foundation(Grant No. 73/11).
xEitan Berglas School of Economics, Tel-Aviv University, Email: [email protected]{Pompeu Fabra University, University of Warwick and CAGE. Email: [email protected]
1 Introduction
The transition to agriculture (also known as the Neolithic Revolution) led to profound social
changes. Hierarchies and city-states emerged, leading to the development of the great civiliza-
tions of antiquity. In Egypt, for example, state hierarchy grew rapidly following the adoption of
farming in the Nile Valley. The construction of the great pyramids in the third millennium BCE,
illustrates the resulting high state capacity. Other regions of the world, however, followed a very
di¤erent path: no state institutions emerged in New Guinea, even though agriculture was adopted
there at about the same time as in Egypt.1
We o¤er an explanation for this disparity. We posit that the key factor for the emergence
of hierarchy was the ability of the elite to appropriate food crops from farmers. Thus, regional
variations in the suitability of land for roots and tubers, which are less appropriable, or cereals,
which are more appropriable, can account for di¤erences in the formation of hierarchy and related
state institutions.
Our proposed mechanism pertains not only to antiquity, but also to agricultural-based societies
in the pre-industrial era. Moreover, since the modern transition away from agriculture is protracted,
and since social institutions exhibit signi�cant inertia, our theory may contribute to the explanation
for persistent di¤erences in current institutions, and towards understanding the root-causes for the
underdevelopment of tropical regions that su¤er from malfunctioning governments.2
In the existing literature, it is generally argued that high farming productivity explains the
emergence of hierarchy. High productivity generated a food surplus, which facilitated, through
various channels, the emergence of a non-food producing elite. Diamond (1997), for example,
attributes the relative backwardness of New Guinea to its low land productivity relative to Eurasia.
We propose that, rather than productivity and surplus, it is the ability to appropriate that
explains the emergence of hierarchy.3 Consider a farming community that cultivates cassava, with
1According to Denham (2011), systematic cultivation of bananas, taro and yam in New Guinea occurred ca.5000-4500 BCE.
2Bockstette, Chanda and Putterman (2002), Gennaioli and Rainer (2007), Spolaore and Wacziarg (2013), andMichalopoulos and Papaioannou (2013, 2014) demonstrate that deep rooted pre-colonial institutions a¤ect currentinstitutions and economic outcomes.
3We note that the gradual increase in productivity among hunter-gatherers, due to improved hunting techniquesand learning by doing, was apparently translated in its entirety to an increase in population density, without leadingto surplus or to hierarchy. Since the Neolithic Revolution occurred over several millennia (see Purugganan and Fuller,2010), along Malthusian lines one could expect that also this gradual increase in productivity could have been easily
1
annual output above subsistence. Cassava is a perennial root that can be harvested year-round
and rots shortly after harvest. It is, therefore, practically impossible to transport cassava for
consumption by a distant elite, its dependents or its military.4 It is thus unlikely that a complex
hierarchy could emerge, despite the availability of food surplus: surplus would simply lead to an
increase in population.
Consider another farming community that grows a cereal grain with no surplus, where each
family�s annual produce equals its subsistence needs. Since the grain has to be harvested within
a short period and then stored, a visiting tax collector could readily con�scate part of the stored
produce. The durability of these cereal grains makes them well suited for transport for the use
of a distant elite. Such ongoing con�scation is expected to adversely impact population size, and
due to diminishing average product of labor, it will result in total output exceeding the farming
population�s subsistence needs. The resulting farming surplus is con�scated by the non-farming
elite.
The �rst scenario highlights that had the Neolithic amounted to a transition to the cultivation
of roots and tubers only, based on Malthusian considerations the increase in productivity would
have been absorbed by increased population. The second scenario demonstrates that surplus isn�t
a necessary precondition for taxation. It was the elite itself, we argue, that created the food surplus
on which it could survive, once the opportunity to con�scate arose.5 Thus, according to our theory,
it is the ability to appropriate that explains the emergence of both the elite and farming surplus.
Surplus, in contrast to conventional theory, was not a precondition for hierarchy.
According to our �appropriability�mechanism, the emergence of hierarchy is explained by the
vulnerability of the cultivated crops to con�scation.6 Due to increasing returns to scale in the
dissipated through increased population. Ashraf and Galor (2011) support the applicability of Malthus�s theory bydemonstrating that technological improvements before the Industrial Revolution had a positive e¤ect on populationsize but no e¤ect on long run per capita income.
4 In Appendix A we document these characteristics of cassava and of other roots and tubers. Portability of thesecrops is hampered also by their bulkiness (due to ca. 70% moisture content) and their vulnerability to spoilage. Wesupport there also our various claims: (i) that reliance on roots and tubers is a major phenomenon in tropical regions;(ii) that roots and tubers are highly productive in the tropics; (iii) that their harvest is in general non-seasonal; and(iv) that after harvest they are signi�cantly more perishable than cereals.
5 In reality, as in our model below, stored grains are vulnerable to predation not only by tax collectors but also bybandits. If the government employs some of the tax revenue to protect farmers from bandits, it may in fact facilitatea larger population than under banditry (see the model in Appendix C, where we allow for endogenous population).
6 In addition to their vulnerability to appropriation due to the need of storing grains, cereal producers are vulnerablealso to extortion since the long gestation in the �eld exposes farmers to the threat of arson, and to the possibility
2

provision of protection, early farmers had to cooperate in order to defend their grains. Once
the group size exceeded a few dozen immediate kin, it is unlikely that those who sought security
were as forthcoming in �nancing the protection services they desired. This public-good nature of
protection was overcome by the opportunity that stored cereals provided for the elite to appropriate
the necessary means. In other words, we propose that the transition to cultivating cereals, created
both a demand for protection and the means for providing it. Thus, once the opportunity to
expropriate arose, it led to the emergence of complex and hereditary social hierarchy, and eventually
the state.
The simplest evidence in support of our theory is that all agriculture-based states, with complex
hierarchy, that we know of in human history relied on cereals. The non-emergence of complex
hierarchy among hunter-gatherers and among farming societies that did not rely on cereals, we
argue, was not because they lived at subsistence, but rather because their staple food was not
easily expropriated to feed a would-be elite. That is, we suggest that the fundamental cause for
New Guinea�s low level of social complexity and for its economic underdevelopment is that farming
there relied mostly on tubers (yam and taro, and, since the 17th century, sweet potatoes), for which
long-term storage is neither feasible (due to perishability) nor necessary (due to non-seasonality).
Farmers�ability to cultivate highly productive crops, that are practically non-appropriable, inhibits
both the demand for socially-provided protection and the emergence of protection-providing elite.
It is a curse of plenty.
In our formal model a �xed number of farmers can allocate their land between two crops,
which we label cereals and tubers.7 The productivity of the two crops is presumed to di¤er across
geographic locations. We assume that it is possible to tax cereals, though at some cost. For
simplicity, we assume that it is impossible to con�scate or tax tubers. As a result, cereals are
cultivated only if their productivity advantage over tubers is su¢ ciently high to compensate for
taxation by the state or the risk of loss to bandits.
that violence could be used to deny access to land or water.7For the sake of simplicity, we do not consider the decision to farm or to forage, nor do we allow for endogenous
population size. For brevity, we often refer to tubers only, even when implying also roots. What we are really afteris a distinction among crops according to their degree of appropriability. We are aware that potatoes for example,have been freeze dried in ancient Peru, and are altogether somewhat storable and not a tropical crop. We also ignoreother important food plants such as fruits, vegetables and legumes, and also the role of livestock. To the extent thatthese are not easily appropriable, we would lump them with tubers.
3
In the �anarchy� regime, we assume that non-farmers can be bandits or foragers. Since we
assume that bandits are unorganized and cannot credibly commit, their number is determined
endogenously, such that the average revenue from theft is equal to the alternative productivity
in foraging. The probability that cereals would be stolen is a function of the number of bandits.
In the alternative �hierarchy�regime, crops are protected from bandits, but a portion is taxed by
the revenue maximizing elite. We assume that the hierarchical elite can commit to any feasible
rate of taxation. To maximize the net tax revenue, the state employs tax collectors such that the
marginal tax revenue is no less than their wage, which equals the alternative income from foraging.
The state will therefore employ (weakly) less tax collectors than the equilibrium number of bandits
under anarchy. Finally, we assume that to be viable and deter bandits, the state incurs some �xed
costs.
The main prediction of the model is that a state cannot exist if tubers are su¢ ciently produc-
tive. The potential tax revenue is insu¢ cient, in this case, to cover the �xed cost of forming a
government. This result illustrates our claim that it is the relatively high productivity of more
appropriable cereals, rather than high agricultural productivity per se, that facilitates the devel-
opment of hierarchy. The model also suggests that, even though the elite is self-serving, whenever
hierarchy exists, it dominates anarchy in welfare terms. As a result, cereal based farming, which
renders farmers vulnerable to taxation, leads not only to the development of a state, but contributes
also to farmers�welfare. Anarchy is more distortionary than hierarchy for two reasons: First, the
state�s ability to commit to a lower tax rate that encourages the cultivation of cereals when these
are more productive; Second, since the state employs fewer tax collectors than the equilibrium
number of bandits under anarchy, the forgone output loss in foraging (due to banditry or to tax
collection) is higher under anarchy.8
In our empirical investigation we �nd a positive e¤ect of cereal farming on hierarchy, and
no such e¤ect for land productivity. These result are obtained from two alternative datasets with
information on social hierarchy: a cross section of societies and a panel of countries. In both cases we
use the productivity advantage of cereals over roots and tubers as an instrument for cereal farming.
For our cross section analysis we use Murdock�s (1967) Ethnographic Atlas on cultural, institutional
8We ignore the possibility that the non-benevolent state may contribute further to farmers�welfare, if it contributesdirectly to agricultural productivity, for example through publicly provided irrigation or the importation of betterfarming techniques.
4

and economic features of 1,267 earlier societies from around the world. For our panel data we use
the dataset compiled by Borcan, Olsson and Putterman (2014), which is based on present-day
boundaries of 159 countries, over the last millennium. We exploit the �Columbian exchange�as a
natural experiment for changes in land productivity and in the productivity advantage of cereals
over roots and tubers.
In the next section we review the most pertinent literature. Our model is presented in section
3, and our main empirical results are presented in section 4, where multiple robustness checks are
reported in Appendix E. Section 5 concludes.
2 Archeological Evidence and Related Literature
In this section we examine relevant archaeological evidence on the earliest transition to agriculture,
and survey related literature that distinguishes between crop types or considers aspect of appro-
priability. Additional theories that correlate between the Neolithic revolution and hierarchy are
reviewed in Appendix B.9
Archaeological evidence in the form of dwellings, sickles, grinding stones and storage facilities
con�rm the idea that the transition to cereal farming was correlated with communal storage and
with the emergence of hierarchy. The earliest phase of the transition to agriculture in the Near
East is known as the (late) Natu�an Age (ca. 12,500-9,500 BCE). Foragers at that time adopted
semi-sedentary living and relied in part on collecting wild cereals. However, they did not yet
cultivate cereals, which would have required storage.10 Cereal cultivation by farmer-foragers took
place in the next developmental phase, known as Pre-Pottery Neolithic A (PPNA, ca. 9500-8500
BCE). Kuijt and Finlayson (2009) report an important archeological discovery from about 9000
BCE, of a large and elaborate communal storage pit in the Jordan Valley. This reveals that
storage was an integral part of the earliest phase of the transition to cereal farming, when wild
9Thus, even though we incorporate predation by non-farmers, we refer to the literature on con�ict between earlyfarmers and non-farmers in Appendix B �see recently Boix (2015), Dal Bó, Hernández and Mazzuca (2015) and Dowand Reed (2013).10Kuijt (2008) and Price and Bar-Yosef (2010) point out the limited archeological evidence for storage facilities
from the Natu�an age. Goring-Morris and Belfer-Cohen (2011, p. S200) note that there is no evidence that theNatu�ans engaged in intentional plant cultivation. The Natu�ans apparently did not attempt to store grain over thewinter, which would have necessitated more permanent, covered and plastered storage facilities to protect the storedgrain from spoilage by moisture, insects or rodents.
5
grains were collected on a large scale and then sown, still without attempts at domestication. This
evidence also indicates social cooperation and organization, which we interpret as evidence that
hierarchy, developed alongside the gradual intensi�cation of cereal farming and its concomitant
storage, rather than that hierarchy followed the transition to agriculture (including domestication)
and the presumed availability of surplus.11
Our proposed appropriability theory was anticipated to a substantial extent by Taylor (1973)
and Testart (1982a, 1982b, 1982c). In a brief and neglected contribution, Taylor contended that
the Neolithic revolution ought to be called the �storage revolution.�He argued that the cultivation
of grains enabled storage, and introduced a threat of theft. He deduced that this pressure forced
the incipient agriculturist, as well as hunter-gatherers who practiced storage, into sedentism and
to �social control that would assure the horde to its rightful owner,�and thus contributed to �the
very foundation of civilization.�
Testart summarizes extensive anthropological evidence from hunter-gathering societies about
a positive association between social inequality and the prevalence of storage of seasonal food
sources. His main focus was on early Native Americans in the Paci�c Coast of California who relied
on seasonal acorns and dried salmon. Testart argued that these societies exhibited inegalitarian,
complex social structures similar to those of early cereal farming societies, and attributed the
similarity to their reliance on sedentism and storage. Testart brie�y dealt also with agricultural
societies and clearly distinguished among them between those based on cereals and those based on
tubers (1982a, pp. 195-204), suggesting that farming societies that rely on tubers and do not store
remain more egalitarian. But his (1982c) unsatisfactory attempt to support this idea empirically,
using data from the Ethnographic Atlas (see Section 4) led him to conclude by giving priority to
sedentism as the more robust correlate of social inequality, rather than to storage. Our current
study complements these seminal contributions. Unlike Testart, our subject matter is hierarchy,
rather than inequality. In addition, whereas Testart vacillated with regard to the causal mechanism
that relates storage to inequality, we argue for a speci�c mechanism by which food storage creates
vulnerability to expropriation, leading to a demand for protection, and simultaneously facilitating
11Somewhat similar large round pits from PPNA were found elsewhere in the Jordan valley and in several sites nextto the Euphrates (Mithen et al. 2011; Willcox and Strodeur 2012). These pits are identi�ed as communal structures,serving both for storage and as communal meeting places, possibly for ritual ceremonies.
6
its supply by the emergent elite.12
Tushingham and Bettinger (2013) follow up in seeking to explain why early aboriginal Californi-
ans preferred to store acorns, rather than salmon, despite salmon�s signi�cant nutritional advantage.
They resolve this puzzle by applying Bettinger�s (1999) distinction between back-loaded and front-
loaded food resources, according to which, acorns are back-loaded since their procurement and
storage involves little e¤ort, while their preparation for consumption is very costly, while salmon is
front loaded since an opposite cost pattern holds.13 Tushingham and Bettinger argue that back-
loaded resources o¤ered earlier foragers the advantage of a lower probability of loss of caches due to
pillage. They identify the key detriment to reliance on stored salmon as: �the possibility that others
will rob caches, which mobile foragers are not positioned to protect�(p. 533). In addition to the
increased vulnerability of front-loaded sources to theft, they are subject also to loss to �freeloaders�
from the inside (p. 534). The authors suggest that the late and rather abrupt transition to salmon
intensi�cation among aboriginal Californians occurred once a community reached a threshold size
that facilitated on-going protection of the stored dried salmon. That transition coincided with the
emergence of permanent villages and with the appearance of plank houses that also functioned as
storage facilities.14 Tushingham and Bettinger do not mention hierarchy or agriculture, but the
evidence that they examine and their analysis are perfectly consistent with our appropriability
theory and with our proposed mechanism by which vulnerability to appropriation leads to social
hierarchy in cereal-dependent farming societies.15
Anthropologists who seek to explain the emergence of hierarchy as related to the increased
12Testart too mentioned vulnerability to theft: �stored food is the primary object of raids, and it may be stolen,monopolized by men of high status, or made the subject of rent or tribute� (1982b, p. 527; 1982c, p. 351). Butin reference to Taylor, he explicitly denied the need to protect stockpiles against theft, arguing that social norms ofreciprocity among foragers preclude theft (1982a, p. 31). In fact, in addition to storage and sedentism, he refers alsoto all the �usual suspects�in the anthropological literature for explaining the emergence of inequality including: highpopulation density, trading activity, prestige, and altered ideology.13Woodburn (1980) o¤ered a somewhat related distinction between delayed return and immediate return food
procuring strategies.14A vivid eye-witness depiction of these villages is available in Cook�s account of his voyages in the eastern shores
of the Paci�c Ocean (1784, volume II, book IV).15Chiwona-Karltun et al. (2002) provide an anecdotal illustration of the appropriability theory in a farming setting.
They report that women in modern Malawi, and particularly single women, prefer to grow bitter and toxic cassavavariants even though these variants require signi�cantly more post-harvesting processing. This pattern is explainedas due mostly to the advantages of this extra post-harvest drudgery, which protects these women against thievery,since thieves prefer the non-bitter variant. A Malawian women is quoted: �We grow bitter, toxic cassava because itgives a certain level of food security. If we are to grow sweet cassava, look at our neighbors! Their whole �eld washarvested by thieves while they slept and now they have no food. Nobody wants to die from hunger.�
7
productivity of farming often distinguish between horticulture and agriculture. The former is
typically identi�ed with cultivation in small-scale �gardens�with hand-held tools, and the latter is
de�ned as employing intensive cultivation, often with the aid of irrigation, the plow, and animal
power. Horticulture-based societies are claimed to be associated with low levels of social complexity,
and to form a preliminary developmental stage to more productive agriculture which is associated
with more complex, hierarchical societies (see Lenski, 1966; Johnson and Earle 2000). From our
perspective, though, it isn�t the employment of more intensive farming techniques that is the source
of greater social complexity, but rather the greater appropriability of the cultivated crops. We note
also that horticulture typically involves the cultivation of less appropriable crops, and occurs in
the tropics or semi-tropics, and that as such its adoption should be considered as a long-term
equilibrium, rather than as a stage in the transition to agriculture, which is almost invariably
associated with the cultivation of appropriable cereals.
In a related theory, Scott (2009) explains why states emerged in South East Asia only in the
river valleys and not in the highlands by claiming that the tribal hill people were able to resist
subjugation by states through adopting foraging and shifting agriculture (another common trait
associated with horticulture). According to Scott, states emerged in the lowlands because the
option of relying on similar modes of food procurement was not open there, and the cultivation of
appropriable rice was the norm.16
Using a somewhat analogous distinction to that between horticulture and agriculture (and an
empirical approach similar to the one we follow), Alesina, Giuliano and Nunn (2013) distinguish
between regions where farmers used handheld tools like the hoe and the digging stick and regions
where cereal farmers prepare the soil by employing the plow. They argue that plow-using generated
greater gender inequality, and show that it impacted current perceptions of gender roles.
In another related study, Nunn and Qian (2011) show that the adoption of the potato in Europe
led to population growth and substantial social changes. They argue that these changes were due
to the higher caloric yield of the potato in regions that are highly suitable for its cultivation. Our
16Alongside the similarities, there are many di¤erences between Scott�s approach and ours. His key distinctionsrelate to geographic elevation: between hill and valley people, and to the form of cultivation: sedentary vs. shifting,rather than to the choice of the cultivated crop. While his theory may be applied to regions other than South EastAsia, it fails totally in the case of South America, where the Incas had a powerful state in the mountains, while nomajor states emerged in the Amazon valleys.
8
perspective leads us to o¤er a complementary mechanism whereby European farmers adopted the
potato because it provided them with greater immunity against taxation/theft, and this resulted
in growth of the farming population. Consistently with this mechanism, Mcneill (1999, pp 71-72)
reports that European farmers long resisted adopting the potato after it reached Europe in the
mid-sixteenth century. He reports also that during the Dutch Wars in 1557-1609, �villagers along
the route [of the Spanish army] swiftly discovered that by leaving the tubers in the ground and
digging them only as needed for their own consumption, they could safely survive even the most
ruthless military requisitioning. Foraging parties were unwilling to dig for their food when stores
of grain were available in barns.�
Similarly, Wiessner and Tumu (1998) report how the sweet potato rapidly became the staple
crop in the rugged highlands of New Guinea after it was introduced some 300 years ago, following
the Columbian Exchange. Its adoption increased land productivity and generated surplus; but
this surplus was transformed into prestige goods (like slaughter of pigs in communal festivals) and
substantial population growth, leaving the highland population fractured, characterized by endemic
tribal warfare, without any consolidation of power or signi�cant increase in social complexity.
In a related study to the present one, Mayshar, Moav and Neeman (2013) distinguish between
areas where farming is more transparent and areas of lower transparency. They associate such
transparency to appropriability and claim that the capacity of earlier states to tax depended on
the transparency of farming, thus o¤ering an alternative link between geographic attributes and
the viability of statehood.17
Finally, given our focus on the distinction between tropical and temperate crops, we note that
ever since Montesquieu (1748, book 14) asserted that the tropics were backward because people in
hot climates tend to be timid and lazy, many scholars (including Diamond, 1997) sought to explain
what lies behind the relative underdevelopment of tropical countries.18
17 In another application of the appropriability approach, de la Sierra (2013) employs evidence from the miningregions of the Democratic Republic of Congo to show that a rise in the price of the substance coltan that is producedfrom bulky and transparent ores led to the monopolization of power and the cessation of con�ict between rival armedgroups in the coltan rich regions; whereas an increase in the price of gold, which is easier to conceal and is henceless transparent, did not. Similarly, Buonanno et al. (2015) show the e¤ect of a rise in the price of sulphur on theemergence of the Sicilian Ma�a.18Sachs, Mellinger and Gallup, (2001), Olsson and Hibbs (2005) and Spolaore and Wacziarg (2013) provide empirical
attempts to links income per capita across countries with geographic variables. Nowadays, two main features of thetropics are typically argued to have impeded its development: low agricultural productivity and a high burden ofdisease. Weil (2007, 2010) �nds that the e¤ect of health on growth is rather small and cannot explain the extent of
9
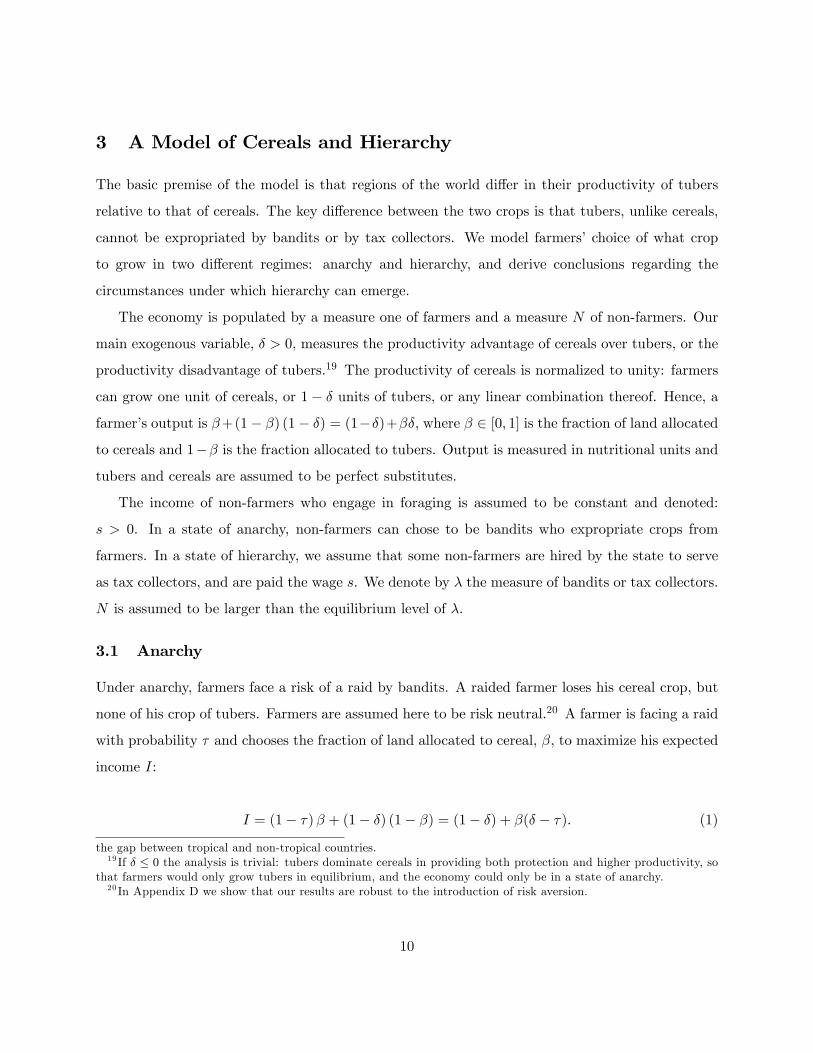
3 A Model of Cereals and Hierarchy
The basic premise of the model is that regions of the world di¤er in their productivity of tubers
relative to that of cereals. The key di¤erence between the two crops is that tubers, unlike cereals,
cannot be expropriated by bandits or by tax collectors. We model farmers�choice of what crop
to grow in two di¤erent regimes: anarchy and hierarchy, and derive conclusions regarding the
circumstances under which hierarchy can emerge.
The economy is populated by a measure one of farmers and a measure N of non-farmers. Our
main exogenous variable, � > 0, measures the productivity advantage of cereals over tubers, or the
productivity disadvantage of tubers.19 The productivity of cereals is normalized to unity: farmers
can grow one unit of cereals, or 1� � units of tubers, or any linear combination thereof. Hence, a
farmer�s output is �+(1� �) (1� �) = (1��)+��; where � 2 [0; 1] is the fraction of land allocated
to cereals and 1�� is the fraction allocated to tubers. Output is measured in nutritional units and
tubers and cereals are assumed to be perfect substitutes.
The income of non-farmers who engage in foraging is assumed to be constant and denoted:
s > 0. In a state of anarchy, non-farmers can chose to be bandits who expropriate crops from
farmers. In a state of hierarchy, we assume that some non-farmers are hired by the state to serve
as tax collectors, and are paid the wage s. We denote by � the measure of bandits or tax collectors.
N is assumed to be larger than the equilibrium level of �.
3.1 Anarchy
Under anarchy, farmers face a risk of a raid by bandits. A raided farmer loses his cereal crop, but
none of his crop of tubers. Farmers are assumed here to be risk neutral.20 A farmer is facing a raid
with probability � and chooses the fraction of land allocated to cereal, �; to maximize his expected
income I:
I = (1� �)� + (1� �) (1� �) = (1� �) + �(� � �): (1)
the gap between tropical and non-tropical countries.19 If � � 0 the analysis is trivial: tubers dominate cereals in providing both protection and higher productivity, so
that farmers would only grow tubers in equilibrium, and the economy could only be in a state of anarchy.20 In Appendix D we show that our results are robust to the introduction of risk aversion.
10
In selecting �, farmers weigh the productivity advantages � of cereals over tubers, against the
disadvantage, as measured by the expropriation rate � .
The rate of expropriation, � ; is a function of the measure of bandits �, � = �(�). We assume that
the function �(�) is strictly increasing and strictly concave, and satis�es: �(0) = 0; lim�&0 � 0(�) =
1; lim�%1 � 0(�) = 0 with lim�%1 �(�) = � � 1.21 The inverse function of � (�) ; denoted by � (�) ;
is therefore strictly increasing, strictly convex, with �(0) = 0; lim�&0 �0 (�) = 0 and lim�%� �0 (�) =
1.
Bandits are identical and uncoordinated (if they coordinate they become the ruling elite and
the economy shifts to the �hierarchy� equilibrium as described in the following section). Thus a
bandit�s expected income � is given by the total amount of cereals con�scated from farmers divided
by the measure of bandits: � = �(�)�=�:
De�nition. Equilibrium consists of a pair (�; �) such that:
1. � maximizes farmers�income I, given the con�scation rate � ;
2. given �, non-farmers are indi¤erent between being foragers or bandits, so that � = s.22
The last condition can be restated as requiring: ��=� (�) = s:
De�ne a threshold rate �A by the implicit relationship:23
�A� (�A)
= s:
�A provides the lower bound for the productivity advantage of cereals above which only cereals
are grown.24
Proposition 1. The economy under anarchy has a unique equilibrium (�A; �A) that is given by:
21Micro-foundation for the shape of �(�) can be obtained by assuming that banditry is time consuming, thatbandits are not coordinated, and thus that as their number increases their marginal theft declines due to increasedprobability of raiding the same farmers.22Our assumptions that lim�&0 �
0(�) =1 guarantee a solution with � > 0:23We use the subscript A to denote parameters and equilibrium values in a regime of anarchy, and similarly use
the subscript H in a state of hierarchy.24Our assumptions on � (�) imply that that �A is well de�ned for every s > 0. �A captures the con�scation rate
that will exist in equilibrium if the option to grow tubers is relevant. Thus, tubers are not grown if � � �A:
11
(�A; �A) =
8>><>>:��(�)s� ; �
�if � < �A
(1; �A) if � � �A
:
Proof. If � > 0; an equilibrium with no cereals (�A = 0) can be ruled out. This is since in that
case � = 0, leading to � = 0 and � = 0, which would lead to � = 1; a contradiction. This implies
that the equilibrium can only be either mixed (0 < �A < 1), where both crops are cultivated; or
one with cereals only (�A = 1).
If � � �A, so that the productivity disadvantage of tubers is su¢ ciently high, farmers culti-
vate only cereals (�A = 1), even though this entails a maximal con�scation rate �A = �A and a
corresponding maximal number of bandits, �(�A).
In the alternative case 0 < � < �A, the productivity disadvantage of tubers is low. Our
assumptions on �(�) imply that the con�scation rate, �(�)=�, or �=�(�), is monotonically decreasing
in � , from in�nity towards zero. Thus, when � < �A, we have: �=�(�) > �A=�(�A) = s. Hence,
there exists a unique �A 2 (0; 1) such that �A � ��A=�(�) = s. The last condition, in conjunction
with the condition �A = �, de�nes the combination (�A; �A) in the mixed equilibrium. �
Income distribution. It follows from Proposition 1 that if cereals�productivity advantage is low
(� < �A) and the equilibrium is therefore mixed, the values of �A, �A and �A = �(�A) tend to zero
when � tends to zero, and are all strictly increasing in �. As a result, also the total expected amount
of cereals con�scated by bandits, �A�A , strictly increase in �. As (1) reveals, farmers�income in
that range is 1 � �, thus decreasing in �. On the other hand, when the productivity advantage of
cereals exceeds the threshold �A, all theses variables become independent of the value of �, with
farmers income equaling 1 � �A. In these two ranges combined, the proposition thus implies that
�A�A, �A and �A are all weakly increasing in �. In turn, even though bandits�welfare is equal to
s independently of the value of �, farmers�welfare weakly decreases with �.
The e¤ect of the reservation income s. The smaller is s, the larger is the incentive for foragers
to engage in banditry. This implies a higher threshold �A, meaning that farmers will raise tubers
in a wider range of �. Thus, for values of � > �A; a lower s reduces farmers�income. However, for
12
� < �A, a smaller s has no e¤ect on farmers income, on � and therefore on �; it will rather reduce
the equilibrium value of �.
Two sources of ine¢ ciency. Denote by Y0 the maximal possible level of output in the economy,
when all farmers cultivate only the more productive cereals (assuming � > 0) and all non-farmers
engage in foraging. This maximal output level is: Y0 = 1 +Ns.
The equilibrium (�A; �A) introduces two deviations from this maximal level of output: the
�rst is due to the possibility that farmers may grow tubers (if their productivity disadvantage is
su¢ ciently small: � < �A); and the other is due to the forgone output by banditry. This means
that equilibrium output is given by:
Y = Y0 � (1� �A) � � s�(�A):
Inspection of the equilibrium values (�A; �A) reveals that for large values of �, the only distortion
is the loss of output due to bandits being unproductive s�A = s�(�A), which equals the threshold
level �A. For small values of �, the mixed equilibrium implies �A = �, which makes farmers
indi¤erent between the two crops. It follows from the fact that expected revenue per-bandit is
equal to �A�A=�(�A) = s that s�(�A) = �A�A, and thus it follows that:
Corollary 1. The output loss (Y0 � Y ) due to an anarchy regime is:
(1� �A) � + �As =
8><>:� if � < �A
�A if � � �A:
3.2 Hierarchy
We assume that in a state of hierarchy the elite (the state) chooses its tax policy to maximize its
revenue net of the cost of tax collection. In order to facilitate comparison between the regimes of
hierarchy and anarchy, we assume that the state has access to the same expropriation technology
as bandits. Namely, the state cannot tax tubers, and if it employs a measure � of tax collectors
at cost s per tax collector, it can generate revenue of �(�)� from the farming sector. In adopting
Weber�s de�nition, we also assume that a state has to be able to deter bandits, and thus has to
13
have monopoly power over the use of force. The use of force required to possess such a monopoly
over the use of force entails �xed cost G0 > 0.
A key advantage that a state has, in comparison to anarchy, is that it is farsighted and organized,
and can thus commit not to expropriate farmers beyond a certain tax rate.25 That is, the state
selects the number of tax collectors to maximize its net revenue, taking into account farmers�
response to the implied tax rate. Farmers� freedom to choose to avoid taxation completely by
cultivating tubers, implies that the state cannot gain from setting a tax rate higher than �. Thus,
the objective of the state is to choose a tax rate � , and thus to hire �(�) tax-collectors at cost
s� (�), to maximize its net revenue, subject to the constraint that farmers respond optimally to
the tax rate:
max��0
R (�) = �� � s� (�) ;
subject to
� = arg max�02[0;1]
�(1� �) + �0(� � �)
:
Since it is evident that � = 0 if � > � and � = 1 if � < �, we assume that � = 1 if � � �,
and note that the state�s problem is in fact to choose � to maximize � � s� (�), subject to � � �.
The optimal tax rate under hierarchy is thus: �H(�) = minf�; �Hg, where �H is the parameter
that solves s�0 (�H) = 1. At the high range of tubers�productivity, where, � < �H , �H = � and
R (�H(�)) = � � s� (�), increases in �. Our assumption that the state is viable only if it sustains
an army at a �xed cost G0 > 0 sets a lower limit on net revenue. Thus we assume that these
�xed costs are low enough to satisfy: R (�H(�H)) > G0. We also de�ne then the viability threshold
� < �H , such that: R (�H(�)) = G0.
We have thus established:
Proposition 2. (i) If � is small ( � < �), then a state cannot exist. (ii) If � has an intermediate
value ( � � � < �H) then the optimal tax rate set by the state is given by �H = �. (iii) If � is large
( � � �H), then the optimal tax rate is equal to �H .25Another di¤erence between bandits and the state is that bandits con�scate a farmer�s entire cereal crop with
probability � , while an organized hierarchy taxes farmers at the rate � with certainty. If farmers are risk neutral, asassumed here, this di¤erence is unimportant. Below we show that our qualitative results hold also when farmers arerisk averse.
14
Income distribution. Under hierarchy, farmers grow only cereals. Thus, their income is
1 � �H = 1�minf�; �Hg, which is weakly decreasing in the cereal productivity advantage over
tubers �. Total tax receipts equals �H , and the net tax revenue received by the elite, after paying
the tax collectors and covering the cost of the army is: �H � s� (�H)�G0. Both the gross and net
tax receipts strictly increase in � up to the threshold �H , where they remain constant.
Output Loss. Analogously to the case of anarchy, we de�ne the e¢ ciency loss for hierarchy as
the deviation of total output from the maximal potential:
Y0 � Y = (1� �H) �+ s�(�H) +G0 and since �H = 1; Y0 � Y = s�(�H) +G0: Thus we obtain:
Corollary 2. The output loss (Y0 � Y ) due to hierarchy is:
s�(�H) +G0 =
8><>:s�(�) +G0 if � < �H
s�(�H) +G0 if � � �H:
:
3.3 Anarchy vs. Hierarchy
As explained in the previous section, a state can only exist if tubers are su¢ ciently unattractive
to farmers, that is, if their productivity disadvantage � is above the threshold �: The comparison
between the regimes of anarchy and hierarchy depends on the relationship between the thresholds
�A, �H and �.
Proposition 3. If � is small ( � < �), then only anarchy is possible, with a mixed equilibrium in
which �A = � and where both cereals and tubers are grown. If � is high enough for the state to be
viable ( � � �), then a hierarchy weakly Pareto dominates anarchy.
Proof. Because the function � (�) is strictly concave, the marginal productivity of tax collectors (or
bandits) is lower than the average productivity: � 0 (�) < � (�) =� and � 0 (� (�)) < �=� (�). Recall
that, � (�H) is de�ned by � 0(� (�H)) = s and � (�A) is de�ned by �A=� (�A) = s. It therefore follows
from the concavity of � (�) that �H < �A and �(�H) < �(�A).
Non-farmers earn the same income s irrespective of the regime. Suppose that � > �. On the other
hand, the implied tax rate on farmers under anarchy is larger than or equal than the tax rate
under hierarchy. In the range where � � � � �H , the tax rate under both anarchy and hierarchy
15
is �; in the range �H � � < �A the tax rate under anarchy � is higher than the tax rate under
hierarchy �H and in the range �A � � the tax rate under anarchy is �A, whereas under hierarchy it
is lower �H . Hence, farmers are weakly better o¤ in all cases under hierarchy than under anarchy.
Finally, when � > �, a hierarchy generates an additional surplus to the elite, since by construction:
� � s� (�)�G0 > 0. �
Proposition 4. In the range where hierarchy is viable, the economy is more productive under
hierarchy than under anarchy.
Proof. From corollaries 1 and 2 we obtain that the di¤erence between total output under hierarchy
to that under anarchy is equal to:
YH(�)� YA(�) =
8><>:� � s�(�)�G0 if � 2 [�; �H ]� � s�(�H)�G0 � 2 (�H ; �A]�A � s�(�H)�G0 � > �A
:
By the de�nition of �, R(�) = � � s�(�) = G0 so that the output gap between the two regimes
is zero when � = �. When � � � � �A, the output gap equals the rent enjoyed by the elite, which
is increasing in �. �The total output under hierarchy is weakly higher for two reasons. (1) Under hierarchy (when
� > �), farmers cultivate only cereals. Thus they do not resort to self-protection through the
cultivation of the less productive tubers, as they do (when � < �A) under anarchy. (2) The state
taxes less, since it sets the scale of tax collectors so that their marginal product is higher or equals
their cost s, whereas under anarchy it is the average product of bandits that equal s. As a result,
(weakly) fewer non-farmers are engaged in non-productive appropriation.
The main predictions of the analysis
1. Farmers may choose to grow tubers even when tubers are less productive as a measure of
self-protection against appropriation by bandits or by tax collectors.
2. If tubers are su¢ ciently productive in comparison to cereals (� < �), then a state cannot exist.
This result illustrates our claim that it isn�t low productivity that restrains the development
16
of hierarchy and related institutions, but rather high productivity of crops that are hard to
expropriate. If, however, the reverse is true (� > �) hierarchy could emerge and farmers would
produce food surplus that would be taxed by the elite.
3. Whenever it exists, even a non-benevolent state that monopolizes coercive force dominates
anarchy e¢ ciency-wise (Propositions 3 and 4). This is a result of our assumption that the
state can commit to a tax rate that maximizes its revenue net of collection costs, and that
consequently farmers cultivate only the more e¢ cient cereals.
We test predictions 1 and 2 in the empirical section below. Before turning to that section, we
analyze a simple example that enables us to present the model�s predictions diagrammatically and
to examine also the case of risk aversion.
3.4 Example
Consider the following speci�cation for the expropriation function:
�(�) = �p�;
with � 2 (0; 1) .
In this case, �A = �2=s and the equilibrium under anarchy is given by
(�A; �A) =
8>><>>:�s��2; ��
if � < �A
�1; �
2
s
�if � � �A
:
Under hierarchy, �H = ��2=s and the lower limit for state existence, � > 0; is implicitly de�ned
by the quadratic equation: � � s���
�2= G0:
26
For � � � � �H a state sets a tax rate equal to � and generates net tax revenue: R (�) =
� � s���
�2, which increases in � up to the point where � = �H upon which R (�) = R (�H) : Figure
1 presents the comparison between anarchy and hierarchy with respect to the tax rate and the
production of cereals, as a function of �: It also presents the net revenue of the elite in a regime of
hierarchy.26The existence of such a positive solution is conditioned on: G0 � �2=4s:
17
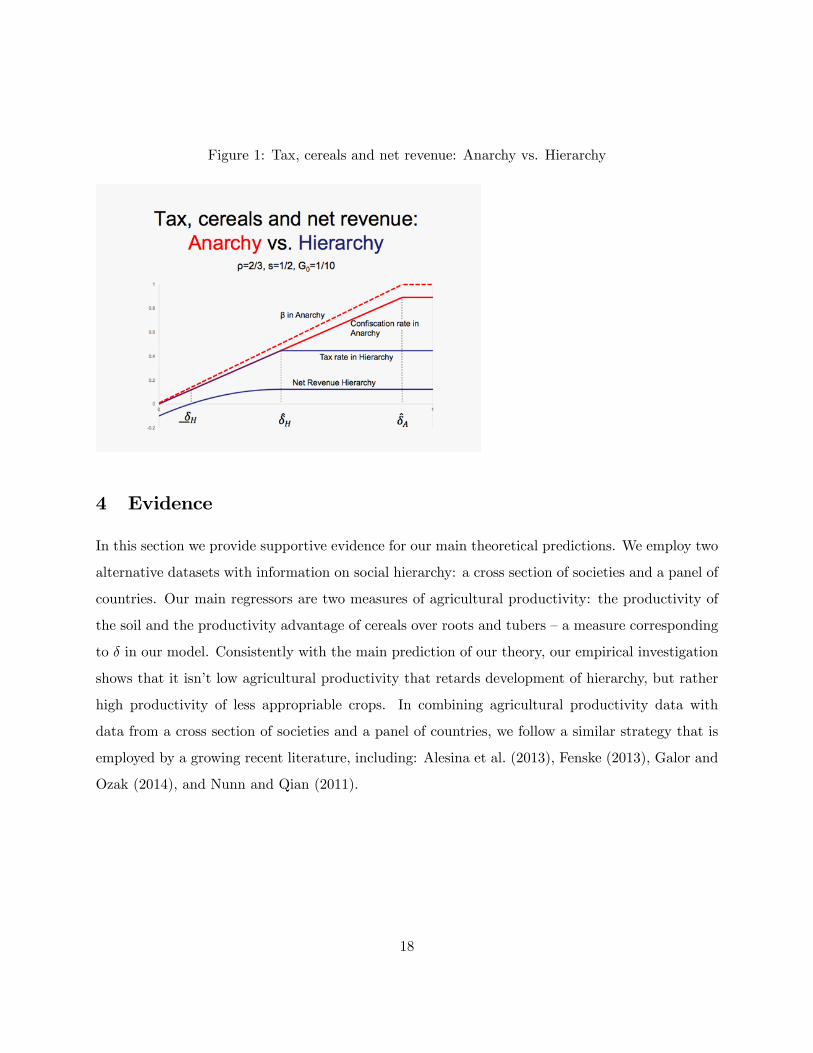
Figure 1: Tax, cereals and net revenue: Anarchy vs. Hierarchy
4 Evidence
In this section we provide supportive evidence for our main theoretical predictions. We employ two
alternative datasets with information on social hierarchy: a cross section of societies and a panel of
countries. Our main regressors are two measures of agricultural productivity: the productivity of
the soil and the productivity advantage of cereals over roots and tubers �a measure corresponding
to � in our model. Consistently with the main prediction of our theory, our empirical investigation
shows that it isn�t low agricultural productivity that retards development of hierarchy, but rather
high productivity of less appropriable crops. In combining agricultural productivity data with
data from a cross section of societies and a panel of countries, we follow a similar strategy that is
employed by a growing recent literature, including: Alesina et al. (2013), Fenske (2013), Galor and
Ozak (2014), and Nunn and Qian (2011).
18
4.1 Data
4.1.1 Ethnographic data
Murdock�s (1967) Ethnographic Atlas provides a database of 1,267 societies from around the world.
The database contains information on several cultural, institutional and economic features for these
societies at an idealized moment of �rst contact with Europeans. From this sample, we remove
2 duplicate observations, 7 societies observed before 1500, and 10 societies for which the year of
observation is missing, so that we are left with a total of 1,248 societies. These are matched to
ethnic maps using either the geo-coordinates of each ethnicity provided by the Ethnoatlas or the
maps on the spatial location of ethnicities constructed by Fenske (2013).27
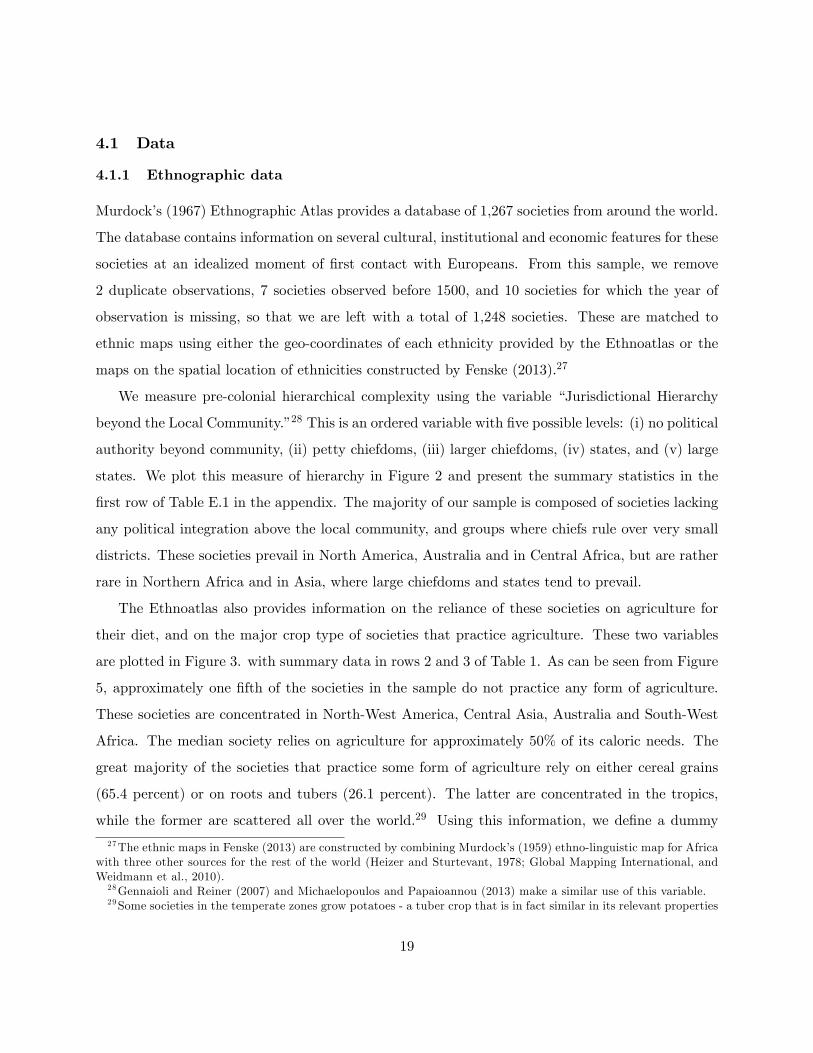
We measure pre-colonial hierarchical complexity using the variable �Jurisdictional Hierarchy
beyond the Local Community.�28 This is an ordered variable with �ve possible levels: (i) no political
authority beyond community, (ii) petty chiefdoms, (iii) larger chiefdoms, (iv) states, and (v) large
states. We plot this measure of hierarchy in Figure 2 and present the summary statistics in the
�rst row of Table E.1 in the appendix. The majority of our sample is composed of societies lacking
any political integration above the local community, and groups where chiefs rule over very small
districts. These societies prevail in North America, Australia and in Central Africa, but are rather
rare in Northern Africa and in Asia, where large chiefdoms and states tend to prevail.
The Ethnoatlas also provides information on the reliance of these societies on agriculture for
their diet, and on the major crop type of societies that practice agriculture. These two variables
are plotted in Figure 3. with summary data in rows 2 and 3 of Table 1. As can be seen from Figure
5, approximately one �fth of the societies in the sample do not practice any form of agriculture.
These societies are concentrated in North-West America, Central Asia, Australia and South-West
Africa. The median society relies on agriculture for approximately 50% of its caloric needs. The
great majority of the societies that practice some form of agriculture rely on either cereal grains
(65.4 percent) or on roots and tubers (26.1 percent). The latter are concentrated in the tropics,
while the former are scattered all over the world.29 Using this information, we de�ne a dummy
27The ethnic maps in Fenske (2013) are constructed by combining Murdock�s (1959) ethno-linguistic map for Africawith three other sources for the rest of the world (Heizer and Sturtevant, 1978; Global Mapping International, andWeidmann et al., 2010).28Gennaioli and Reiner (2007) and Michaelopoulos and Papaioannou (2013) make a similar use of this variable.29Some societies in the temperate zones grow potatoes - a tuber crop that is in fact similar in its relevant properties
19
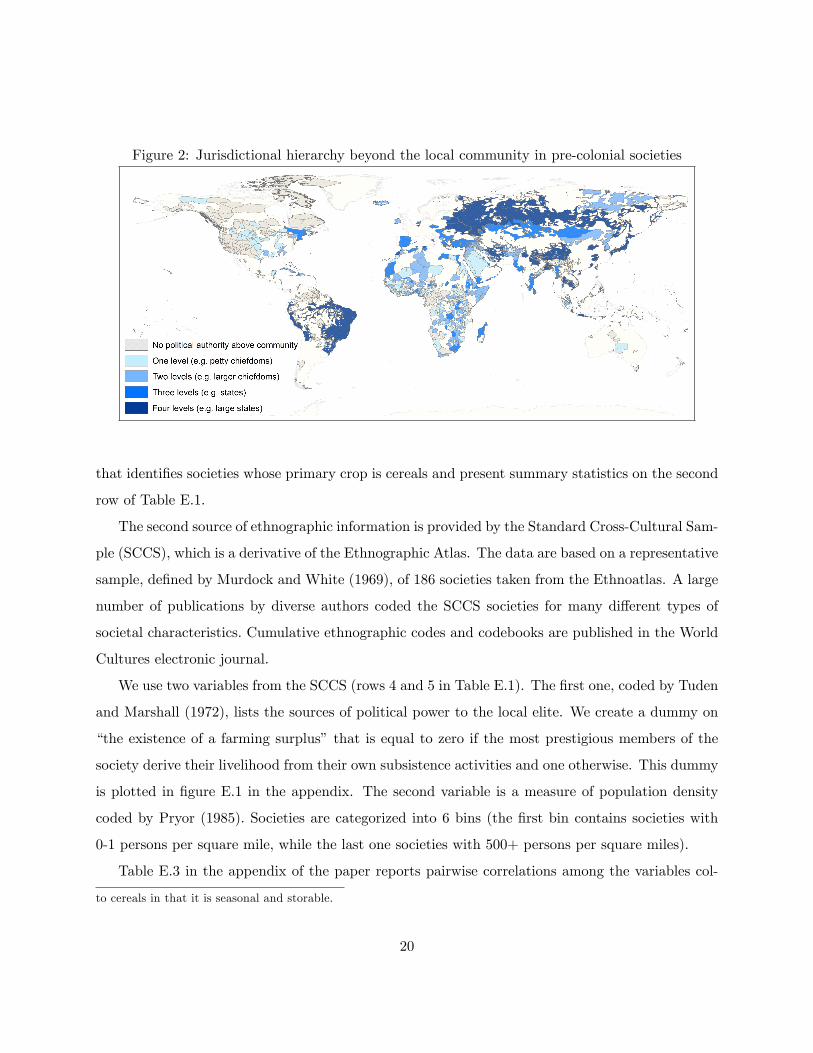
Figure 2: Jurisdictional hierarchy beyond the local community in pre-colonial societies
that identi�es societies whose primary crop is cereals and present summary statistics on the second
row of Table E.1.
The second source of ethnographic information is provided by the Standard Cross-Cultural Sam-
ple (SCCS), which is a derivative of the Ethnographic Atlas. The data are based on a representative
sample, de�ned by Murdock and White (1969), of 186 societies taken from the Ethnoatlas. A large
number of publications by diverse authors coded the SCCS societies for many di¤erent types of
societal characteristics. Cumulative ethnographic codes and codebooks are published in the World
Cultures electronic journal.
We use two variables from the SCCS (rows 4 and 5 in Table E.1). The �rst one, coded by Tuden
and Marshall (1972), lists the sources of political power to the local elite. We create a dummy on
�the existence of a farming surplus� that is equal to zero if the most prestigious members of the
society derive their livelihood from their own subsistence activities and one otherwise. This dummy
is plotted in �gure E.1 in the appendix. The second variable is a measure of population density
coded by Pryor (1985). Societies are categorized into 6 bins (the �rst bin contains societies with
0-1 persons per square mile, while the last one societies with 500+ persons per square miles).
Table E.3 in the appendix of the paper reports pairwise correlations among the variables col-
to cereals in that it is seasonal and storable.
20
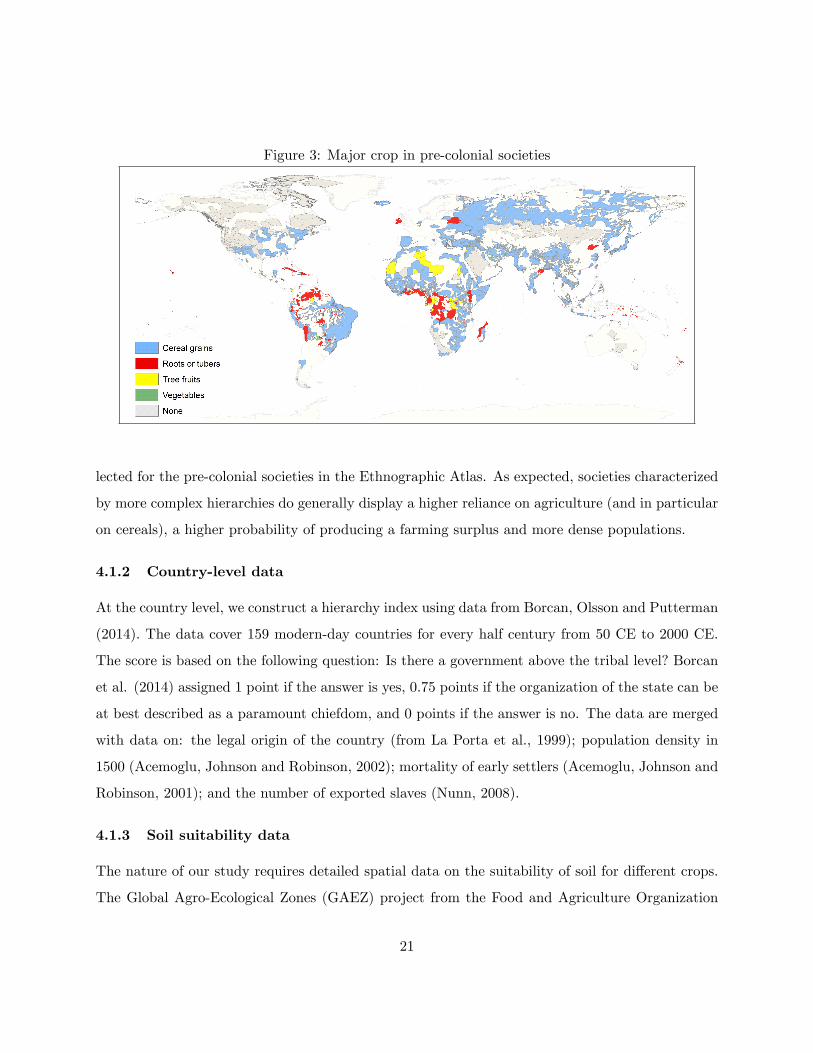
Figure 3: Major crop in pre-colonial societies
lected for the pre-colonial societies in the Ethnographic Atlas. As expected, societies characterized
by more complex hierarchies do generally display a higher reliance on agriculture (and in particular
on cereals), a higher probability of producing a farming surplus and more dense populations.
4.1.2 Country-level data
At the country level, we construct a hierarchy index using data from Borcan, Olsson and Putterman
(2014). The data cover 159 modern-day countries for every half century from 50 CE to 2000 CE.
The score is based on the following question: Is there a government above the tribal level? Borcan
et al. (2014) assigned 1 point if the answer is yes, 0.75 points if the organization of the state can be
at best described as a paramount chiefdom, and 0 points if the answer is no. The data are merged
with data on: the legal origin of the country (from La Porta et al., 1999); population density in
1500 (Acemoglu, Johnson and Robinson, 2002); mortality of early settlers (Acemoglu, Johnson and
Robinson, 2001); and the number of exported slaves (Nunn, 2008).
4.1.3 Soil suitability data
The nature of our study requires detailed spatial data on the suitability of soil for di¤erent crops.
The Global Agro-Ecological Zones (GAEZ) project from the Food and Agriculture Organization
21
(FAO) provides global estimates of potential crop yields for di¤erent crops with cell size of 5�x5�
(i.e. approximately 100 Km2) based on two possible categories of water supply (rain-fed and
irrigation) and three di¤erent levels of inputs (high, medium and low). In addition, it supplies two
alternative projections of potential crop-yields: one is based on agro-ecological constraints, which
could potentially re�ect human intervention, and one based on agro-climatic conditions, which are
arguably una¤ected by human intervention. To capture the conditions that were prevalent before
the �rst signi�cant contact of the societies in the Ethnoatlas with Europeans, and to exclude
problems of reverse causality, we consider potential yields based on agro-climatic conditions under
rain-fed low-input agriculture.
Figure 4: Di¤erence in potential yields (calories per hectare) of cereals versus roots and tubers.
GAEZ provides data on potential yields, in terms of tons per hectare per year, for 11 cereal
grains and 4 roots and tubers. Following the same procedure as in Galor and Ozak (2015) for the
crops relevant for our investigation, these yields are transformed from tons into calories using data
on the caloric content of crops provided by the USDA National Nutrient Database for Standard
Reference.30 We then �nd the crop with the highest potential caloric yields for each raster point.
The results are illustrated in �gure E.4 in the Appendix. Cereal grains are the highest yielding
30See Table E.2 in the appendix for the complete list of cereal grains, roots and tuber used in the empirical sectionand the correspondent caloric content. The data source in table A1 is di¤erent, and therefore the caloric contentreported there is slightly di¤erent.
22
crops in approximately 99 percent of the raster points in the sample, while roots and tubers are
optimal in few very small areas in Siberia, Eastern Brazil and Central-East Africa.
On the basis of this data set we construct two measures: a measure of the productivity of land,
measured as the maximum potential caloric yield per hectare; and a measure of the productivity
advantage of cereals over roots and tubers, which equals the di¤erence between the maximum caloric
yield of cereals and the maximum caloric yield of roots or tubers. These measures are attributed
to the di¤erent societies in the Ethnoatlas by taking an average of their values within a 20-miles
radius around the geo-coordinates reported in the Ethnoatlas,31 while they are attributed to the
di¤erent countries by using the FAO country boundaries.
As robustness checks, we also exploit two alternative measures of the productivity of the land,
which have been widely used in the literature. The �rst one is an index developed by Ramankutty
et al. (2002), which measures the fraction of land that is suitable for agriculture. The second
one is a caloric suitability index developed by Galor and Ozak (2015), which captures the highest
attainable potential caloric yields from 48 crops (which includes not only cereals, roots and tubers
but also sugar crops, pulses, oilcrops, vegetables, fruits, �ber crops and stimulant crops).
Table E.3 in the appendix illustrates that our measure of the productivity advantage of cereals
is positively correlated with our benchmark measure of land productivity (the correlation is slightly
below 0.8), with the Ramankutty et al. index of suitable land (0.4) and with the Galor and Ozak
caloric suitability index (0.8).
Finally, we construct a measure of the productivity advantage that comes from using the plow
in agriculture. This equals the di¤erence between the maximum caloric yield among crops that
Alesina, Giuliano and Nunn (2013) identify as �plow-positive�(wheat, barley and rye) and those
that they identify as �plow-negative�(sorghum, foxtail millet and pearl millet).
4.1.4 Other demographic and geographic data
The History Database of the Global Environment (HYDE) supplies global estimates on population
density at the raster level between 1500 and 2000 with cell size of 5�x5�. To each society in the
Ethnoatlas, we assign a value that is equal to the average population density across the raster
31 In the appendix we report the result of an alternative method, where we attribute these productivity measuresto the di¤erent societies by using the maps on their spatial location constructed by Fenske (2013).
23
points within its territories for the year of observation recorded in the atlas. Data on population
density for 1995 is provided by GAEZ and is similarly averaged within the territory of each society.
Finally, we employ data on distance to major rivers or to the coast, precipitation, temperature,
elevation, ruggedness, absolute latitude, incidence of malaria both at the society and the country
level. Sources are detailed in Table E.1.
4.2 Empirical results
4.2.1 The choice of crop
We start our empirical analysis by studying the geographical factors that in�uence the choice of
cultivating cereals rather than alternative crops or non-farming. Our theory suggests that farmers
make this choice on the basis of comparing the net caloric yield of cereals to that of the alternatives
crops (in which we focus on roots and tubers).
The �rst three columns of Table 1 presents the results of the following regression:
Ceri = �CalDiffi +X0i� + "i:
Ceri is a dummy variable that identi�es that society i cultivates a cereal grain as its main crop;
CalDiffi is the caloric advantage of cereals in the land of society i (the di¤erence between the
maximum potential caloric yield of cereals and of roots or tubers); and Xi is a set of control
variables. Column 1 reports the bivariate relationship without any controls. The association is
positive and statistically signi�cant. An increase in the productivity advantage of cereals over
roots and tubers by one standard deviation is associated with an increase in the probability of
planting cereals as main crop in the order of 20 percent. Moreover, variation in this regressor alone
is able to explain 13 percent of the entire variation in the dependent variable. The �rst concern is
that the productivity advantage of cereals might re�ect the potential caloric yield of the soil, since
cereals grains are the most productive crops in most of the world. Column 2 reports the results
when adding as a control variable the productivity of the soil (the highest potential caloric yield
across all 11 cereals and 4 roots/tubers). This variable does not produce any signi�cant impact on
the decision on whether to plant cereals or not, while the impact of the productivity advantage of
cereals is unchanged. Adding this control leaves the R2 of the regression practically unchanged,
24
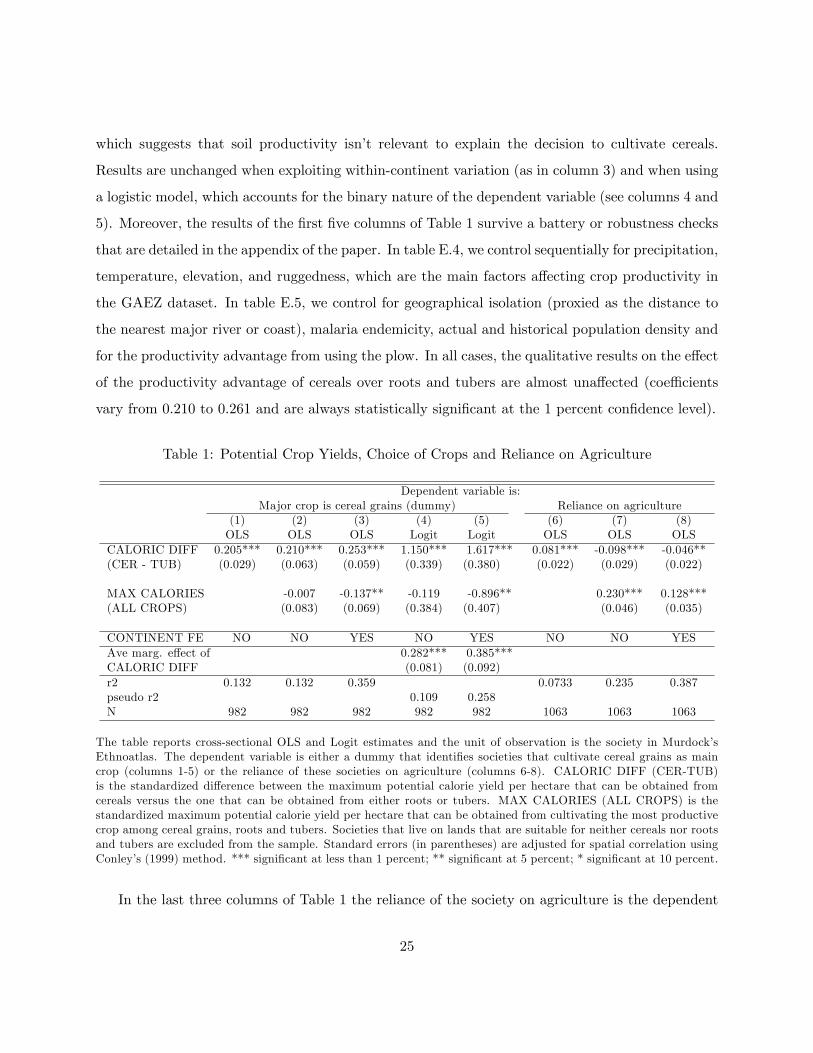
which suggests that soil productivity isn�t relevant to explain the decision to cultivate cereals.
Results are unchanged when exploiting within-continent variation (as in column 3) and when using
a logistic model, which accounts for the binary nature of the dependent variable (see columns 4 and
5). Moreover, the results of the �rst �ve columns of Table 1 survive a battery or robustness checks
that are detailed in the appendix of the paper. In table E.4, we control sequentially for precipitation,
temperature, elevation, and ruggedness, which are the main factors a¤ecting crop productivity in
the GAEZ dataset. In table E.5, we control for geographical isolation (proxied as the distance to
the nearest major river or coast), malaria endemicity, actual and historical population density and
for the productivity advantage from using the plow. In all cases, the qualitative results on the e¤ect
of the productivity advantage of cereals over roots and tubers are almost una¤ected (coe¢ cients
vary from 0.210 to 0.261 and are always statistically signi�cant at the 1 percent con�dence level).
Table 1: Potential Crop Yields, Choice of Crops and Reliance on Agriculture
Dependent variable is:Major crop is cereal grains (dummy) Reliance on agriculture
(1) (2) (3) (4) (5) (6) (7) (8)OLS OLS OLS Logit Logit OLS OLS OLS
CALORIC DIFF 0.205*** 0.210*** 0.253*** 1.150*** 1.617*** 0.081*** -0.098*** -0.046**(CER - TUB) (0.029) (0.063) (0.059) (0.339) (0.380) (0.022) (0.029) (0.022)
MAX CALORIES -0.007 -0.137** -0.119 -0.896** 0.230*** 0.128***(ALL CROPS) (0.083) (0.069) (0.384) (0.407) (0.046) (0.035)
CONTINENT FE NO NO YES NO YES NO NO YESAve marg. e¤ect of 0.282*** 0.385***CALORIC DIFF (0.081) (0.092)r2 0.132 0.132 0.359 0.0733 0.235 0.387pseudo r2 0.109 0.258N 982 982 982 982 982 1063 1063 1063
The table reports cross-sectional OLS and Logit estimates and the unit of observation is the society in Murdock�sEthnoatlas. The dependent variable is either a dummy that identi�es societies that cultivate cereal grains as maincrop (columns 1-5) or the reliance of these societies on agriculture (columns 6-8). CALORIC DIFF (CER-TUB)is the standardized di¤erence between the maximum potential calorie yield per hectare that can be obtained fromcereals versus the one that can be obtained from either roots or tubers. MAX CALORIES (ALL CROPS) is thestandardized maximum potential calorie yield per hectare that can be obtained from cultivating the most productivecrop among cereal grains, roots and tubers. Societies that live on lands that are suitable for neither cereals nor rootsand tubers are excluded from the sample. Standard errors (in parentheses) are adjusted for spatial correlation usingConley�s (1999) method. *** signi�cant at less than 1 percent; ** signi�cant at 5 percent; * signi�cant at 10 percent.
In the last three columns of Table 1 the reliance of the society on agriculture is the dependent
25
variable. As reasonably expected, land productivity increases the probability of reliance on farming.
Interestingly, the productivity advantage of cereals has a negative e¤ect on practicing agriculture,
when controlling for soil productivity. That is, for the same level of land productivity (measured in
calories per unit of land), cultivating roots and tubers is more rewarding than cultivating cereals.
This is consistent with our theory as cereal farmers are more vulnerable to extraction.
Thus, in this subsection, we show that while the productivity advantage of cereals has a positive
impact on the probability of cultivating cereals as the main crop, it has a negative impact on the
reliance of societies in our sample on agriculture. Furthermore, the absolute productivity of land
has a positive impact on reliance on agriculture, but no signi�cant impact on the probability of
cultivating cereals.
4.2.2 Cereals and hierarchy
According to our theory, societies that grow cereals rather than roots or tubers are characterized
by a more complex hierarchy and by generating a higher farming surplus. To test these predictions,
we estimate a regression of the form:
Yi = �Ceri +X0i� + ui; (2)
where Yi is either a measure of hierarchy or an indicator for the presence of farming surplus in
society i; Ceri, is, as mentioned above, a dummy variable that identi�es societies that rely mainly
on cereals for their subsistence; and X 0i is a vector of control variables. This speci�cation, however,
encounters several problems.
First, the choice of the cultivated crop is in�uenced by the social institutions. In particular,
according to our theory it is riskier to cultivate cereals in societies characterized by low state ca-
pacity, and thereby by low protection against bandits, since cereals render farmers more vulnerable
to theft. To overcome this reverse causality concern, we exploit variations in potential, rather than
actual, crop yields, which are derived from agro-climatic conditions that are presumably orthogonal
to human intervention. Speci�cally, we run IV regressions, where we instrument for Ceri by using
the productivity advantage of cereals, CalDiffi.
Second, there are several potential omitted variables that could be correlated with the main
26
regressor and the measure of hierarchy. The disease environment, for instance, is correlated with
both the cultivation of tubers (which is concentrated in the tropics) and is likely to be correlated
with the quality of institutions (Acemoglu, Johnson and Robinson, 2001). A battery of robustness
checks alleviates this concern. Moreover, we exploit the Columbian exchange and the e¤ects it had
on the productivity potential crops, to conduct panel regressions at the country-level that will rule
out potential time-invariant omitted variables.
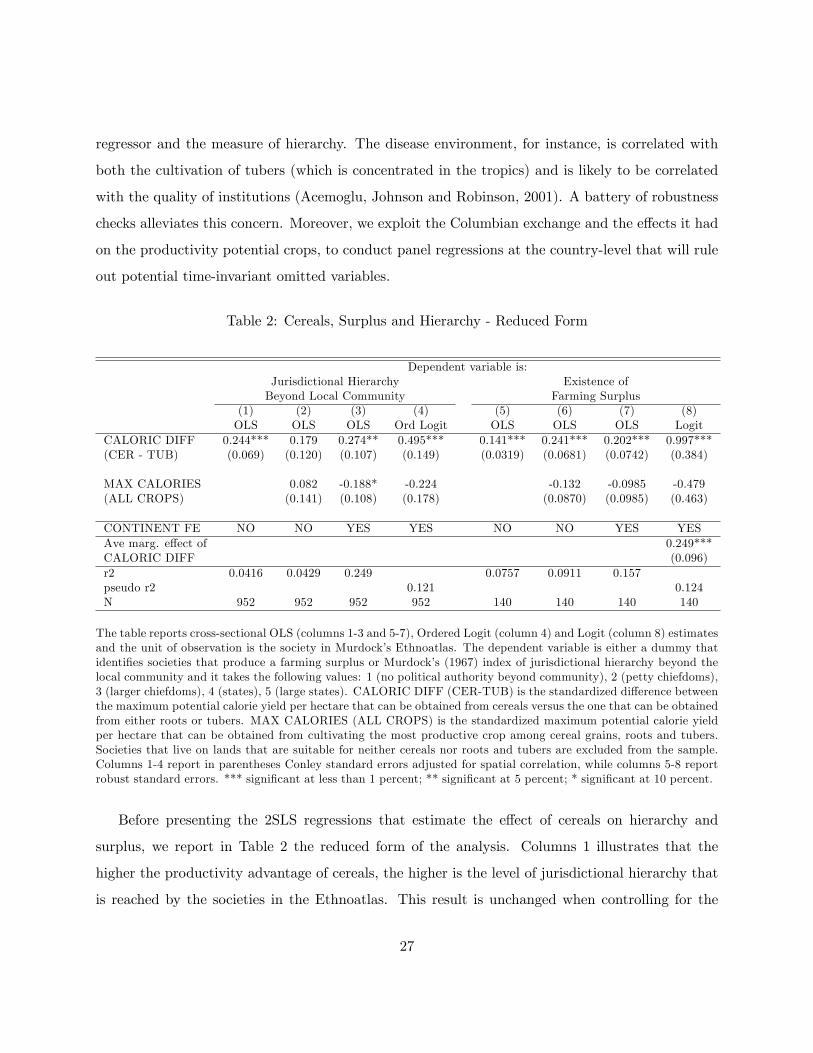
Table 2: Cereals, Surplus and Hierarchy - Reduced Form
Dependent variable is:Jurisdictional Hierarchy Existence ofBeyond Local Community Farming Surplus
(1) (2) (3) (4) (5) (6) (7) (8)OLS OLS OLS Ord Logit OLS OLS OLS Logit
CALORIC DIFF 0.244*** 0.179 0.274** 0.495*** 0.141*** 0.241*** 0.202*** 0.997***(CER - TUB) (0.069) (0.120) (0.107) (0.149) (0.0319) (0.0681) (0.0742) (0.384)
MAX CALORIES 0.082 -0.188* -0.224 -0.132 -0.0985 -0.479(ALL CROPS) (0.141) (0.108) (0.178) (0.0870) (0.0985) (0.463)
CONTINENT FE NO NO YES YES NO NO YES YESAve marg. e¤ect of 0.249***CALORIC DIFF (0.096)r2 0.0416 0.0429 0.249 0.0757 0.0911 0.157pseudo r2 0.121 0.124N 952 952 952 952 140 140 140 140
The table reports cross-sectional OLS (columns 1-3 and 5-7), Ordered Logit (column 4) and Logit (column 8) estimatesand the unit of observation is the society in Murdock�s Ethnoatlas. The dependent variable is either a dummy thatidenti�es societies that produce a farming surplus or Murdock�s (1967) index of jurisdictional hierarchy beyond thelocal community and it takes the following values: 1 (no political authority beyond community), 2 (petty chiefdoms),3 (larger chiefdoms), 4 (states), 5 (large states). CALORIC DIFF (CER-TUB) is the standardized di¤erence betweenthe maximum potential calorie yield per hectare that can be obtained from cereals versus the one that can be obtainedfrom either roots or tubers. MAX CALORIES (ALL CROPS) is the standardized maximum potential calorie yieldper hectare that can be obtained from cultivating the most productive crop among cereal grains, roots and tubers.Societies that live on lands that are suitable for neither cereals nor roots and tubers are excluded from the sample.Columns 1-4 report in parentheses Conley standard errors adjusted for spatial correlation, while columns 5-8 reportrobust standard errors. *** signi�cant at less than 1 percent; ** signi�cant at 5 percent; * signi�cant at 10 percent.
Before presenting the 2SLS regressions that estimate the e¤ect of cereals on hierarchy and
surplus, we report in Table 2 the reduced form of the analysis. Columns 1 illustrates that the
higher the productivity advantage of cereals, the higher is the level of jurisdictional hierarchy that
is reached by the societies in the Ethnoatlas. This result is unchanged when controlling for the
27

productivity of the soil (column 2). More speci�cally, while one standard deviation increase in the
productivity advantage of cereals increases the hierarchy index by 0.18 (0.27 in the speci�cation
with continent �xed e¤ects), an increase of soil productivity does not produce any signi�cant impact
on the dependent variable. In column 3, we control for continent �xed e¤ects. The impact of the
relative productivity of cereals becomes larger, while the impact of the soil productivity becomes
negative.
In column 4 we use an ordered logit model, which accounts for the ordinal nature of the depen-
dent variable. A one standard deviation increase in the productivity advantage of cereals increases
the log odds of being in a higher level of hierarchy by approximately 50 percent. In the appendix
(see Table E.6), we relax the assumption of proportional odds, which is implicit in the standard
ordered logit models, and estimate a generalized logit model.32 As can be seen, the greatest impact
of cereal advantage is to push societies from tribes and chiefdoms to states. More speci�cally, while
an increase in one standard deviation in the productivity advantage of cereals increases the log
odds of being in a level of hierarchy higher than a tribe by 32 percent, it increases the log odds of
being in a level higher than a chiefdom by 65 percent and higher than a small state by 84 percent.
In all cases, the impact of soil productivity is either very small and not statistically signi�cant, or
negative.
Columns 5 to 8 in Table 2 provide further support for the appropriability hypothesis versus
the productivity-surplus hypothesis. In fact, the higher the productivity advantage of cereals, the
higher is the probability of having an economy that produces a farming surplus �elite consumption
isn�t based on direct subsistence (column 5). When we run a horse race between the productivity
advantage of cereals and the absolute productivity of the soil (columns 6 and 7), we �nd that only
the former has a signi�cant impact on surplus, independently on whether we control for continent
�xed e¤ects or not. Using a logistic regression rather than OLS regression does not alter this result
(see column 8).
Table 3 reports the OLS and 2SLS estimates of equation 2, when the dependent variable is
hierarchy. The OLS estimates in column 1 show that cultivating cereals is associated with an
increase of 0.70 in the hierarchy measure. Clearly, this positive association cannot be interpreted
32The assumption of proportional odds means that each independent variable has an identical e¤ect at each cumu-lative split of the ordinal dependent variable.
28
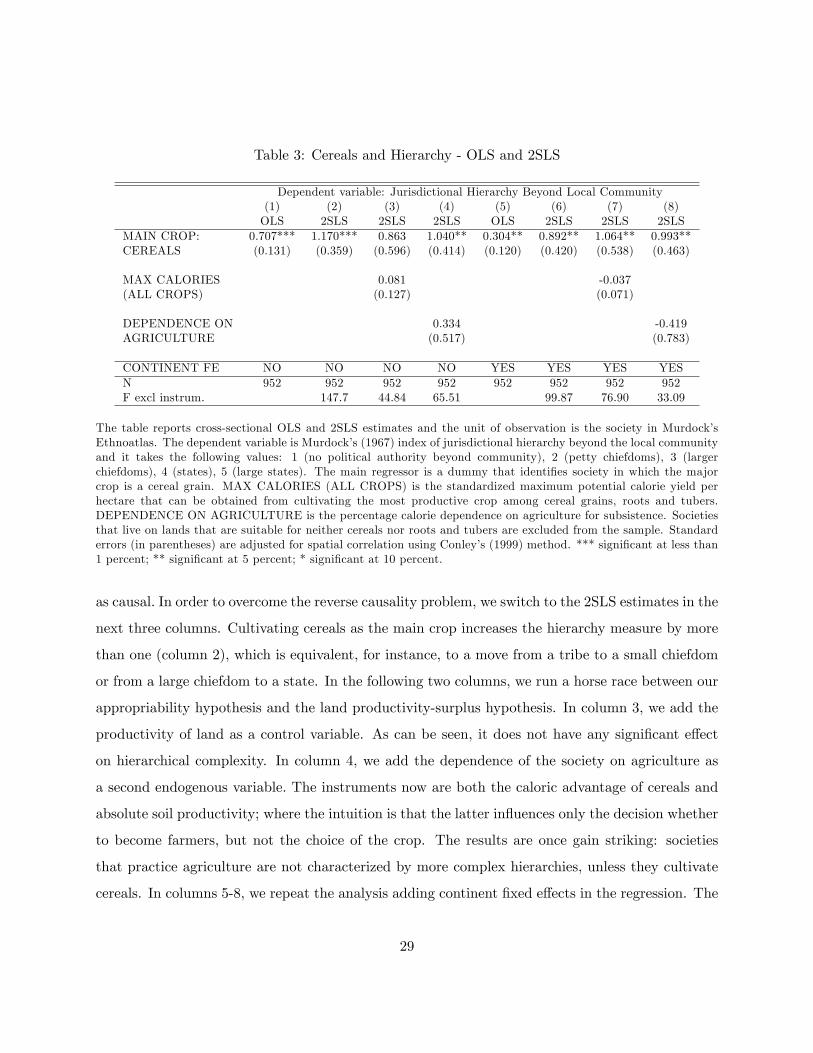
Table 3: Cereals and Hierarchy - OLS and 2SLS
Dependent variable: Jurisdictional Hierarchy Beyond Local Community(1) (2) (3) (4) (5) (6) (7) (8)OLS 2SLS 2SLS 2SLS OLS 2SLS 2SLS 2SLS
MAIN CROP: 0.707*** 1.170*** 0.863 1.040** 0.304** 0.892** 1.064** 0.993**CEREALS (0.131) (0.359) (0.596) (0.414) (0.120) (0.420) (0.538) (0.463)
MAX CALORIES 0.081 -0.037(ALL CROPS) (0.127) (0.071)
DEPENDENCE ON 0.334 -0.419AGRICULTURE (0.517) (0.783)
CONTINENT FE NO NO NO NO YES YES YES YESN 952 952 952 952 952 952 952 952F excl instrum. 147.7 44.84 65.51 99.87 76.90 33.09
The table reports cross-sectional OLS and 2SLS estimates and the unit of observation is the society in Murdock�sEthnoatlas. The dependent variable is Murdock�s (1967) index of jurisdictional hierarchy beyond the local communityand it takes the following values: 1 (no political authority beyond community), 2 (petty chiefdoms), 3 (largerchiefdoms), 4 (states), 5 (large states). The main regressor is a dummy that identi�es society in which the majorcrop is a cereal grain. MAX CALORIES (ALL CROPS) is the standardized maximum potential calorie yield perhectare that can be obtained from cultivating the most productive crop among cereal grains, roots and tubers.DEPENDENCE ON AGRICULTURE is the percentage calorie dependence on agriculture for subsistence. Societiesthat live on lands that are suitable for neither cereals nor roots and tubers are excluded from the sample. Standarderrors (in parentheses) are adjusted for spatial correlation using Conley�s (1999) method. *** signi�cant at less than1 percent; ** signi�cant at 5 percent; * signi�cant at 10 percent.
as causal. In order to overcome the reverse causality problem, we switch to the 2SLS estimates in the
next three columns. Cultivating cereals as the main crop increases the hierarchy measure by more
than one (column 2), which is equivalent, for instance, to a move from a tribe to a small chiefdom
or from a large chiefdom to a state. In the following two columns, we run a horse race between our
appropriability hypothesis and the land productivity-surplus hypothesis. In column 3, we add the
productivity of land as a control variable. As can be seen, it does not have any signi�cant e¤ect
on hierarchical complexity. In column 4, we add the dependence of the society on agriculture as
a second endogenous variable. The instruments now are both the caloric advantage of cereals and
absolute soil productivity; where the intuition is that the latter in�uences only the decision whether
to become farmers, but not the choice of the crop. The results are once gain striking: societies
that practice agriculture are not characterized by more complex hierarchies, unless they cultivate
cereals. In columns 5-8, we repeat the analysis adding continent �xed e¤ects in the regression. The
29
2SLS results are practically unchanged.
The results of Table 3 survive a battery or robustness checks that are detailed in the appendix
of the paper. In Table E.7, we control sequentially for precipitation, temperature, elevation, and
ruggedness, the main factors a¤ecting crop productivities. In Table E.8, we control for geographical
isolation, malaria endemicity and actual, historical population density and for the productivity
advantage from using the plow. Results are robust throughout. In 9 out of 10 cases, cultivating
cereals as main crop exerts a statistically signi�cant impact on hierarchical complexity. Controlling
for rainfall is the exception: the magnitude of the coe¢ cient does not vary but the coe¢ cient
becomes statistically signi�cant only at 15% level. The results are also practically una¤ected when
using ethnic boundaries as de�ned by Fenske (2013) to extract data on crop productivities (Table
E.10), when the sample includes societies living in desertic soils (Table E.9), or when using either
the Ramankutty et al. index of fertile land or the Galor and Ozak index of caloric suitability as
alternative measures of land productivity (Table E.11). In all cases, qualitative results on the e¤ect
of cultivating cereals as main crops are almost una¤ected (the coe¢ cients vary from 0.750 to 1.471).
Table E.12, in the appendix, reports the OLS and 2SLS estimates of equation 2, when the
dependent variable is the existence of a farming surplus in the society. The OLS estimates show
that cultivating cereals is associated with an increase of 0.36 in the probability of producing a surplus
(column 1). The coe¢ cient more than doubles when turning to the 2SLS estimates (column 2).
As in the previous table, also in this case absolute productivity of soil and reliance on agriculture
do not a¤ect the dependent variable (columns 3 and 4); and the results are robust when adding
continent �xed e¤ects in the speci�cation (columns 5 to 8). Also in this case, the empirical results
survive a long list of robustness checks reported in the appendix (Tables E.13-E.17).
These results provide evidence in support of our theory, as they indicate that the decision to
cultivate cereals has a large and signi�cant e¤ect on the development of complex hierarchical in-
stitutions and a farming surplus. The analysis accounts for a large set of possible confounding
geographical characteristics. But still, we cannot rule out that unobservable characteristics, sys-
tematically correlated with the productivity of di¤erent crops, might be driving our results. In
order to overcome this potential concern, we exploit an exogenous variation in the available crops
in di¤erent locations induced by the Columbian exchange.
In the New World, among the main four roots and tubers, three were available before 1500:
30
cassava, white potatoes and sweet potatoes, and among the eleven main cereals, only maize was
available. In the Old World, the only available crop among roots and tubers was yam; while all
cereal grains, excluding maize were available: barley, buckwheat, foxtail millet, indigo rice, oat,
pearl millet, rye, sorghum, and wetland rice. Thus, for each raster point of the world we de�ne
the highest yielding crop among cereals and among roots and tubers both before and after the
Columbian exchange. We then compute for each location the productivity advantage of cereals
over roots and tubers and the absolute productivity of land before the Columbian exchange (prior
to 1500) and after the Columbian exchange (in the years after 1600).33
Since the data in the Ethnographic Atlas pertains only to societies after the Columbian ex-
change, we exploit a di¤erent country-level panel dataset that reports on hierarchical complexity
for the majority of the world over the last millennium. The unit of observation is the territory
delimited by modern-day country borders for 159 countries every 50 years. Since we lack observa-
tions on the major crop cultivated in these territories for the period of analysis, we can only run
the reduced form version of our empirical analysis where we regress the hierarchy index on the
productivity advantage of cereals (and on the productivity of the soil):
Hierit = �CalDiffit +X0it� + �i + �t + uit: (3)
Here Hierit is the hierarchy index of country i in year t and CalDiffit = CalDiffi;BeforeExchange
(the caloric advantage of cereals over roots and tubers before the Columbian exchange) if t � 1500
and CalDiffit = CalDiffi;AfterExchange (the caloric advantage of cereals over roots and tubers
after the Columbian exchange) if t � 1600. Xi is a set of control variables, which includes the
potential productivity of the soil calculated based on the relevant available crops. Country �xed
e¤ects control for all time invariant factors that di¤er between countries, while time period �xed
e¤ects control for any time patterns of hierarchical complexity that a¤ects all countries. The
identi�cation assumption is that in the sixteenth century, there were no unobserved events, which
are systematically correlated with the spatial variation in the change in the potential productivity
33We exclude the years from 1500 to 1600 as the historical evidence points out that the New World�s crops wereadopted in Europe and Africa in the seventeeth century. For instance, the adoption of the potato in the Old Worldbegan in the late seventeeth century by Irish peasants (Nunn and Qian, 2011), while the �rst accounts on the adoptionof maize in Africa date back to the very end of the sixteenth century (Miracle, 1966). In the appendix, we show thatour results are robuts when excluding the years between 1500 and 1750 (see Table E.21).
31
advantage of cereals, that had an e¤ect on hierarchy.
The change in hierarchical complexity, induced by the change in appropriability (resulting from
the change in the productivity advantage of cereals over roots and tubers), could be driven by
either locals or colonizers. However, the colonization process does not seem to be driving our
results: controlling for colonies doesn�t have a quantitative e¤ect on the estimates (see Table E.18
in the appendix). A related source of concern is that changes in hierarchy were a result of people
moving from the Old to the New World, rather than a result of cereals making the same shift
at the same time. This however, cannot explain the fact that our results (see Table 4) indicate
a correlation between changes in the potential productivity advantage of cereals and changes in
hierarchy and no correlation between changes in land productivity and hierarchy, controlling for
changes in the potential productivity advantage of cereals. Note also that, as explained above,
our measurement of the productivity advantage of cereals in di¤erent historical periods does not
measure the actual productivity advantage, but rather the potential advantage, and is una¤ected
by the movement of people and the time of arrival of di¤erent crops in di¤erent locations.
The empirical results are illustrated in Table 4. Column 1 con�rms that the higher the produc-
tivity advantage of cereals, the higher is the country�s hierarchy index. This result is unchanged
when controlling for soil productivity (column 2). More speci�cally, while a one standard deviation
increase in the productivity advantage of cereals increases the hierarchy index by 0.19, soil produc-
tivity does not have any signi�cant impact on the dependent variable. In the next �ve columns, we
show that the results are robust when controlling for precipitation, temperature, elevation rugged-
ness and absolute latitude (interacted with the time-period �xed e¤ects). In Table 5, we consider a
host of additional factors (each interacted with time-period �xed e¤ects) that might have a¤ected
hierarchical complexity. Our choice of controls is driven by the determinants of long-term economic
development that have been emphasized in the literature. Sequentially, we control for: legal origin
of the country; population density in 1500; settlers mortality; the number of exported slaves; dis-
tance to rivers and coast; endemicity of malaria; and the percentage of tropical land. Once again,
our results are una¤ected.
In Table E.18 in the appendix we exclude from the sample the cells in which the countries
in our analysis were either colonies or protectorates. The estimated coe¢ cients on the caloric
advantage of cereals over roots and tubers become smaller by approximately a third. However, in
32
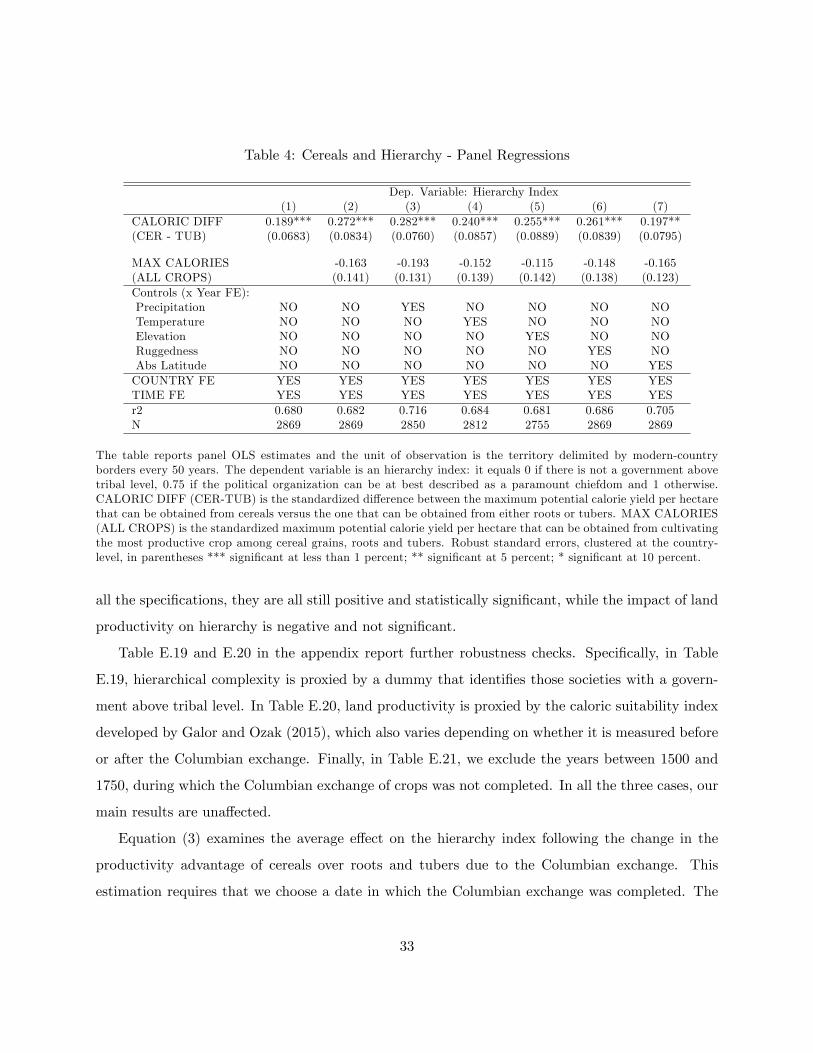
Table 4: Cereals and Hierarchy - Panel Regressions
Dep. Variable: Hierarchy Index(1) (2) (3) (4) (5) (6) (7)
CALORIC DIFF 0.189*** 0.272*** 0.282*** 0.240*** 0.255*** 0.261*** 0.197**(CER - TUB) (0.0683) (0.0834) (0.0760) (0.0857) (0.0889) (0.0839) (0.0795)
MAX CALORIES -0.163 -0.193 -0.152 -0.115 -0.148 -0.165(ALL CROPS) (0.141) (0.131) (0.139) (0.142) (0.138) (0.123)Controls (x Year FE):Precipitation NO NO YES NO NO NO NOTemperature NO NO NO YES NO NO NOElevation NO NO NO NO YES NO NORuggedness NO NO NO NO NO YES NOAbs Latitude NO NO NO NO NO NO YESCOUNTRY FE YES YES YES YES YES YES YESTIME FE YES YES YES YES YES YES YESr2 0.680 0.682 0.716 0.684 0.681 0.686 0.705N 2869 2869 2850 2812 2755 2869 2869
The table reports panel OLS estimates and the unit of observation is the territory delimited by modern-countryborders every 50 years. The dependent variable is an hierarchy index: it equals 0 if there is not a government abovetribal level, 0.75 if the political organization can be at best described as a paramount chiefdom and 1 otherwise.CALORIC DIFF (CER-TUB) is the standardized di¤erence between the maximum potential calorie yield per hectarethat can be obtained from cereals versus the one that can be obtained from either roots or tubers. MAX CALORIES(ALL CROPS) is the standardized maximum potential calorie yield per hectare that can be obtained from cultivatingthe most productive crop among cereal grains, roots and tubers. Robust standard errors, clustered at the country-level, in parentheses *** signi�cant at less than 1 percent; ** signi�cant at 5 percent; * signi�cant at 10 percent.
all the speci�cations, they are all still positive and statistically signi�cant, while the impact of land
productivity on hierarchy is negative and not signi�cant.
Table E.19 and E.20 in the appendix report further robustness checks. Speci�cally, in Table
E.19, hierarchical complexity is proxied by a dummy that identi�es those societies with a govern-
ment above tribal level. In Table E.20, land productivity is proxied by the caloric suitability index
developed by Galor and Ozak (2015), which also varies depending on whether it is measured before
or after the Columbian exchange. Finally, in Table E.21, we exclude the years between 1500 and
1750, during which the Columbian exchange of crops was not completed. In all the three cases, our
main results are una¤ected.
Equation (3) examines the average e¤ect on the hierarchy index following the change in the
productivity advantage of cereals over roots and tubers due to the Columbian exchange. This
estimation requires that we choose a date in which the Columbian exchange was completed. The
33
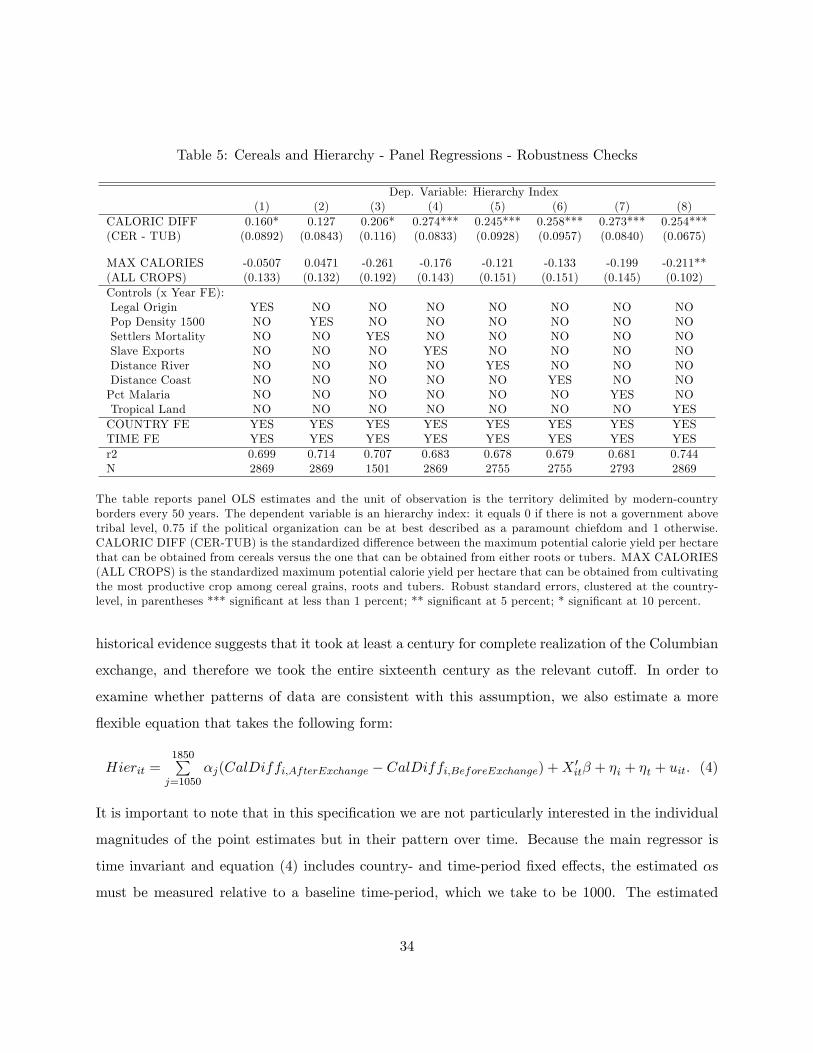
Table 5: Cereals and Hierarchy - Panel Regressions - Robustness Checks
Dep. Variable: Hierarchy Index(1) (2) (3) (4) (5) (6) (7) (8)
CALORIC DIFF 0.160* 0.127 0.206* 0.274*** 0.245*** 0.258*** 0.273*** 0.254***(CER - TUB) (0.0892) (0.0843) (0.116) (0.0833) (0.0928) (0.0957) (0.0840) (0.0675)
MAX CALORIES -0.0507 0.0471 -0.261 -0.176 -0.121 -0.133 -0.199 -0.211**(ALL CROPS) (0.133) (0.132) (0.192) (0.143) (0.151) (0.151) (0.145) (0.102)Controls (x Year FE):Legal Origin YES NO NO NO NO NO NO NOPop Density 1500 NO YES NO NO NO NO NO NOSettlers Mortality NO NO YES NO NO NO NO NOSlave Exports NO NO NO YES NO NO NO NODistance River NO NO NO NO YES NO NO NODistance Coast NO NO NO NO NO YES NO NOPct Malaria NO NO NO NO NO NO YES NOTropical Land NO NO NO NO NO NO NO YESCOUNTRY FE YES YES YES YES YES YES YES YESTIME FE YES YES YES YES YES YES YES YESr2 0.699 0.714 0.707 0.683 0.678 0.679 0.681 0.744N 2869 2869 1501 2869 2755 2755 2793 2869
The table reports panel OLS estimates and the unit of observation is the territory delimited by modern-countryborders every 50 years. The dependent variable is an hierarchy index: it equals 0 if there is not a government abovetribal level, 0.75 if the political organization can be at best described as a paramount chiefdom and 1 otherwise.CALORIC DIFF (CER-TUB) is the standardized di¤erence between the maximum potential calorie yield per hectarethat can be obtained from cereals versus the one that can be obtained from either roots or tubers. MAX CALORIES(ALL CROPS) is the standardized maximum potential calorie yield per hectare that can be obtained from cultivatingthe most productive crop among cereal grains, roots and tubers. Robust standard errors, clustered at the country-level, in parentheses *** signi�cant at less than 1 percent; ** signi�cant at 5 percent; * signi�cant at 10 percent.
historical evidence suggests that it took at least a century for complete realization of the Columbian
exchange, and therefore we took the entire sixteenth century as the relevant cuto¤. In order to
examine whether patterns of data are consistent with this assumption, we also estimate a more
�exible equation that takes the following form:
Hierit =1850Pj=1050
�j(CalDiffi;AfterExchange � CalDiffi;BeforeExchange) +X 0it� + �i + �t + uit: (4)
It is important to note that in this speci�cation we are not particularly interested in the individual
magnitudes of the point estimates but in their pattern over time. Because the main regressor is
time invariant and equation (4) includes country- and time-period �xed e¤ects, the estimated �s
must be measured relative to a baseline time-period, which we take to be 1000. The estimated
34
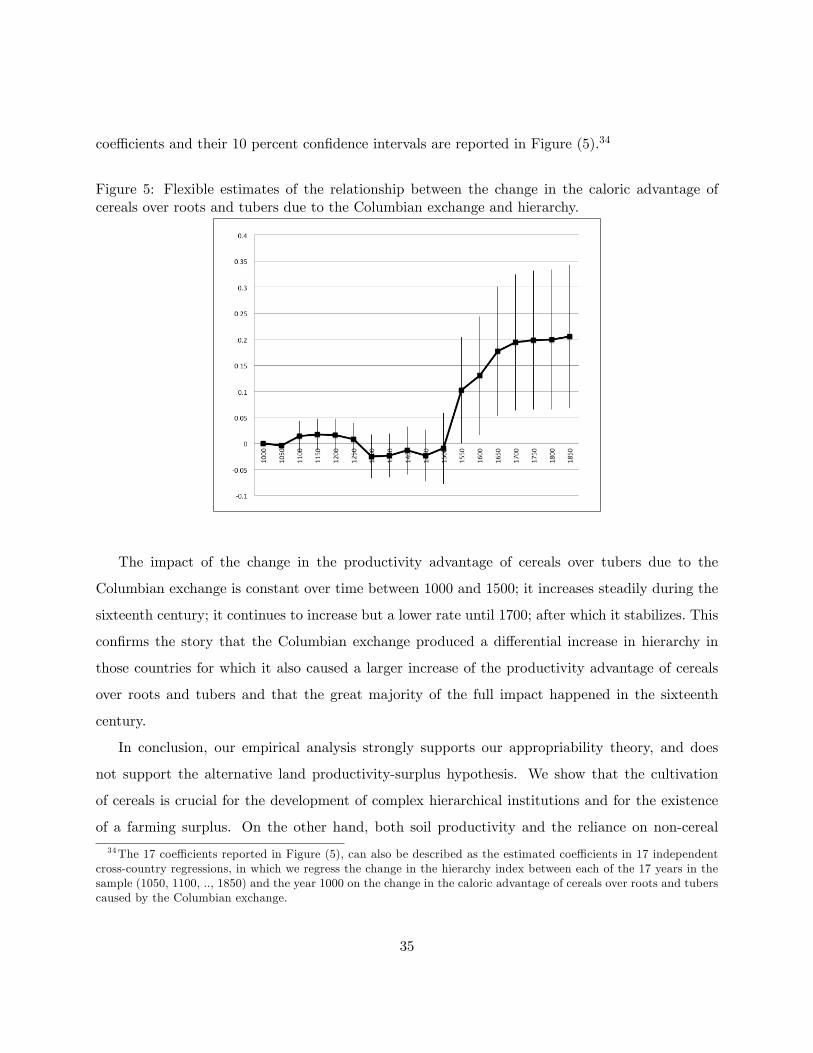
coe¢ cients and their 10 percent con�dence intervals are reported in Figure (5).34
Figure 5: Flexible estimates of the relationship between the change in the caloric advantage ofcereals over roots and tubers due to the Columbian exchange and hierarchy.
The impact of the change in the productivity advantage of cereals over tubers due to the
Columbian exchange is constant over time between 1000 and 1500; it increases steadily during the
sixteenth century; it continues to increase but a lower rate until 1700; after which it stabilizes. This
con�rms the story that the Columbian exchange produced a di¤erential increase in hierarchy in
those countries for which it also caused a larger increase of the productivity advantage of cereals
over roots and tubers and that the great majority of the full impact happened in the sixteenth
century.
In conclusion, our empirical analysis strongly supports our appropriability theory, and does
not support the alternative land productivity-surplus hypothesis. We show that the cultivation
of cereals is crucial for the development of complex hierarchical institutions and for the existence
of a farming surplus. On the other hand, both soil productivity and the reliance on non-cereal
34The 17 coe¢ cients reported in Figure (5), can also be described as the estimated coe¢ cients in 17 independentcross-country regressions, in which we regress the change in the hierarchy index between each of the 17 years in thesample (1050, 1100, .., 1850) and the year 1000 on the change in the caloric advantage of cereals over roots and tuberscaused by the Columbian exchange.
35
agriculture do not exert any e¤ect on hierarchy and surplus.
5 Concluding remarks
The prevailing scholarly view attributes the emergence of hierarchy to the increased productivity
of agriculture. It is presumed that this productivity increase generated food abundance, which in
turn led to population increase, specialization in crafts, exchange, and the rise of elite. We do
not challenge the perception that the transition away from egalitarianism towards hierarchy was
correlated with the shift to agriculture and to higher productivity, but we contend that the causal
mechanism may have little to do with the increase in productivity. Noting that states failed to
develop in regions that farm roots and tubers, and observing that hierarchies emerged also in some
hunter-gathering societies, we propose that the key aspect of the Neolithic, that brought about
the rise of a non-food producing elite, was reliance on seasonal stored food that rendered farmers
vulnerable to appropriation. That is, we identify the shift towards appropriable food sources as the
key causal element that explains the emergence of hierarchy and that accounts for cross regional
di¤erences in the complexity of hierarchy.
Our appropriability theory can be considered neo-Hobbesian, in the sense of emphasizing the
role of government in protecting individuals from theft, banditry and expropriation. However
it revises Hobbes ideas in identifying the need for protection as arising simultaneously with the
increased ability of the would-be rulers to appropriate. Moreover, it identi�es the emergence of
hereditary hierarchy not with the need to protect life among �savages�(hunter-foragers), but with
the protection of food stockpiles, mostly in cereal farming societies. Furthermore, our approach
avoids teleology: hierarchy does arise to serve a social purpose of protecting farmers; rather, in the
spirit of Olson (1993), it arises because it becomes feasible to tax and it serves the elite�s interest
to protect farmers from expropriation by others.
Our theoretical claims are illustrated with a simple model of agricultural societies. The main
testable prediction of the model is that the key variable that accounts for the emergence of hierarchy
is su¢ cient productivity advantage of cereals over roots and tubers, and that given this advantage,
absolute land productivity will have no e¤ect on hierarchy. Thus, whereas conventional theories
suggest that it is low agricultural productivity and disease which retard the development of tropical
36
regions, our theory and our empirical results suggest that the hurdle that held back the development
of hierarchical social institutions in the tropics was the relatively high productivity of crops that
provide farmers with substantial immunity against appropriation.
We note that Acemoglu, Johnson and Robinson (2002) question the role of geography in ac-
counting for current income disparities and argue that the underdevelopment of countries closer to
the equator is an outcome of the extractive institutions that colonizers established there.35 Ace-
moglu and Robinson (2012) also argue that inclusive institutions are the main source for economic
prosperity, and that institutions are by and large determined by the vagaries of human history.
Our own contribution identi�es a particular channel by which environmental factors a¤ect social
institutions, and one that may be particularly important for understanding the underdevelopment
of tropical countries. As Besley and Persson (2009, 2014) emphasize, underdevelopment is closely
correlated with low �scal capacity.36 But, whereas they view this correlation as a vicious cycle
that can be broken by investment in the ability to tax, our approach suggests that the low �scal
capacity may be a deep rooted problem in the tropics, and largely unrelated to the inheritance of
colonialism.35Easterly and Levine (2003) and Rodrik, Subramanian and Trebbi (2004) demonstrate empirically that the link
between the tropics and underdevelopment is indirect, due to the growth-retarding social institutions in tropicalcountries.36Gennaioli and Voth (2015) emphasize how investment in state capacity since the Middle-Ages responds to con�ict.
Dincecco and Prado (2012) and Dincecco and Katz (2014) show that state capacity is persistent, and has a positivee¤ect on economic performance.
37
References
[1] Acemoglu, Daron, Simon Johnson and James A. Robinson (2001) �The Colonial Origins of
Comparative Development: An Empirical Investigation,� American Economic Review, 91,
1369-1401.
[2] Acemoglu, Daron , Simon Johnson, and James A. Robinson (2002) �Reversal of Fortune: Ge-
ography and Institutions in the Making of the Modern World Income Distribution,�Quarterly
Journal of Economics 117: 1231-1294.
[3] Acemoglu Daron and James A. Robinson (2012), Why Nations Fail: The Origins of Power,
Prosperity, and Poverty, Random House.
[4] Alesina, Alberto, Giuliano, Paola and Nunn Nathan (2013) �On the Origins of Gender Roles:
Women and the plow,�The Quarterly Journal of Economics, 128, 155�194.
[5] Ashraf, Quamrul H. and Oded Galor (2011) �Dynamics and Stagnation in the Malthusian
Epoch,�American Economic Review, 101, 2003-2041.
[6] Besley, Timothy and Torsten Persson (2009) �The Origins of State Capacity: Property Rights,
Taxation and Politics,�American Economic Review, 99, 1218-1244.
[7] Besley, Timothy and Torsten Persson (2014) �Why Do Developing Countries Tax So Little?�
Journal of Economic Perspectives, 28, 99-120.
[8] Bettinger, Robert L. (1999) �From Traveler to Processor: Regional Trajectories of Hunter-
Gatherer Sedentism in the Inyo-Mono Region, California,� in Settlement Pattern Studies in
the Americas: Fifty Years since Virú, edited by Brian R. Billman and Gary M. Feinman,
Smithsonian Institution Press, 39-55.
[9] Bockstette, Valerie, Areendam Chanda and Louis Putterman, (2002) �States and Markets:
The advantage of an Early Start�, Journal of Economic Growth, 7, 347-369.
[10] Boix, Carles (2015) Political Order and Inequality: Their Foundations and Their Consequences
for Human Welfare, Cambridge University Press.
[11] Borcan, Oana, Ola Olsson and Louis Putterman, (2014) �State History and Economic Develop-
ment: Evidence from Six Millennia.�Brown University - Department of Economics -Working
Paper Series.
[12] Buonanno P., Durante, R., Prarolo G. and Vanin, P. (2015) �Poor Institutions, Rich Mines:
Resource Curse and the Origins of the Sicilian Ma�a, Economic Journal, 125, 175-202.
38
[13] Chiwona-Karltun, Linley, Chrissie Katundu, James Ngoma, Felistus Chipungu, Jonathan
Mkumbira, Sidney Simukoko, and Janice Jiggins. (2002) �Bitter cassava and women, an in-
triguing response to food security.�LEISA Magazine, 18, 1�15.
[14] Conley, Tim (1999), �Estimation with Cross Sectional Dependence,�Journal of Econometrics
92(1), 1-45.
[15] Cook, James (1784), A Voyage to the Paci�c Ocean Undertaken by the Command of His
Majesty for making Discoveries in the Northern Hemisphere, volume II, London.
[16] Dal Bó, Ernesto, Pablo Hernández and Sebastián Mazzuca (2015) �The Paradox of Civilization:
Pre-Institutional Sources of Security and Prosperity,�NBER working paper 21829.
[17] Denham, Tim (2011) �Early Agriculture and Plant Domestication in New Guinea and Island
Southeast Asia,�Current Anthropology, 52, S379-S395.
[18] Diamond, Jared (1997) Guns, Germs, and Steel: The Fates of Human Societies, Norton, New
York.
[19] Dincecco, Mark and Mauricio Prado (2012) �Warfare, Fiscal Capacity, and Performance,�
Journal of Economic Growth, 17, 171-203.
[20] Dincecco, Mark and Gabriel Katz (2014) �State Capacity and Long-Run Economic Perfor-
mance,�forthcoming, Economic Journal.
[21] Dow Gregory K. and Clyde G. Reed (2013) �The Origins of Inequality: Insiders, Outsiders,
Elites, and Commoners,�Journal of Political Economy, 121, 609-641.
[22] Easterly, William and Ross Levine, (2003) �Tropics, Germs, and Crops: How Endowments
In�uence Economic Development,�Journal of Monetary Economics, 50, 3�39.
[23] Fenske, James (2013) �Does land abundance explain African institutions?�Economic Journal
123, 1363-90
[24] Galor, Oded. and Omer Ozak, (2014) �The agricultural origins of time preference,� NBER
WP 20438.
[25] Gennaioli, Nicola and Ilia Rainer (2007) �The Modern Impact of Pre-Colonial Centralization
in Africa.�Journal of Economic Growth, 12, 185-234.
[26] Gennaioli, Nicola and Hans-Joachim Voth (forthcoming) �State Capacity and Military Con-
�ict,�Review of Economic Studies.
39
[27] Goring-Morris, Nigel and Anna Belfer-Cohen (2011) �Neolithization Processes in the Levant:
The Outer Envelope,�Current Anthropology, 52, S195-S208.
[28] Heizer, R.F. and Sturtevant, W.C. (1978) Handbook of North American Indians, Smithsonian
Institution, Washington, D.C.
[29] Johnson, AllenW and Earle, Timothy (2000) The Evolution of Human Societies: from Foraging
Group to Agrarian State. Stanford University Press; Second edition.
[30] Kuijt Ian (2008) �Demography and Storage Systems During the Southern Levantine Neolithic
Demographic Transition,� in The Neolithic Demographic Transition and its Consequences,
edited by Jean-Pierre Bocquet-Appel and Ofer Bar-Yosef, Springer, 287-313.
[31] Kuijt, Ian and Bill Finlayson (2009) �Evidence for Food Storage and Predomestication Gra-
naries 11,000 Years Ago in the Jordan valley,�Proceedings of the National Academy of Science,
106, 10966-10970.
[32] La Porta, Rafael, Florencio Lopez-de-Silanes, Andrei Shleifer and Robert W. Vishny. (1998).
�Law and Finance,�Journal of Political Economy 106, 1113-1155.
[33] Lenski, Gerhard, E. (1966) Power and Privilege: A Theory of Strati�cation, McGraw-Hill.
[34] Mayshar, Joram, Omer Moav, and Zvika Neeman, (2014) �Geography, Transparency and
Institutions.�Working paper.
[35] McNeill, William H. (1999) �How the Potato Changed the World�s History�, Social Research,
66, 67-83.
[36] Michalopoulos, Stelios and Elias Papaioannou (2013) �Pre-Colonial Ethnic Institutions and
Contemporary African Development.�Econometrica, 81, 113-52.
[37] Michalopoulos, Stelios and Elias Papaioannou (2014) �National Institutions and Subnational
Development in Africa,�Quarterly Journal of Economics, 129, 151-213.
[38] Miracle, Marvin P. (1966) Maize in Tropical Africa. University of Wisconsin Press.
[39] Mithen, Steven J. et al. (2011) �An 11,600 Year-old Communal Structure from the Neolithic
of Southern Jordan,�Antiquity, 85, 350�364.
[40] Montesquieu, Charles de Secondat, ([1748], 1989), The Spirit of the Laws, translated and
edited by Anne M. Cohler et al., Cambridge University Press.
[41] Murdock, George P. (1959) Africa: its peoples and their culture history. New York, McGraw-
Hill.
40
[42] Murdock, George P. (1967) Ethnographic atlas, Pittsburgh, University of Pittsburgh Press.
[43] Murdock, George P., Douglas R. White (1969) �Standard Cross-Cultural Sample.�Ethnology
9: 329�369.
[44] Nunn, Nathan, (2008) �The Long-Term E¤ects of Africa�s Slave Trades.�The Quarterly Jour-
nal of Economics 123(1), 139-176.
[45] Nunn, Nathan and Diego Puga, (2012) �Ruggedness: the Blessing of Bad Geography in Africa.�
The Review of Economics and Statistics 94, 20-36.
[46] Nunn, Nathan and Nancy Quian, (2011) �The Potato�s Contribution to Population and Ur-
banization: Evidence from an Historical Experiment.� The Quarterly Journal of Economics
126, 593-650.
[47] Olson, Mancur (1993) �Dictatorship, Democracy, and Development,�American Political Sci-
ence Review, 87, 567-576.
[48] Olsson, Ola and Douglas A. Hibbs Jr. (2005) �Biogeography and long-run Economic Develop-
ment,�European Economic Review, 49, 909-938.
[49] Price, T. Douglas and Ofer Bar-Yosef (2010) �Traces of Inequality at the Origins of Agriculture
in the Ancient Near East,�in Pathways to Power: New Perspectives on the Emergence of Social
Inequality, edited by T. Douglas Price and Gary Feinman, Springer, 147-168.
[50] Pryor, Frederic. L. (1985). �The Invention of the Plow.�Comparative Studies in Society and
History 27: 740-744.
[51] Purugganan, Michael D. and Dorian Q. Fuller (2011) �Archaeological data reveal slow rates
of evolution during plant domestication,�Evolution, 65, 171�183.
[52] Ramankutty, Navin, Jonathan A. Foley, John Norman and Kevin McSweeney (2002). The
global distribution of cultivable lands: current patterns and sensitivity to possible climate
change. Global Ecology and Biogeography 11(5), 377-392
[53] Rodrik, Dani, Arvind Subramanian and Francesco Trebbi (2004) �Institutions Rule: The
Primacy of Institutions over Geography and Integration in Economic Development,�Journal
of Economic Growth, 9, 131-165.
[54] Sachs, Je¤rey D., Andrew D. Mellinger, and John L. Gallup (2001) �The Geography of Poverty
and Wealth�Scienti�c American, 284, 71-74.
[55] Sahlins, Marshall (1972) Stone Age Economics, de Gruyter.
41
[56] Scott, James C. (2009) The Art of Not Being Governed: An Anarchist History of Upland
Southeast Asia, New Haven: Yale University Press.
[57] Spolaore, Enrico and Romain Wacziarg (2013) �How Deep Are the Roots of Economic Devel-
opment?�Journal of Economic Literature, 51, 1�45.
[58] Taylor, Walter W. (1973) �Storage and the Neolithic Revolution, � in Estudios Dedicados a
Prof. Dr. Luis Pericot, Barcelona: Publicaciones Eventuales, 23, 193�197.
[59] Testart, Alain (1982a) Les chasseurs-cueilleurs ou l�origine des inégalités, Societe
d�Ethnographie.
[60] Testart, Alain (1982b) �The Signi�cance of Food Storage among Hunter-Gatherers: Residence
patterns, Population densities, and Social Inequalities,�Current Anthropology, 23, 523-537.
[61] Testart, Alain (1982c) �Les tubercules sont-ils aux céréales comme la sauvagerie est à la civil-
isation?�Journal d�agriculture traditionnelle et de botanique appliquée, 29, 349-354.
[62] Tuden, A., Marshall, C. (1972) Political Organization: Cross-Cultural Codes 4.Ethnology 11:
436-64.
[63] Tushingham, Shannon and Robert L. Bettinger (2013) �Why Foragers Choose Acorns Before
Salmon: Storage, Mobility, and Risk in Aboriginal California,� Journal of Anthropological
Archaeology, 32, 527-537.
[64] Weidmann, Nils.B., Jan K. Rod, and Lars-Erik Cederman, (2010). �Representing Ethnic
Groups in Space: a New Dataset,�Journal of Peace Research 47, pp. 491-9.
[65] Weil David (2007) �Accounting for the E¤ect of Health on Economic Growth,� Quarterly
Journal of Economics, 122, 1265-1306.
[66] Weil, David (2010) �Endemic Diseases and African Economic Growth,� Journal of African
Economies, 19, supplement, 1-29.
[67] Wiessner, Polly and Akii Tumu (1998) Historical Vines: Enga networks of exchange, ritual,
and warfare in Papua New Guinea, Smithsonian Institution Press.
[68] Willcox, George, and Danielle Stordeur (2012), �Large-scale Cereal Processing before Domes-
tication During the Tenth Millennium cal BC in Northern Syria,�Antiquity, 86, 99-114.
[69] Woodburn, James (1980) �Hunters and Gatherers Today and Reconstruction of the Past,�
in Soviet and Western Anthropology, edited by Ernest Gellner, Columbia University Press,
95-117.
42
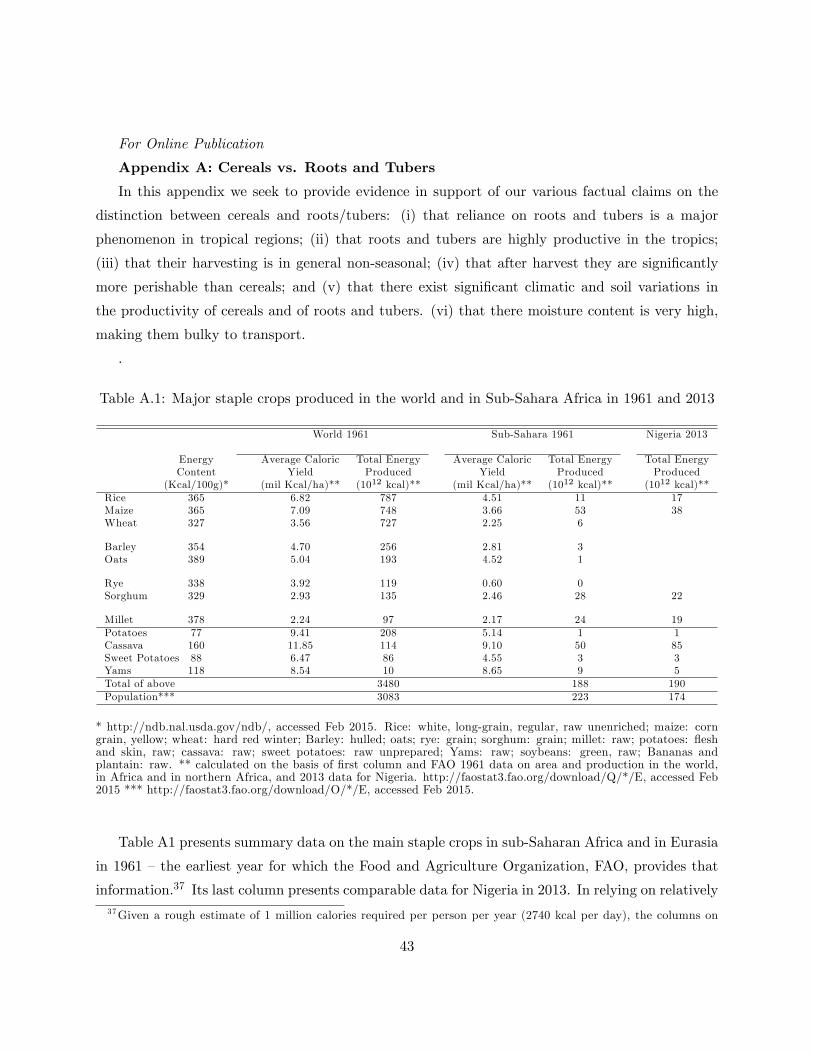
For Online Publication
Appendix A: Cereals vs. Roots and Tubers
In this appendix we seek to provide evidence in support of our various factual claims on the
distinction between cereals and roots/tubers: (i) that reliance on roots and tubers is a major
phenomenon in tropical regions; (ii) that roots and tubers are highly productive in the tropics;
(iii) that their harvesting is in general non-seasonal; (iv) that after harvest they are signi�cantly
more perishable than cereals; and (v) that there exist signi�cant climatic and soil variations in
the productivity of cereals and of roots and tubers. (vi) that there moisture content is very high,
making them bulky to transport.
.
Table A.1: Major staple crops produced in the world and in Sub-Sahara Africa in 1961 and 2013
World 1961 Sub-Sahara 1961 Nigeria 2013
Energy Average Caloric Total Energy Average Caloric Total Energy Total EnergyContent Yield Produced Yield Produced Produced
(Kcal/100g)* (mil Kcal/ha)** (1012 kcal)** (mil Kcal/ha)** (1012 kcal)** (1012 kcal)**Rice 365 6.82 787 4.51 11 17Maize 365 7.09 748 3.66 53 38Wheat 327 3.56 727 2.25 6
Barley 354 4.70 256 2.81 3Oats 389 5.04 193 4.52 1
Rye 338 3.92 119 0.60 0Sorghum 329 2.93 135 2.46 28 22
Millet 378 2.24 97 2.17 24 19Potatoes 77 9.41 208 5.14 1 1Cassava 160 11.85 114 9.10 50 85Sweet Potatoes 88 6.47 86 4.55 3 3Yams 118 8.54 10 8.65 9 5Total of above 3480 188 190Population*** 3083 223 174
* http://ndb.nal.usda.gov/ndb/, accessed Feb 2015. Rice: white, long-grain, regular, raw unenriched; maize: corngrain, yellow; wheat: hard red winter; Barley: hulled; oats; rye: grain; sorghum: grain; millet: raw; potatoes: �eshand skin, raw; cassava: raw; sweet potatoes: raw unprepared; Yams: raw; soybeans: green, raw; Bananas andplantain: raw. ** calculated on the basis of �rst column and FAO 1961 data on area and production in the world,in Africa and in northern Africa, and 2013 data for Nigeria. http://faostat3.fao.org/download/Q/*/E, accessed Feb2015 *** http://faostat3.fao.org/download/O/*/E, accessed Feb 2015.
Table A1 presents summary data on the main staple crops in sub-Saharan Africa and in Eurasia
in 1961 �the earliest year for which the Food and Agriculture Organization, FAO, provides that
information.37 Its last column presents comparable data for Nigeria in 2013. In relying on relatively37Given a rough estimate of 1 million calories required per person per year (2740 kcal per day), the columns on
43
recent data, our presumption is that the soil and climatic conditions have not changed signi�cantly
since the Neolithic period. We recognize, of course, that the plants that provide most of the calories
that humans consume have undergone major modi�cations since antiquity and that their availability
was greatly impacted by the post-Columbian migration of species between the continents.38
(i) The data in Table A1 reveals that roots and tubers provided 33.5 percent of the total calories
produced by the main staple crops in sub-Saharan Africa in 1961, and that cassava alone provided
about 45 percent of the total calories produced by these crops in Nigeria in 2013.
(ii) The table reveals further that the average caloric yield of cassava and yam in sub-Saharan
Africa (9.10 and 8.65 mil Kcal/Ha) exceeded the comparable world average yield of the three main
cereals, rice, maize and wheat (equal to 6.82, 7.09 and 3.56 mil Kcal/Ha, respectively).
(iii) The seasonality of cereals is well known. They have to be sown and reaped in a relatively
�xed time in the year, and usually once a year. On the other hand, roots and tubers are generally
perennial and may be harvested at any time during the year. In fact, cassava can be left intact
in the ground for two years. This provides farmers with much �exibility as to the timing of the
harvest, and prevents the need for signi�cant storage. Rees et al. (2012, p. 394) report: �Harvest
time [of Cassava] ranges from six to 24 months, and roots can be left in the ground until needed,
making cassava a very useful food security crop.�39
(iv) Harvested grains are storable with relatively little loss from one harvest to the next, and
even over several years. On the other hand, roots and tubers are in general perishable once out
of the ground, though to di¤erent degrees. In particular, cassava starts to rot at ambient African
temperature within 2-3 days of being harvested. The rotting of these roots and tubers is often
hastened by abrasions cause by uprooting and transportation. Rees et al. (2012, p. 394) summarize
the evidence: �Despite their agronomic advantages over grains, which are the other main staple
food crops, root crops are far more perishable. Out of the ground, and at ambient temperatures
these root crops have shelf lives that range from a couple of days for cassava . . . , two to four weeks
for sweet potato, to between four and 18 weeks for the natural dormancy of yams . . . �Cassava�s
fast rotting upon harvest can be overcome only by freezing or by laborious processing that turns
the moist root into dry �our.
total energy produced provide a crude estimate of the population (in millions) whose energy needs could be supportedby each crop (ignoring the feeding of animals, seed requirements and wastage). It is evident that the total energyproduced by the listed twelve major crops could roughly feed the entire population.38While varieties of yam were known in the entire tropical zone, including Asia, Africa and South America, and
are believed to have been cultivated in New Guinea as early as eight millennia ago, maize, potato, sweet potato andcassava were introduced to the Old World from America.39See also Lebot (2009) and Bradshaw (2010).
44
(v) Lebot (2009) lists the optimal annual rainfall for cassava, yams and sweet potato as ranging
from 750 to 1500 mm of rain, and the optimal temperature as 20-30 degrees centigrade. This
reveals that while these crops are cultivable in the tropics, they cannot be cultivated in temperate
climates.
(vi) According to Lebot (pp. vi, 78) the moisture content of cassava is 63% of the weight, and
that of sweet potato and yam is 71% and 74% respectively.
By these considerations, even though the potato is biologically a tuber, for our concern here
with the degree of appropriability, it may as well be considered a quasi-cereal, since it is cultivable
in temperate climates, is seasonal, and is relatively non-perishable upon harvesting.
References
[1] Bradshaw, J. E. (editor), (2010) Root and Tuber Crops, Springer.
[2] Lebot, Vincent (2009) Tropical Root and Tuber Crops: Cassava, Sweet Potato, Yams and
Aroids, CABI.
[3] Rees, Debbie et al. (2012) �Tropical Root Crops,�in Crop Post-Harvest: Science and Technology
�Perishables, edited by Debbie Rees, Graham Farrell and John Orchard, Blackwell-Wiley, 392-
413.
45
For Online Publication
Appendix B: The emergence of hierarchy: a literature survey and critique
Anthropologists and archaeologists have long concluded that hunter-gatherer societies were
fairly egalitarian and ostensibly leaderless �in sharp distinction to the hierarchical nature of ape
communities.40 In this appendix we survey the extensive literature that links the transition to
agriculture with the shift from egalitarianism toward hierarchy.41
The productivity-and-surplus theory for explaining the emergence of hierarchy
The idea that it is agriculture that generates surplus, and surplus that gives rise to hierarchy,
is an old one. It can be traced to Adam Smith and to earlier seventeenth century social thinkers.42
According to Smith, government and property protection �rst emerged with the transition to
pastoralism and the need to protect herds from theft (Smith 1978, p. 16), but only the subsequent
transition to agriculture generated surplus, division of labor, and exchange, and thus extended
signi�cantly the role of government (1978, p. 409).43
For Smith and his intellectual heirs surplus had to be available before the landlord, the cap-
italist or the ruler could seize it. Engels similarly stated that in pre-agricultural societies �Food
had to be won anew day by day�and �Human labor power. . . yielded no noticeable surplus as yet
over the cost of its maintenance�(1978, p. 65). It was the adoption of agriculture and the surplus
that it generated that triggered the transition from classless society to a class society in which
the usurpation of labor surplus was the essential source of class division. These ideas were highly
in�uential in subsequent theories of social evolution. According to Childe (1936), the transition to
agriculture resulted in food surplus that enabled individuals to specialize in non-farming activities.
This surplus, and the concomitant resort to trade, helped create political integration and led even-
tually to the formation of city-states under a state bureaucracy. Agricultural surplus was thus a
precondition for the emergence of artisans and elite in urban centers.
40See Boehm (1999) for a review of the literature about this early transition to egalitarianism.41The timing and location of the initial transition to agriculture in the fertile crescent are commonly explained as
due to climatic changes that led to evolutionary modi�cations in plant species (and in particular to grasses with largerseeds, to cope with the extended summer drought) which facilitated the adoption of these grasses by humans foragers(Bar-Yosef and Meadow, 1995; Diamond, 1997). An alternative explanation contends that it was food shortage dueto population pressure that led hunter-gatherers to engage in agriculture. Richerson, Boyd and Bettinger (2001, pp.388-389) debunk this theory by employing a similar Malthusian argument to the one we use against the idea thatpopulation pressure led to the rise of hierarchy.42Meek (1976) and Aspromourgos (1996) review the surplus theories up to Adam Smith and Karl Marx.43 In emphasizing the role of appropriable property among pastoralists, Adam Smith can be considered to have
anticipated our appropriability theory. However, in the case of pastoralists he adopted a functionalist approach andemphasized that government became �necessary,�rather than that it became possible. Moreover, when he turned toagriculture, he reverted to emphasize the role of surplus as generating a demand for government.
46
In an in�uential similar theory of human development, Lenski (1966) views societies as advancing
due to technological progress, and Integrates functionalist and con�ict approaches. He contends that
the egalitarian hunter-gatherers could not produce a surplus, but with progressively more advanced
farming technologies generated surplus of goods and services. Social �power� then emerged to
�determine the distribution of nearly all of the surplus possessed by a society�(p. 44). In a more
recent survey of the anthropological and archaeological literature on the emergence of inequality
in the Ancient Near East, Price and Bar-Yosef (2010) reach a similar conclusion: �The success of
early cultivation and the advantages a¤orded by the genetic mutations among plants and animals,
allows for rapid increase in human population ... Cultivation also supported a stable economy with
surplus that resulted in the formation of elite groups as predicted by Lenski�(1966, p. 160).44
Diamond�s (1997) theory conforms to this conventional view. He illustrates his environmental
explanation for current income disparities by comparing two groups of seafaring migrants in the
Paci�c whose ancestors were farmers. One group settled on an island whose environment forced
them to revert to hunting-gathering, and �Since as hunter-gatherers they did not produce crop
surpluses available for redistribution or storage, they could not support and feed non-hunting
craft specialists, armies, bureaucrats, and chiefs." The other group landed on an island that was
suitable for agriculture, and �With the crop surpluses that they could grow and store, they fed craft
specialists, chiefs, and part-time soldiers.�Diamond summarizes his theory by stating (p. 92): �In
short, plant and animal domestication meant much more food . . . The resulting food surpluses
. . . were a prerequisite for the development of settled, politically centralized, socially strati�ed,
economically complex, technologically innovative societies.�He then applies this logic to attribute
the economic advantage of Eurasia over Africa, America and the Paci�c to Eurasia�s east-west
orientation which enabled the exploitation of a greater variety of domesticated plants and animals
and thus led to more productive agriculture.
Other theories for explaining the emergence of hierarchy
We are not the �rst to �nd fault with the surplus theory for the emergence of hierarchy. Others
have already pointed out that an increase in productivity may be dissipated in various ways, without
leading to any surplus. Pearson (1957) contended that cultural needs would evolve to eliminate
44 In a review of the literature on �transegalitarian�North American societies of hunter-gatherers, Hayden (2001, p.242) reaches a similar assessment: �With food production, in some favorable (productive) locations in the world, evengreater levels of surplus production became possible. In these situations, social inequality could develop into even moreextreme forms resulting in chiefdoms, states and empires.�Associating the emergence of elite with �aggrandizing�activities, and associating these activities with the use of surpluses (p. 247), Hayden concludes: �the surplus-basedpolitical models have proved to be far more insightful and rich with more interesting explanations [of complexity andinequality] than other approaches�(p. 265).
47
any surplus. Sahlins (1972) argued that hunter-gatherers could easily procure food beyond their
immediate needs, but deliberately refrained from doing so by preferring leisure. He infers that
the �rst farmers could have responded to increased productivity similarly by working less hard,
without producing any surplus. Sahlins thus concludes (p. 140): �Leadership continually generates
domestic surplus,�claiming (like us) that it was hierarchy that generated surplus and not vice versa.
Sahlins, though, doesn�t answer the key questions: what accounts then for the rise of leadership
and why did its emergence correlate with agriculture?
Another in�uential theory poses that the increased productivity of agriculture accounts for the
emergence of hierarchy, not directly, via the availability of surplus, but indirectly, through the
resulting swell in population. Increased population density is claimed to have led to deterioration
of living conditions and to �ercer competition over resources, violence and warfare. These adverse
social developments are claimed to have necessitated the reorganization of society into ever more
complex social forms, leading ultimately to the formation of the central state �see Johnson and
Earle (2000). Carneiro�s (1970) in�uential �circumscription theory,�o¤ers a variant of this popula-
tion pressure and con�ict argument. Motivated by the contrasting political structures that evolved
in the valleys of Peru and in Amazonia, he proposed that states arise as a result of con�ict over
farming land among autonomous farming villages, when the winner is able to subjugate the losers
and to extract from them ongoing surplus, due to the losers�geographic entrapment. In applying
this theory, Carneiro contends (p. 735) that states could not emerge in the Amazon basin, in spite
of the �almost unlimited agricultural land�, because �the vanquished could �ee to a new locale,
subsisting there about as well as they had subsisted before, and retaining their independence.�In
contrast, �in Peru . . . this alternative was no longer open to the inhabitants of defeated villages.
The mountains, the desert, and the sea . . . blocked escape in every direction.�
Carneiro�s puzzlement over limited social complexity in Amazonia is analogous to Diamond�s
similar concern with respect to New Guinea and the Paci�c Islands. Yet the environmental theories
that each of them o¤ers are inconsistent with the geographical evidence that motivates the other.
Diamond�s theory about the advantage of an east-west orientation of a land-mass can hardly resolve
Carneiro�s comparison between Peru and Amazonia. And Carneiro�s circumscription theory fails
to resolve Diamond�s concern about limited social complexity in the Paci�c tropical islands. Our
appropriability theory resolves the puzzles that motivated both scholars: whereas agriculture in the
tropical Amazon and the Paci�c islands was based on tuber crops, farming in the western valleys
of the Andes relied mostly on maize.45
45The formation of Mayan state societies in the tropical lowlands of Mexico, where maize was �rst domesticated
48
Dow and Reed (2013) associate hierarchy with con�ict over land. They suggest that hierarchy
emerged after those who gained control over the most fertile farming land organized themselves in
order to exclude outsiders, and to employ these outsiders as workers. Boix (2015) o¤ers another
variant of a con�ict theory in which technological shocks associated with the transition to agricul-
ture caused inequality between insiders, who were able to bene�t from the new technologies, and
outsiders. This inequality broke down the social order of statelessness and cooperation of earlier
non-farming societies, and led outsiders to raid the more productive insiders. This led to the emer-
gence of two types of states to protect the insiders: dictatorships by outside bandits who turned
stationary (as proposed by Olson, 1993); or republics managed by the insiders. Dal Bó, Hernández
and Mazzuca (2015) focus on how farmers�higher insecurity discourages investment, and how this
�paradox of civilization�was resolved by the development of defense capacity.
Other theories invoke alternative functional explanations for the coincidence between the emer-
gence of hierarchy and farming. One theory associates the emergence of hierarchy with social
storage as a bu¤er for shortages. Halstead (1989) suggests that early farmers generated �normal
surplus�above their subsistence needs in average years, as a precaution against years of shortage.
The elite emerged as a �social storage agent,�e¤ectively serving as a mutual insurance agency, to
coordinate and redistribute between surplus and de�cit households.46 Leaving aside the plausibility
of the benevolence that this theory attributes to the elite, we note that this interpretation misses
the point that storage of cereals was primarily and necessarily intra-annual, due to the seasonality
of cereals.47 Storage of cereals as an inter-annual bu¤er is feasible and plausible, but it is unlikely
that such longer-term storage played a signi�cant role among the earliest farmers who continued
to forage alongside farming, or that it had a major role in triggering the emergence of hierarchy.
Another in�uential functional theory was articulated by Wittfogel (1957). He relied on evidence
from the major civilizations of antiquity, to contend that strong despotic hierarchies were required
in riverine environments in order to realize their agricultural potential through the construction
and management of large irrigation projects. Wittfogel�s many critics pointed out that irrigation
projects in the early civilizations were constructed by local communities, prior to the emergence of
and became the staple crop, provides additional support for our theory on the preponderant importance of cultivatingcereals rather than tubers for the emergence of hierarchy. The migration of domesticated maize from the northernhemisphere to South America (Piperno and Pearsall, 1998) provides an important counter-example to Diamond�sclaim on the lack of mobility of plant species across the equator.46See also Johnson and Earle (2000, pp. 251-256, 301-302).47Hayden (2001) questions the validity of the presumption that the elite altruistically provided such insurance
services, remarking (p. 247) that he �was completely astonished . . . that local elites provided essentially no help toother members of the community in times of crisis.�
49
a strong central state, and that even after the emergence of such central states, the management of
these irrigation systems remained with the local elites. But this critique fails to explain the source
of the correlation that Wittfogel identi�ed between irrigation and strong states. Mayshar, Moav,
and Neeman (2014) suggest that the direction of causality may have been a reverse one: it is not
that a need for irrigation led to a despotic state, but rather that irrigation systems enabled control
and expropriation by the central state �in analogy to the interpretation here that the need to store
food facilitated con�scation.
A third functional theory focuses on the demand for law and order to facilitate trade. On the
basis of evidence from Africa, Bates (1983) argues that ecologically diverse environments increase
the returns from trade and thus increase the demand for hierarchy.48 Fenske (2014) and Litina
(2014) provide evidence for this theory. We interpret their �ndings as consistent with our general
appropriability approach, since trade also facilitates taxation. Our focus here, though, is on societies
in which farming was the predominant potential tax base.
Finally, there exist also a growing number of scholars who, in Weber�s spirit, challenge the
conventional materialistic socio-economic explanations for the emergence of hierarchy and reverse
the causal direction between agriculture and hierarchy. These scholars maintain that hierarchy,
possibly in association with centralized religion, preceded agriculture and, in fact, led to agriculture.
Cauvin (2000) argues that the willingness of hunter gatherers to abandon their traditional ways of
life and engage in farming was conditioned by a prior change in collective psychology and with the
rise of religion (�the birth of the Gods�). Acemoglu and Robinson (2012, pp. 139-142) suggest in
that spirit that an institutional innovation among the semi-sedentary Natu�ans in the ancient Near
East enabled a political elite to gain power and to extract resources from the rest of society. It is
to this political elite that they attribute �the transition �rst to sedentary life and then to farming�
(p. 140).
In suggesting that hierarchy was the cause of surplus, rather than its consequence, this theory
resembles ours. However, it is diametrically di¤erent in that we seek to explain the emergence of
hierarchical institutions, taking the transition to farming as given. As we argue, this does not mean
that hierarchy lagged behind agriculture, for even the earliest phases of the transition to reliance
on cereals �which involved the collection and storage of natural grains, prior to cultivation and
domestication �implied a fundamental shift in the vulnerability to appropriation. It is this shift,
we argue, which increased the e¢ cacy of thievery and led to a rise of hierarchy, in parallel to the
gradual development of cultivation, domestication, and increased productivity and population. As
48Algaze (2008) applies an analogous theory to explain the emergence of ancient Sumer.
50
noted, our approach has also the merit of accounting also for the emergence of hierarchy among
pre-agricultural complex foraging societies, as well as for explaining the social di¤erences between
farming societies that rely on non-appropriable crops, and those that rely on appropriable crops
(mainly cereals).
References
[1] Acemoglu Daron and James A. Robinson (2012), Why Nations Fail: The Origins of Power,
Prosperity, and Poverty, Random House.
[2] Algaze, Guillermo (2008) Ancient Mesopotamia at the dawn of Civilization: The Evolution of
an Urban Landscape, University of Chicago Press.
[3] Aspromourgos, Tony (1996), On the origins of classical economics: distribution and value from
William Petty to Adam Smith, Routledge.
[4] Bar-Yosef, Ofer and Richard H. Meadow, (1995), �The Origins of Agriculture in the Near East,�
in Last Hunter�First Farmers: New Perspectives on the Prehistoric Transition to Agriculture,
edited by T. Douglas Price and Anne Brigitte Gebauer, School of American Research Press,
39-94.
[5] Bates, Robert H. (1983) Essays on the Political Economy of Rural Africa, University of Cali-
fornia Press.
[6] Boehm, Christopher (1999) Hierarchy in the Forest: The Evolution of Egalitarian Behavior,
Harvard University Press.
[7] Boix, Carles (2015) Political Order and Inequality: Their Foundations and Their Consequences
for Human Welfare, Cambridge University Press.
[8] Carneiro, Robert (1970) �A Theory of the Origin of the State,�Science, 169, 733�738.
[9] Cauvin, Jacques, (2000) The Birth of the Gods and the Origins of Agriculture, translated by
Trevor Watkins, Cambridge University Press.
[10] Childe, V. Gordon (1936) Man Makes Himself, Watts & Co.
51
[11] Dal Bó, Ernesto, Pablo Hernández and Sebastián Mazzuca (2015) �The Paradox of Civilization:
Pre-Institutional Sources of Security and Prosperity,�NBER working paper 21829.
[12] Diamond, Jared (1997) Guns, Germs, and Steel: The Fates of Human Societies, Norton, New
York.
[13] Dow Gregory K. and Clyde G. Reed (2013) �The Origins of Inequality: Insiders, Outsiders,
Elites, and Commoners,�Journal of Political Economy, 121, 609-641.
[14] Fenske James (2014) �Ecology, trade and states in pre-colonial Africa,�Journal of the European
Economic Association, 12, 612�640.
[15] Halstead, Paul, (1989), �The Economy has a normal Surplus: Economic Stability and Social
Change among Early Farming Communities of Thessaly, Greece,�in Bad Year Economics: Cul-
tural Responses to Risk and Uncertainty, edited by Paul Halstead and John O�Shea, Cambridge
University Press, 68-80.
[16] Hayden, Brian (2001) �Richman, Poorman, Beggarman, Chief: The Dynamics of Social In-
equality,�in Archaeology at the Millennium: A Sourcebook, edited by Gary M. Feinman and T.
Douglas Price, Kluwer, 231-272.
[17] Johnson, AllenW and Earle, Timothy (2000) The Evolution of Human Societies: from Foraging
Group to Agrarian State. Stanford University Press; Second edition.
[18] Lenski, Gerhard, E. (1966) Power and Privilege: A Theory of Strati�cation, McGraw-Hill.
[19] Litina, Anastasia (2014) �The Geographical Origins of Early State Formation,�WP.
[20] Mayshar, Joram, Omer Moav, and Zvika Neeman, (2014) �Geography, Transparency and
Institutions.�Working paper.
[21] Meek, Ronald L. (1976) Social Science and the Ignoble Savage, Cambridge University Press.
[22] Olson, Mancur (1993) �Dictatorship, Democracy, and Development,�American Political Sci-
ence Review, 87, 567-576.
[23] Pearson, Harry W. (1957) �The economy has No Surplus: Critique of a Theory of Develop-
ment,�in Trade and Market in the Early Empires: Economies in History and Theory, edited by
Karl Polanyi, Conrad Arensberg and Harry W. Pearson, Free Press, 320-341.
52
[24] Piperno, Dolores R. and Deborah M. Pearsall (1998) The Origins of Agriculture in the Lowland
Neotropics, Academic Press.
[25] Price, T. Douglas and Ofer Bar-Yosef (2010) �Traces of Inequality at the Origins of Agriculture
in the Ancient Near East,�in Pathways to Power: New Perspectives on the Emergence of Social
Inequality, edited by T. Douglas Price and Gary Feinman, Springer, 147-168.
[26] Richerson, Peter J., Robert Boyd and Robert L. Bettinger (2001) �Was Agriculture Impossible
During the Pleistocene but Mandatory During the Holocene? A Climate Change Hypothesis,�
American Antiquity, 66, 387-411.
[27] Sahlins, Marshall (1972) Stone Age Economics, de Gruyter.
[28] Smith, Adam (1978) Lectures on Jurisprudence, edited by R.L. Meek, D.D. Raphael and P.G.
Stein, Oxford University Press.
[29] Wittfogel, Karl A. (1957) Oriental Despotism: A Comparative Study of Total Power, Yale
University Press.
53
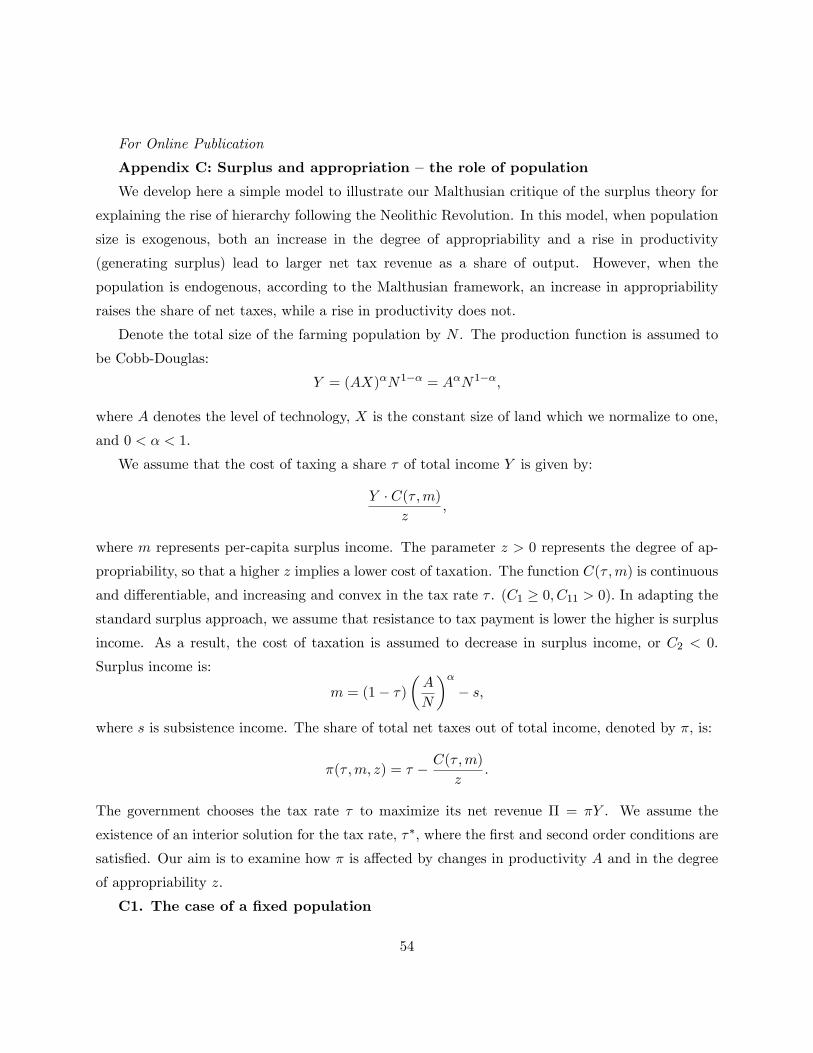
For Online Publication
Appendix C: Surplus and appropriation �the role of population
We develop here a simple model to illustrate our Malthusian critique of the surplus theory for
explaining the rise of hierarchy following the Neolithic Revolution. In this model, when population
size is exogenous, both an increase in the degree of appropriability and a rise in productivity
(generating surplus) lead to larger net tax revenue as a share of output. However, when the
population is endogenous, according to the Malthusian framework, an increase in appropriability
raises the share of net taxes, while a rise in productivity does not.
Denote the total size of the farming population by N . The production function is assumed to
be Cobb-Douglas:
Y = (AX)�N1�� = A�N1��;
where A denotes the level of technology, X is the constant size of land which we normalize to one,
and 0 < � < 1.
We assume that the cost of taxing a share � of total income Y is given by:
Y � C(� ;m)z
;
where m represents per-capita surplus income. The parameter z > 0 represents the degree of ap-
propriability, so that a higher z implies a lower cost of taxation. The function C(� ;m) is continuous
and di¤erentiable, and increasing and convex in the tax rate � . (C1 � 0; C11 > 0): In adapting thestandard surplus approach, we assume that resistance to tax payment is lower the higher is surplus
income. As a result, the cost of taxation is assumed to decrease in surplus income, or C2 < 0.
Surplus income is:
m = (1� �)�A
N
��� s;
where s is subsistence income. The share of total net taxes out of total income, denoted by �; is:
�(� ;m; z) = � � C(� ;m)z
:
The government chooses the tax rate � to maximize its net revenue � = �Y . We assume the
existence of an interior solution for the tax rate, ��, where the �rst and second order conditions are
satis�ed. Our aim is to examine how � is a¤ected by changes in productivity A and in the degree
of appropriability z.
C1. The case of a �xed population
54
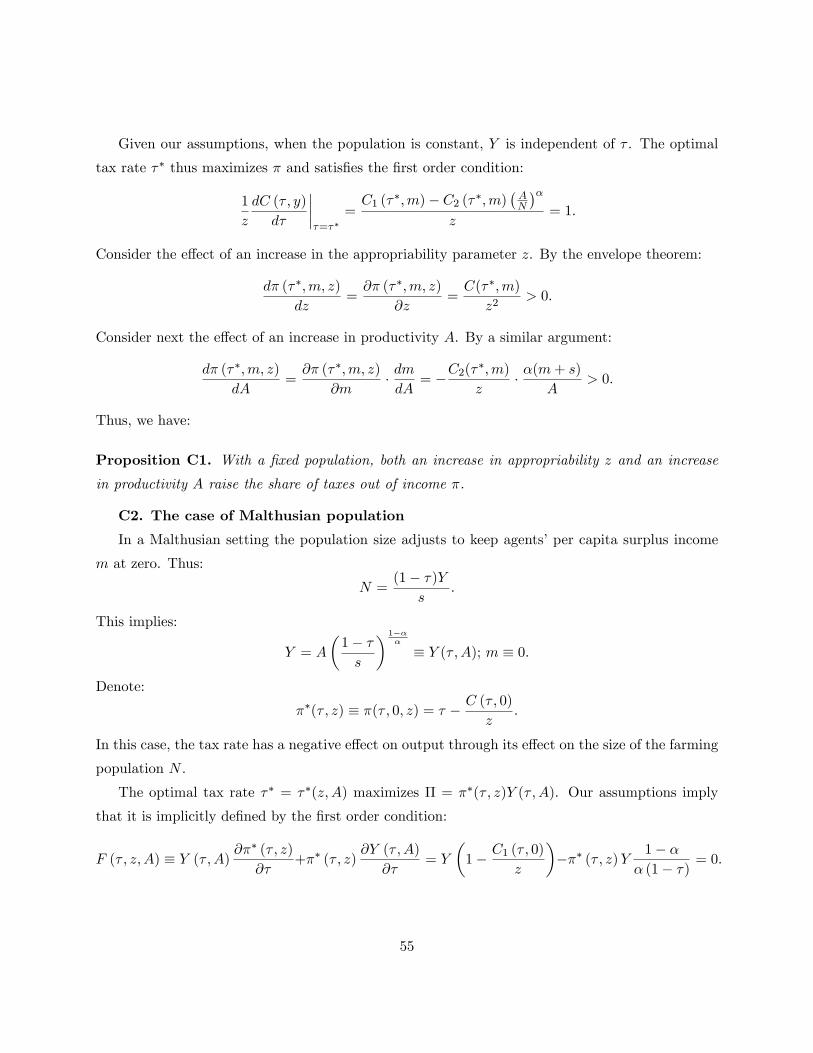
Given our assumptions, when the population is constant, Y is independent of � . The optimal
tax rate �� thus maximizes � and satis�es the �rst order condition:
1
z
dC (� ; y)
d�
�����=��
=C1 (�
�;m)� C2 (��;m)�AN
��z
= 1:
Consider the e¤ect of an increase in the appropriability parameter z. By the envelope theorem:
d� (��;m; z)
dz=@� (��;m; z)
@z=C(��;m)
z2> 0:
Consider next the e¤ect of an increase in productivity A. By a similar argument:
d� (��;m; z)
dA=@� (��;m; z)
@m� dmdA
= �C2(��;m)
z� �(m+ s)
A> 0:
Thus, we have:
Proposition C1. With a �xed population, both an increase in appropriability z and an increase
in productivity A raise the share of taxes out of income �.
C2. The case of Malthusian population
In a Malthusian setting the population size adjusts to keep agents�per capita surplus income
m at zero. Thus:
N =(1� �)Y
s:
This implies:
Y = A
�1� �s
� 1���
� Y (� ; A); m � 0:
Denote:
��(� ; z) � �(� ; 0; z) = � � C (� ; 0)z
:
In this case, the tax rate has a negative e¤ect on output through its e¤ect on the size of the farming
population N .
The optimal tax rate �� = ��(z;A) maximizes � = ��(� ; z)Y (� ; A). Our assumptions imply
that it is implicitly de�ned by the �rst order condition:
F (� ; z; A) � Y (� ; A) @�� (� ; z)
@�+�� (� ; z)
@Y (� ; A)
@�= Y
�1� C1 (� ; 0)
z
���� (� ; z)Y 1� �
� (1� �) = 0:
55
Thus, at the optimum ��:
@�� (� ; z)
@�= ��
� (� ; z)
Y (� ; A)� @Y (� ; A)
@�= �� (� ; z) � 1� �
� (1� �) > 0:
In addition,
d�� (�� (z;A) ; z)
dz=@�� (�� (z;A) ; z)
@�
d�� (z;A)
dz+@�� (��; z)
@z=@�� (��; z)
@�
d��
dz+C(��; 0)
z2:
To prove that this expression is positive, it is su¢ cient to prove that @��=@z is positive. By the
Implicit-Function Theorem, for F (� ; z; A) de�ned above:
@��
@z= � @F=@z
@F=@�
���� ;and by the second-order conditions: @F=@� < 0. Thus,
sign
�@��
@z
�= sign
�@F
@z
����� :Now,
@F
@z= Y � C1 (� ; 0)
z2+C (� ; 0)
z2� Y � 1� �
� (1� �) > 0:
Similarly,d�� (�� (z;A) ; z)
dA=@�� (�� (z;A) ; z)
@�
d�� (z;A)
dA:
Once again by the Implicit Function Theorem: sign�@��
@A
�= sign
�@F@A
���. But@F (� ; z; A)
@A=@�� (� ; z)
@�� @Y (� ; A)
@A+ �� (� ; z) � @
2Y (� ; A)
@�@A:
Since @Y (�;A)@A = Y (�;A)
A and @2Y (�;A)@�@A =
@Y (�;A)@�A ; we have:
@F (� ; z; A)
@A=F (� ; z; A)
A:
Since the �rst order conditions require F (� ; z; A) = 0, it follows that @��
@A = 0 so that
d�� (�� (z;A) ; z)
dA= 0:
Thus, we have:
56
Proposition C2. With Malthusian population, an increase in appropriability z raises the share of
taxes in the economy �, but an increase in productivity A leaves that share intact.
57
For Online Publication
Appendix D: Risk-Averse Farmers
In this appendix we illustrate the robustness of the model�s qualitative predictions when farmers
are risk averse. The results are in a sense even stronger, given that risk-averse farmers under anarchy
seek more protection by choosing a smaller share of cereals. Farmers�risk aversion does not a¤ect
the analysis of the model under a regime of hierarchy since in this case the tax rate that the
state imposes is certain. We chose to illustrate the case of anarchy with risk-averse farmers by
examining a case where a simple analytic solution can be obtained. For that purpose, we employ
the speci�cation of the expropriation function, �(�) = �p�, as in the model�s example, and consider
the case where farmers have a log-utility function: u (I) = log (I) : Farmers under anarchy thus
chose � � 0 to maximize the expected utility:
U(I) = (1� �) log (� + (1� �) (1� �)) + � log (1� �) (1� �) :
The solution is
�A = max
�� � ��; 0
�:
Non-farmers�freedom to enter banditry implies: s = ��=� (�) : And thus:
�A =�2�As:
Solving for the equilibrium values of (�A; �A) yields (when �A > 0):
�A =s�
�2 + s�; �A =
�2�
�2 + s�:
Inspection of the equilibrium values of (�A; �A) reveals that as � tends to zero, both �A and �A
tend to zero. As � increases towards one, �A approaches �2=(�2+ s) and �A approaches s=(�2+ s).
This implies that even in the limit, when the productivity of tubers approaches zero, they are still
grown by farmers.
Compared to the model with risk neutrality (in the preceding sub-section), the introduction
of risk aversion implies that farmers reduce the cultivation of cereals �A, and increase the share
of land devoted to tubers as a device for self-insurance. Consequently the con�scation rate �A is
lower, and the measure of banditry �A is smaller as well.
While the former e¤ect tends to increase overall ine¢ ciency, the total e¢ ciency e¤ect of in-
troducing risk aversion in a regime of anarchy is positive. To recall from corollary 1, under risk
58
neutrality the overall ine¢ ciency (1� �A) �+s�A is equal to �. This is smaller than the ine¢ ciencyunder risk aversion, which under our speci�cation is equal to (1� �A) �+�As = ���A (� � �A) < �.Correspondingly, the expected income of each farmer under anarchy is also higher under risk aver-
sion, because
(1� �A) (�A + (1� �) (1� �A)) + �A (1� �) (1� �A) = 1 � � + (� � �A)�A is equal to 1 � �under risk neutrality, but is strictly larger under risk aversion because under risk aversion �A < �.
The reason for this is that under risk neutrality farmers in a mixed equilibrium are indi¤erent
between growing cereals and tubers and so derive an identical income of 1� �. In contrast, underrisk aversion, farmers derive a strictly larger expected income from cereals to compensate for the
risk associated with cereals, which pushes their expected income higher.49 The �gure illustrates
the di¤erence between the two types of equilibrium: the case of risk neutral farmers and risk averse
farmers.
49This implies that risk neutral farmers would bene�t if they could commit to grow less cereals in equilibrium,which we assume they cannot. The problem is that when a farmer decides how much cereal to grow, he ignores thenegative externality this imposes on other farmers through contributing to the measure of bandits.
59
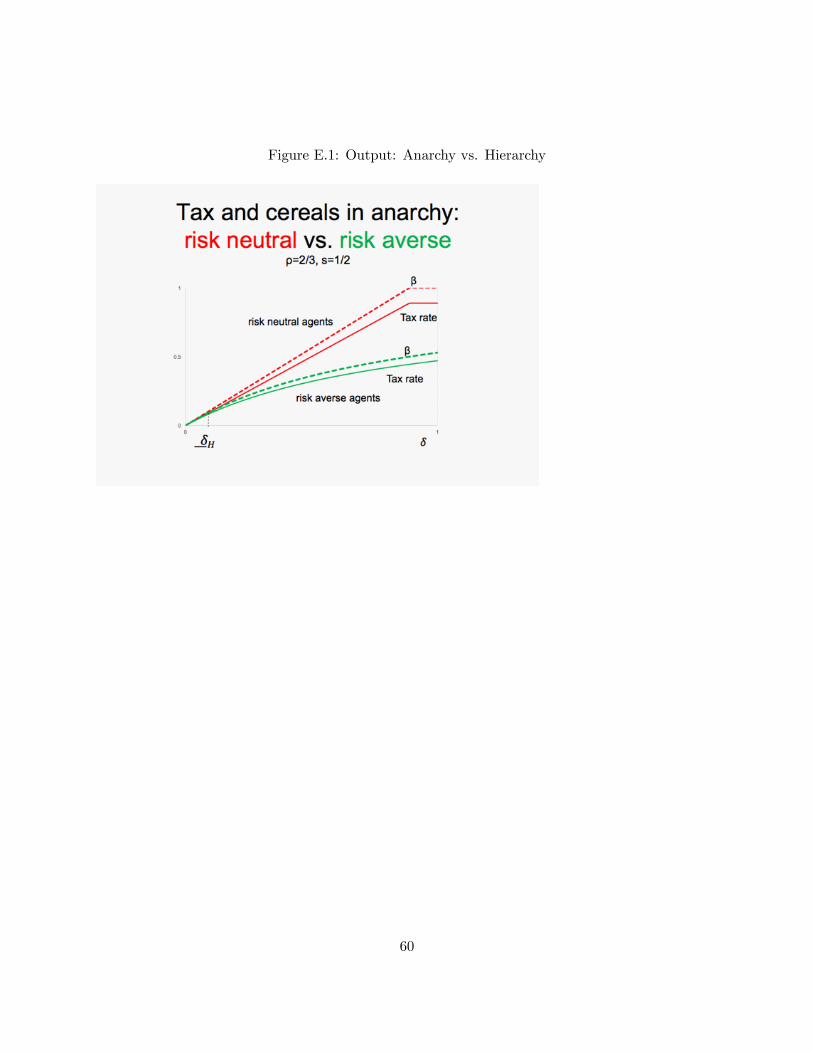
Figure E.1: Output: Anarchy vs. Hierarchy
60

For Online Publication
Appendix E: Additional Evidence
61
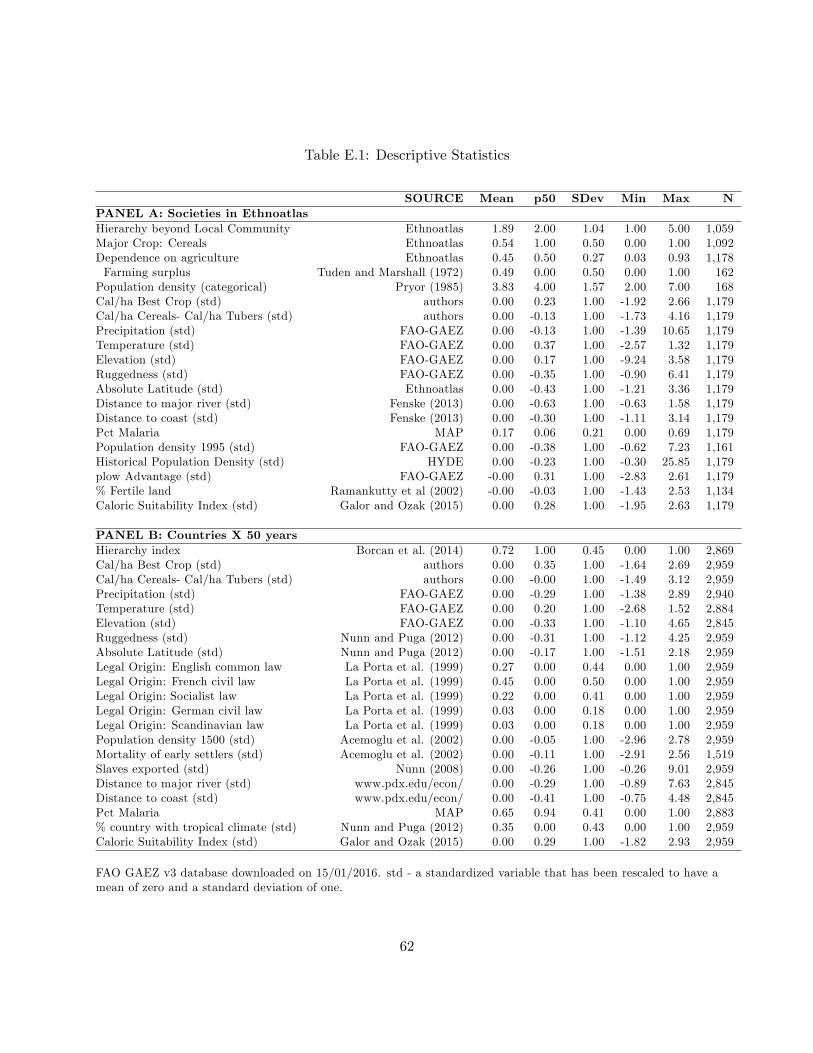
Table E.1: Descriptive Statistics
SOURCE Mean p50 SDev Min Max NPANEL A: Societies in EthnoatlasHierarchy beyond Local Community Ethnoatlas 1.89 2.00 1.04 1.00 5.00 1,059Major Crop: Cereals Ethnoatlas 0.54 1.00 0.50 0.00 1.00 1,092Dependence on agriculture Ethnoatlas 0.45 0.50 0.27 0.03 0.93 1,178Farming surplus Tuden and Marshall (1972) 0.49 0.00 0.50 0.00 1.00 162Population density (categorical) Pryor (1985) 3.83 4.00 1.57 2.00 7.00 168Cal/ha Best Crop (std) authors 0.00 0.23 1.00 -1.92 2.66 1,179Cal/ha Cereals- Cal/ha Tubers (std) authors 0.00 -0.13 1.00 -1.73 4.16 1,179Precipitation (std) FAO-GAEZ 0.00 -0.13 1.00 -1.39 10.65 1,179Temperature (std) FAO-GAEZ 0.00 0.37 1.00 -2.57 1.32 1,179Elevation (std) FAO-GAEZ 0.00 0.17 1.00 -9.24 3.58 1,179Ruggedness (std) FAO-GAEZ 0.00 -0.35 1.00 -0.90 6.41 1,179Absolute Latitude (std) Ethnoatlas 0.00 -0.43 1.00 -1.21 3.36 1,179Distance to major river (std) Fenske (2013) 0.00 -0.63 1.00 -0.63 1.58 1,179Distance to coast (std) Fenske (2013) 0.00 -0.30 1.00 -1.11 3.14 1,179Pct Malaria MAP 0.17 0.06 0.21 0.00 0.69 1,179Population density 1995 (std) FAO-GAEZ 0.00 -0.38 1.00 -0.62 7.23 1,161Historical Population Density (std) HYDE 0.00 -0.23 1.00 -0.30 25.85 1,179plow Advantage (std) FAO-GAEZ -0.00 0.31 1.00 -2.83 2.61 1,179% Fertile land Ramankutty et al (2002) -0.00 -0.03 1.00 -1.43 2.53 1,134Caloric Suitability Index (std) Galor and Ozak (2015) 0.00 0.28 1.00 -1.95 2.63 1,179
PANEL B: Countries X 50 yearsHierarchy index Borcan et al. (2014) 0.72 1.00 0.45 0.00 1.00 2,869Cal/ha Best Crop (std) authors 0.00 0.35 1.00 -1.64 2.69 2,959Cal/ha Cereals- Cal/ha Tubers (std) authors 0.00 -0.00 1.00 -1.49 3.12 2,959Precipitation (std) FAO-GAEZ 0.00 -0.29 1.00 -1.38 2.89 2,940Temperature (std) FAO-GAEZ 0.00 0.20 1.00 -2.68 1.52 2,884Elevation (std) FAO-GAEZ 0.00 -0.33 1.00 -1.10 4.65 2,845Ruggedness (std) Nunn and Puga (2012) 0.00 -0.31 1.00 -1.12 4.25 2,959Absolute Latitude (std) Nunn and Puga (2012) 0.00 -0.17 1.00 -1.51 2.18 2,959Legal Origin: English common law La Porta et al. (1999) 0.27 0.00 0.44 0.00 1.00 2,959Legal Origin: French civil law La Porta et al. (1999) 0.45 0.00 0.50 0.00 1.00 2,959Legal Origin: Socialist law La Porta et al. (1999) 0.22 0.00 0.41 0.00 1.00 2,959Legal Origin: German civil law La Porta et al. (1999) 0.03 0.00 0.18 0.00 1.00 2,959Legal Origin: Scandinavian law La Porta et al. (1999) 0.03 0.00 0.18 0.00 1.00 2,959Population density 1500 (std) Acemoglu et al. (2002) 0.00 -0.05 1.00 -2.96 2.78 2,959Mortality of early settlers (std) Acemoglu et al. (2002) 0.00 -0.11 1.00 -2.91 2.56 1,519Slaves exported (std) Nunn (2008) 0.00 -0.26 1.00 -0.26 9.01 2,959Distance to major river (std) www.pdx.edu/econ/ 0.00 -0.29 1.00 -0.89 7.63 2,845Distance to coast (std) www.pdx.edu/econ/ 0.00 -0.41 1.00 -0.75 4.48 2,845Pct Malaria MAP 0.65 0.94 0.41 0.00 1.00 2,883% country with tropical climate (std) Nunn and Puga (2012) 0.35 0.00 0.43 0.00 1.00 2,959Caloric Suitability Index (std) Galor and Ozak (2015) 0.00 0.29 1.00 -1.82 2.93 2,959
FAO GAEZ v3 database downloaded on 15/01/2016. std - a standardized variable that has been rescaled to have amean of zero and a standard deviation of one.
62
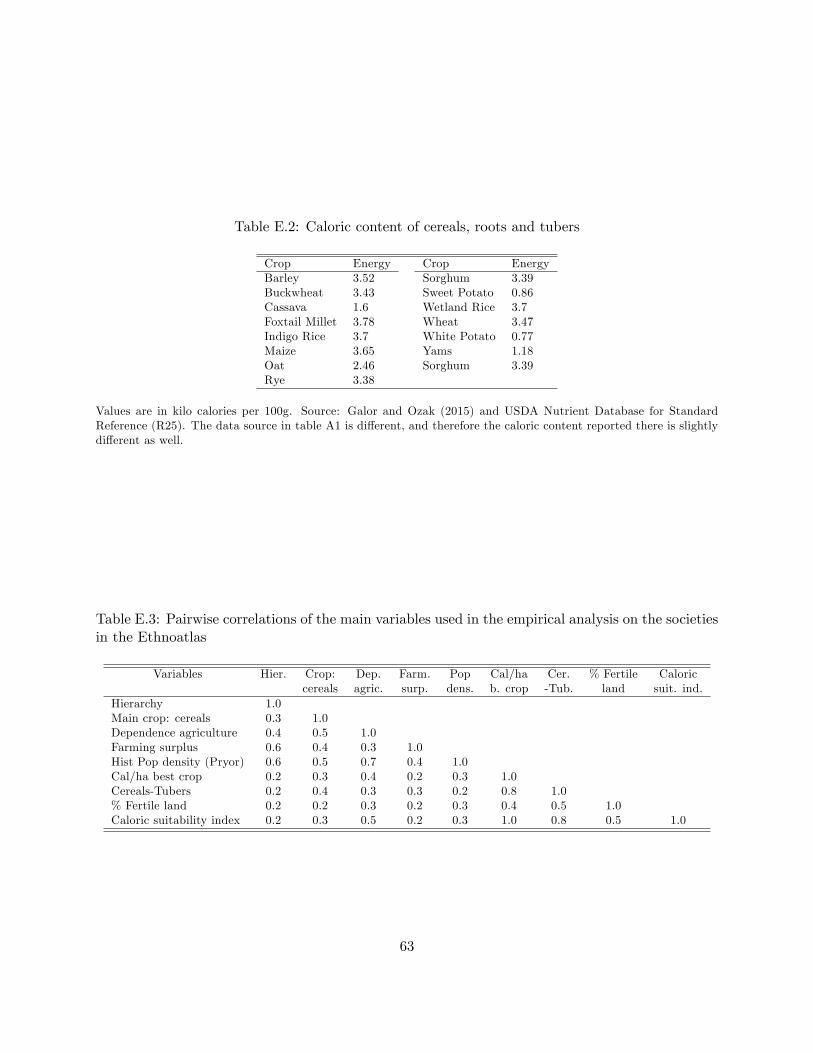
Table E.2: Caloric content of cereals, roots and tubers
Crop Energy Crop EnergyBarley 3.52 Sorghum 3.39Buckwheat 3.43 Sweet Potato 0.86Cassava 1.6 Wetland Rice 3.7Foxtail Millet 3.78 Wheat 3.47Indigo Rice 3.7 White Potato 0.77Maize 3.65 Yams 1.18Oat 2.46 Sorghum 3.39Rye 3.38
Values are in kilo calories per 100g. Source: Galor and Ozak (2015) and USDA Nutrient Database for StandardReference (R25). The data source in table A1 is di¤erent, and therefore the caloric content reported there is slightlydi¤erent as well.
Table E.3: Pairwise correlations of the main variables used in the empirical analysis on the societiesin the Ethnoatlas
Variables Hier. Crop: Dep. Farm. Pop Cal/ha Cer. % Fertile Caloriccereals agric. surp. dens. b. crop -Tub. land suit. ind.
Hierarchy 1.0Main crop: cereals 0.3 1.0Dependence agriculture 0.4 0.5 1.0Farming surplus 0.6 0.4 0.3 1.0Hist Pop density (Pryor) 0.6 0.5 0.7 0.4 1.0Cal/ha best crop 0.2 0.3 0.4 0.2 0.3 1.0Cereals-Tubers 0.2 0.4 0.3 0.3 0.2 0.8 1.0% Fertile land 0.2 0.2 0.3 0.2 0.3 0.4 0.5 1.0Caloric suitability index 0.2 0.3 0.5 0.2 0.3 1.0 0.8 0.5 1.0
63
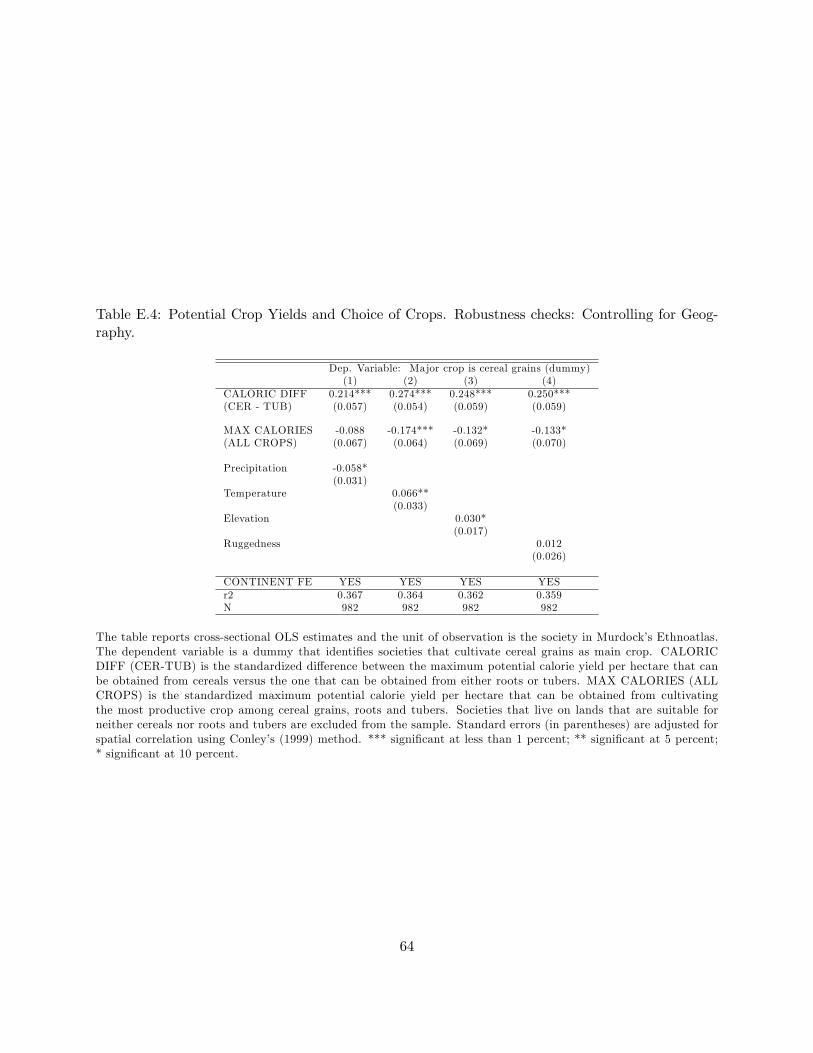
Table E.4: Potential Crop Yields and Choice of Crops. Robustness checks: Controlling for Geog-raphy.
Dep. Variable: Major crop is cereal grains (dummy)(1) (2) (3) (4)
CALORIC DIFF 0.214*** 0.274*** 0.248*** 0.250***(CER - TUB) (0.057) (0.054) (0.059) (0.059)
MAX CALORIES -0.088 -0.174*** -0.132* -0.133*(ALL CROPS) (0.067) (0.064) (0.069) (0.070)
Precipitation -0.058*(0.031)
Temperature 0.066**(0.033)
Elevation 0.030*(0.017)
Ruggedness 0.012(0.026)
CONTINENT FE YES YES YES YESr2 0.367 0.364 0.362 0.359N 982 982 982 982
The table reports cross-sectional OLS estimates and the unit of observation is the society in Murdock�s Ethnoatlas.The dependent variable is a dummy that identi�es societies that cultivate cereal grains as main crop. CALORICDIFF (CER-TUB) is the standardized di¤erence between the maximum potential calorie yield per hectare that canbe obtained from cereals versus the one that can be obtained from either roots or tubers. MAX CALORIES (ALLCROPS) is the standardized maximum potential calorie yield per hectare that can be obtained from cultivatingthe most productive crop among cereal grains, roots and tubers. Societies that live on lands that are suitable forneither cereals nor roots and tubers are excluded from the sample. Standard errors (in parentheses) are adjusted forspatial correlation using Conley�s (1999) method. *** signi�cant at less than 1 percent; ** signi�cant at 5 percent;* signi�cant at 10 percent.
64
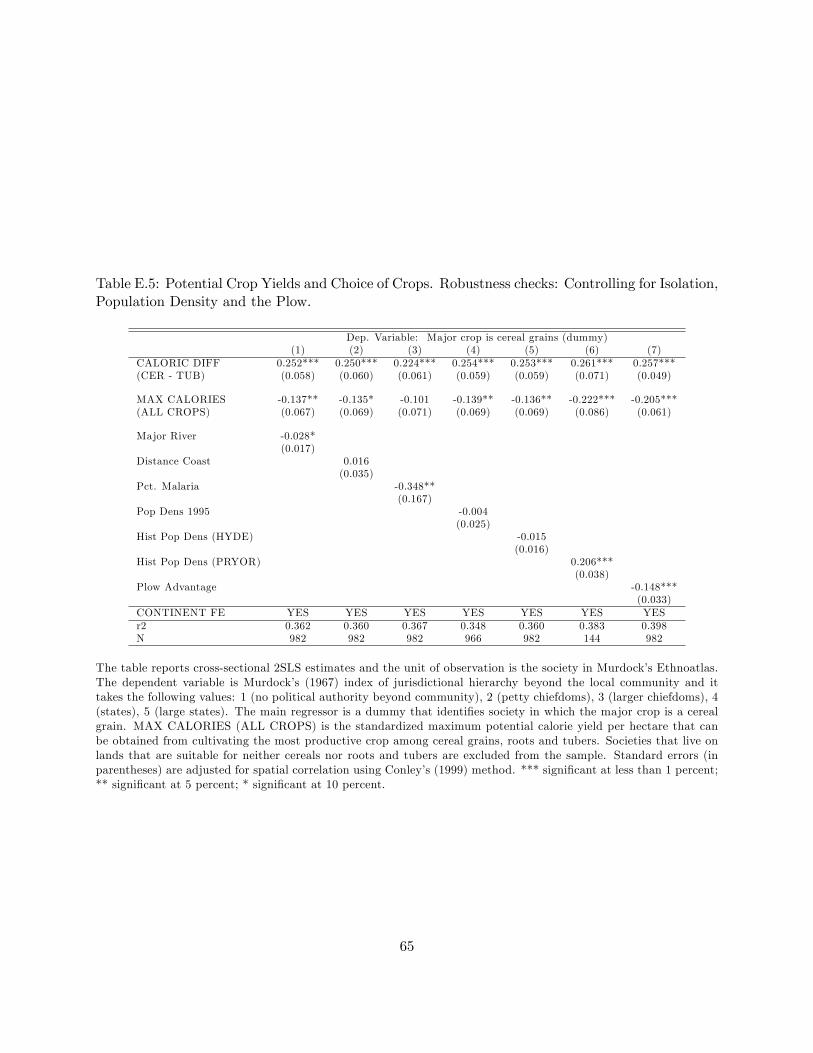
Table E.5: Potential Crop Yields and Choice of Crops. Robustness checks: Controlling for Isolation,Population Density and the Plow.
Dep. Variable: Major crop is cereal grains (dummy)(1) (2) (3) (4) (5) (6) (7)
CALORIC DIFF 0.252*** 0.250*** 0.224*** 0.254*** 0.253*** 0.261*** 0.257***(CER - TUB) (0.058) (0.060) (0.061) (0.059) (0.059) (0.071) (0.049)
MAX CALORIES -0.137** -0.135* -0.101 -0.139** -0.136** -0.222*** -0.205***(ALL CROPS) (0.067) (0.069) (0.071) (0.069) (0.069) (0.086) (0.061)
Major River -0.028*(0.017)
Distance Coast 0.016(0.035)
Pct. Malaria -0.348**(0.167)
Pop Dens 1995 -0.004(0.025)
Hist Pop Dens (HYDE) -0.015(0.016)
Hist Pop Dens (PRYOR) 0.206***(0.038)
Plow Advantage -0.148***(0.033)
CONTINENT FE YES YES YES YES YES YES YESr2 0.362 0.360 0.367 0.348 0.360 0.383 0.398N 982 982 982 966 982 144 982
The table reports cross-sectional 2SLS estimates and the unit of observation is the society in Murdock�s Ethnoatlas.The dependent variable is Murdock�s (1967) index of jurisdictional hierarchy beyond the local community and ittakes the following values: 1 (no political authority beyond community), 2 (petty chiefdoms), 3 (larger chiefdoms), 4(states), 5 (large states). The main regressor is a dummy that identi�es society in which the major crop is a cerealgrain. MAX CALORIES (ALL CROPS) is the standardized maximum potential calorie yield per hectare that canbe obtained from cultivating the most productive crop among cereal grains, roots and tubers. Societies that live onlands that are suitable for neither cereals nor roots and tubers are excluded from the sample. Standard errors (inparentheses) are adjusted for spatial correlation using Conley�s (1999) method. *** signi�cant at less than 1 percent;** signi�cant at 5 percent; * signi�cant at 10 percent.
65
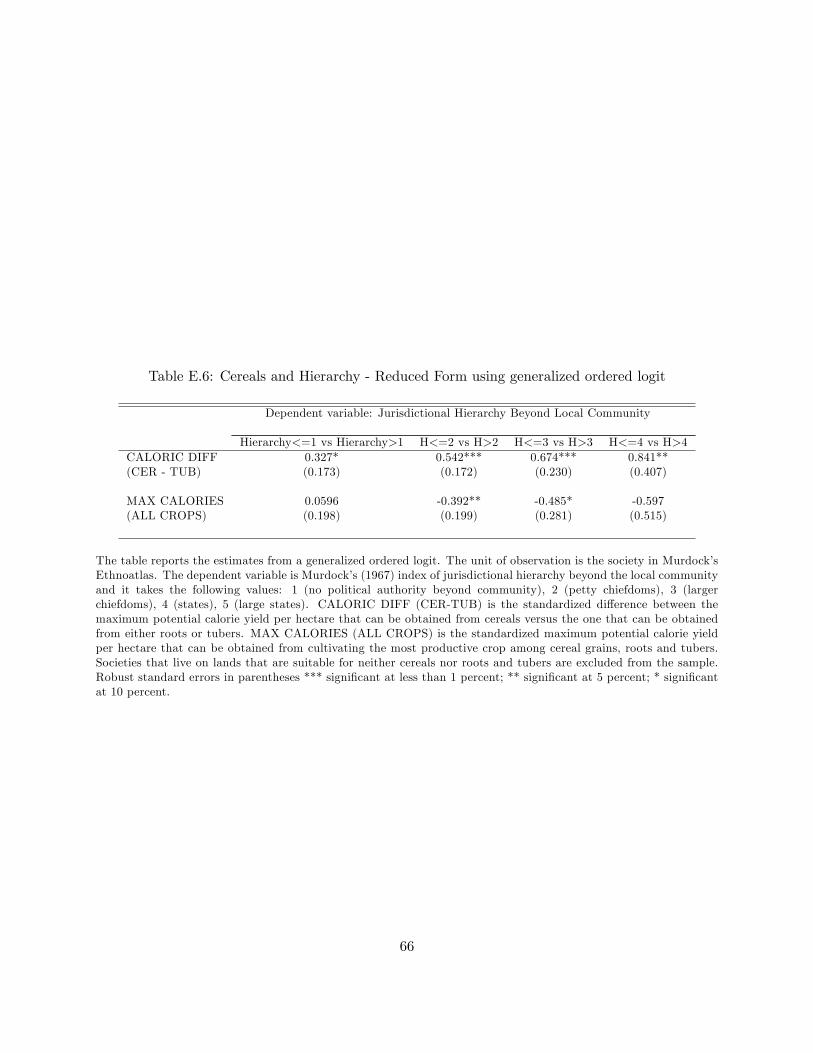
Table E.6: Cereals and Hierarchy - Reduced Form using generalized ordered logit
Dependent variable: Jurisdictional Hierarchy Beyond Local Community
Hierarchy<=1 vs Hierarchy>1 H<=2 vs H>2 H<=3 vs H>3 H<=4 vs H>4CALORIC DIFF 0.327* 0.542*** 0.674*** 0.841**(CER - TUB) (0.173) (0.172) (0.230) (0.407)
MAX CALORIES 0.0596 -0.392** -0.485* -0.597(ALL CROPS) (0.198) (0.199) (0.281) (0.515)
The table reports the estimates from a generalized ordered logit. The unit of observation is the society in Murdock�sEthnoatlas. The dependent variable is Murdock�s (1967) index of jurisdictional hierarchy beyond the local communityand it takes the following values: 1 (no political authority beyond community), 2 (petty chiefdoms), 3 (largerchiefdoms), 4 (states), 5 (large states). CALORIC DIFF (CER-TUB) is the standardized di¤erence between themaximum potential calorie yield per hectare that can be obtained from cereals versus the one that can be obtainedfrom either roots or tubers. MAX CALORIES (ALL CROPS) is the standardized maximum potential calorie yieldper hectare that can be obtained from cultivating the most productive crop among cereal grains, roots and tubers.Societies that live on lands that are suitable for neither cereals nor roots and tubers are excluded from the sample.Robust standard errors in parentheses *** signi�cant at less than 1 percent; ** signi�cant at 5 percent; * signi�cantat 10 percent.
66
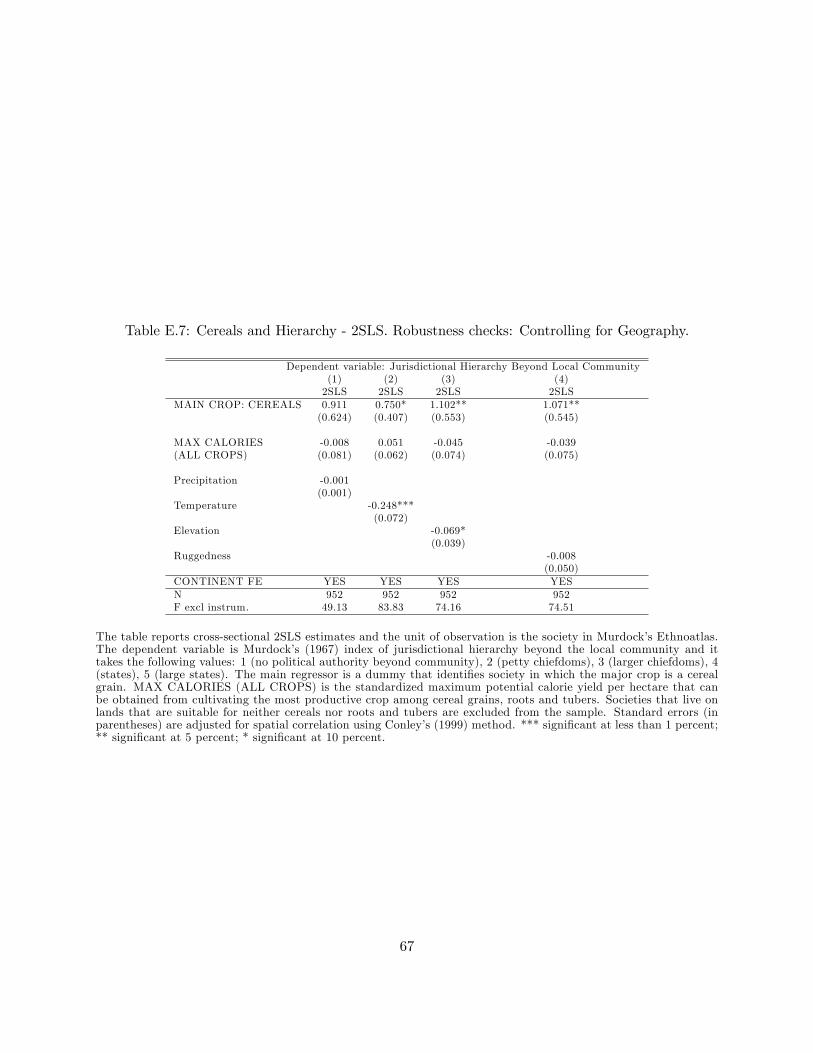
Table E.7: Cereals and Hierarchy - 2SLS. Robustness checks: Controlling for Geography.
Dependent variable: Jurisdictional Hierarchy Beyond Local Community(1) (2) (3) (4)2SLS 2SLS 2SLS 2SLS
MAIN CROP: CEREALS 0.911 0.750* 1.102** 1.071**(0.624) (0.407) (0.553) (0.545)
MAX CALORIES -0.008 0.051 -0.045 -0.039(ALL CROPS) (0.081) (0.062) (0.074) (0.075)
Precipitation -0.001(0.001)
Temperature -0.248***(0.072)
Elevation -0.069*(0.039)
Ruggedness -0.008(0.050)
CONTINENT FE YES YES YES YESN 952 952 952 952F excl instrum. 49.13 83.83 74.16 74.51
The table reports cross-sectional 2SLS estimates and the unit of observation is the society in Murdock�s Ethnoatlas.The dependent variable is Murdock�s (1967) index of jurisdictional hierarchy beyond the local community and ittakes the following values: 1 (no political authority beyond community), 2 (petty chiefdoms), 3 (larger chiefdoms), 4(states), 5 (large states). The main regressor is a dummy that identi�es society in which the major crop is a cerealgrain. MAX CALORIES (ALL CROPS) is the standardized maximum potential calorie yield per hectare that canbe obtained from cultivating the most productive crop among cereal grains, roots and tubers. Societies that live onlands that are suitable for neither cereals nor roots and tubers are excluded from the sample. Standard errors (inparentheses) are adjusted for spatial correlation using Conley�s (1999) method. *** signi�cant at less than 1 percent;** signi�cant at 5 percent; * signi�cant at 10 percent.
67
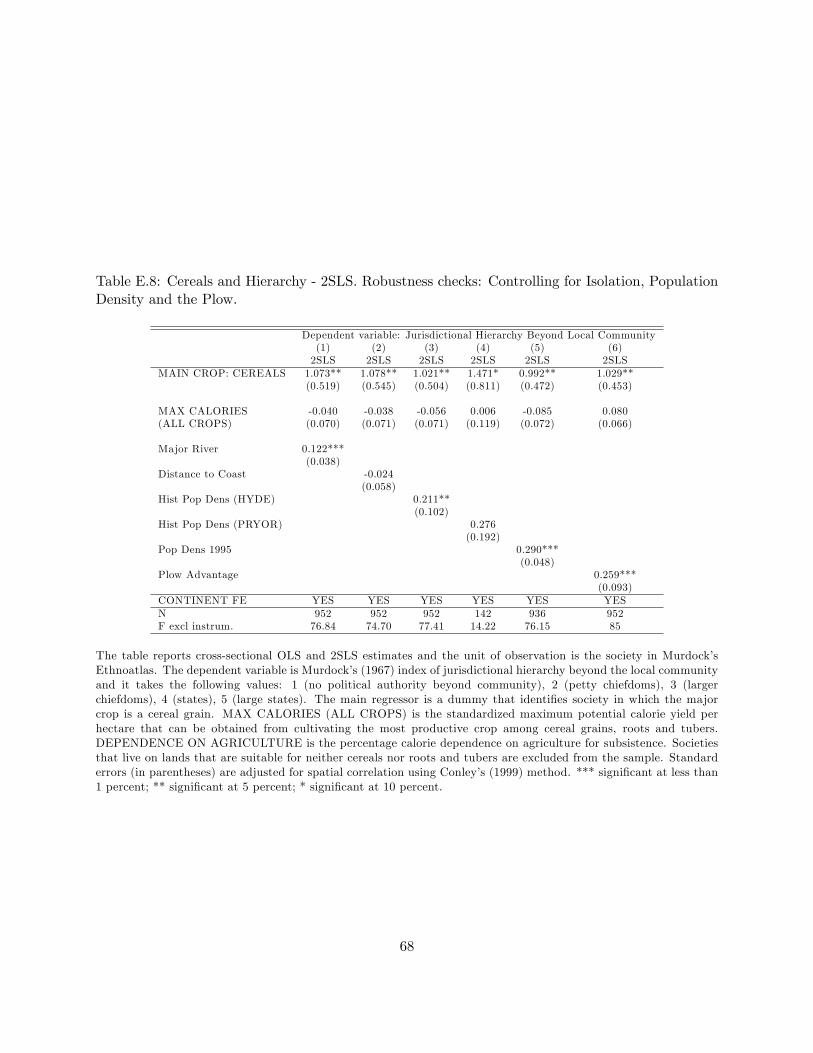
Table E.8: Cereals and Hierarchy - 2SLS. Robustness checks: Controlling for Isolation, PopulationDensity and the Plow.
Dependent variable: Jurisdictional Hierarchy Beyond Local Community(1) (2) (3) (4) (5) (6)2SLS 2SLS 2SLS 2SLS 2SLS 2SLS
MAIN CROP: CEREALS 1.073** 1.078** 1.021** 1.471* 0.992** 1.029**(0.519) (0.545) (0.504) (0.811) (0.472) (0.453)
MAX CALORIES -0.040 -0.038 -0.056 0.006 -0.085 0.080(ALL CROPS) (0.070) (0.071) (0.071) (0.119) (0.072) (0.066)
Major River 0.122***(0.038)
Distance to Coast -0.024(0.058)
Hist Pop Dens (HYDE) 0.211**(0.102)
Hist Pop Dens (PRYOR) 0.276(0.192)
Pop Dens 1995 0.290***(0.048)
Plow Advantage 0.259***(0.093)
CONTINENT FE YES YES YES YES YES YESN 952 952 952 142 936 952F excl instrum. 76.84 74.70 77.41 14.22 76.15 85
The table reports cross-sectional OLS and 2SLS estimates and the unit of observation is the society in Murdock�sEthnoatlas. The dependent variable is Murdock�s (1967) index of jurisdictional hierarchy beyond the local communityand it takes the following values: 1 (no political authority beyond community), 2 (petty chiefdoms), 3 (largerchiefdoms), 4 (states), 5 (large states). The main regressor is a dummy that identi�es society in which the majorcrop is a cereal grain. MAX CALORIES (ALL CROPS) is the standardized maximum potential calorie yield perhectare that can be obtained from cultivating the most productive crop among cereal grains, roots and tubers.DEPENDENCE ON AGRICULTURE is the percentage calorie dependence on agriculture for subsistence. Societiesthat live on lands that are suitable for neither cereals nor roots and tubers are excluded from the sample. Standarderrors (in parentheses) are adjusted for spatial correlation using Conley�s (1999) method. *** signi�cant at less than1 percent; ** signi�cant at 5 percent; * signi�cant at 10 percent.
68
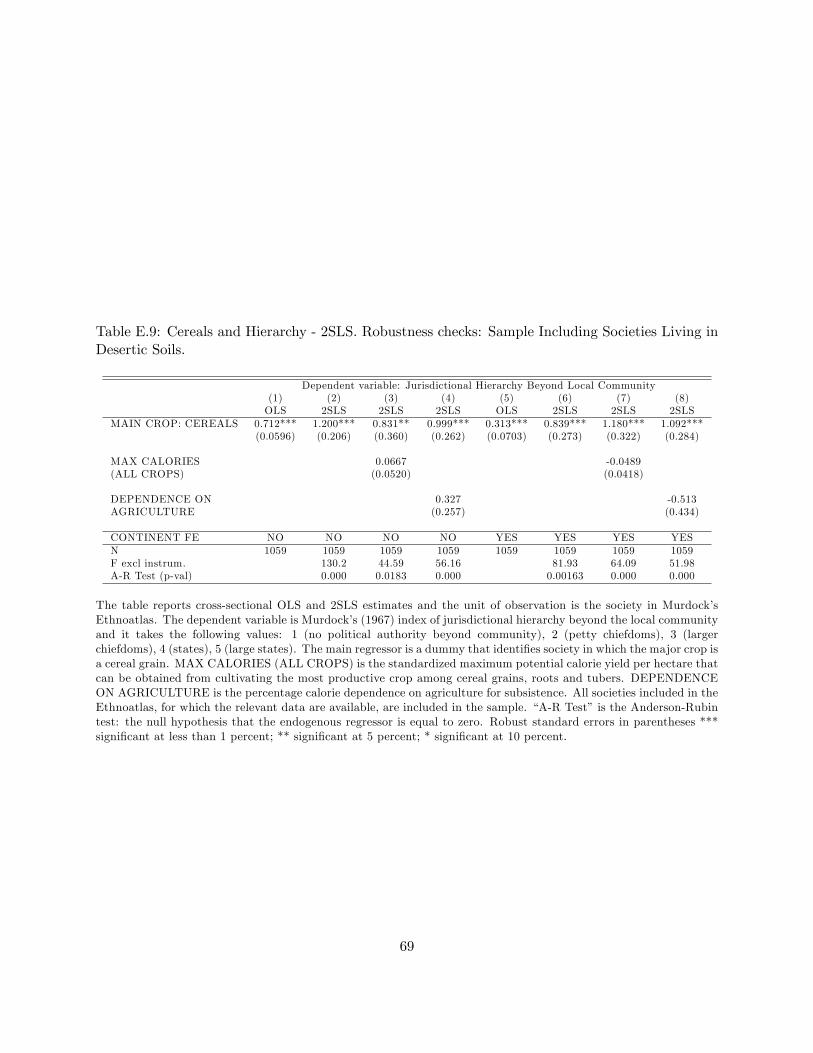
Table E.9: Cereals and Hierarchy - 2SLS. Robustness checks: Sample Including Societies Living inDesertic Soils.
Dependent variable: Jurisdictional Hierarchy Beyond Local Community(1) (2) (3) (4) (5) (6) (7) (8)OLS 2SLS 2SLS 2SLS OLS 2SLS 2SLS 2SLS
MAIN CROP: CEREALS 0.712*** 1.200*** 0.831** 0.999*** 0.313*** 0.839*** 1.180*** 1.092***(0.0596) (0.206) (0.360) (0.262) (0.0703) (0.273) (0.322) (0.284)
MAX CALORIES 0.0667 -0.0489(ALL CROPS) (0.0520) (0.0418)
DEPENDENCE ON 0.327 -0.513AGRICULTURE (0.257) (0.434)
CONTINENT FE NO NO NO NO YES YES YES YESN 1059 1059 1059 1059 1059 1059 1059 1059F excl instrum. 130.2 44.59 56.16 81.93 64.09 51.98A-R Test (p-val) 0.000 0.0183 0.000 0.00163 0.000 0.000
The table reports cross-sectional OLS and 2SLS estimates and the unit of observation is the society in Murdock�sEthnoatlas. The dependent variable is Murdock�s (1967) index of jurisdictional hierarchy beyond the local communityand it takes the following values: 1 (no political authority beyond community), 2 (petty chiefdoms), 3 (largerchiefdoms), 4 (states), 5 (large states). The main regressor is a dummy that identi�es society in which the major crop isa cereal grain. MAX CALORIES (ALL CROPS) is the standardized maximum potential calorie yield per hectare thatcan be obtained from cultivating the most productive crop among cereal grains, roots and tubers. DEPENDENCEON AGRICULTURE is the percentage calorie dependence on agriculture for subsistence. All societies included in theEthnoatlas, for which the relevant data are available, are included in the sample. �A-R Test�is the Anderson-Rubintest: the null hypothesis that the endogenous regressor is equal to zero. Robust standard errors in parentheses ***signi�cant at less than 1 percent; ** signi�cant at 5 percent; * signi�cant at 10 percent.
69
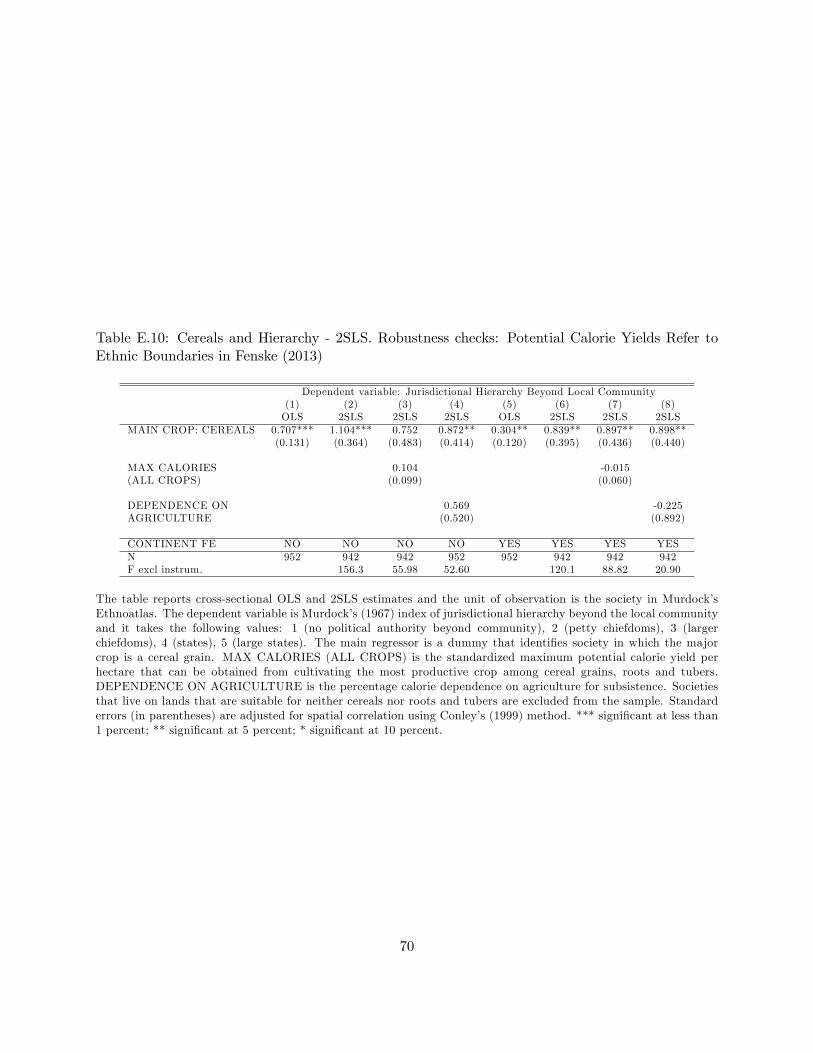
Table E.10: Cereals and Hierarchy - 2SLS. Robustness checks: Potential Calorie Yields Refer toEthnic Boundaries in Fenske (2013)
Dependent variable: Jurisdictional Hierarchy Beyond Local Community(1) (2) (3) (4) (5) (6) (7) (8)OLS 2SLS 2SLS 2SLS OLS 2SLS 2SLS 2SLS
MAIN CROP: CEREALS 0.707*** 1.104*** 0.752 0.872** 0.304** 0.839** 0.897** 0.898**(0.131) (0.364) (0.483) (0.414) (0.120) (0.395) (0.436) (0.440)
MAX CALORIES 0.104 -0.015(ALL CROPS) (0.099) (0.060)
DEPENDENCE ON 0.569 -0.225AGRICULTURE (0.520) (0.892)
CONTINENT FE NO NO NO NO YES YES YES YESN 952 942 942 952 952 942 942 942F excl instrum. 156.3 55.98 52.60 120.1 88.82 20.90
The table reports cross-sectional OLS and 2SLS estimates and the unit of observation is the society in Murdock�sEthnoatlas. The dependent variable is Murdock�s (1967) index of jurisdictional hierarchy beyond the local communityand it takes the following values: 1 (no political authority beyond community), 2 (petty chiefdoms), 3 (largerchiefdoms), 4 (states), 5 (large states). The main regressor is a dummy that identi�es society in which the majorcrop is a cereal grain. MAX CALORIES (ALL CROPS) is the standardized maximum potential calorie yield perhectare that can be obtained from cultivating the most productive crop among cereal grains, roots and tubers.DEPENDENCE ON AGRICULTURE is the percentage calorie dependence on agriculture for subsistence. Societiesthat live on lands that are suitable for neither cereals nor roots and tubers are excluded from the sample. Standarderrors (in parentheses) are adjusted for spatial correlation using Conley�s (1999) method. *** signi�cant at less than1 percent; ** signi�cant at 5 percent; * signi�cant at 10 percent.
70
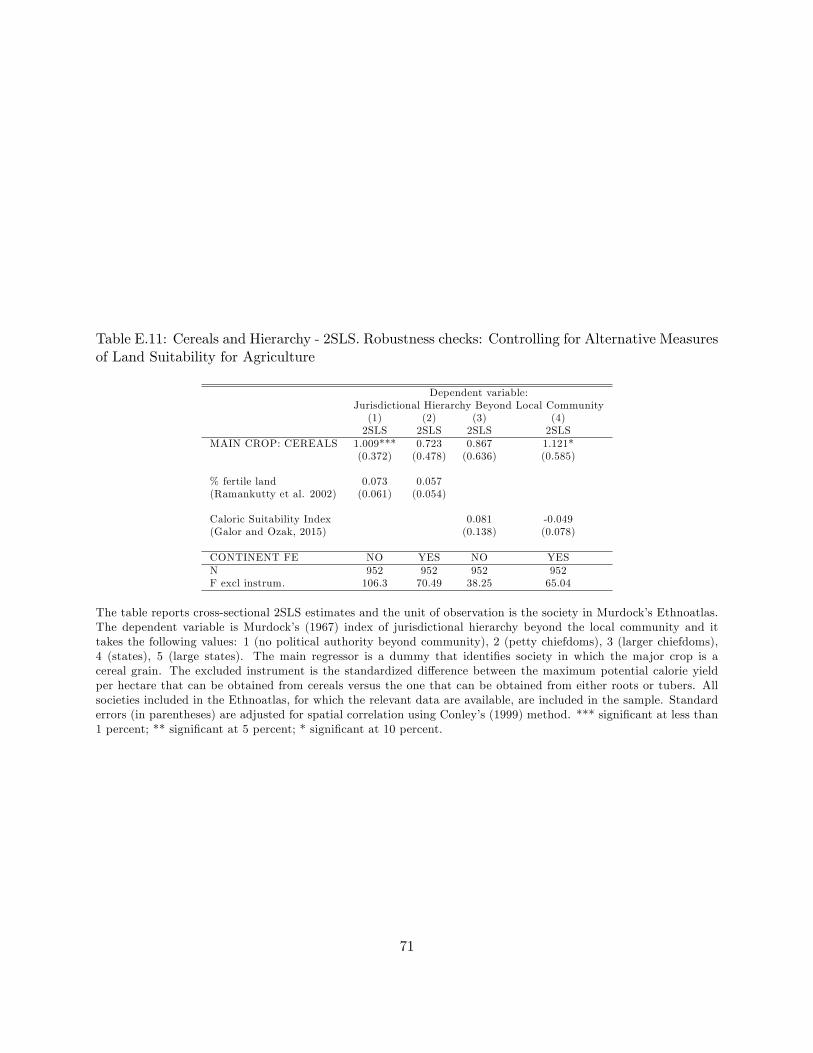
Table E.11: Cereals and Hierarchy - 2SLS. Robustness checks: Controlling for Alternative Measuresof Land Suitability for Agriculture
Dependent variable:Jurisdictional Hierarchy Beyond Local Community(1) (2) (3) (4)2SLS 2SLS 2SLS 2SLS
MAIN CROP: CEREALS 1.009*** 0.723 0.867 1.121*(0.372) (0.478) (0.636) (0.585)
% fertile land 0.073 0.057(Ramankutty et al. 2002) (0.061) (0.054)
Caloric Suitability Index 0.081 -0.049(Galor and Ozak, 2015) (0.138) (0.078)
CONTINENT FE NO YES NO YESN 952 952 952 952F excl instrum. 106.3 70.49 38.25 65.04
The table reports cross-sectional 2SLS estimates and the unit of observation is the society in Murdock�s Ethnoatlas.The dependent variable is Murdock�s (1967) index of jurisdictional hierarchy beyond the local community and ittakes the following values: 1 (no political authority beyond community), 2 (petty chiefdoms), 3 (larger chiefdoms),4 (states), 5 (large states). The main regressor is a dummy that identi�es society in which the major crop is acereal grain. The excluded instrument is the standardized di¤erence between the maximum potential calorie yieldper hectare that can be obtained from cereals versus the one that can be obtained from either roots or tubers. Allsocieties included in the Ethnoatlas, for which the relevant data are available, are included in the sample. Standarderrors (in parentheses) are adjusted for spatial correlation using Conley�s (1999) method. *** signi�cant at less than1 percent; ** signi�cant at 5 percent; * signi�cant at 10 percent.
71
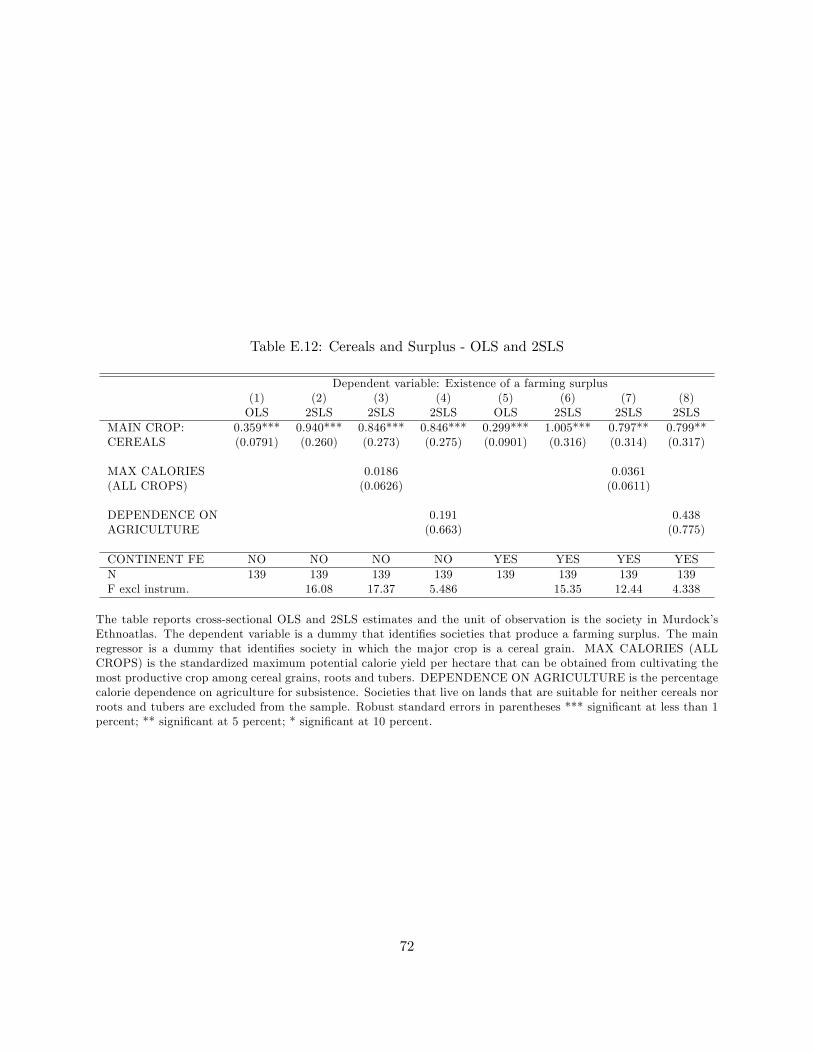
Table E.12: Cereals and Surplus - OLS and 2SLS
Dependent variable: Existence of a farming surplus(1) (2) (3) (4) (5) (6) (7) (8)OLS 2SLS 2SLS 2SLS OLS 2SLS 2SLS 2SLS
MAIN CROP: 0.359*** 0.940*** 0.846*** 0.846*** 0.299*** 1.005*** 0.797** 0.799**CEREALS (0.0791) (0.260) (0.273) (0.275) (0.0901) (0.316) (0.314) (0.317)
MAX CALORIES 0.0186 0.0361(ALL CROPS) (0.0626) (0.0611)
DEPENDENCE ON 0.191 0.438AGRICULTURE (0.663) (0.775)
CONTINENT FE NO NO NO NO YES YES YES YESN 139 139 139 139 139 139 139 139F excl instrum. 16.08 17.37 5.486 15.35 12.44 4.338
The table reports cross-sectional OLS and 2SLS estimates and the unit of observation is the society in Murdock�sEthnoatlas. The dependent variable is a dummy that identi�es societies that produce a farming surplus. The mainregressor is a dummy that identi�es society in which the major crop is a cereal grain. MAX CALORIES (ALLCROPS) is the standardized maximum potential calorie yield per hectare that can be obtained from cultivating themost productive crop among cereal grains, roots and tubers. DEPENDENCE ON AGRICULTURE is the percentagecalorie dependence on agriculture for subsistence. Societies that live on lands that are suitable for neither cereals norroots and tubers are excluded from the sample. Robust standard errors in parentheses *** signi�cant at less than 1percent; ** signi�cant at 5 percent; * signi�cant at 10 percent.
72
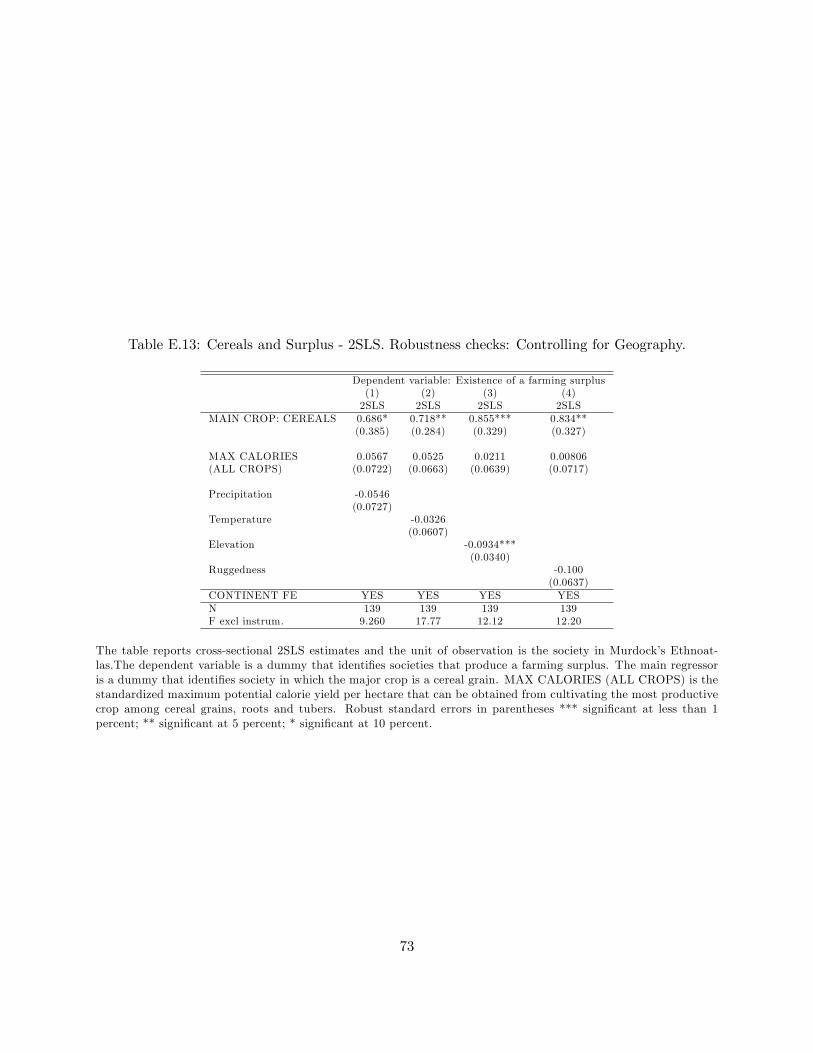
Table E.13: Cereals and Surplus - 2SLS. Robustness checks: Controlling for Geography.
Dependent variable: Existence of a farming surplus(1) (2) (3) (4)2SLS 2SLS 2SLS 2SLS
MAIN CROP: CEREALS 0.686* 0.718** 0.855*** 0.834**(0.385) (0.284) (0.329) (0.327)
MAX CALORIES 0.0567 0.0525 0.0211 0.00806(ALL CROPS) (0.0722) (0.0663) (0.0639) (0.0717)
Precipitation -0.0546(0.0727)
Temperature -0.0326(0.0607)
Elevation -0.0934***(0.0340)
Ruggedness -0.100(0.0637)
CONTINENT FE YES YES YES YESN 139 139 139 139F excl instrum. 9.260 17.77 12.12 12.20
The table reports cross-sectional 2SLS estimates and the unit of observation is the society in Murdock�s Ethnoat-las.The dependent variable is a dummy that identi�es societies that produce a farming surplus. The main regressoris a dummy that identi�es society in which the major crop is a cereal grain. MAX CALORIES (ALL CROPS) is thestandardized maximum potential calorie yield per hectare that can be obtained from cultivating the most productivecrop among cereal grains, roots and tubers. Robust standard errors in parentheses *** signi�cant at less than 1percent; ** signi�cant at 5 percent; * signi�cant at 10 percent.
73
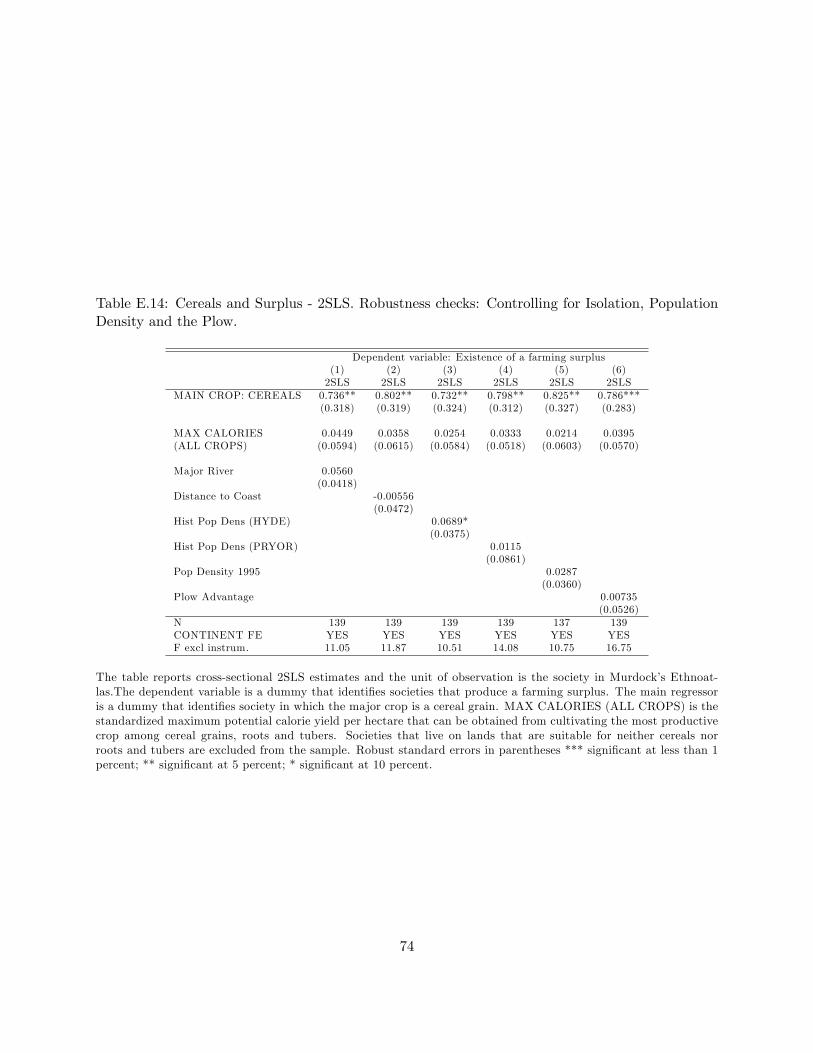
Table E.14: Cereals and Surplus - 2SLS. Robustness checks: Controlling for Isolation, PopulationDensity and the Plow.
Dependent variable: Existence of a farming surplus(1) (2) (3) (4) (5) (6)2SLS 2SLS 2SLS 2SLS 2SLS 2SLS
MAIN CROP: CEREALS 0.736** 0.802** 0.732** 0.798** 0.825** 0.786***(0.318) (0.319) (0.324) (0.312) (0.327) (0.283)
MAX CALORIES 0.0449 0.0358 0.0254 0.0333 0.0214 0.0395(ALL CROPS) (0.0594) (0.0615) (0.0584) (0.0518) (0.0603) (0.0570)
Major River 0.0560(0.0418)
Distance to Coast -0.00556(0.0472)
Hist Pop Dens (HYDE) 0.0689*(0.0375)
Hist Pop Dens (PRYOR) 0.0115(0.0861)
Pop Density 1995 0.0287(0.0360)
Plow Advantage 0.00735(0.0526)
N 139 139 139 139 137 139CONTINENT FE YES YES YES YES YES YESF excl instrum. 11.05 11.87 10.51 14.08 10.75 16.75
The table reports cross-sectional 2SLS estimates and the unit of observation is the society in Murdock�s Ethnoat-las.The dependent variable is a dummy that identi�es societies that produce a farming surplus. The main regressoris a dummy that identi�es society in which the major crop is a cereal grain. MAX CALORIES (ALL CROPS) is thestandardized maximum potential calorie yield per hectare that can be obtained from cultivating the most productivecrop among cereal grains, roots and tubers. Societies that live on lands that are suitable for neither cereals norroots and tubers are excluded from the sample. Robust standard errors in parentheses *** signi�cant at less than 1percent; ** signi�cant at 5 percent; * signi�cant at 10 percent.
74
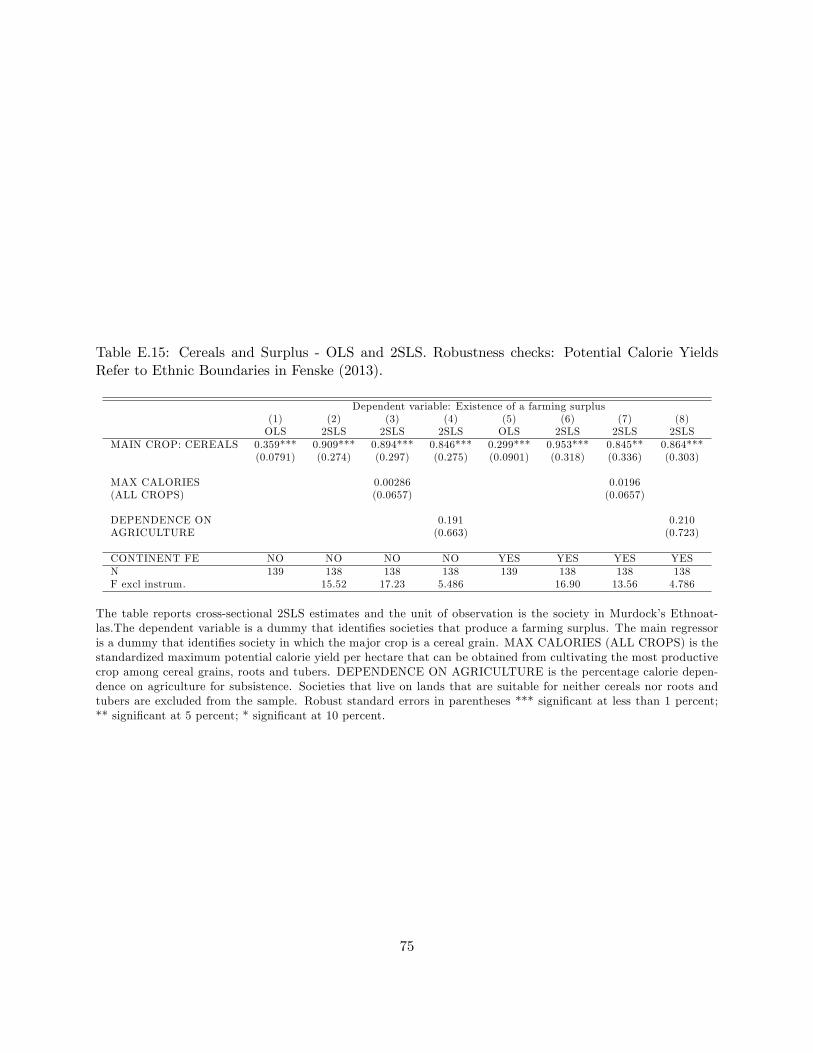
Table E.15: Cereals and Surplus - OLS and 2SLS. Robustness checks: Potential Calorie YieldsRefer to Ethnic Boundaries in Fenske (2013).
Dependent variable: Existence of a farming surplus(1) (2) (3) (4) (5) (6) (7) (8)OLS 2SLS 2SLS 2SLS OLS 2SLS 2SLS 2SLS
MAIN CROP: CEREALS 0.359*** 0.909*** 0.894*** 0.846*** 0.299*** 0.953*** 0.845** 0.864***(0.0791) (0.274) (0.297) (0.275) (0.0901) (0.318) (0.336) (0.303)
MAX CALORIES 0.00286 0.0196(ALL CROPS) (0.0657) (0.0657)
DEPENDENCE ON 0.191 0.210AGRICULTURE (0.663) (0.723)
CONTINENT FE NO NO NO NO YES YES YES YESN 139 138 138 138 139 138 138 138F excl instrum. 15.52 17.23 5.486 16.90 13.56 4.786
The table reports cross-sectional 2SLS estimates and the unit of observation is the society in Murdock�s Ethnoat-las.The dependent variable is a dummy that identi�es societies that produce a farming surplus. The main regressoris a dummy that identi�es society in which the major crop is a cereal grain. MAX CALORIES (ALL CROPS) is thestandardized maximum potential calorie yield per hectare that can be obtained from cultivating the most productivecrop among cereal grains, roots and tubers. DEPENDENCE ON AGRICULTURE is the percentage calorie depen-dence on agriculture for subsistence. Societies that live on lands that are suitable for neither cereals nor roots andtubers are excluded from the sample. Robust standard errors in parentheses *** signi�cant at less than 1 percent;** signi�cant at 5 percent; * signi�cant at 10 percent.
75
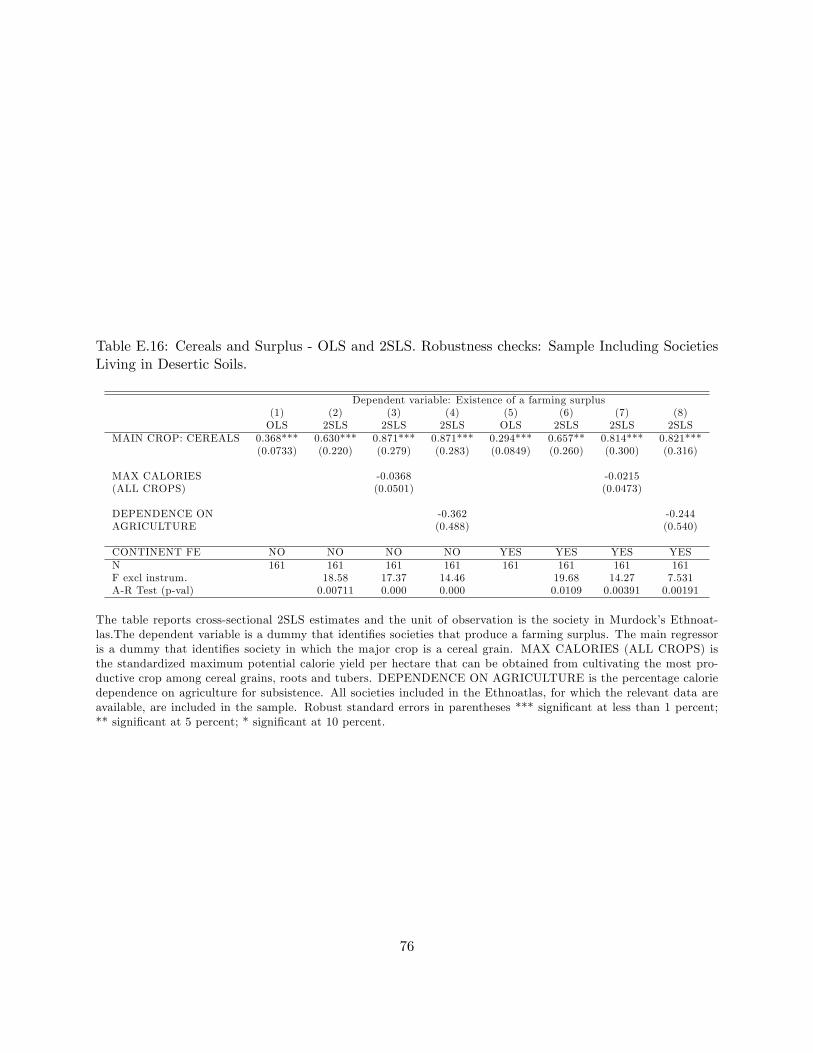
Table E.16: Cereals and Surplus - OLS and 2SLS. Robustness checks: Sample Including SocietiesLiving in Desertic Soils.
Dependent variable: Existence of a farming surplus(1) (2) (3) (4) (5) (6) (7) (8)OLS 2SLS 2SLS 2SLS OLS 2SLS 2SLS 2SLS
MAIN CROP: CEREALS 0.368*** 0.630*** 0.871*** 0.871*** 0.294*** 0.657** 0.814*** 0.821***(0.0733) (0.220) (0.279) (0.283) (0.0849) (0.260) (0.300) (0.316)
MAX CALORIES -0.0368 -0.0215(ALL CROPS) (0.0501) (0.0473)
DEPENDENCE ON -0.362 -0.244AGRICULTURE (0.488) (0.540)
CONTINENT FE NO NO NO NO YES YES YES YESN 161 161 161 161 161 161 161 161F excl instrum. 18.58 17.37 14.46 19.68 14.27 7.531A-R Test (p-val) 0.00711 0.000 0.000 0.0109 0.00391 0.00191
The table reports cross-sectional 2SLS estimates and the unit of observation is the society in Murdock�s Ethnoat-las.The dependent variable is a dummy that identi�es societies that produce a farming surplus. The main regressoris a dummy that identi�es society in which the major crop is a cereal grain. MAX CALORIES (ALL CROPS) isthe standardized maximum potential calorie yield per hectare that can be obtained from cultivating the most pro-ductive crop among cereal grains, roots and tubers. DEPENDENCE ON AGRICULTURE is the percentage caloriedependence on agriculture for subsistence. All societies included in the Ethnoatlas, for which the relevant data areavailable, are included in the sample. Robust standard errors in parentheses *** signi�cant at less than 1 percent;** signi�cant at 5 percent; * signi�cant at 10 percent.
76
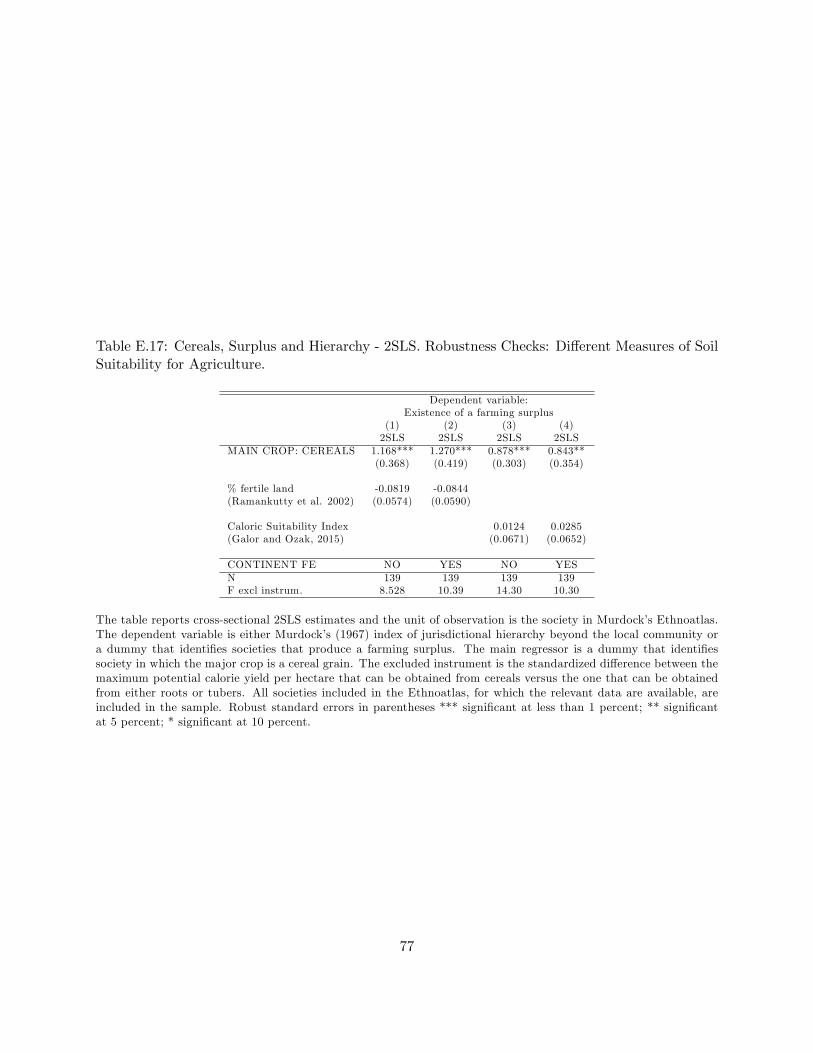
Table E.17: Cereals, Surplus and Hierarchy - 2SLS. Robustness Checks: Di¤erent Measures of SoilSuitability for Agriculture.
Dependent variable:Existence of a farming surplus
(1) (2) (3) (4)2SLS 2SLS 2SLS 2SLS
MAIN CROP: CEREALS 1.168*** 1.270*** 0.878*** 0.843**(0.368) (0.419) (0.303) (0.354)
% fertile land -0.0819 -0.0844(Ramankutty et al. 2002) (0.0574) (0.0590)
Caloric Suitability Index 0.0124 0.0285(Galor and Ozak, 2015) (0.0671) (0.0652)
CONTINENT FE NO YES NO YESN 139 139 139 139F excl instrum. 8.528 10.39 14.30 10.30
The table reports cross-sectional 2SLS estimates and the unit of observation is the society in Murdock�s Ethnoatlas.The dependent variable is either Murdock�s (1967) index of jurisdictional hierarchy beyond the local community ora dummy that identi�es societies that produce a farming surplus. The main regressor is a dummy that identi�essociety in which the major crop is a cereal grain. The excluded instrument is the standardized di¤erence between themaximum potential calorie yield per hectare that can be obtained from cereals versus the one that can be obtainedfrom either roots or tubers. All societies included in the Ethnoatlas, for which the relevant data are available, areincluded in the sample. Robust standard errors in parentheses *** signi�cant at less than 1 percent; ** signi�cantat 5 percent; * signi�cant at 10 percent.
77
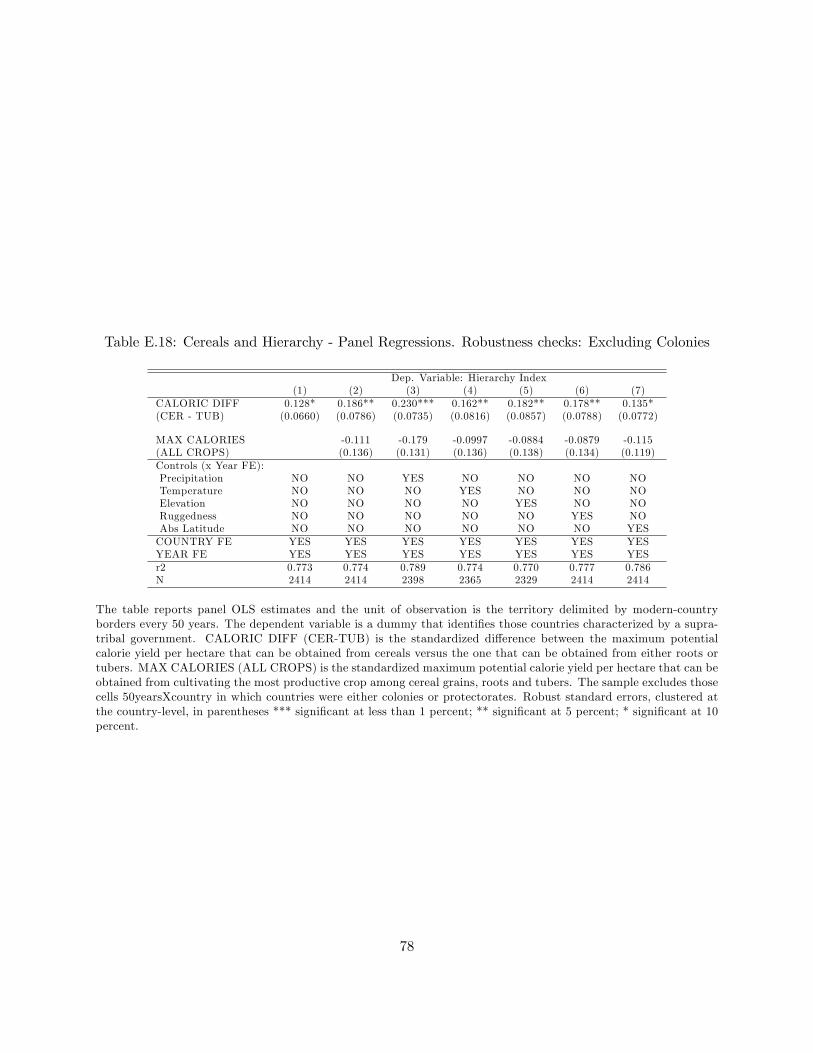
Table E.18: Cereals and Hierarchy - Panel Regressions. Robustness checks: Excluding Colonies
Dep. Variable: Hierarchy Index(1) (2) (3) (4) (5) (6) (7)
CALORIC DIFF 0.128* 0.186** 0.230*** 0.162** 0.182** 0.178** 0.135*(CER - TUB) (0.0660) (0.0786) (0.0735) (0.0816) (0.0857) (0.0788) (0.0772)
MAX CALORIES -0.111 -0.179 -0.0997 -0.0884 -0.0879 -0.115(ALL CROPS) (0.136) (0.131) (0.136) (0.138) (0.134) (0.119)Controls (x Year FE):Precipitation NO NO YES NO NO NO NOTemperature NO NO NO YES NO NO NOElevation NO NO NO NO YES NO NORuggedness NO NO NO NO NO YES NOAbs Latitude NO NO NO NO NO NO YESCOUNTRY FE YES YES YES YES YES YES YESYEAR FE YES YES YES YES YES YES YESr2 0.773 0.774 0.789 0.774 0.770 0.777 0.786N 2414 2414 2398 2365 2329 2414 2414
The table reports panel OLS estimates and the unit of observation is the territory delimited by modern-countryborders every 50 years. The dependent variable is a dummy that identi�es those countries characterized by a supra-tribal government. CALORIC DIFF (CER-TUB) is the standardized di¤erence between the maximum potentialcalorie yield per hectare that can be obtained from cereals versus the one that can be obtained from either roots ortubers. MAX CALORIES (ALL CROPS) is the standardized maximum potential calorie yield per hectare that can beobtained from cultivating the most productive crop among cereal grains, roots and tubers. The sample excludes thosecells 50yearsXcountry in which countries were either colonies or protectorates. Robust standard errors, clustered atthe country-level, in parentheses *** signi�cant at less than 1 percent; ** signi�cant at 5 percent; * signi�cant at 10percent.
78
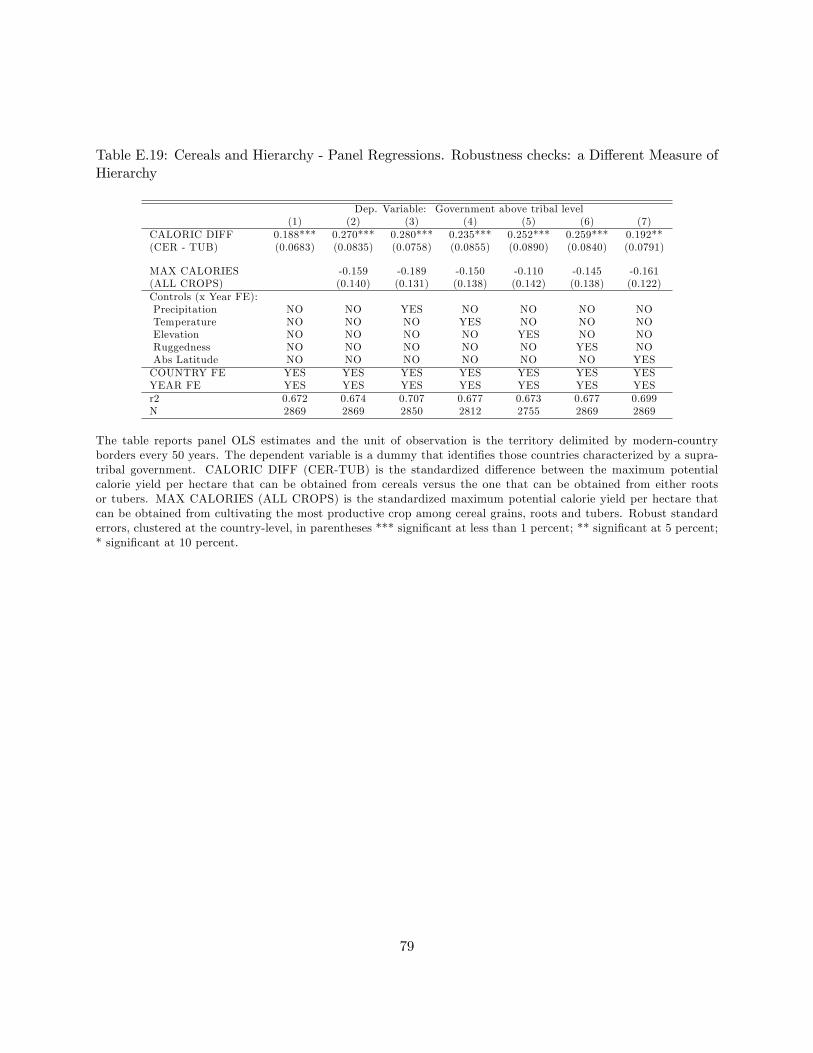
Table E.19: Cereals and Hierarchy - Panel Regressions. Robustness checks: a Di¤erent Measure ofHierarchy
Dep. Variable: Government above tribal level(1) (2) (3) (4) (5) (6) (7)
CALORIC DIFF 0.188*** 0.270*** 0.280*** 0.235*** 0.252*** 0.259*** 0.192**(CER - TUB) (0.0683) (0.0835) (0.0758) (0.0855) (0.0890) (0.0840) (0.0791)
MAX CALORIES -0.159 -0.189 -0.150 -0.110 -0.145 -0.161(ALL CROPS) (0.140) (0.131) (0.138) (0.142) (0.138) (0.122)Controls (x Year FE):Precipitation NO NO YES NO NO NO NOTemperature NO NO NO YES NO NO NOElevation NO NO NO NO YES NO NORuggedness NO NO NO NO NO YES NOAbs Latitude NO NO NO NO NO NO YESCOUNTRY FE YES YES YES YES YES YES YESYEAR FE YES YES YES YES YES YES YESr2 0.672 0.674 0.707 0.677 0.673 0.677 0.699N 2869 2869 2850 2812 2755 2869 2869
The table reports panel OLS estimates and the unit of observation is the territory delimited by modern-countryborders every 50 years. The dependent variable is a dummy that identi�es those countries characterized by a supra-tribal government. CALORIC DIFF (CER-TUB) is the standardized di¤erence between the maximum potentialcalorie yield per hectare that can be obtained from cereals versus the one that can be obtained from either rootsor tubers. MAX CALORIES (ALL CROPS) is the standardized maximum potential calorie yield per hectare thatcan be obtained from cultivating the most productive crop among cereal grains, roots and tubers. Robust standarderrors, clustered at the country-level, in parentheses *** signi�cant at less than 1 percent; ** signi�cant at 5 percent;* signi�cant at 10 percent.
79

Table E.20: Cereals and Hierarchy - Panel Regressions. Robustness checks: a Di¤erent Measure ofSoil Suitability for Agriculture
Dep. Variable: Hierarchy Index(1) (2) (3) (4) (5) (6) (7)
CALORIC DIFF 0.189*** 0.272*** 0.282*** 0.240*** 0.255*** 0.261*** 0.197**(CER - TUB) (0.0683) (0.0834) (0.0760) (0.0857) (0.0889) (0.0839) (0.0795)
Caloric Suitability Index -0.163 -0.193 -0.152 -0.115 -0.148 -0.165(0.141) (0.131) (0.139) (0.142) (0.138) (0.123)
Controls (x Year FE):Precipitation NO NO YES NO NO NO NOTemperature NO NO NO YES NO NO NOElevation NO NO NO NO YES NO NORuggedness NO NO NO NO NO YES NOAbs Latitude NO NO NO NO NO NO YESCOUNTRY FE YES YES YES YES YES YES YESTIME FE YES YES YES YES YES YES YESr2 0.680 0.682 0.716 0.684 0.681 0.686 0.705N 2869 2869 2850 2812 2755 2869 2869
The table reports panel OLS estimates and the unit of observation is the territory delimited by modern-countryborders every 50 years. The dependent variable is an hierarchy index: it equals 0 if there is not a government abovetribal level, 0.75 if the political organization can be at best described as a paramount chiefdom and 1 otherwise.CALORIC DIFF (CER-TUB) is the standardized di¤erence between the maximum potential calorie yield per hectarethat can be obtained from cereals versus the one that can be obtained from either roots or tubers. Caloric SuitabilityIndex is a measure of potential caloric yields of the soil developed by Galor and Ozak (2015). Robust standard errors,clustered at the country-level, in parentheses *** signi�cant at less than 1 percent; ** signi�cant at 5 percent; *signi�cant at 10 percent.
80
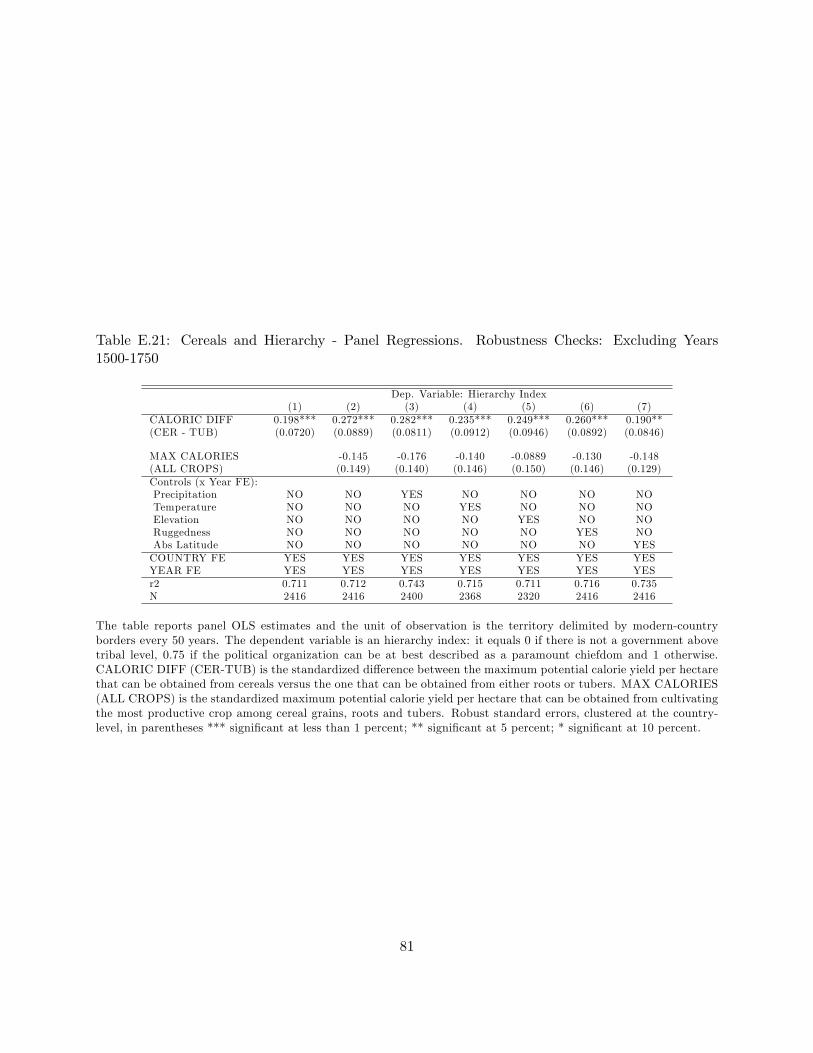
Table E.21: Cereals and Hierarchy - Panel Regressions. Robustness Checks: Excluding Years1500-1750
Dep. Variable: Hierarchy Index(1) (2) (3) (4) (5) (6) (7)
CALORIC DIFF 0.198*** 0.272*** 0.282*** 0.235*** 0.249*** 0.260*** 0.190**(CER - TUB) (0.0720) (0.0889) (0.0811) (0.0912) (0.0946) (0.0892) (0.0846)
MAX CALORIES -0.145 -0.176 -0.140 -0.0889 -0.130 -0.148(ALL CROPS) (0.149) (0.140) (0.146) (0.150) (0.146) (0.129)Controls (x Year FE):Precipitation NO NO YES NO NO NO NOTemperature NO NO NO YES NO NO NOElevation NO NO NO NO YES NO NORuggedness NO NO NO NO NO YES NOAbs Latitude NO NO NO NO NO NO YESCOUNTRY FE YES YES YES YES YES YES YESYEAR FE YES YES YES YES YES YES YESr2 0.711 0.712 0.743 0.715 0.711 0.716 0.735N 2416 2416 2400 2368 2320 2416 2416
The table reports panel OLS estimates and the unit of observation is the territory delimited by modern-countryborders every 50 years. The dependent variable is an hierarchy index: it equals 0 if there is not a government abovetribal level, 0.75 if the political organization can be at best described as a paramount chiefdom and 1 otherwise.CALORIC DIFF (CER-TUB) is the standardized di¤erence between the maximum potential calorie yield per hectarethat can be obtained from cereals versus the one that can be obtained from either roots or tubers. MAX CALORIES(ALL CROPS) is the standardized maximum potential calorie yield per hectare that can be obtained from cultivatingthe most productive crop among cereal grains, roots and tubers. Robust standard errors, clustered at the country-level, in parentheses *** signi�cant at less than 1 percent; ** signi�cant at 5 percent; * signi�cant at 10 percent.
81
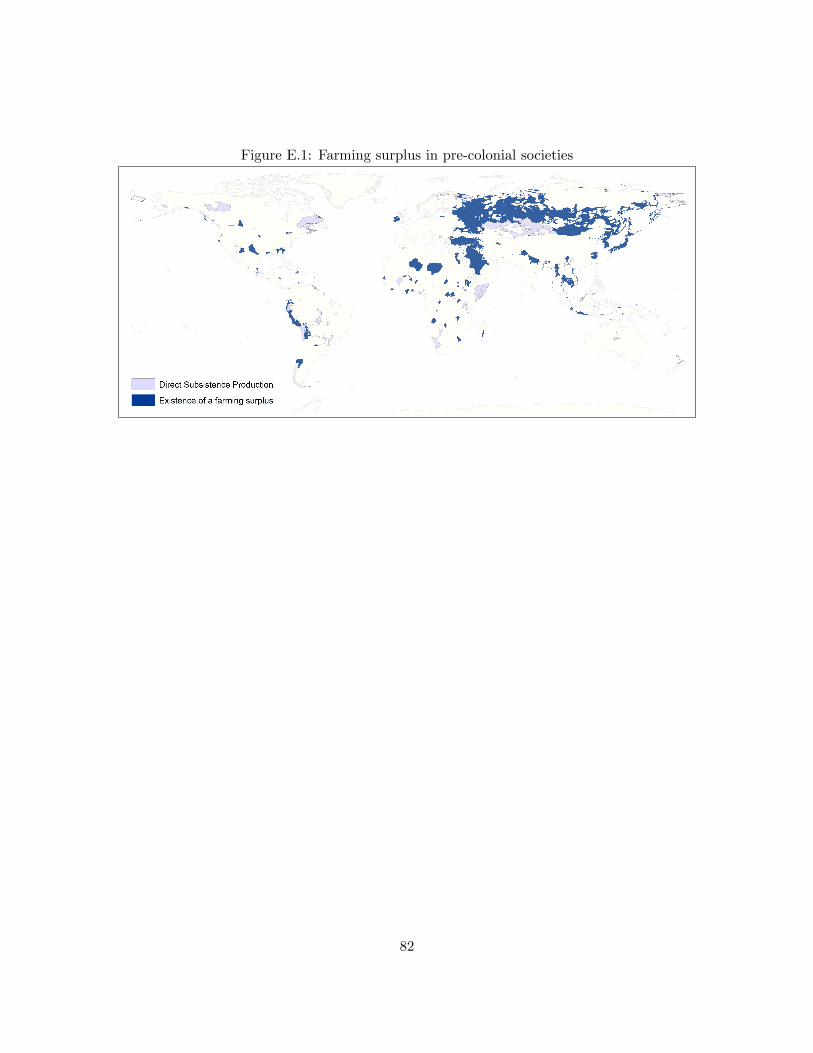
Figure E.1: Farming surplus in pre-colonial societies
82
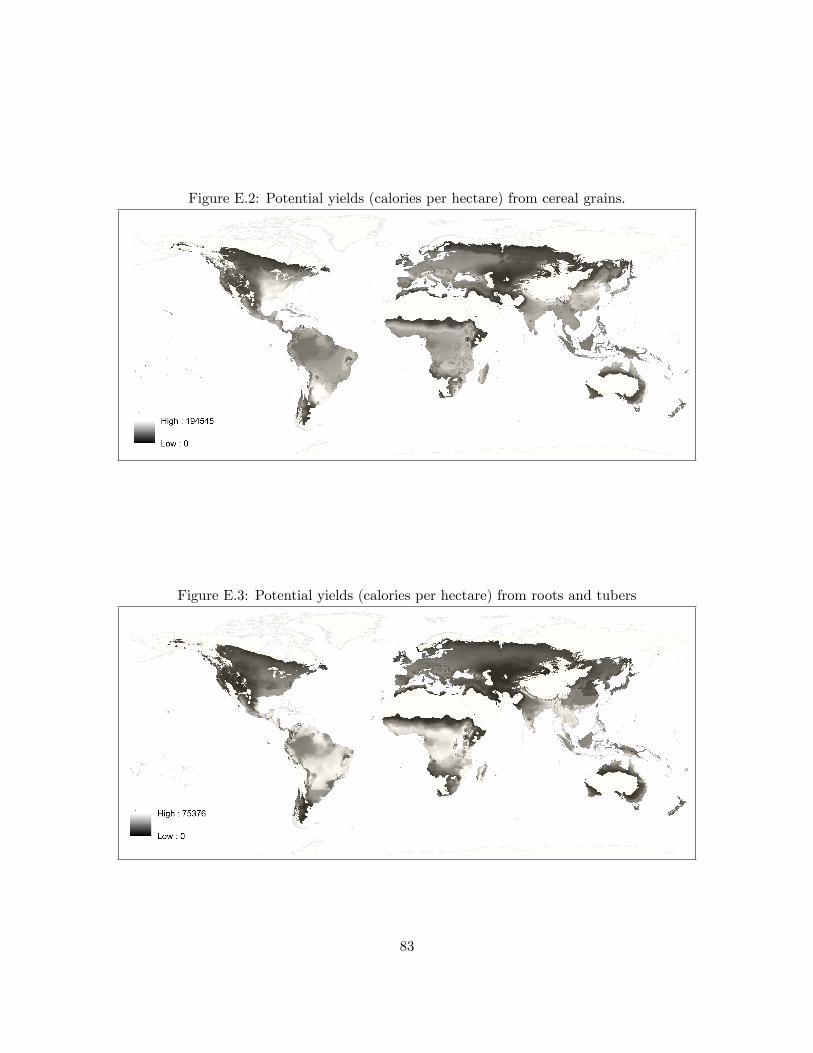
Figure E.2: Potential yields (calories per hectare) from cereal grains.
Figure E.3: Potential yields (calories per hectare) from roots and tubers
83
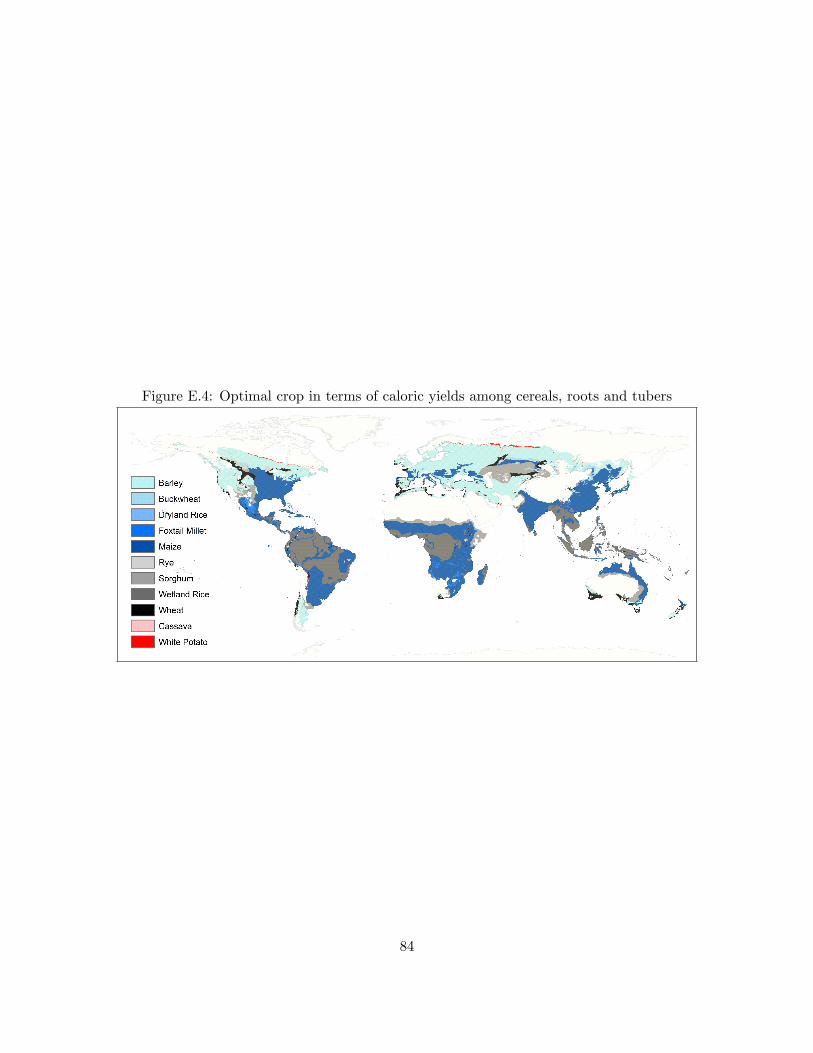
Figure E.4: Optimal crop in terms of caloric yields among cereals, roots and tubers
84


![PROPERTY, APPROPRIABILITY AND THE FIRST SALE DOCTRINEportal.idc.ac.il/en/ilea/annualmeeting/documents... · [Draft Israel L&E--5/30/07] Yonatan Even PROPERTY, APPROPRIABILITY & FIRST](https://img.pdfslide.us/doc/110x75/60083fae1ffbc25ea8703fbc/property-appropriability-and-the-first-sale-draft-israel-le-53007-yonatan.jpg)