Embed Size (px)
Citation preview
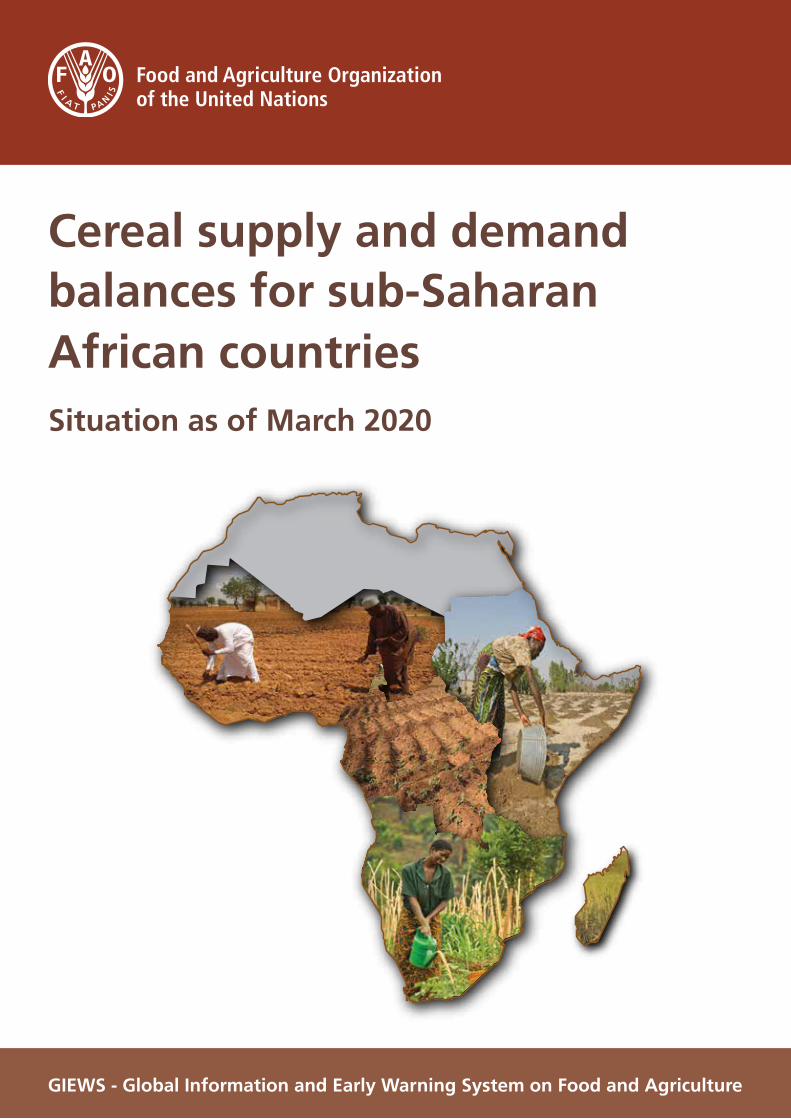
Cereal supply and demand balances for sub-Saharan African countriesSituation as of March 2020
GIEWS - Global Information and Early Warning System on Food and Agriculture


Cereal supply and demand balances for sub-Saharan
African countries
Situation as of March 2020
Global Information and Early Warning System on Food and Agriculture (GIEWS)
Trade and Markets Division (EST)
Food and Agriculture Organization of the United NationsRome, 2020

Required citation:FAO. 2020. Cereal supply and demand balances for sub-Saharan African countries – Situation as of March 2020. Rome. https://doi.org/10.4060/ca8841en
The boundaries and names shown and the designations used on the maps featured in this information product do not imply the expression of any opinion whatsoever on the part of the Food and Agriculture Organization of the United Nations (FAO) concerning the legal or development status of any country, territory, city or area or of its authorities, or concerning the delimitation of its frontiers or boundaries. Dashed lines on maps represent approximate border lines for which there may not yet be full agreement. The mention of specific companies or products of manufacturers, whether or not these have been patented, does not imply that these have been endorsed or recommended by FAO in preference to others of a similar nature that are not mentioned.
The views expressed in this information product are those of the author(s) and do not necessarily reflect the views or policies of FAO.
ISBN 978-92-5-132530-8 © FAO, 2020
Some rights reserved. This work is made available under the Creative Commons Attribution-NonCommercial-ShareAlike 3.0 IGO licence (CC BY-NC-SA 3.0 IGO; https://creativecommons.org/licenses/by-nc-sa/3.0/igo/legalcode).
Under the terms of this licence, this work may be copied, redistributed and adapted for non-commercial purposes, provided that the work is appropriately cited. In any use of this work, there should be no suggestion that FAO endorses any specific organization, products or services. The use of the FAO logo is not permitted. If the work is adapted, then it must be licensed under the same or equivalent Creative Commons license. If a translation of this work is created, it must include the following disclaimer along with the required citation: “This translation was not created by the Food and Agriculture Organization of the United Nations (FAO). FAO is not responsible for the content or accuracy of this translation. The original [Language] edition shall be the authoritative edition.
Disputes arising under the licence that cannot be settled amicably will be resolved by mediation and arbitration as described in Article 8 of the licence except as otherwise provided herein. The applicable mediation rules will be the mediation rules of the World Intellectual Property Organization http://www.wipo.int/amc/en/mediation/rules and any arbitration will be in accordance with the Arbitration Rules of the United Nations Commission on International Trade Law (UNCITRAL).
Third-party materials. Users wishing to reuse material from this work that is attributed to a third party, such as tables, figures or images, are responsible for determining whether permission is needed for that reuse and for obtaining permission from the copyright holder. The risk of claims resulting from infringement of any third-party-owned component in the work rests solely with the user.
Sales, rights and licensing. FAO information products are available on the FAO website (www.fao.org/publications) and can be purchased through [email protected]. Requests for commercial use should be submitted via: www.fao.org/contact-us/licencerequest. Queries regarding rights and licensing should be submitted to: [email protected].
Cover photographs: ©FAO/S. Nguyen, ©FAO/F. Nyakairu, ©FAO/J. Belgrave and ©FAO/D. Kwande.
iCereal supply and demand balances for sub-Saharan African countries as of March 2020
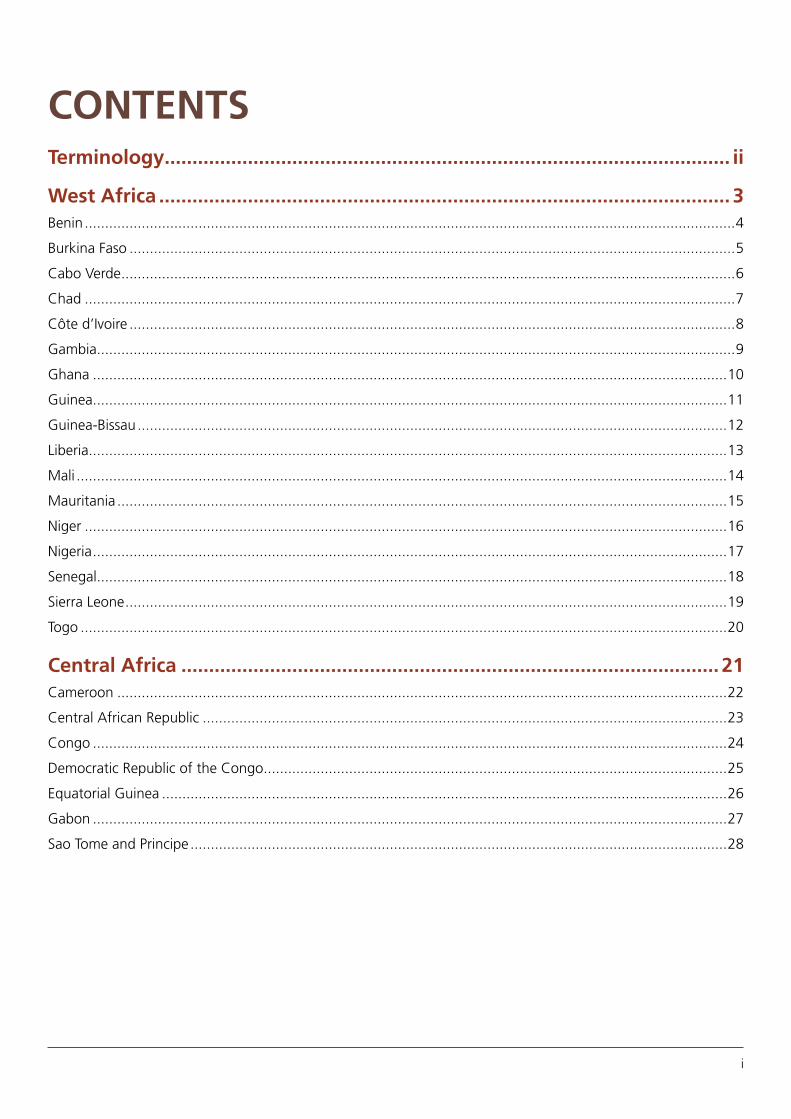
CONTENTSTerminology ...................................................................................................... ii
West Africa ....................................................................................................... 3Benin ................................................................................................................................................................4
Burkina Faso .....................................................................................................................................................5
Cabo Verde .......................................................................................................................................................6
Chad ................................................................................................................................................................7
Côte d’Ivoire .....................................................................................................................................................8
Gambia .............................................................................................................................................................9
Ghana ............................................................................................................................................................10
Guinea ............................................................................................................................................................11
Guinea-Bissau .................................................................................................................................................12
Liberia .............................................................................................................................................................13
Mali ................................................................................................................................................................14
Mauritania ......................................................................................................................................................15
Niger ..............................................................................................................................................................16
Nigeria ............................................................................................................................................................17
Senegal ...........................................................................................................................................................18
Sierra Leone ....................................................................................................................................................19
Togo ...............................................................................................................................................................20
Central Africa ................................................................................................. 21Cameroon ......................................................................................................................................................22
Central African Republic .................................................................................................................................23
Congo ............................................................................................................................................................24
Democratic Republic of the Congo ..................................................................................................................25
Equatorial Guinea ...........................................................................................................................................26
Gabon ............................................................................................................................................................27
Sao Tome and Principe ....................................................................................................................................28

Cereal supply and demand balances for sub-Saharan African countries as of March 2020
ii
Terminology ¾ All supply and demand figures are FAO forecasts and estimates based on official and unofficial sources.
¾ Cereals include: wheat, rice and coarse grains. Coarse grains include: maize, barley, sorghum, millet, rye, oats and NES (Not Elsewhere Specified).
¾ All elements of utilization for wheat and coarse grains are expressed in grain equivalent.
¾ For rice, all elements are expressed in milled terms.
¾ Non-food use includes post-harvest losses, seed use, feed use and industrial use for all cereals.
¾ ‘-‘ means nil or negligible.
¾ The source of the population figures is the World Population Prospects: The 2019 Revision from the UN Population Division.
East Africa ....................................................................................................... 29Burundi ...........................................................................................................................................................30
Comoros .........................................................................................................................................................31
Djibouti ...........................................................................................................................................................32
Eritrea .............................................................................................................................................................33
Ethiopia ..........................................................................................................................................................34
Kenya .............................................................................................................................................................35
Rwanda ..........................................................................................................................................................36
Seychelles .......................................................................................................................................................37
Somalia ...........................................................................................................................................................38
South Sudan ...................................................................................................................................................39
Sudan .............................................................................................................................................................40
Uganda ...........................................................................................................................................................41
United Republic of Tanzania ............................................................................................................................42
Southern Africa .............................................................................................. 43Angola ............................................................................................................................................................44
Botswana ........................................................................................................................................................45
Eswatini ..........................................................................................................................................................46
Lesotho ...........................................................................................................................................................47
Madagascar ....................................................................................................................................................48
Malawi ...........................................................................................................................................................49
Mauritius ........................................................................................................................................................50
Mozambique ..................................................................................................................................................51
Namibia ..........................................................................................................................................................52
South Africa ....................................................................................................................................................53
Zambia ...........................................................................................................................................................54
Zimbabwe .......................................................................................................................................................55
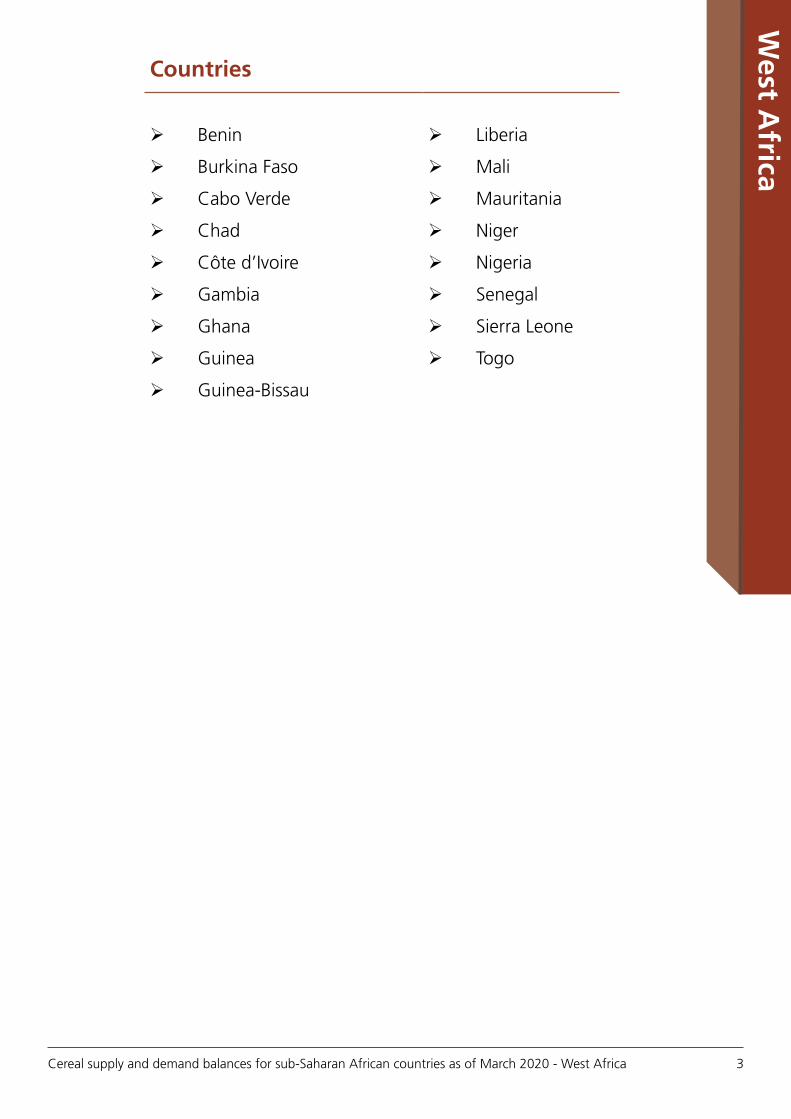
3Cereal supply and demand balances for sub-Saharan African countries as of March 2020 - West Africa
West A
frica
Countries
¾ Benin
¾ Burkina Faso
¾ Cabo Verde
¾ Chad
¾ Côte d’Ivoire
¾ Gambia
¾ Ghana
¾ Guinea
¾ Guinea-Bissau
¾ Liberia
¾ Mali
¾ Mauritania
¾ Niger
¾ Nigeria
¾ Senegal
¾ Sierra Leone
¾ Togo

Cereal supply and demand balances for sub-Saharan African countries as of March 2020 - West Africa
4
BENINCEREAL SUPPLY/DEMAND BALANCE FOR THE 2019 MARKETING YEAR (January/December)
Wheat RiceCoarsegrains
Totalcereals
2019 Domestic Availability (000 tonnes) - 235 1 610 1 8452018 production - 225 1 610 1 835Estimated stock drawdown - 10 - 10
2019 Utilization (000 tonnes) 56 685 1 621 2 362Food use 52 559 1 022 1 633Non-food use 1 126 497 624Exports 3 - 102 105Estimated stock build-up - - - -
2019 Import Requirements (000 tonnes) 56 450 11 517
Per Caput Consumption (kg/year) 5 49 89 142
2019 Comparison with the previous year and the recent average
Production (000 tonnes)Previous year's production - 217 1 783 2 000Previous five years' average production - 155 1 532 1 6872018 production compared to average (%) - 145 105 109
Import Requirements (000 tonnes)Previous year's imports 56 545 11 612Previous five years' average imports 56 368 9 4332019 Import requirements compared to average (%) 100 122 124 119
Additional Information
Population mid-2018 (000s): 11 485
Crop Calendar (*major foodcrop)
Cassava*Irrigated RiceMaize* (Main)Maize* (Second)Millet & SorghumRiceYams*
Lean period (north)Lean period (south)
SowingGrowingHarvesting
J F M A M J J A S O N D

5Cereal supply and demand balances for sub-Saharan African countries as of March 2020 - West Africa
BURKINA FASOCEREAL SUPPLY/DEMAND BALANCE FOR THE 2019/20 MARKETING YEAR (November/October)
Wheat RiceCoarsegrains
Totalcereals
2019/20 Domestic Availability (000 tonnes) - 242 4 663 4 9042019 production - 242 4 663 4 904Expected stock drawdown - - - -
2019/20 Utilization (000 tonnes) 171 782 4 704 5 656Food use 150 715 3 587 4 452Non-food use 21 57 827 905Exports - - 170 170Expected stock build-up - 10 120 130
2019/20 Import Requirements (000 tonnes) 171 540 41 752
Per Caput Consumption (kg/year) 7 35 177 219
2019/20 Comparison with the previous year and the recent average
Production (000 tonnes)Previous year's production - 231 4 830 5 061Previous five years' average production - 229 4 147 4 3762019 production compared to average (%) - 106 112 112
Import Requirements (000 tonnes)Previous year's imports 171 510 43 724Previous five years' average imports 157 448 42 6482019/20 Import requirements compared to average (%) 109 121 97 116
Note: Rice marketing year January/December of second year shown.
Additional Information
Population mid-2019 (000s): 20 321
Crop Calendar (*major foodcrop)
Maize*Millet*RiceSorghum*
Lean period
SowingGrowingHarvesting
J F M A M J J A S O N D

Cereal supply and demand balances for sub-Saharan African countries as of March 2020 - West Africa
6
CABO VERDECEREAL SUPPLY/DEMAND BALANCE FOR THE 2019/20 MARKETING YEAR (November/October)
Wheat RiceCoarsegrains
Totalcereals
2019/20 Domestic Availability (000 tonnes) 4 1 1 22019 production - - 1 1Expected stock drawdown 4 1 - 1
2019/20 Utilization (000 tonnes) 29 33 30 89Food use 29 32 22 83Non-food use - 1 5 6Exports - - - -Expected stock build-up - - 4 -
2019/20 Import Requirements (000 tonnes) 25 32 30 87
Per Caput Consumption (kg/year) 53 59 39 150
2019/20 Comparison with the previous year and the recent average
Production (000 tonnes)Previous year's production - - 1 1Previous five years' average production - - 4 42019 production compared to average (%) - - 15 15
Import Requirements (000 tonnes)Previous year's imports 25 25 30 80Previous five years' average imports 25 31 26 822019/20 Import requirements compared to average (%) 100 105 113 106
Note: Rice marketing year January/December of second year shown.
Additional Information
Population mid-2019 (000s): 550
Crop Calendar (*major foodcrop)
Maize*Pulses
Lean period
SowingGrowingHarvesting
J F M A M J J A S O N D
7Cereal supply and demand balances for sub-Saharan African countries as of March 2020 - West Africa
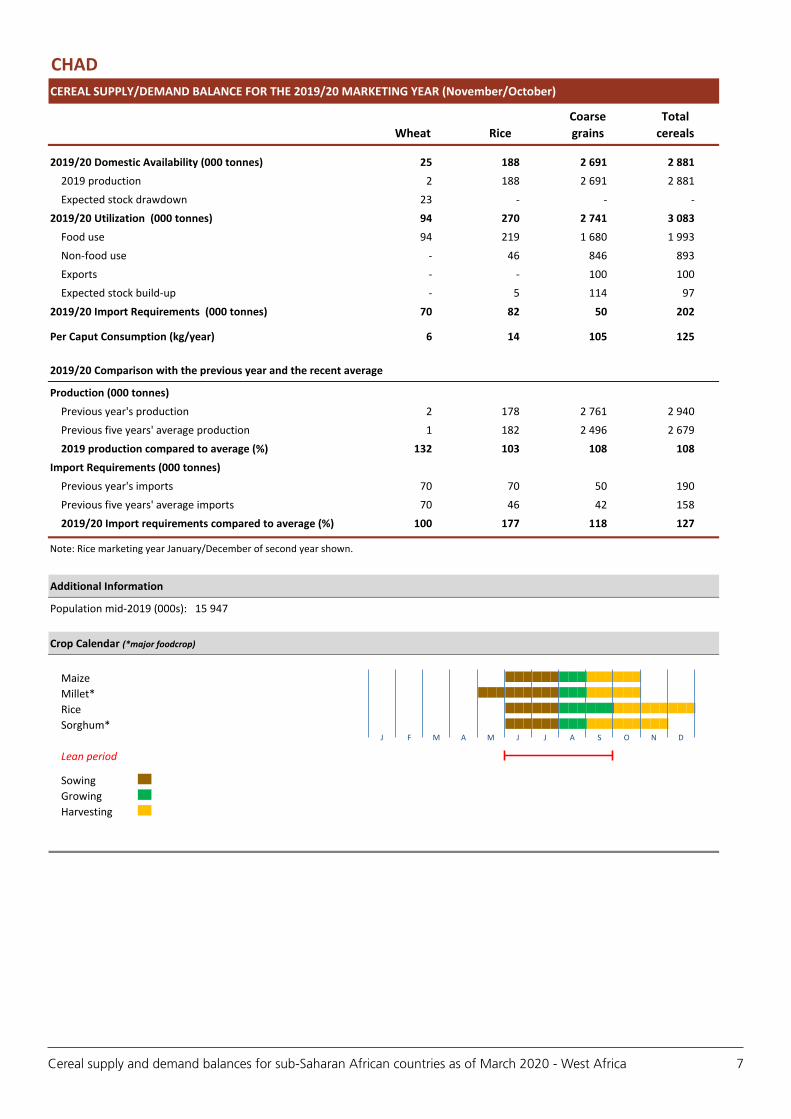
CHADCEREAL SUPPLY/DEMAND BALANCE FOR THE 2019/20 MARKETING YEAR (November/October)
Wheat RiceCoarsegrains
Totalcereals
2019/20 Domestic Availability (000 tonnes) 25 188 2 691 2 8812019 production 2 188 2 691 2 881Expected stock drawdown 23 - - -
2019/20 Utilization (000 tonnes) 94 270 2 741 3 083Food use 94 219 1 680 1 993Non-food use - 46 846 893Exports - - 100 100Expected stock build-up - 5 114 97
2019/20 Import Requirements (000 tonnes) 70 82 50 202
Per Caput Consumption (kg/year) 6 14 105 125
2019/20 Comparison with the previous year and the recent average
Production (000 tonnes)Previous year's production 2 178 2 761 2 940Previous five years' average production 1 182 2 496 2 6792019 production compared to average (%) 132 103 108 108
Import Requirements (000 tonnes)Previous year's imports 70 70 50 190Previous five years' average imports 70 46 42 1582019/20 Import requirements compared to average (%) 100 177 118 127
Note: Rice marketing year January/December of second year shown.
Additional Information
Population mid-2019 (000s): 15 947
Crop Calendar (*major foodcrop)
MaizeMillet*RiceSorghum*
Lean period
SowingGrowingHarvesting
J F M A M J J A S O N D

Cereal supply and demand balances for sub-Saharan African countries as of March 2020 - West Africa
8
CÔTE D'IVOIRECEREAL SUPPLY/DEMAND BALANCE FOR THE 2019 MARKETING YEAR (January/December)
Wheat RiceCoarsegrains
Totalcereals
2019 Domestic Availability (000 tonnes) 85 643 1 227 1 9542018 production - 498 1 207 1 705Estimated stock drawdown 85 145 20 250
2019 Utilization (000 tonnes) 575 2 178 1 262 4 015Food use 525 2 058 1 098 3 681Non-food use 50 100 154 304Exports - 20 10 30Estimated stock build-up - - - -
2019 Import Requirements (000 tonnes) 490 1 535 36 2 061
Per Caput Consumption (kg/year) 21 82 44 147
2019 Comparison with the previous year and the recent average
Production (000 tonnes)Previous year's production - 525 1 171 1 696Previous five years' average production - 501 931 1 4322018 production compared to average (%) - 99 130 119
Import Requirements (000 tonnes)Previous year's imports 490 1 730 36 2 256Previous five years' average imports 506 1 503 35 2 0442019 Import requirements compared to average (%) 97 102 100 101
Additional Information
Population mid-2018 (000s): 25 069
Crop Calendar (*major foodcrop)
Cassava (1st year)Cassava (2nd year)Maize* (Main)Maize* (Second)MilletRice*SorghumYams
Lean period (north)Lean period (south)
SowingGrowingHarvesting
J F M A M J J A S O N D
9Cereal supply and demand balances for sub-Saharan African countries as of March 2020 - West Africa
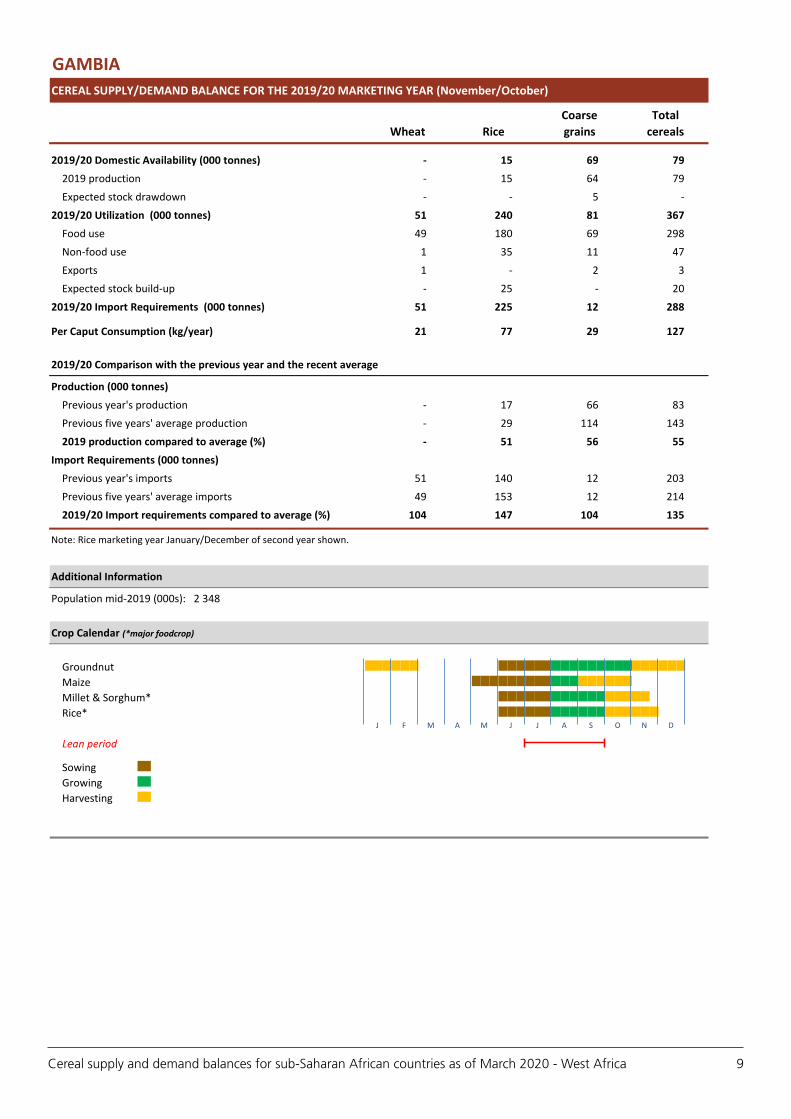
GAMBIACEREAL SUPPLY/DEMAND BALANCE FOR THE 2019/20 MARKETING YEAR (November/October)
Wheat RiceCoarsegrains
Totalcereals
2019/20 Domestic Availability (000 tonnes) - 15 69 792019 production - 15 64 79Expected stock drawdown - - 5 -
2019/20 Utilization (000 tonnes) 51 240 81 367Food use 49 180 69 298Non-food use 1 35 11 47Exports 1 - 2 3Expected stock build-up - 25 - 20
2019/20 Import Requirements (000 tonnes) 51 225 12 288
Per Caput Consumption (kg/year) 21 77 29 127
2019/20 Comparison with the previous year and the recent average
Production (000 tonnes)Previous year's production - 17 66 83Previous five years' average production - 29 114 1432019 production compared to average (%) - 51 56 55
Import Requirements (000 tonnes)Previous year's imports 51 140 12 203Previous five years' average imports 49 153 12 2142019/20 Import requirements compared to average (%) 104 147 104 135
Note: Rice marketing year January/December of second year shown.
Additional Information
Population mid-2019 (000s): 2 348
Crop Calendar (*major foodcrop)
GroundnutMaizeMillet & Sorghum*Rice*
Lean period
SowingGrowingHarvesting
J F M A M J J A S O N D

Cereal supply and demand balances for sub-Saharan African countries as of March 2020 - West Africa
10
GHANACEREAL SUPPLY/DEMAND BALANCE FOR THE 2019 MARKETING YEAR (January/December)
Wheat RiceCoarsegrains
Totalcereals
2019 Domestic Availability (000 tonnes) - 462 2 804 3 2662018 production - 462 2 804 3 266Estimated stock drawdown - - - -
2019 Utilization (000 tonnes) 570 1 488 2 859 4 917Food use 400 1 266 1 901 3 567Non-food use 150 132 835 1 117Exports - - 70 70Estimated stock build-up 20 90 53 163
2019 Import Requirements (000 tonnes) 570 1 027 55 1 652
Per Caput Consumption (kg/year) 13 43 64 120
2019 Comparison with the previous year and the recent average
Production (000 tonnes)Previous year's production - 433 2 453 2 886Previous five years' average production - 387 2 206 2 5922018 production compared to average (%) - 119 127 126
Import Requirements (000 tonnes)Previous year's imports 570 828 55 1 453Previous five years' average imports 562 696 51 1 3092019 Import requirements compared to average (%) 101 148 108 126
Additional Information
Population mid-2018 (000s): 29 767
Crop Calendar (*major foodcrop)
Cassava* (1st year)Cassava* (2nd year)Maize* (North/main)Maize* (Second)Maize* (South/main)Millet & SorghumRice (North)Rice (South)Yams*
Lean period (north)Lean period (south)
SowingGrowingHarvesting
J F M A M J J A S O N D
11Cereal supply and demand balances for sub-Saharan African countries as of March 2020 - West Africa
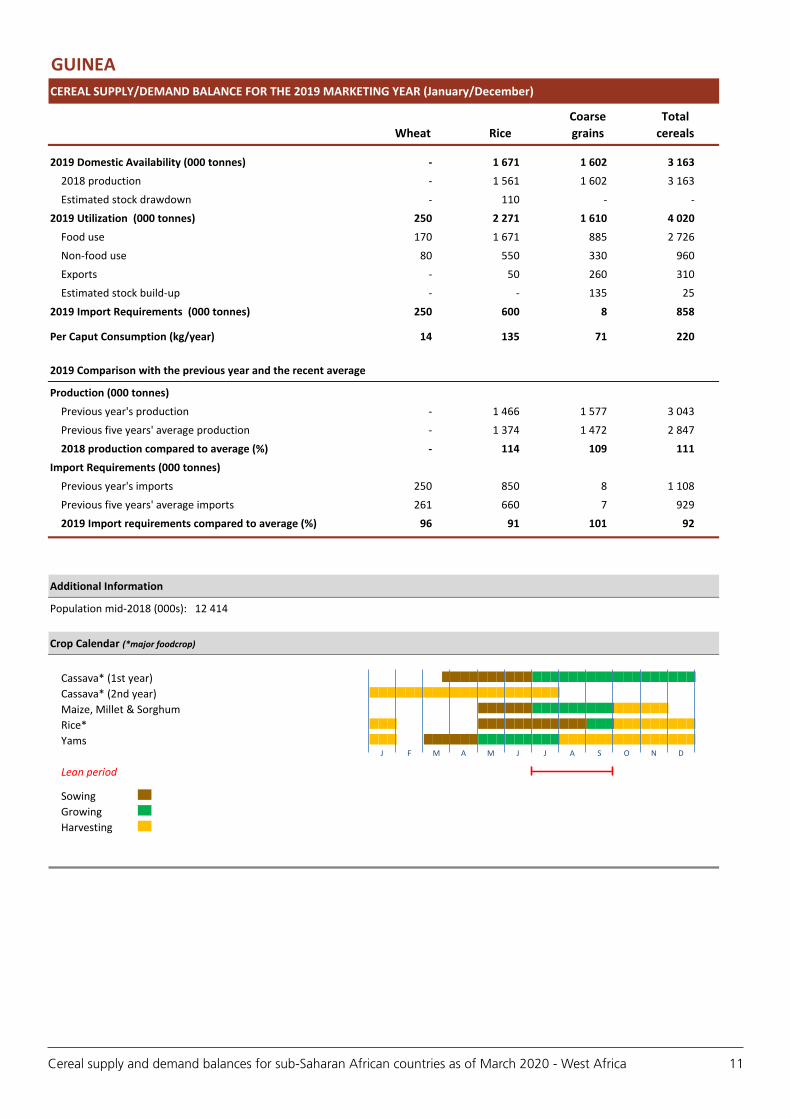
GUINEACEREAL SUPPLY/DEMAND BALANCE FOR THE 2019 MARKETING YEAR (January/December)
Wheat RiceCoarsegrains
Totalcereals
2019 Domestic Availability (000 tonnes) - 1 671 1 602 3 1632018 production - 1 561 1 602 3 163Estimated stock drawdown - 110 - -
2019 Utilization (000 tonnes) 250 2 271 1 610 4 020Food use 170 1 671 885 2 726Non-food use 80 550 330 960Exports - 50 260 310Estimated stock build-up - - 135 25
2019 Import Requirements (000 tonnes) 250 600 8 858
Per Caput Consumption (kg/year) 14 135 71 220
2019 Comparison with the previous year and the recent average
Production (000 tonnes)Previous year's production - 1 466 1 577 3 043Previous five years' average production - 1 374 1 472 2 8472018 production compared to average (%) - 114 109 111
Import Requirements (000 tonnes)Previous year's imports 250 850 8 1 108Previous five years' average imports 261 660 7 9292019 Import requirements compared to average (%) 96 91 101 92
Additional Information
Population mid-2018 (000s): 12 414
Crop Calendar (*major foodcrop)
Cassava* (1st year)Cassava* (2nd year)Maize, Millet & SorghumRice*Yams
Lean period
SowingGrowingHarvesting
J F M A M J J A S O N D

Cereal supply and demand balances for sub-Saharan African countries as of March 2020 - West Africa
12
GUINEA-BISSAUCEREAL SUPPLY/DEMAND BALANCE FOR THE 2019/20 MARKETING YEAR (November/October)
Wheat RiceCoarsegrains
Totalcereals
2019/20 Domestic Availability (000 tonnes) 2 125 59 1772019 production - 125 53 177Expected stock drawdown 2 - 6 -
2019/20 Utilization (000 tonnes) 22 265 73 352Food use 22 209 70 301Non-food use - 38 1 39Exports - - 2 2Expected stock build-up - 18 - 10
2019/20 Import Requirements (000 tonnes) 20 140 14 174
Per Caput Consumption (kg/year) 12 109 36 157
2019/20 Comparison with the previous year and the recent average
Production (000 tonnes)Previous year's production - 117 48 166Previous five years' average production - 111 40 1512019 production compared to average (%) - 113 130 117
Import Requirements (000 tonnes)Previous year's imports 20 100 14 134Previous five years' average imports 20 98 14 1322019/20 Import requirements compared to average (%) 100 143 100 132
Note: Rice marketing year January/December of second year shown.
Additional Information
Population mid-2019 (000s): 1 921
Crop Calendar (*major foodcrop)
Maize, Millet & Sorghum*Rice*
Lean period
SowingGrowingHarvesting
J F M A M J J A S O N D

13Cereal supply and demand balances for sub-Saharan African countries as of March 2020 - West Africa
LIBERIACEREAL SUPPLY/DEMAND BALANCE FOR THE 2019 MARKETING YEAR (January/December)
Wheat RiceCoarsegrains
Totalcereals
2019 Domestic Availability (000 tonnes) - 168 - 1682018 production - 168 - 168Estimated stock drawdown - - - -
2019 Utilization (000 tonnes) 61 588 26 675Food use 59 520 26 605Non-food use 2 68 - 70Exports - - - -Estimated stock build-up - - - -
2019 Import Requirements (000 tonnes) 61 420 26 507
Per Caput Consumption (kg/year) 12 108 5 126
2019 Comparison with the previous year and the recent average
Production (000 tonnes)Previous year's production - 161 - 161Previous five years' average production - 175 - 1752018 production compared to average (%) - 96 - 96
Import Requirements (000 tonnes)Previous year's imports 61 400 26 487Previous five years' average imports 59 350 26 4352019 Import requirements compared to average (%) 103 120 101 116
Additional Information
Population mid-2018 (000s): 4 819
Crop Calendar (*major foodcrop)
Cassava* (1st year)Cassava* (2nd year)Rice*Yams
Lean period
SowingGrowingHarvesting
J F M A M J J A S O N D

Cereal supply and demand balances for sub-Saharan African countries as of March 2020 - West Africa
14
MALICEREAL SUPPLY/DEMAND BALANCE FOR THE 2019/20 MARKETING YEAR (November/October)
Wheat RiceCoarsegrains
Totalcereals
2019/20 Domestic Availability (000 tonnes) 29 2 022 7 057 9 1082019 production 29 1 972 7 057 9 058Expected stock drawdown - 50 - 50
2019/20 Utilization (000 tonnes) 249 2 302 7 068 9 619Food use 235 1 782 2 927 4 944Non-food use 12 510 3 906 4 428Exports 2 10 235 247Expected stock build-up - - - -
2019/20 Import Requirements (000 tonnes) 220 280 11 511
Per Caput Consumption (kg/year) 12 91 149 252
2019/20 Comparison with the previous year and the recent average
Production (000 tonnes)Previous year's production 29 2 154 6 963 9 146Previous five years' average production 36 1 789 6 090 7 9152019 production compared to average (%) 81 110 116 114
Import Requirements (000 tonnes)Previous year's imports 220 230 11 461Previous five years' average imports 212 231 12 4552019/20 Import requirements compared to average (%) 104 121 92 112
Note: Rice marketing year January/December of second year shown.
Additional Information
Population mid-2019 (000s): 19 658
Crop Calendar (*major foodcrop)
Irrigated Rice*Maize, Millet & Sorghum*Rainfed Rice*
Lean period
SowingGrowingHarvesting
J F M A M J J A S O N D

15Cereal supply and demand balances for sub-Saharan African countries as of March 2020 - West Africa
MAURITANIACEREAL SUPPLY/DEMAND BALANCE FOR THE 2019/20 MARKETING YEAR (November/October)
Wheat RiceCoarsegrains
Totalcereals
2019/20 Domestic Availability (000 tonnes) 4 230 86 3202019 production 4 230 86 320Expected stock drawdown - - - -
2019/20 Utilization (000 tonnes) 488 270 107 866Food use 405 232 94 731Non-food use 63 22 12 97Exports 20 - 1 21Expected stock build-up - 16 - 16
2019/20 Import Requirements (000 tonnes) 485 40 21 546
Per Caput Consumption (kg/year) 90 51 21 162
2019/20 Comparison with the previous year and the recent average
Production (000 tonnes)Previous year's production 3 183 103 289Previous five years' average production 5 160 85 2502019 production compared to average (%) 67 144 101 128
Import Requirements (000 tonnes)Previous year's imports 485 45 14 544Previous five years' average imports 512 62 14 5892019/20 Import requirements compared to average (%) 95 65 147 93
Note: Rice marketing year January/December of second year shown.
Additional Information
Population mid-2019 (000s): 4 526
Crop Calendar (*major foodcrop)
Irrigated Rice*Low lying area crops Maize & MilletOff-season RiceSorghum*Walo crops
Lean period
SowingGrowingHarvesting
J F M A M J J A S O N D
Cereal supply and demand balances for sub-Saharan African countries as of March 2020 - West Africa
16
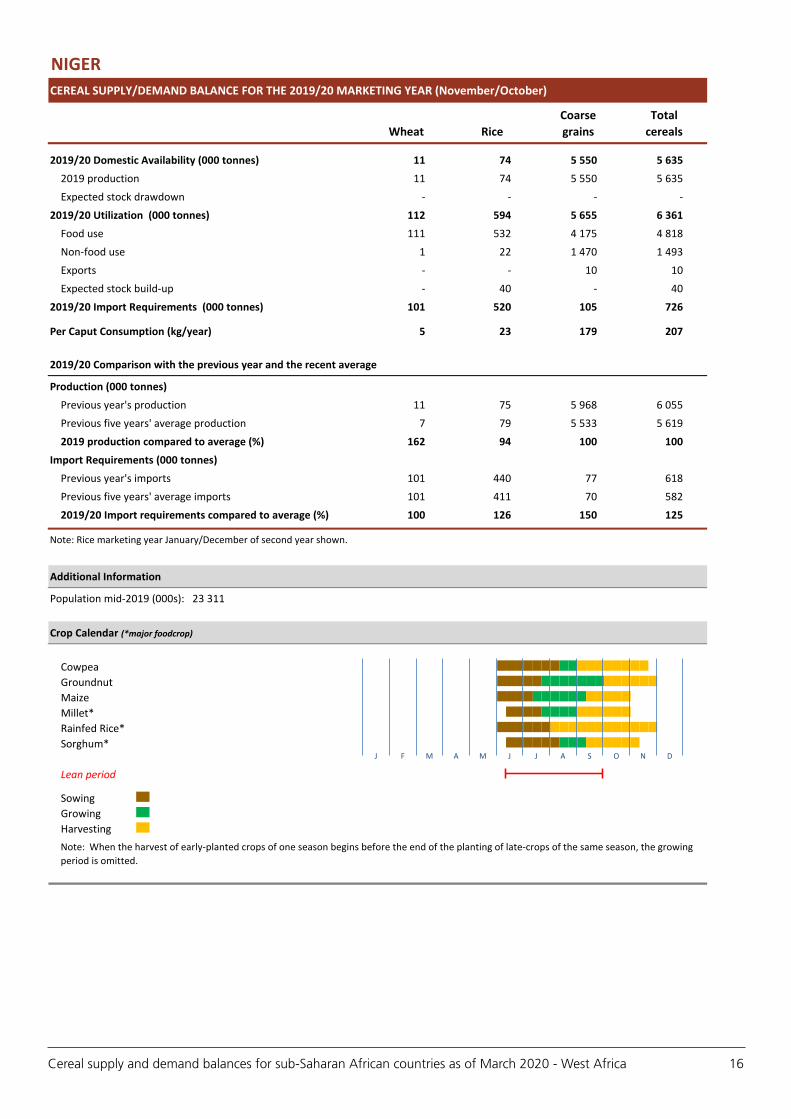
NIGERCEREAL SUPPLY/DEMAND BALANCE FOR THE 2019/20 MARKETING YEAR (November/October)
Wheat RiceCoarsegrains
Totalcereals
2019/20 Domestic Availability (000 tonnes) 11 74 5 550 5 6352019 production 11 74 5 550 5 635Expected stock drawdown - - - -
2019/20 Utilization (000 tonnes) 112 594 5 655 6 361Food use 111 532 4 175 4 818Non-food use 1 22 1 470 1 493Exports - - 10 10Expected stock build-up - 40 - 40
2019/20 Import Requirements (000 tonnes) 101 520 105 726
Per Caput Consumption (kg/year) 5 23 179 207
2019/20 Comparison with the previous year and the recent average
Production (000 tonnes)Previous year's production 11 75 5 968 6 055Previous five years' average production 7 79 5 533 5 6192019 production compared to average (%) 162 94 100 100
Import Requirements (000 tonnes)Previous year's imports 101 440 77 618Previous five years' average imports 101 411 70 5822019/20 Import requirements compared to average (%) 100 126 150 125
Note: Rice marketing year January/December of second year shown.
Additional Information
Population mid-2019 (000s): 23 311
Crop Calendar (*major foodcrop)
CowpeaGroundnutMaizeMillet*Rainfed Rice*Sorghum*
Lean period
SowingGrowingHarvestingNote: When the harvest of early-planted crops of one season begins before the end of the planting of late-crops of the same season, the growing period is omitted.
J F M A M J J A S O N D

17Cereal supply and demand balances for sub-Saharan African countries as of March 2020 - West Africa
NIGERIACEREAL SUPPLY/DEMAND BALANCE FOR THE 2019 MARKETING YEAR (January/December)
Wheat RiceCoarsegrains
Totalcereals
2019 Domestic Availability (000 tonnes) 94 5 340 21 430 26 8442018 production 74 5 340 21 430 26 844Estimated stock drawdown 20 - - -
2019 Utilization (000 tonnes) 4 694 8 010 21 850 34 534Food use 3 914 6 829 15 617 26 360Non-food use 180 1 060 5 234 6 474Exports 600 - 250 850Estimated stock build-up - 120 750 850
2019 Import Requirements (000 tonnes) 4 600 2 670 420 7 690
Per Caput Consumption (kg/year) 20 35 80 135
2019 Comparison with the previous year and the recent average
Production (000 tonnes)Previous year's production 74 4 831 18 961 23 866Previous five years' average production 69 4 313 17 945 22 3272018 production compared to average (%) 108 124 119 120
Import Requirements (000 tonnes)Previous year's imports 4 600 2 670 420 7 690Previous five years' average imports 4 520 2 662 366 7 5482019 Import requirements compared to average (%) 102 100 115 102
Additional Information
Population mid-2018 (000s): 195 875
Crop Calendar (*major foodcrop)
Cassava* (South)Irrigated Rice*Maize* (North/main)Maize* (second)Maize* (South/main)Millet*Rainfed Rice*SorghumYams
Lean period (north)Lean period (south)
SowingGrowingHarvestingNote: When the harvest of early-planted crops of one season begins before the end of the planting of late-crops of the same season, the growing period is omitted.
J F M A M J J A S O N D
Cereal supply and demand balances for sub-Saharan African countries as of March 2020 - West Africa
18
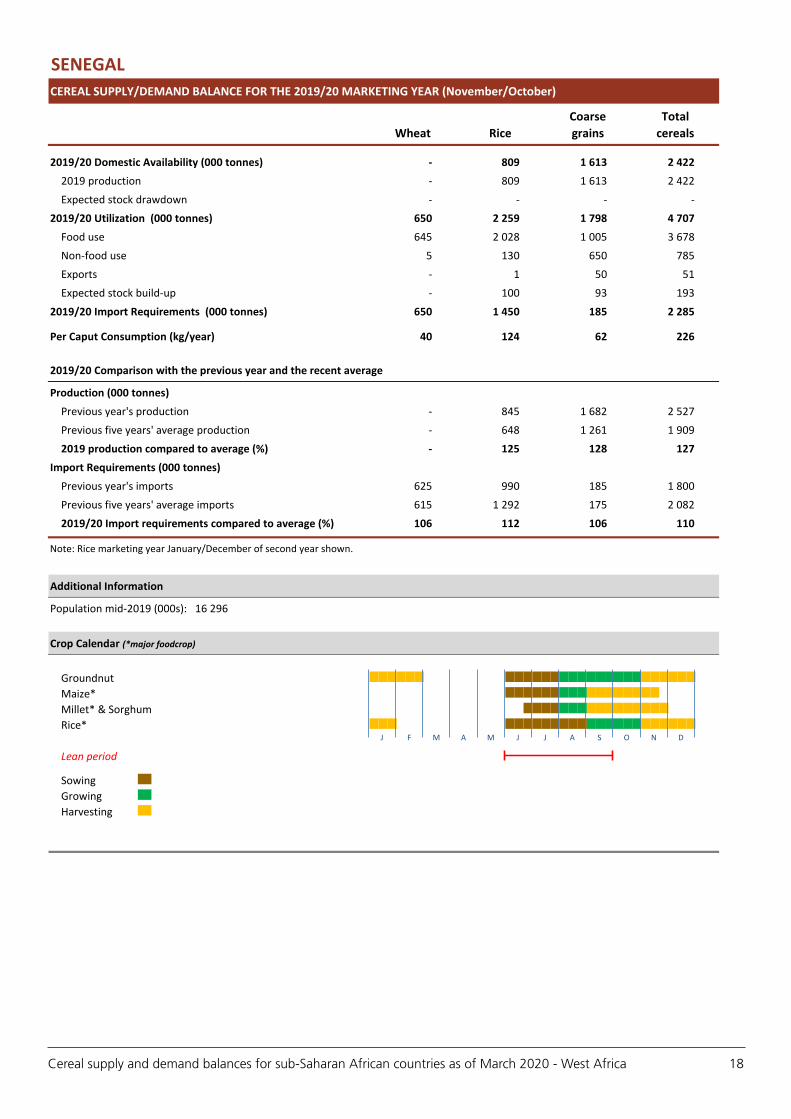
SENEGALCEREAL SUPPLY/DEMAND BALANCE FOR THE 2019/20 MARKETING YEAR (November/October)
Wheat RiceCoarsegrains
Totalcereals
2019/20 Domestic Availability (000 tonnes) - 809 1 613 2 4222019 production - 809 1 613 2 422Expected stock drawdown - - - -
2019/20 Utilization (000 tonnes) 650 2 259 1 798 4 707Food use 645 2 028 1 005 3 678Non-food use 5 130 650 785Exports - 1 50 51Expected stock build-up - 100 93 193
2019/20 Import Requirements (000 tonnes) 650 1 450 185 2 285
Per Caput Consumption (kg/year) 40 124 62 226
2019/20 Comparison with the previous year and the recent average
Production (000 tonnes)Previous year's production - 845 1 682 2 527Previous five years' average production - 648 1 261 1 9092019 production compared to average (%) - 125 128 127
Import Requirements (000 tonnes)Previous year's imports 625 990 185 1 800Previous five years' average imports 615 1 292 175 2 0822019/20 Import requirements compared to average (%) 106 112 106 110
Note: Rice marketing year January/December of second year shown.
Additional Information
Population mid-2019 (000s): 16 296
Crop Calendar (*major foodcrop)
GroundnutMaize*Millet* & SorghumRice*
Lean period
SowingGrowingHarvesting
J F M A M J J A S O N D
19Cereal supply and demand balances for sub-Saharan African countries as of March 2020 - West Africa
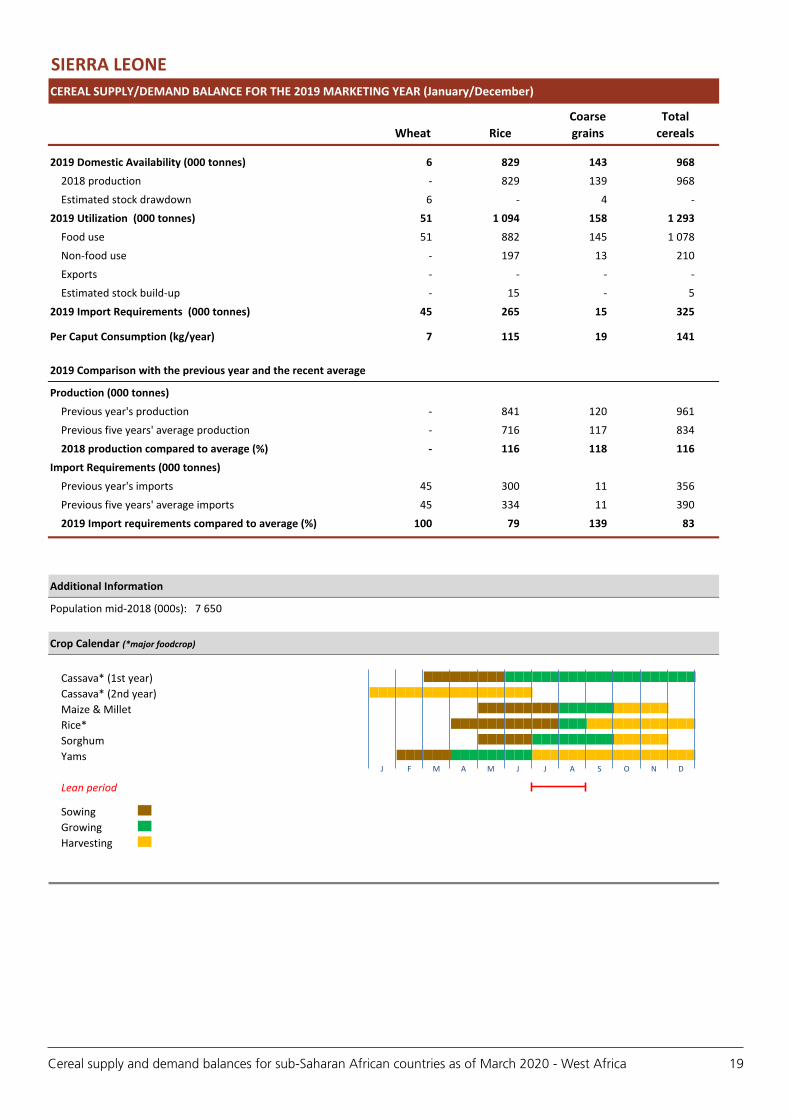
SIERRA LEONECEREAL SUPPLY/DEMAND BALANCE FOR THE 2019 MARKETING YEAR (January/December)
Wheat RiceCoarsegrains
Totalcereals
2019 Domestic Availability (000 tonnes) 6 829 143 9682018 production - 829 139 968Estimated stock drawdown 6 - 4 -
2019 Utilization (000 tonnes) 51 1 094 158 1 293Food use 51 882 145 1 078Non-food use - 197 13 210Exports - - - -Estimated stock build-up - 15 - 5
2019 Import Requirements (000 tonnes) 45 265 15 325
Per Caput Consumption (kg/year) 7 115 19 141
2019 Comparison with the previous year and the recent average
Production (000 tonnes)Previous year's production - 841 120 961Previous five years' average production - 716 117 8342018 production compared to average (%) - 116 118 116
Import Requirements (000 tonnes)Previous year's imports 45 300 11 356Previous five years' average imports 45 334 11 3902019 Import requirements compared to average (%) 100 79 139 83
Additional Information
Population mid-2018 (000s): 7 650
Crop Calendar (*major foodcrop)
Cassava* (1st year)Cassava* (2nd year)Maize & MilletRice*SorghumYams
Lean period
SowingGrowingHarvesting
J F M A M J J A S O N D

Cereal supply and demand balances for sub-Saharan African countries as of March 2020 - West Africa
20
TOGOCEREAL SUPPLY/DEMAND BALANCE FOR THE 2019 MARKETING YEAR (January/December)
Wheat RiceCoarsegrains
Totalcereals
2019 Domestic Availability (000 tonnes) 12 87 1 194 1 2812018 production - 87 1 194 1 281Estimated stock drawdown 12 - - -
2019 Utilization (000 tonnes) 82 304 1 199 1 573Food use 70 283 783 1 136Non-food use 2 17 391 410Exports 10 - 15 25Estimated stock build-up - 4 10 2
2019 Import Requirements (000 tonnes) 70 217 6 293
Per Caput Consumption (kg/year) 9 36 99 144
2019 Comparison with the previous year and the recent average
Production (000 tonnes)Previous year's production - 84 1 161 1 245Previous five years' average production - 88 1 123 1 2112018 production compared to average (%) - 99 106 106
Import Requirements (000 tonnes)Previous year's imports 70 224 6 300Previous five years' average imports 87 186 6 2782019 Import requirements compared to average (%) 81 117 100 105
Additional Information
Population mid-2018 (000s): 7 889
Crop Calendar (*major foodcrop)
Cassava*Maize* (Main)Maize* (Second)Millet & SorghumRiceYams
Lean period (north)Lean period (south)
SowingGrowingHarvesting
J F M A M J J A S O N D

21Cereal supply and demand balances for sub-Saharan African countries as of March 2020 - Central Africa
Cen
tral Africa
Countries
¾ Cameroon
¾ Central African Republic
¾ Congo
¾ Democratic Republic of the Congo
¾ Equatorial Guinea
¾ Gabon
¾ Sao Tome and Principe

Cereal supply and demand balances for sub-Saharan African countries as of March 2020 - Central Africa
22
CAMEROONCEREAL SUPPLY/DEMAND BALANCE FOR THE 2019 MARKETING YEAR (January/December)
Wheat RiceCoarsegrains
Totalcereals
2019 Domestic Availability (000 tonnes) - 247 2 944 3 1912018 production - 247 2 944 3 191Estimated stock drawdown - - - -
2019 Utilization (000 tonnes) 750 797 2 984 4 531Food use 696 667 1 938 3 302Non-food use 4 75 687 766Exports 50 5 100 155Estimated stock build-up - 50 259 309
2019 Import Requirements (000 tonnes) 750 550 40 1 340
Per Caput Consumption (kg/year) 28 27 77 131
2019 Comparison with the previous year and the recent average
Production (000 tonnes)Previous year's production - 241 3 187 3 428Previous five years' average production - 176 2 981 3 1582018 production compared to average (%) - 140 99 101
Import Requirements (000 tonnes)Previous year's imports 750 350 40 1 140Previous five years' average imports 585 462 41 1 0882019 Import requirements compared to average (%) 128 119 98 123
Additional Information
Population mid-2018 (000s): 25 216
Crop Calendar (*major foodcrop)
Maize, Millet, Sorghum, Cassava (North/Unimodal)Sorghum, Millet (Central/Main)Maize, Rice (Central/Main)Maize (Central/Secondary)
Lean period (north)Lean period (south)
SowingGrowingHarvestingNote: When the harvest of early-planted crops of one season begins before the end of the planting of late-crops of the same season, the growing period is omitted.
J F M A M J J A S O N D

23Cereal supply and demand balances for sub-Saharan African countries as of March 2020 - Central Africa
CENTRAL AFRICAN REPUBLICCEREAL SUPPLY/DEMAND BALANCE FOR THE 2019 MARKETING YEAR (January/December)
Wheat RiceCoarsegrains
Totalcereals
2019 Domestic Availability (000 tonnes) - 7 144 1522018 production - 7 144 152Estimated stock drawdown - - - -
2019 Utilization (000 tonnes) 43 20 185 248Food use 40 19 159 218Non-food use 3 1 26 30Exports - - - -Estimated stock build-up - - - -
2019 Import Requirements (000 tonnes) 43 13 40 96
Per Caput Consumption (kg/year) 9 4 34 47
2019 Comparison with the previous year and the recent average
Production (000 tonnes)Previous year's production - 7 133 140Previous five years' average production - 7 134 1412018 production compared to average (%) - 105 108 108
Import Requirements (000 tonnes)Previous year's imports 43 7 40 90Previous five years' average imports 43 15 40 982019 Import requirements compared to average (%) 100 87 100 98
Additional Information
Population mid-2018 (000s): 4 666
Crop Calendar (*major foodcrop)
Cassava*Maize* (South)Maize* (Centre)Millet & Sorghum* (North)Groundnuts (South/Centre)Groundnuts (North)Rice (South)
Lean period
SowingGrowingHarvestingNote: When the harvest of early-planted crops of one season begins before the end of the planting of late-crops of the same season, the growing period is omitted.
J F M A M J J A S O N D

Cereal supply and demand balances for sub-Saharan African countries as of March 2020 - Central Africa
24
CONGOCEREAL SUPPLY/DEMAND BALANCE FOR THE 2019 MARKETING YEAR (January/December)
Wheat RiceCoarsegrains
Totalcereals
2019 Domestic Availability (000 tonnes) - 34 29 622018 production - 1 29 29Estimated stock drawdown - 33 - 33
2019 Utilization (000 tonnes) 225 144 30 398Food use 221 137 26 384Non-food use 4 7 3 14Exports - - - -Estimated stock build-up - - - -
2019 Import Requirements (000 tonnes) 225 110 1 336
Per Caput Consumption (kg/year) 42 26 5 73
2019 Comparison with the previous year and the recent average
Production (000 tonnes)Previous year's production - 1 29 29Previous five years' average production - 1 28 282018 production compared to average (%) - 100 103 103
Import Requirements (000 tonnes)Previous year's imports 249 200 5 454Previous five years' average imports 216 166 5 3872019 Import requirements compared to average (%) 104 66 19 87
Additional Information
Population mid-2018 (000s): 5 244
Crop Calendar (*major foodcrop)
Cassava*Maize (Main)Maize (Second)Yams
SowingGrowingHarvestingNote: When the harvest of early-planted crops of one season begins before the end of the planting of late-crops of the same season, the growing period is omitted.
J F M A M J J A S O N D

25Cereal supply and demand balances for sub-Saharan African countries as of March 2020 - Central Africa
DEMOCRATIC REPUBLIC OF THE CONGOCEREAL SUPPLY/DEMAND BALANCE FOR THE 2019 MARKETING YEAR (January/December)
Wheat RiceCoarsegrains
Totalcereals
2019 Domestic Availability (000 tonnes) 8 203 1 215 1 4262018 production 8 192 1 215 1 415Estimated stock drawdown - 11 - 11
2019 Utilization (000 tonnes) 508 403 1 385 2 296Food use 507 343 1 209 2 059Non-food use 1 61 176 237Exports - - - -Estimated stock build-up - - - -
2019 Import Requirements (000 tonnes) 500 200 170 870
Per Caput Consumption (kg/year) 6 4 14 25
2019 Comparison with the previous year and the recent average
Production (000 tonnes)Previous year's production 8 192 1 217 1 418Previous five years' average production 8 192 1 226 1 4262018 production compared to average (%) 96 100 99 99
Import Requirements (000 tonnes)Previous year's imports 500 215 170 885Previous five years' average imports 470 177 156 8032019 Import requirements compared to average (%) 106 113 109 108
Additional Information
Population mid-2018 (000s): 84 068
Crop Calendar (*major foodcrop)
Cassava* (North)Cassava* (South)Maize* (Centre/main)Maize* (Centre/second)Maize* (North/main)Maize* (North/second)Maize* (South)Millet & SorghumRice (North)Rice (South)Yams
Lean period (north)Lean period (south)
SowingGrowingHarvestingNote: When the harvest of early-planted crops of one season begins before the end of the planting of late-crops of the same season, the growing period is omitted.
J F M A M J J A S O N D
Cereal supply and demand balances for sub-Saharan African countries as of March 2020 - Central Africa
26
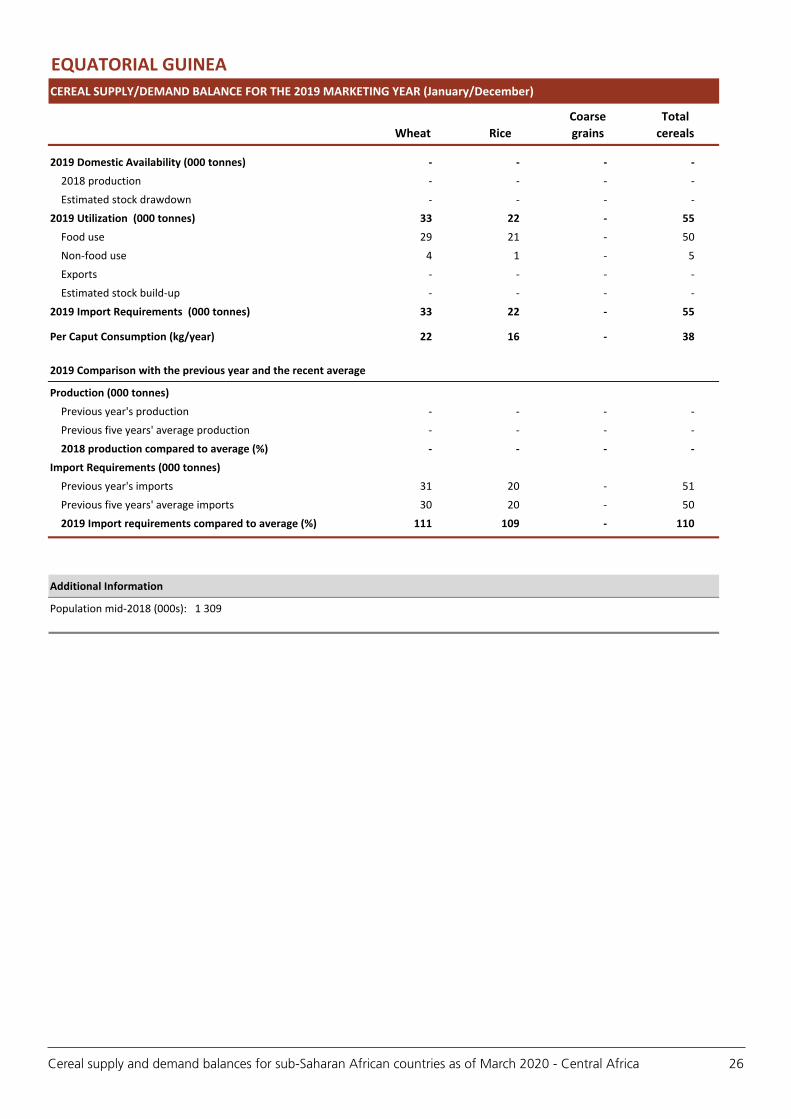
EQUATORIAL GUINEACEREAL SUPPLY/DEMAND BALANCE FOR THE 2019 MARKETING YEAR (January/December)
Wheat RiceCoarsegrains
Totalcereals
2019 Domestic Availability (000 tonnes) - - - -2018 production - - - -Estimated stock drawdown - - - -
2019 Utilization (000 tonnes) 33 22 - 55Food use 29 21 - 50Non-food use 4 1 - 5Exports - - - -Estimated stock build-up - - - -
2019 Import Requirements (000 tonnes) 33 22 - 55
Per Caput Consumption (kg/year) 22 16 - 38
2019 Comparison with the previous year and the recent average
Production (000 tonnes)Previous year's production - - - -Previous five years' average production - - - -2018 production compared to average (%) - - - -
Import Requirements (000 tonnes)Previous year's imports 31 20 - 51Previous five years' average imports 30 20 - 502019 Import requirements compared to average (%) 111 109 - 110
Additional Information
Population mid-2018 (000s): 1 309

27Cereal supply and demand balances for sub-Saharan African countries as of March 2020 - Central Africa
GABONCEREAL SUPPLY/DEMAND BALANCE FOR THE 2019 MARKETING YEAR (January/December)
Wheat RiceCoarsegrains
Totalcereals
2019 Domestic Availability (000 tonnes) - 10 43 532018 production - - 43 43Estimated stock drawdown - 10 - 10
2019 Utilization (000 tonnes) 100 65 49 214Food use 95 63 29 187Non-food use 5 2 20 27Exports - - - -Estimated stock build-up - - - -
2019 Import Requirements (000 tonnes) 100 55 6 161
Per Caput Consumption (kg/year) 45 30 14 88
2019 Comparison with the previous year and the recent average
Production (000 tonnes)Previous year's production - - 44 44Previous five years' average production - - 43 432018 production compared to average (%) - - 99 99
Import Requirements (000 tonnes)Previous year's imports 100 75 6 181Previous five years' average imports 98 66 6 1702019 Import requirements compared to average (%) 102 83 100 95
Additional Information
Population mid-2018 (000s): 2 119
Crop Calendar (*major foodcrop)
Cassava*Maize (main)Maize (secondary)Yams*
SowingGrowingHarvestingNote: When the harvest of early-planted crops of one season begins before the end of the planting of late-crops of the same season, the growing period is omitted.
J F M A M J J A S O N D
Cereal supply and demand balances for sub-Saharan African countries as of March 2020 - Central Africa
28
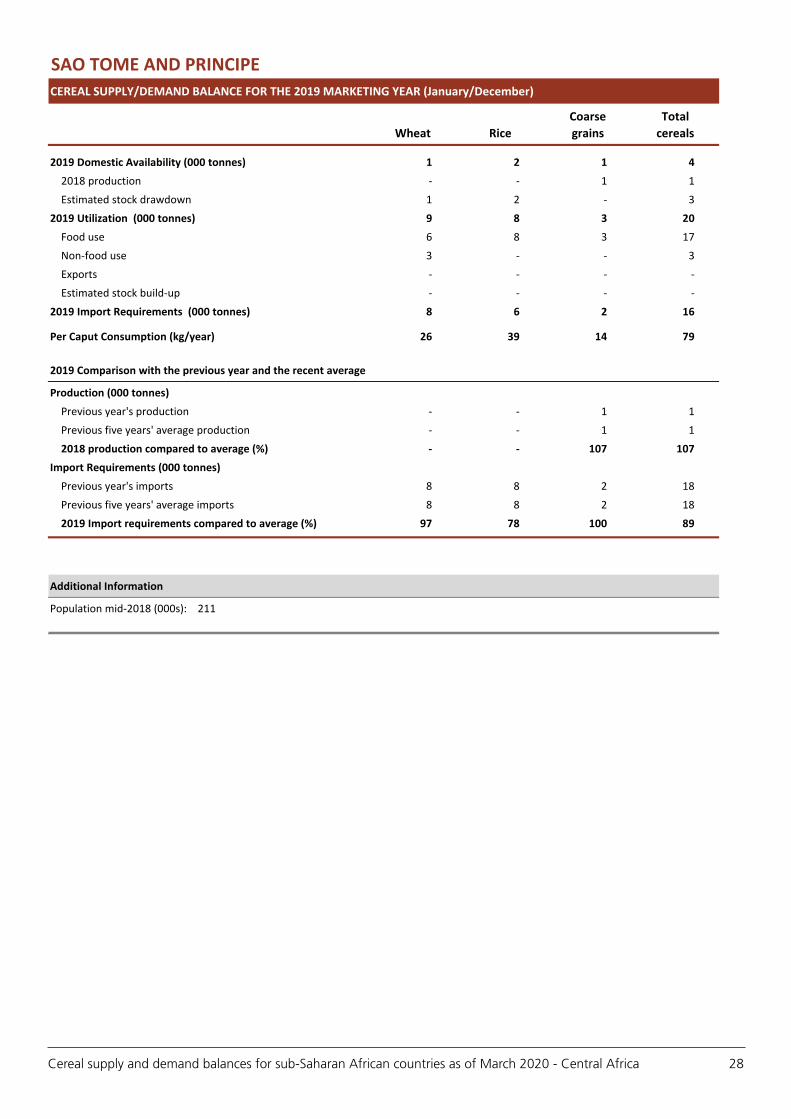
SAO TOME AND PRINCIPECEREAL SUPPLY/DEMAND BALANCE FOR THE 2019 MARKETING YEAR (January/December)
Wheat RiceCoarsegrains
Totalcereals
2019 Domestic Availability (000 tonnes) 1 2 1 42018 production - - 1 1Estimated stock drawdown 1 2 - 3
2019 Utilization (000 tonnes) 9 8 3 20Food use 6 8 3 17Non-food use 3 - - 3Exports - - - -Estimated stock build-up - - - -
2019 Import Requirements (000 tonnes) 8 6 2 16
Per Caput Consumption (kg/year) 26 39 14 79
2019 Comparison with the previous year and the recent average
Production (000 tonnes)Previous year's production - - 1 1Previous five years' average production - - 1 12018 production compared to average (%) - - 107 107
Import Requirements (000 tonnes)Previous year's imports 8 8 2 18Previous five years' average imports 8 8 2 182019 Import requirements compared to average (%) 97 78 100 89
Additional Information
Population mid-2018 (000s): 211

29Cereal supply and demand balances for sub-Saharan African countries as of March 2020 - East Africa
East Africa
Countries
¾ Burundi
¾ Comoros
¾ Djibouti
¾ Eritrea
¾ Ethiopia
¾ Kenya
¾ Rwanda
¾ Seychelles
¾ Somalia
¾ South Sudan
¾ Sudan
¾ Uganda
¾ United Republic of Tanzania

Cereal supply and demand balances for sub-Saharan African countries as of March 2020 - East Africa
30
BURUNDICEREAL SUPPLY/DEMAND BALANCE FOR THE 2019 MARKETING YEAR (January/December)
Wheat RiceCoarsegrains
Totalcereals
2019 Domestic Availability (000 tonnes) - 29 293 3172018 production - 23 293 317Estimated stock drawdown - 6 - -
2019 Utilization (000 tonnes) 56 43 403 497Food use 52 39 315 407Non-food use 4 4 63 71Exports - - - -Estimated stock build-up - - 25 19
2019 Import Requirements (000 tonnes) 56 14 110 180
Per Caput Consumption (kg/year) 5 4 28 36
2019 Comparison with the previous year and the recent average
Production (000 tonnes)Previous year's production - 23 213 236Previous five years' average production 6 44 213 2592018 production compared to average (%) - 53 138 122
Import Requirements (000 tonnes)Previous year's imports 56 5 125 186Previous five years' average imports 50 12 103 1652019 Import requirements compared to average (%) 111 123 107 109
Additional Information
Population mid-2018 (000s): 11 175
Crop Calendar (*major foodcrop)
Beans* (A season)Beans* (B season)Maize & Sorghum (A season)Maize & Sorghum (B season)
Lean periods
SowingGrowingHarvesting
J F M A M J J A S O N D

31Cereal supply and demand balances for sub-Saharan African countries as of March 2020 - East Africa
COMOROSCEREAL SUPPLY/DEMAND BALANCE FOR THE 2019 MARKETING YEAR (January/December)
Wheat RiceCoarsegrains
Totalcereals
2019 Domestic Availability (000 tonnes) - 14 6 202018 production - 11 6 17Estimated stock drawdown - 3 - 3
2019 Utilization (000 tonnes) 11 61 6 78Food use 11 60 4 75Non-food use - 1 2 3Exports - - - -Estimated stock build-up - - - -
2019 Import Requirements (000 tonnes) 11 47 - 58
Per Caput Consumption (kg/year) 13 73 5 91
2019 Comparison with the previous year and the recent average
Production (000 tonnes)Previous year's production - 11 6 17Previous five years' average production - 11 6 182018 production compared to average (%) - 100 97 99
Import Requirements (000 tonnes)Previous year's imports 11 50 - 61Previous five years' average imports 10 44 - 542019 Import requirements compared to average (%) 108 107 - 107
Additional Information
Population mid-2018 (000s): 832

Cereal supply and demand balances for sub-Saharan African countries as of March 2020 - East Africa
32
DJIBOUTICEREAL SUPPLY/DEMAND BALANCE FOR THE 2019 MARKETING YEAR (January/December)
Wheat RiceCoarsegrains
Totalcereals
2019 Domestic Availability (000 tonnes) - - - -2018 production - - - -Estimated stock drawdown - - - -
2019 Utilization (000 tonnes) 59 25 2 86Food use 59 24 - 83Non-food use - 1 2 3Exports - - - -Estimated stock build-up - - - -
2019 Import Requirements (000 tonnes) 59 25 2 86
Per Caput Consumption (kg/year) 62 25 - 87
2019 Comparison with the previous year and the recent average
Production (000 tonnes)Previous year's production - - - -Previous five years' average production - - - -2018 production compared to average (%) - - - -
Import Requirements (000 tonnes)Previous year's imports 59 24 2 85Previous five years' average imports 57 22 2 822019 Import requirements compared to average (%) 103 113 85 105
Additional Information
Population mid-2018 (000s): 959

33Cereal supply and demand balances for sub-Saharan African countries as of March 2020 - East Africa
ERITREACEREAL SUPPLY/DEMAND BALANCE FOR THE 2019 MARKETING YEAR (January/December)
Wheat RiceCoarsegrains
Totalcereals
2019 Domestic Availability (000 tonnes) 30 - 166 1962018 production 30 - 166 196Estimated stock drawdown - - - -
2019 Utilization (000 tonnes) 380 12 252 644Food use 377 12 197 586Non-food use 3 - 55 58Exports - - - -Estimated stock build-up - - - -
2019 Import Requirements (000 tonnes) 350 12 86 448
Per Caput Consumption (kg/year) 109 4 57 170
2019 Comparison with the previous year and the recent average
Production (000 tonnes)Previous year's production 30 - 171 201Previous five years' average production 30 - 167 1972018 production compared to average (%) 99 - 99 99
Import Requirements (000 tonnes)Previous year's imports 350 12 86 448Previous five years' average imports 338 11 86 4352019 Import requirements compared to average (%) 104 110 100 103
Additional Information
Population mid-2018 (000s): 3 453
Crop Calendar (*major foodcrop)
BarleyMaizeMillet & Sorghum*Wheat*
Lean period
SowingGrowingHarvesting
J F M A M J J A S O N D

Cereal supply and demand balances for sub-Saharan African countries as of March 2020 - East Africa
34
ETHIOPIACEREAL SUPPLY/DEMAND BALANCE FOR THE 2019 MARKETING YEAR (January/December)
Wheat RiceCoarsegrains
Totalcereals
2019 Domestic Availability (000 tonnes) 4 988 152 22 754 27 7032018 production 4 838 112 22 754 27 703Estimated stock drawdown 150 40 - -
2019 Utilization (000 tonnes) 6 338 666 22 754 29 567Food use 5 188 599 14 963 20 749Non-food use 1 150 67 5 626 6 843Exports - - 1 295 1 295Estimated stock build-up - - 870 680
2019 Import Requirements (000 tonnes) 1 350 514 - 1 864
Per Caput Consumption (kg/year) 48 6 137 190
2019 Comparison with the previous year and the recent average
Production (000 tonnes)Previous year's production 4 643 104 21 985 26 732Previous five years' average production 4 398 87 20 040 24 5252018 production compared to average (%) 110 129 114 113
Import Requirements (000 tonnes)Previous year's imports 1 350 597 - 1 947Previous five years' average imports 1 179 349 104 1 5912019 Import requirements compared to average (%) 114 147 - 117
Additional Information
Population mid-2018 (000s): 109 224
Crop Calendar (*major foodcrop)
All Cereals (Belg)Barley, Teff & Wheat * (Meher)Maize & Sorghum* (Meher)Millet (Meher)Oats (Meher)
Lean period
SowingGrowingHarvesting
J F M A M J J A S O N D
35Cereal supply and demand balances for sub-Saharan African countries as of March 2020 - East Africa
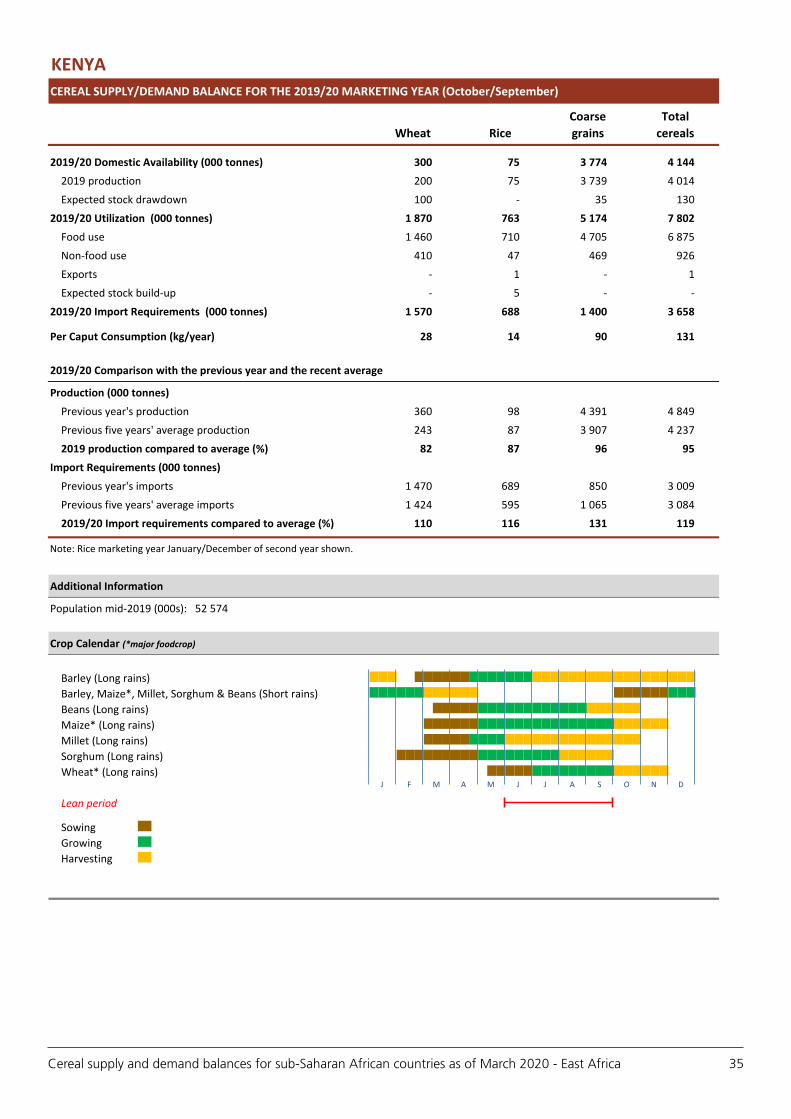
KENYACEREAL SUPPLY/DEMAND BALANCE FOR THE 2019/20 MARKETING YEAR (October/September)
Wheat RiceCoarsegrains
Totalcereals
2019/20 Domestic Availability (000 tonnes) 300 75 3 774 4 1442019 production 200 75 3 739 4 014Expected stock drawdown 100 - 35 130
2019/20 Utilization (000 tonnes) 1 870 763 5 174 7 802Food use 1 460 710 4 705 6 875Non-food use 410 47 469 926Exports - 1 - 1Expected stock build-up - 5 - -
2019/20 Import Requirements (000 tonnes) 1 570 688 1 400 3 658
Per Caput Consumption (kg/year) 28 14 90 131
2019/20 Comparison with the previous year and the recent average
Production (000 tonnes)Previous year's production 360 98 4 391 4 849Previous five years' average production 243 87 3 907 4 2372019 production compared to average (%) 82 87 96 95
Import Requirements (000 tonnes)Previous year's imports 1 470 689 850 3 009Previous five years' average imports 1 424 595 1 065 3 0842019/20 Import requirements compared to average (%) 110 116 131 119
Note: Rice marketing year January/December of second year shown.
Additional Information
Population mid-2019 (000s): 52 574
Crop Calendar (*major foodcrop)
Barley (Long rains)Barley, Maize*, Millet, Sorghum & Beans (Short rains)Beans (Long rains)Maize* (Long rains)Millet (Long rains)Sorghum (Long rains)Wheat* (Long rains)
Lean period
SowingGrowingHarvesting
J F M A M J J A S O N D
Cereal supply and demand balances for sub-Saharan African countries as of March 2020 - East Africa
36
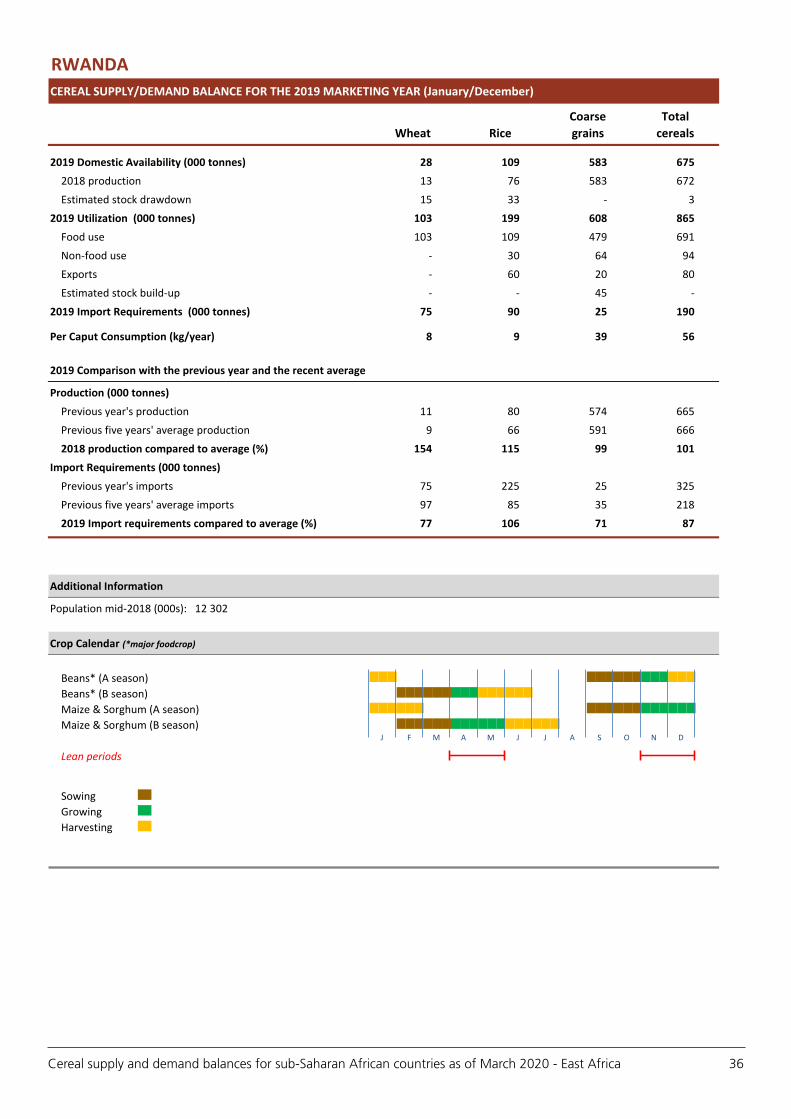
RWANDACEREAL SUPPLY/DEMAND BALANCE FOR THE 2019 MARKETING YEAR (January/December)
Wheat RiceCoarsegrains
Totalcereals
2019 Domestic Availability (000 tonnes) 28 109 583 6752018 production 13 76 583 672Estimated stock drawdown 15 33 - 3
2019 Utilization (000 tonnes) 103 199 608 865Food use 103 109 479 691Non-food use - 30 64 94Exports - 60 20 80Estimated stock build-up - - 45 -
2019 Import Requirements (000 tonnes) 75 90 25 190
Per Caput Consumption (kg/year) 8 9 39 56
2019 Comparison with the previous year and the recent average
Production (000 tonnes)Previous year's production 11 80 574 665Previous five years' average production 9 66 591 6662018 production compared to average (%) 154 115 99 101
Import Requirements (000 tonnes)Previous year's imports 75 225 25 325Previous five years' average imports 97 85 35 2182019 Import requirements compared to average (%) 77 106 71 87
Additional Information
Population mid-2018 (000s): 12 302
Crop Calendar (*major foodcrop)
Beans* (A season)Beans* (B season)Maize & Sorghum (A season)Maize & Sorghum (B season)
Lean periods
SowingGrowingHarvesting
J F M A M J J A S O N D

37Cereal supply and demand balances for sub-Saharan African countries as of March 2020 - East Africa
SEYCHELLESCEREAL SUPPLY/DEMAND BALANCE FOR THE 2019 MARKETING YEAR (January/December)
Wheat RiceCoarsegrains
Totalcereals
2019 Domestic Availability (000 tonnes) - - - -2018 production - - - -Estimated stock drawdown - - - -
2019 Utilization (000 tonnes) 2 8 6 16Food use 2 7 1 10Non-food use - - 5 5Exports - - - -Estimated stock build-up - 1 - 1
2019 Import Requirements (000 tonnes) 2 8 6 16
Per Caput Consumption (kg/year) 21 70 10 101
2019 Comparison with the previous year and the recent average
Production (000 tonnes)Previous year's production - - - -Previous five years' average production - - - -2018 production compared to average (%) - - - -
Import Requirements (000 tonnes)Previous year's imports 2 6 6 14Previous five years' average imports 2 6 9 172019 Import requirements compared to average (%) 100 127 69 94
Additional Information
Population mid-2018 (000s): 97

Cereal supply and demand balances for sub-Saharan African countries as of March 2020 - East Africa
38
SOMALIACEREAL SUPPLY/DEMAND BALANCE FOR THE 2019/20 MARKETING YEAR (August/July)
Wheat RiceCoarsegrains
Totalcereals
2019/20 Domestic Availability (000 tonnes) - 51 193 2452019 production - 1 186 188Expected stock drawdown - 50 7 57
2019/20 Utilization (000 tonnes) 210 401 498 1 110Food use 207 351 470 1 029Non-food use 3 50 28 81Exports - - - -Expected stock build-up - - - -
2019/20 Import Requirements (000 tonnes) 210 350 305 865
Per Caput Consumption (kg/year) 13 23 31 67
2019/20 Comparison with the previous year and the recent average
Production (000 tonnes)Previous year's production - 1 234 236Previous five years' average production - 1 208 2092019 production compared to average (%) - 100 90 90
Import Requirements (000 tonnes)Previous year's imports 210 365 260 835Previous five years' average imports 200 327 259 7872019/20 Import requirements compared to average (%) 105 107 118 110
Note: Rice marketing year January/December of second year shown.
Additional Information
Population mid-2019 (000s): 15 443
Crop Calendar (*major foodcrop)
Maize & Sorghum* (Deyr)Maize & Sorghum* (Gu)
Lean periods
SowingGrowingHarvesting
J F M A M J J A S O N D

39Cereal supply and demand balances for sub-Saharan African countries as of March 2020 - East Africa
SOUTH SUDANCEREAL SUPPLY/DEMAND BALANCE FOR THE 2019/20 MARKETING YEAR (November/October)
Wheat RiceCoarsegrains
Totalcereals
2019/20 Domestic Availability (000 tonnes) - - 818 8182019 production - - 818 818Expected stock drawdown - - - -
2019/20 Utilization (000 tonnes) 450 - 1 048 1 498Food use 450 - 1 018 1 468Non-food use - - 30 30Exports - - - -Expected stock build-up - - - -
2019/20 Import Requirements (000 tonnes) 450 - 230 680
Per Caput Consumption (kg/year) 41 - 92 133
2019/20 Comparison with the previous year and the recent average
Production (000 tonnes)Previous year's production - - 745 745Previous five years' average production - - 854 8542019 production compared to average (%) - - 96 96
Import Requirements (000 tonnes)Previous year's imports 450 - 230 680Previous five years' average imports 436 - 161 5972019/20 Import requirements compared to average (%) 103 - 143 114
Note: Rice marketing year January/December of second year shown.
Additional Information
Population mid-2019 (000s): 11 062
Crop Calendar (*major foodcrop)
Maize, Millet, Sorghum* (South/main)Maize, Millet, Sorghum* (South/second)Maize (Unimodal)Millet & Sorghum (Unimodal)
Lean period
SowingGrowingHarvesting
J F M A M J J A S O N D

Cereal supply and demand balances for sub-Saharan African countries as of March 2020 - East Africa
40
SUDANCEREAL SUPPLY/DEMAND BALANCE FOR THE 2019/20 MARKETING YEAR (November/October)
Wheat RiceCoarsegrains
Totalcereals
2019/20 Domestic Availability (000 tonnes) 1 077 30 5 883 6 9902019 production 727 30 5 183 5 940Expected stock drawdown 350 - 700 1 050
2019/20 Utilization (000 tonnes) 2 897 110 6 223 9 230Food use 2 837 109 4 701 7 647Non-food use 60 1 1 372 1 433Exports - - 150 150Expected stock build-up - - - -
2019/20 Import Requirements (000 tonnes) 1 820 80 340 2 240
Per Caput Consumption (kg/year) 66 3 110 179
2019/20 Comparison with the previous year and the recent average
Production (000 tonnes)Previous year's production 700 30 8 127 8 857Previous five years' average production 586 30 6 341 6 9562019 production compared to average (%) 124 101 82 85
Import Requirements (000 tonnes)Previous year's imports 1 920 75 240 2 235Previous five years' average imports 2 169 64 348 2 5812019/20 Import requirements compared to average (%) 84 125 98 87
Note: Rice marketing year January/December of second year shown.
Additional Information
Population mid-2019 (000s): 42 813
Crop Calendar (*major foodcrop)
Millet & Sorghum*Wheat*
Lean period
SowingGrowingHarvesting
J F M A M J J A S O N D

41Cereal supply and demand balances for sub-Saharan African countries as of March 2020 - East Africa
UGANDACEREAL SUPPLY/DEMAND BALANCE FOR THE 2019 MARKETING YEAR (January/December)
Wheat RiceCoarsegrains
Totalcereals
2019 Domestic Availability (000 tonnes) 23 176 3 274 3 4732018 production 23 159 3 264 3 446Estimated stock drawdown - 17 10 27
2019 Utilization (000 tonnes) 383 326 3 282 3 991Food use 381 228 2 492 3 101Non-food use 2 44 710 756Exports - 55 80 135Estimated stock build-up - - - -
2019 Import Requirements (000 tonnes) 360 150 8 518
Per Caput Consumption (kg/year) 9 5 58 73
2019 Comparison with the previous year and the recent average
Production (000 tonnes)Previous year's production 22 157 3 388 3 567Previous five years' average production 22 152 3 269 3 4432018 production compared to average (%) 106 105 100 100
Import Requirements (000 tonnes)Previous year's imports 360 193 8 561Previous five years' average imports 328 148 11 4862019 Import requirements compared to average (%) 110 102 74 107
Additional Information
Population mid-2018 (000s): 42 729
Crop Calendar (*major foodcrop)
Beans (South/main)Beans (South/second)Cassava* (North)Maize & Millet* (South/second)Maize* (North)Maize* (South/main)Millet (North)Millet (South/main)Sweet Potato* (North)
Lean periods
SowingGrowingHarvesting
J F M A M J J A S O N D

Cereal supply and demand balances for sub-Saharan African countries as of March 2020 - East Africa
42
UNITED REPUBLIC OF TANZANIACEREAL SUPPLY/DEMAND BALANCE FOR THE 2019/20 MARKETING YEAR (June/May)
Wheat RiceCoarsegrains
Totalcereals
2019/20 Domestic Availability (000 tonnes) 183 2 099 7 401 9 6832019 production 63 2 009 6 946 9 018Expected stock drawdown 120 90 455 665
2019/20 Utilization (000 tonnes) 893 2 359 7 416 10 668Food use 847 1 789 5 199 7 835Non-food use 16 360 1 917 2 293Exports 30 210 300 540Expected stock build-up - - - -
2019/20 Import Requirements (000 tonnes) 710 260 15 985
Per Caput Consumption (kg/year) 15 31 90 135
2019/20 Comparison with the previous year and the recent average
Production (000 tonnes)Previous year's production 57 2 220 7 273 9 550Previous five years' average production 84 1 936 7 423 9 4432019 production compared to average (%) 75 104 94 95
Import Requirements (000 tonnes)Previous year's imports 700 250 15 965Previous five years' average imports 782 215 16 1 0142019/20 Import requirements compared to average (%) 91 121 91 97
Note: Rice marketing year January/December of second year shown.
Additional Information
Population mid-2019 (000s): 58 005
Crop Calendar (*major foodcrop)
Maize* (Vuli/Bimodal)Maize, Sorghum & Millet* (Masika/Bimodal)Maize & Sorghum* (Msimu/Unimodal)Rice* (Msimu/Unimodal)
Lean period
SowingGrowingHarvesting
J F M A M J J A S O N D

43Cereal supply and demand balances for sub-Saharan African countries as of March 2020 - Southern Africa
Sou
thern
Africa
Countries
¾ Angola
¾ Botswana
¾ Eswatini
¾ Lesotho
¾ Madagascar
¾ Malawi
¾ Mauritius
¾ Mozambique
¾ Namibia
¾ South Africa
¾ Zambia
¾ Zimbabwe

Cereal supply and demand balances for sub-Saharan African countries as of March 2020 - Southern Africa
44
ANGOLACEREAL SUPPLY/DEMAND BALANCE FOR THE 2019/20 MARKETING YEAR (April/March)
Wheat RiceCoarsegrains
Totalcereals
2019/20 Domestic Availability (000 tonnes) 55 43 2 365 2 4632019 production 5 30 2 085 2 120Expected stock drawdown 50 13 280 343
2019/20 Utilization (000 tonnes) 755 488 2 565 3 808Food use 740 470 1 399 2 609Non-food use 15 18 1 116 1 149Exports - - 50 50Expected stock build-up - - - -
2019/20 Import Requirements (000 tonnes) 700 445 200 1 345
Per Caput Consumption (kg/year) 23 15 44 82
2019/20 Comparison with the previous year and the recent average
Production (000 tonnes)Previous year's production 4 45 2 455 2 504Previous five years' average production 4 37 2 280 2 3212019 production compared to average (%) 132 81 91 91
Import Requirements (000 tonnes)Previous year's imports 868 480 214 1 562Previous five years' average imports 745 470 253 1 4692019/20 Import requirements compared to average (%) 94 95 79 92
Note: Rice marketing year January/December of second year shown.
Additional Information
Population mid-2019 (000s): 31 825
Crop Calendar (*major foodcrop)
Maize*MilletPotatoesRiceSorghumWheat
Lean period
SowingGrowingHarvesting
J F M A M J J A S O N D

45Cereal supply and demand balances for sub-Saharan African countries as of March 2020 - Southern Africa
BOTSWANACEREAL SUPPLY/DEMAND BALANCE FOR THE 2019/20 MARKETING YEAR (April/March)
Wheat RiceCoarsegrains
Totalcereals
2019/20 Domestic Availability (000 tonnes) 1 - 7 82019 production 1 - 7 8Expected stock drawdown - - - -
2019/20 Utilization (000 tonnes) 116 25 297 438Food use 112 25 233 369Non-food use - - 51 52Exports 1 - 5 6Expected stock build-up 3 - 8 11
2019/20 Import Requirements (000 tonnes) 115 25 290 430
Per Caput Consumption (kg/year) 49 11 101 160
2019/20 Comparison with the previous year and the recent average
Production (000 tonnes)Previous year's production 1 - 66 67Previous five years' average production 1 - 44 452019 production compared to average (%) 83 - 16 18
Import Requirements (000 tonnes)Previous year's imports 104 22 239 365Previous five years' average imports 112 23 222 3582019/20 Import requirements compared to average (%) 102 107 131 120
Note: Rice marketing year January/December of second year shown.
Additional Information
Population mid-2019 (000s): 2 304
Crop Calendar (*major foodcrop)
Maize*MilletSorghum*Wheat
Lean period
SowingGrowingHarvesting
J F M A M J J A S O N D

Cereal supply and demand balances for sub-Saharan African countries as of March 2020 - Southern Africa
46
ESWATINICEREAL SUPPLY/DEMAND BALANCE FOR THE 2019/20 MARKETING YEAR (May/April)
Wheat RiceCoarsegrains
Totalcereals
2019/20 Domestic Availability (000 tonnes) - 1 95 962019 production - 1 95 96Expected stock drawdown - 1 - -
2019/20 Utilization (000 tonnes) 49 38 231 317Food use 44 35 119 197Non-food use 1 4 100 105Exports - - - -Expected stock build-up 4 - 12 16
2019/20 Import Requirements (000 tonnes) 49 37 136 222
Per Caput Consumption (kg/year) 38 30 104 172
2019/20 Comparison with the previous year and the recent average
Production (000 tonnes)Previous year's production - 1 114 114Previous five years' average production - 1 87 872019 production compared to average (%) - 75 110 110
Import Requirements (000 tonnes)Previous year's imports 43 39 121 203Previous five years' average imports 43 34 104 1802019/20 Import requirements compared to average (%) 113 110 131 123
Note: Rice marketing year January/December of second year shown.
Additional Information
Population mid-2019 (000s): 1 148
Crop Calendar (*major foodcrop)
Maize*SorghumWheat
Lean period
SowingGrowingHarvesting
J F M A M J J A S O N D

47Cereal supply and demand balances for sub-Saharan African countries as of March 2020 - Southern Africa
LESOTHOCEREAL SUPPLY/DEMAND BALANCE FOR THE 2019/20 MARKETING YEAR (April/March)
Wheat RiceCoarsegrains
Totalcereals
2019/20 Domestic Availability (000 tonnes) 11 - 66 772019 production 2 - 36 38Expected stock drawdown 9 - 30 39
2019/20 Utilization (000 tonnes) 91 31 137 259Food use 89 31 127 248Non-food use 2 - 10 12Exports - - - -Expected stock build-up - - - -
2019/20 Import Requirements (000 tonnes) 80 31 72 183
Per Caput Consumption (kg/year) 42 15 60 117
2019/20 Comparison with the previous year and the recent average
Production (000 tonnes)Previous year's production 9 - 150 159Previous five years' average production 8 - 109 1172019 production compared to average (%) 22 - 33 32
Import Requirements (000 tonnes)Previous year's imports 73 30 62 165Previous five years' average imports 84 28 92 2042019/20 Import requirements compared to average (%) 95 111 78 90
Note: Rice marketing year January/December of second year shown.
Additional Information
Population mid-2019 (000s): 2 125
Crop Calendar (*major foodcrop)
Maize*SorghumWheat
Lean period
SowingGrowingHarvesting
J F M A M J J A S O N D

Cereal supply and demand balances for sub-Saharan African countries as of March 2020 - Southern Africa
48
MADAGASCARCEREAL SUPPLY/DEMAND BALANCE FOR THE 2019/20 MARKETING YEAR (April/March)
Wheat RiceCoarsegrains
Totalcereals
2019/20 Domestic Availability (000 tonnes) 5 2 620 221 2 8462019 production 5 2 620 221 2 846Expected stock drawdown - - - -
2019/20 Utilization (000 tonnes) 356 3 070 241 3 667Food use 351 2 677 215 3 243Non-food use - 323 26 349Exports - - - -Expected stock build-up 5 70 - 75
2019/20 Import Requirements (000 tonnes) 351 450 20 821
Per Caput Consumption (kg/year) 13 99 8 120
2019/20 Comparison with the previous year and the recent average
Production (000 tonnes)Previous year's production 5 2 224 216 2 445Previous five years' average production 5 2 403 302 2 7112019 production compared to average (%) 100 109 73 105
Import Requirements (000 tonnes)Previous year's imports 336 436 9 781Previous five years' average imports 265 390 11 6662019/20 Import requirements compared to average (%) 132 115 188 123
Note: Rice marketing year January/December of second year shown.
Additional Information
Population mid-2019 (000s): 26 969
Crop Calendar (*major foodcrop)
Maize*PotatoesRice*SorghumWheat
Lean period
SowingGrowingHarvesting
J F M A M J J A S O N D
49Cereal supply and demand balances for sub-Saharan African countries as of March 2020 - Southern Africa
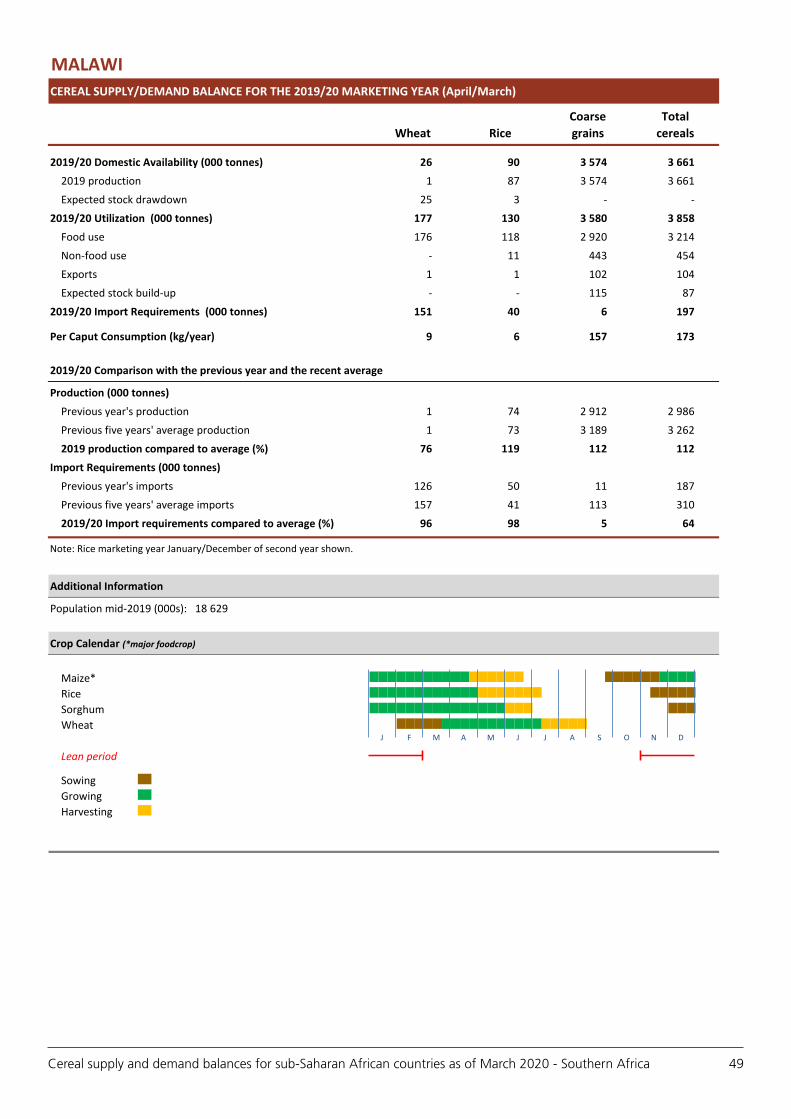
MALAWICEREAL SUPPLY/DEMAND BALANCE FOR THE 2019/20 MARKETING YEAR (April/March)
Wheat RiceCoarsegrains
Totalcereals
2019/20 Domestic Availability (000 tonnes) 26 90 3 574 3 6612019 production 1 87 3 574 3 661Expected stock drawdown 25 3 - -
2019/20 Utilization (000 tonnes) 177 130 3 580 3 858Food use 176 118 2 920 3 214Non-food use - 11 443 454Exports 1 1 102 104Expected stock build-up - - 115 87
2019/20 Import Requirements (000 tonnes) 151 40 6 197
Per Caput Consumption (kg/year) 9 6 157 173
2019/20 Comparison with the previous year and the recent average
Production (000 tonnes)Previous year's production 1 74 2 912 2 986Previous five years' average production 1 73 3 189 3 2622019 production compared to average (%) 76 119 112 112
Import Requirements (000 tonnes)Previous year's imports 126 50 11 187Previous five years' average imports 157 41 113 3102019/20 Import requirements compared to average (%) 96 98 5 64
Note: Rice marketing year January/December of second year shown.
Additional Information
Population mid-2019 (000s): 18 629
Crop Calendar (*major foodcrop)
Maize*RiceSorghumWheat
Lean period
SowingGrowingHarvesting
J F M A M J J A S O N D

Cereal supply and demand balances for sub-Saharan African countries as of March 2020 - Southern Africa
50
MAURITIUSCEREAL SUPPLY/DEMAND BALANCE FOR THE 2019 MARKETING YEAR (January/December)
Wheat RiceCoarsegrains
Totalcereals
2019 Domestic Availability (000 tonnes) - - - -2018 production - - - -Estimated stock drawdown - - - -
2019 Utilization (000 tonnes) 165 61 90 316Food use 119 57 3 179Non-food use 6 1 86 94Exports 40 - 1 41Estimated stock build-up - 2 - 2
2019 Import Requirements (000 tonnes) 165 61 90 316
Per Caput Consumption (kg/year) 94 45 2 142
2019 Comparison with the previous year and the recent average
Production (000 tonnes)Previous year's production - - - -Previous five years' average production - 1 - 12018 production compared to average (%) - - - -
Import Requirements (000 tonnes)Previous year's imports 154 54 90 298Previous five years' average imports 157 56 90 3032019 Import requirements compared to average (%) 105 108 100 104
Additional Information
Population mid-2018 (000s): 1 267

51Cereal supply and demand balances for sub-Saharan African countries as of March 2020 - Southern Africa
MOZAMBIQUECEREAL SUPPLY/DEMAND BALANCE FOR THE 2019/20 MARKETING YEAR (April/March)
Wheat RiceCoarsegrains
Totalcereals
2019/20 Domestic Availability (000 tonnes) 81 293 2 623 2 9972019 production 11 233 2 478 2 722Expected stock drawdown 70 60 145 275
2019/20 Utilization (000 tonnes) 656 913 2 828 4 397Food use 646 853 2 013 3 512Non-food use 10 60 795 865Exports - - 20 20Expected stock build-up - - - -
2019/20 Import Requirements (000 tonnes) 575 620 205 1 400
Per Caput Consumption (kg/year) 21 28 66 116
2019/20 Comparison with the previous year and the recent average
Production (000 tonnes)Previous year's production 13 340 2 848 3 202Previous five years' average production 17 265 2 074 2 3562019 production compared to average (%) 64 88 119 116
Import Requirements (000 tonnes)Previous year's imports 698 522 149 1 369Previous five years' average imports 668 585 133 1 3862019/20 Import requirements compared to average (%) 86 106 154 101
Note: Rice marketing year January/December of second year shown.
Additional Information
Population mid-2019 (000s): 30 366
Crop Calendar (*major foodcrop)
Maize*SorghumWheat
Lean period
SowingGrowingHarvesting
J F M A M J J A S O N D

Cereal supply and demand balances for sub-Saharan African countries as of March 2020 - Southern Africa
52
NAMIBIACEREAL SUPPLY/DEMAND BALANCE FOR THE 2019/20 MARKETING YEAR (May/April)
Wheat RiceCoarsegrains
Totalcereals
2019/20 Domestic Availability (000 tonnes) 16 - 64 802019 production 6 - 54 60Expected stock drawdown 10 - 10 20
2019/20 Utilization (000 tonnes) 111 24 285 420Food use 107 24 200 331Non-food use 3 - 83 86Exports 1 - 2 3Expected stock build-up - - - -
2019/20 Import Requirements (000 tonnes) 95 24 221 340
Per Caput Consumption (kg/year) 43 10 80 133
2019/20 Comparison with the previous year and the recent average
Production (000 tonnes)Previous year's production 6 - 147 153Previous five years' average production 9 - 102 1112019 production compared to average (%) 69 - 53 54
Import Requirements (000 tonnes)Previous year's imports 96 19 110 225Previous five years' average imports 101 18 119 2382019/20 Import requirements compared to average (%) 94 136 186 143
Note: Rice marketing year January/December of second year shown.
Additional Information
Population mid-2019 (000s): 2 495
Crop Calendar (*major foodcrop)
Maize*Millet* & SorghumWheat*
SowingGrowingHarvesting
J F M A M J J A S O N D

53Cereal supply and demand balances for sub-Saharan African countries as of March 2020 - Southern Africa
SOUTH AFRICACEREAL SUPPLY/DEMAND BALANCE FOR THE 2019/20 MARKETING YEAR (April/March)
Wheat RiceCoarsegrains
Totalcereals
2019/20 Domestic Availability (000 tonnes) 1 649 52 13 194 14 8942019 production 1 599 2 12 314 13 914Expected stock drawdown 50 50 880 980
2019/20 Utilization (000 tonnes) 3 399 908 13 875 18 181Food use 3 290 888 5 331 9 509Non-food use 29 20 7 234 7 282Exports 80 - 1 310 1 390Expected stock build-up - - - -
2019/20 Import Requirements (000 tonnes) 1 750 856 681 3 287
Per Caput Consumption (kg/year) 56 15 91 162
2019/20 Comparison with the previous year and the recent average
Production (000 tonnes)Previous year's production 1 868 2 13 688 15 558Previous five years' average production 1 704 2 13 421 15 1272019 production compared to average (%) 94 100 92 92
Import Requirements (000 tonnes)Previous year's imports 1 367 957 349 2 673Previous five years' average imports 1 675 877 1 047 3 5992019/20 Import requirements compared to average (%) 104 98 65 91
Note: Rice marketing year January/December of second year shown.
Additional Information
Population mid-2019 (000s): 58 558
Crop Calendar (*major foodcrop)
BarleyMaize* (East)Maize* (West) & SorghumMilletSorghumSoybeanWheat*
Lean period
SowingGrowingHarvesting
J F M A M J J A S O N D

Cereal supply and demand balances for sub-Saharan African countries as of March 2020 - Southern Africa
54
ZAMBIACEREAL SUPPLY/DEMAND BALANCE FOR THE 2019/20 MARKETING YEAR (May/April)
Wheat RiceCoarsegrains
Totalcereals
2019/20 Domestic Availability (000 tonnes) 150 21 2 486 2 6572019 production 150 20 2 086 2 255Expected stock drawdown - 2 400 402
2019/20 Utilization (000 tonnes) 216 47 2 606 2 869Food use 200 43 2 206 2 449Non-food use 15 3 385 403Exports 1 1 15 17Expected stock build-up - - - -
2019/20 Import Requirements (000 tonnes) 66 26 120 212
Per Caput Consumption (kg/year) 11 2 124 137
2019/20 Comparison with the previous year and the recent average
Production (000 tonnes)Previous year's production 115 29 2 493 2 636Previous five years' average production 195 24 3 040 3 2592019 production compared to average (%) 77 81 69 69
Import Requirements (000 tonnes)Previous year's imports 41 26 5 72Previous five years' average imports 29 18 5 522019/20 Import requirements compared to average (%) 226 146 2 299 405
Note: Rice marketing year January/December of second year shown.
Additional Information
Population mid-2019 (000s): 17 861
Crop Calendar (*major foodcrop)
Maize*MilletSorghumWheat
Lean period
SowingGrowingHarvesting
J F M A M J J A S O N D

55Cereal supply and demand balances for sub-Saharan African countries as of March 2020 - Southern Africa
ZIMBABWECEREAL SUPPLY/DEMAND BALANCE FOR THE 2019/20 MARKETING YEAR (April/March)
Wheat RiceCoarsegrains
Totalcereals
2019/20 Domestic Availability (000 tonnes) 55 1 1 238 1 2942019 production 50 - 894 944Expected stock drawdown 5 1 344 350
2019/20 Utilization (000 tonnes) 206 161 1 840 2 207Food use 201 158 1 670 2 029Non-food use 5 3 169 177Exports - - 1 1Expected stock build-up - - - -
2019/20 Import Requirements (000 tonnes) 151 160 602 913
Per Caput Consumption (kg/year) 14 11 114 139
2019/20 Comparison with the previous year and the recent average
Production (000 tonnes)Previous year's production 120 - 1 877 1 997Previous five years' average production 41 - 1 510 1 5522019 production compared to average (%) 121 - 59 61
Import Requirements (000 tonnes)Previous year's imports 81 167 22 270Previous five years' average imports 140 175 363 6782019/20 Import requirements compared to average (%) 108 91 166 135
Note: Rice marketing year January/December of second year shown.
Additional Information
Population mid-2019 (000s): 14 645
Crop Calendar (*major foodcrop)
Maize*SorghumWheat
Lean period
SowingGrowingHarvesting
J F M A M J J A S O N D

Cereal supply and demand balances for sub-Saharan African countries as of March 2020
56
The Global Information and Early Warning System on Food and Agriculture (GIEWS) continuously monitors crop prospects and food security situation at global, regional, national and sub-national levels and warns of impending food difficulties and emergencies. Established in the wake of the world food crisis of the early 1970’s, GIEWS maintains a unique database on all aspects of food supply and demand for every country of the world. The System regularly provides policy makers and the international community with up-to-date information so that timely interventions can be planned and suffering avoided.
This report is based on information available as of March 2020.
Enquiries may be directed to:Global Information and Early Warning System on Food and Agriculture (GIEWS)Trade and Markets Division (EST)
Food and Agriculture Organization of the United Nations (FAO)Viale delle Terme di Caracalla00153 Rome, ItalyE-mail: [email protected]
The FAO/GIEWS Country Cereal Balance System (CCBS) is a database of annual supply and utilization balances for main cereals, covering all countries of the world. It has been maintained by FAO/GIEWS since 1980 and is updated on a continual basis.
This statistical report, which is a subset of CCBS data, presents the current year‘s cereal supply and demand balances for all sub-Saharan African countries.
This report is complementary to the FAO/GIEWS report Crop Prospects and Food Situation and is published four times a year, with the same schedule.
The Global Information and Early Warning System on Food and Agriculture (GIEWS) has set up a mailing list to disseminate its reports. To subscribe, submit the Registration Form on the following link:
http://newsletters.fao.org/k/Fao/trade_and_markets_english_giews_world
CA8841EN/1/04.20
ISBN 978-92-5-132530-8
9 7 8 9 2 5 1 3 2 5 3 0 8


![Cereal Food, Cereals and Cereal Products Processing IndustryNIIR]_Books-Cereal... · Profitable Agro Based Projects with Project Profiles (Cereal Food Technology) ... use. Cereals](https://img.pdfslide.us/doc/110x75/5ab66a817f8b9ab47e8dc8d4/cereal-food-cereals-and-cereal-products-processing-industry-niirbooks-cerealprofitable.jpg)